Embed Size (px)
Citation preview

Price Discovery In The Modern Bitcoin Market:Examining Lead-Lag Relationships Between The Bitcoin Spot
And Bitcoin Futures Market
By Matthew Hougan, Hong Kim, and Satyajeet Pal
Bitwise Asset Management
June 11, 2021

Table of Contents
I. Introduction
II. Data Sourcing
III. Analytical Framework: Two Approaches To Evaluating Price Discovery AndLead-Lag Relationships
IV. Information Share (IS) and Component Share (CS) Price Discovery Analysis
A. Academic OverviewB. Bitcoin Markets Literature ReviewC. Analytical MethodologyD. Results
V. Time-Shift Lead-Lag Analysis
A. Academic OverviewB. Bitcoin Markets Literature ReviewC. Analytical MethodologyD. Results
VI. Conclusion
Appendix A: Examining Lead-Lag Relationships Between The Unregulated BitcoinFutures Trading Platforms And The CME Bitcoin Futures Market
Appendix B: List Of IS/CS Price Discovery Analysis Monthly Results
Appendix C: List Of Time-Shift Lead-Lag Analysis Monthly Results

I. Introduction
In 2008, the online posting of a technical white paper—Bitcoin: A Peer-to-Peer Cash ElectronicCash System1—envisioned a new way to store and transfer value on the internet. In the ensuingyears, bitcoin has grown from a niche asset embraced by retail investors into an increasinglymainstream allocation held by a wide variety of market participants, from individual investors tofinancial advisors, hedge funds, corporations, institutions, endowments, insurance companies,and more. As of September 30, 2020, the end of this study, bitcoin was valued at $200 billion.2
As the market has grown, so too has the trading ecosystem that allows for the efficient transfer ofbitcoin from one market participant to another. This ecosystem today includes both large spottrading platforms (e.g., Coinbase3) and a large, regulated futures market run by the CME Group.4
This paper builds on a growing library of academic and practitioner research that aims todetermine whether price discovery in the bitcoin market primarily takes place on spot tradingplatforms or on the regulated CME bitcoin futures market. This paper extends the existingliterature in four primary ways:
1. Time Period: This paper uses available trade data on the CME bitcoin futures market,from its inception in December 2017 through the end of the study on September 30,2020.
2. Academic Survey: This paper includes a detailed survey of existing academic andpractitioner research, examining papers that have evaluated where price discovery occursbetween spot trading platforms and the regulated bitcoin futures market.
3. Diversity of Statistical Approaches: This paper takes a broad approach to its analysis,using two distinct and well-established statistical methods to evaluate the lead-lagrelationship between the spot and futures markets.
4. Data Quality and Replicability: This paper uses professionally developed data feeds inits analysis, as well as commonly available statistical software tools, so that the study canbe replicated by other researchers.
Using this multifaceted and replicable approach, the paper finds that the CME bitcoin futuresmarket leads the bitcoin spot market in a consistent and statistically significant manner.
4 Q3 2020 ADV of the CME bitcoin futures market was $365M. Source: CME Group.3 Q3 2020 ADV for Coinbase was $194M. Source: Coin Metrics.2 Bitcoin’s market cap as of September 30, 2020 was $200.75B. Source: Blockchain.com.1 https://bitcoin.org/bitcoin.pdf

II. Data Sourcing
Bitcoin trading platforms exist in multiple countries and operate under a variety of regulatoryregimes. There are generally no requirements for these platforms to provide data on their tradingactivity in a uniform fashion to a centralized database. As a result, there is no equivalent to theConsolidated Tape System in the U.S., which offers a single source of universally agreed-upontrading data for publicly traded equities in the U.S.
Over the years, however, a variety of private data providers have emerged that consolidatetrading data from large numbers of bitcoin trading platforms. In preparing to evaluate pricediscovery in the bitcoin markets, we engaged in a detailed survey of these data providers in May2020, evaluating them on metrics including data quality, trading platform coverage, cost, servicequality, and other corporate factors. The goal of this survey was to determine which provider orset of providers could supply the highest quality data.
We began by cataloging bitcoin data providers commonly referenced in the industry. We thensupplemented this list by conducting broad web searches to identify additional bitcoin dataproviders and by consulting a third-party survey titled, “The State of the Digital Asset Data andInfrastructure,” published by The Block on May 14, 2020.5
Aggregating these steps resulted in a total of 29 firms, 14 of which offered bitcoin tick data, thespecific type of data needed to conduct lead-lag analysis. We evaluated these 14 firms on fourseparate criteria:
● Data coverage: All else equal, more trading platforms are better than fewer.
● Data quality: Data gathered by third-party providers should match the actual activity that takes place on each trading platform, with as few errors as possible.
● Cost: The cost of licensing the data from a given provider should be reasonable.
● Corporate factors: Available facts should give confidence that the provider in question will continue to operate in a robust manner over a meaningful period of time.
Data quality was weighted heavily in the analysis, as it has a direct impact on the output of pricediscovery research. Still, the other three factors were important as well.
Based on this analysis, we elected to use Coin Metrics as the lead data provider for our analysis.
5https://www.tbstat.com/wp/uploads/2020/05/The-State-of-the-Digital-Asset-Data-and-Infrastructure-Landscape-1.pdf

At the time, Coin Metrics offered coverage of 26 exchanges, and had exceptionally high dataquality. For instance, in one portion of our analysis, we downloaded the full record of BTC/USDtrades (2,523,481 trades) directly from Bitfinex, a spot bitcoin trading platform, for the month ofMarch 2020. We compared these trades with data from participating data providers, looking forthree types of errors: duplicated trades, erroneous trades, and missing trades. Coin Metrics hadzero data errors, while its competitors had between two and 4,929 errors. We repeated thisanalysis using trades at Coinbase and LBank, two additional bitcoin trading platforms, and foundsimilar results.
To supplement Coin Metrics’ data, we evaluated data providers that covered a large number(>100) of crypto trading platforms. Of these providers, CoinAPI scored the best on our fourfactors, including scoring well on data quality. We elected to use CoinAPI data to supplementCoin Metrics data where necessary to conduct our analysis.
Using Coin Metrics and CoinAPI data, we focused our analysis on 10 bitcoin trading platforms:the five trading platforms that contribute to the price used to settle the CME CF BitcoinReference Rate6 (Bitstamp, Coinbase, Gemini, itBit, and Kraken), and five additional tradingplatforms with large reported trading volumes that do not contribute to the CME CF BitcoinReference Rate (Binance, Bitfinex, Huobi, LBank, and OKEx).
Data on CME bitcoin futures was taken directly from the CME Group.
6 The price used to settle bitcoin futures contracts on the CME.https://www.cmegroup.com/trading/cryptocurrency-indices/cf-bitcoin-reference-rate.html

III. Analytical Framework: Two Approaches To Evaluating Price Discovery And Lead-LagRelationships
We began this analysis by reviewing relevant academic and practitioner papers. This includedpapers broadly related to the topic of price discovery and lead-lag analysis in financial markets,and papers that specifically evaluated these concepts vis-à-vis the bitcoin spot market and theregulated bitcoin futures market.
This survey revealed two major categories of price discovery analysis in the general financialmarket literature:
i) Information Share (IS)/Component Share (CS) Price Discovery Analysis: Thistype of analysis is based on the principle that there is a common “efficient” price for anyasset being traded on multiple platforms. It allows you to construct a model of therelationship between different platforms by comparing their price series against thiscommon efficient price, and testing which price series is faster to incorporate newinformation. Markets that are faster to incorporate new information are considered tohave a “higher share” of price discovery; and
ii) Time-Shift Lead-Lag Analysis (TSLL): TSLL is a more intuitive approach toevaluating lead-lag relationships between markets. It involves taking two time series ofprice data and offsetting (or “shifting”) them against each other to determine what offset,or “lag,” produces the highest cross-correlation between the two series.
Both IS/CS price discovery analysis and TSLL have an extensive history in the financialliterature, and each comes with its own strengths and weaknesses.
We evaluate each approach separately in this paper and discuss the holistic result in ourconclusion.

IV. Information Share (IS) And Component Share (CS) Price Discovery Analysis
Information share (IS) and component share (CS) are two variants of a core analytical approachto price discovery research that traces its roots back to the 1990s. It is sometimes referred to inthe literature as “common efficient price”-based analysis, “fundamental price”-based analysis, orsimply “price discovery” analysis.
Price discovery analysis is based on the idea that, in a perfectly efficient market, new informationshould be reflected simultaneously in the price of an asset as it trades on different platforms. Inpractice, however, this is not the case; some platforms move before others. In addition, somemarket moves are simply noise that do not reflect a change in the fundamental price at all. Pricediscovery analysis attempts to measure the speed and accuracy with which each platformincorporates new information into its price. Platforms that are faster to incorporate newinformation while being better at avoiding noise are considered to have a “higher share” of pricediscovery.
Specific approaches to this type of price discovery analysis have evolved over time.
A. Academic Overview
In 1995, Hasbrouck7 proposed the information share (IS) metric, describing his new metric asmeasuring “‘who moves first’ in the process of price adjustment.” He used it to compare pricediscovery for equities on the New York Stock Exchange with those on regional stock exchanges.Hasbrouck’s work built on early advances of Garbade and Silber (1983),8 and is considered afoundational paper in price discovery research.
In the same year, Gonzalo and Granger (1995)9 discussed a method of modeling a common timeseries by composing each individual series based on its “component weight,” or contribution tothe common price. Gonzalo and Granger’s work was extended by many others, including Booth,So, and Tse (1999),10 Chu, Hsieh, and Tse (1999),11 and Harris, McInish, and Wood (2002).12 It
12 Harris F., McInish T., Wood R. (2002). Security price adjustment across exchanges: An investigation of commonfactor components for Dow stocks. Journal of Financial Markets, 5(3), 277-308.
11 Chu QC, Hsieh WG, Tse Y (1999). Price discovery on the S&P 500 index markets: An analysis of spot index,index futures and SPDRs. International Review of Financial Analysis, 8(1), 21-34.
10 Booth G., So R., Tse Y. (1999). Price discovery in the German equity index derivatives markets. Journal ofFutures Markets, 19(6), 619-643.
9 Gonzalo, J., and Granger, C. (1995). Estimation of common long-memory components in cointegrated systems.Journal of Business & Economic Statistics, 13(1), 27-35.
8 Garbade, K.D., and Silber, W.L. (1983). Price movements and price discovery in futures and cashmarkets, Review of Economics and Statistics 65(2), 289-297.
7 Hasbrouck, J. (1995). One security, many markets: Determining the contributions to price discovery.The Journal of Finance, 50(4), 1175-1199.

was labeled with the name Component Share (CS) by Yan and Zivot (2010).13
It is fairly standard in academic analyses of price discovery to present both IS and CS statistics,since they have slightly different statistical characteristics. We have followed that standard in ourown analysis.
Importantly, as the name suggests, IS and CS are presented as “shares” in the literature. Whencomparing two markets, the IS (CS) assigned to the two markets must sum to 100%. A market isconsidered to lead price discovery if it has a majority share (>50%) of IS (CS).
Despite the paired nature of IS (CS) values, the convention in the literature is to present only onevalue in the results tables, leaving the other implied. For instance, a paper examining pricediscovery between Market A and Market B would only report the IS (CS) share of Market A.
We have followed that convention, only reporting the IS (CS) value of the CME bitcoin futuresmarket, as it is compared to each spot bitcoin trading platform. Therefore, in this document, anIS (CS) value above 50% indicates that the CME bitcoin futures market leads price discoverycompared with the bitcoin spot trading platform in question.
B. Bitcoin Markets Literature Review
We conducted a broad literature survey and identified 10 academic and practitioner studies thatuse IS and/or CS to compare the bitcoin spot market with the CME bitcoin futures market. Thesepapers and core findings are summarized in the table below (a single long horizontal table hasbeen divided here into two parts).
# Title Year Authors
1 Bitcoin futures—What use are they? 2018 Corbet, Lucey, et al.
2 Price discovery in bitcoin spot or futures? 2019 Baur and Dimpfl
3An analysis of price discovery between bitcoin futures and spotmarkets 2019 Kapar and Olmo
4 Price discovery, high-frequency trading and jumps in bitcoin markets 2019 Alexander and Heck
5What role do futures markets play in bitcoin pricing? Causality,cointegration and price discovery from a time-varying perspective 2019 Hu, Hou, and Oxley
6The development of bitcoin futures: Exploring the interactionsbetween cryptocurrency derivatives 2019 Akyildirim, Corbet, et al.
7 Price discovery in bitcoin futures 2020 Fassas, Papadamou, and Koulis
13 Yan, B., and Zivot, E. (2010). A structural analysis of price discovery measures. Journal of Financial Markets,13(1) 1-19.

8 The determinants of price discovery on bitcoin markets 2020 Entrop, Frijns, and Seruset
9 Bitcoin spot and futures market microstructure 2020 Aleti and Mizrach
10 Efficient price discovery in the bitcoin markets 2020 Chang, Herrmann, and Cai
# Authors CME IS CME CS Intervals Time Period Result
1 Corbet, Lucey, et al. 15% 18% 1 min -- Spot leads
2 Baur and Dimpfl 14% 14% 15 min12/18/2017 -10/18/2018 Spot leads
3 Kapar and Olmo 89% -- 1 day12/18/2017 -05/16/2018 Futures lead
4 Alexander and Heck 66% 73% 30 min12/18/2017 -06/30/2019 Futures lead
5 Hu, Hou, and Oxley 55% -- 1 day12/18/2017 -06/16/2019 Futures lead
6 Akyildirim, Corbet, et al. 91-97% 67-87% 1/5/10/15/30/60 min12/18/2017 -02/26/2018 Futures lead
7Fassas, Papadamou, andKoulis 97% 77% 1 hour
01/01/2018 -12/31/2018 Futures lead
8 Entrop, Frijns, and Seruset 50% 53% 1 min12/18/2017 -03/31/2019 Mixed
9 Aleti and Mizrach 53-55% 68-91% 5 min01/02/2019 -02/28/2019 Futures lead
10 Chang, Herrmann, and Cai -- 63% 1 min07/01/2019 -12/31/2019 Futures lead
As the table indicates, a majority of papers support the notion that the CME bitcoin futuresmarket leads price discovery using IS and/or CS when compared to the bitcoin spot market.
Because the methodologies and findings of each paper are nuanced, it is worth examining eachpaper in detail.
We begin with papers aligned with the majority opinion that the CME bitcoin futures marketleads the bitcoin spot market:

● Kapar and Olmo (2019)14 was the first paper to assert that, contrary to the two studies thatcame before it (Corbet et al. (2018)15 and Baur and Dimpfl (2019)16), the data “clearlyreflect the leadership of the Bitcoin futures markets with respect to the spot market.” Thepaper attributed 89% of IS to the futures market.
Kapar and Olmo (2019) relies on daily price data, which means the study may not captureintraday information flow. Still, long-run relationships are relevant in holisticallydescribing the relative strength one market has compared with another.
The authors illustrated the importance of long-run relationships, saying, “when themarket is in contango we can expect increases in the spot price in the next period. Incontrast, when the market is in backwardation, the VECM suggests a fall in spot prices tocorrect departures from equilibrium.” In other words, the authors found that if there is agap between the spot and futures price on a given day, the spot price is more likely tocorrect toward the futures price than vice versa.
● Alexander and Heck (2019)17 similarly found that there was “strong evidence that bothCME and CBOE futures have played the leading role in price discovery.” Unlike Kaparand Olmo (2019), Alexander and Heck (2019) used intraday data with a 30-minute timinginterval. Their analysis ran from December 18, 2017 to June 30, 2019, the longest timeperiod among the 10 studies we discovered. It showed that the CME bitcoin futuresmarket led the bitcoin spot market with 66% of IS and 73% of CS during that time.
Interestingly, the authors noted strong price leadership from CME futures during Q22019, the last quarter they studied. In fact, Q2 2019 boosted the overall IS from the studyfrom 57% to 66%, and CS from 50% to 73%. This increase in the CME’s contribution toprice discovery aligned with significant growth in volume on the CME bitcoin futuresmarket after Q1 2019.18
18 The monthly ADV in the CME Bitcoin Futures Market grew from $60 million in March 2019 to $230 million inApril 2019, according to data from the CME Group. In Q3 2020, the CME Bitcoin Futures market had a $365million ADV.
17 Alexander, C., and Heck, D. (2019) Price Discovery, High-Frequency Trading and Jumps in Bitcoin Markets.SSRN Electronic Journal. https://doi.org/10.2139/ssrn.3383147.
16 Baur, D.G., and Dimpfl, T. (2019) Price discovery in bitcoin spot or futures? Journal of Futures Markets (39)7,803-817.
15 Corbet, S., Lucey, B., Peat, M., and Vigne, S. (2018) Bitcoin futures—What use are they? Economics Letters(172), 23-27.
14 Kapar, B., and Olmo, J. (2019) An analysis of price discovery between Bitcoin futures and spot markets.Economics Letters (174), 62-64.

Of note, Alexander and Heck published a second paper, in 2020, titled “Price discoveryin bitcoin: The impact of unregulated markets”19 where the authors highlight the roleunregulated futures and perpetual swaps from trading platforms such as Bitmex, Huobi,and OKEx play in the bitcoin market. The analysis involves a complex, multidimensionalapproach to price discovery analysis conducted across eight different markets and fourdifferent exposure types (unregulated futures, regulated futures, perpetual swaps, and spotmarkets), each with different levels of microstructure friction and data integrity. Thesecomplications make it difficult to draw a direct comparison of this paper’s results withthe 10 studies included in the table above.
The direct question around whether the CME bitcoin futures market leads or lags pricediscovery compared to unregulated bitcoin futures trading platforms is explored in detailin Appendix A.
● Hu et al. (2020)20 added to the literature, saying, “What we contribute to this literaturehere, especially compared to Alexander & Heck (2019), is that we consider pricediscovery in the Bitcoin futures markets that allow for time-varying approaches,” notingthat cointegrating relationships can be interrogated more comprehensively usingtime-varying approaches.
The authors conclude that, “Bitcoin futures markets dominate the price discovery processusing a time-varying version of an information share measure of both the IS and GIStypes.” This finding provides additional clarity around the time-dependency of other pricediscovery analytical results.
● Akyildirim, Corbet, et al. (2019)21 conducted its analysis in 5-, 10-, 15-, 30-, and 60-minprice data intervals to reach a range of IS and CS outcomes in order to test robustnessacross different data time intervals. The finding that the CME bitcoin futures market ledthe bitcoin spot market was consistent across all studied intervals.
● Fassas et al. (2020)22 added another record to the body of literature, finding that CMEfutures lead the bitcoin spot market, saying, “Our study confirms [the] Akyildirim et al.(2019), Alexander et al. (2019) and Kapar and Olmo (2019) conclusion that bitcoinfutures markets, while in their relative youth, have portrayed evidence of price discoveryleadership compared to the spot market.” Fassas et al. (2020) arrives at this conclusion
22 Fassas et al. (2020) Price discovery in bitcoin futures. Research in International Business and Finance (52).
21 Akyildirim, Corbet, et al. (2020). The development of bitcoin futures: Exploring the interactions betweencryptocurrency derivatives. Finance Research Letters (34).
20 Hu et al. (2020) What role do futures markets play in bitcoin pricing? Causality, cointegration and price discoveryfrom a time-varying perspective. International Review of Financial Analysis (72).
19 Alexander, C., and Heck, D. (2020). Price Discovery in Bitcoin: The Impact of Unregulated Markets. Journal ofFinancial Stability (50), Article Number 100776.

after applying price discovery measures to the entire year of 2018 with hourly price data.
● Aleti and Mizrach (2020)23 explore the market microstructure of four spot tradingplatforms (Bitstamp, Coinbase, Kraken, and itBit) and the CME bitcoin futures marketover a relatively narrow two-month time period (January 2, 2019 to February 28, 2019).The paper reports separate CME IS values for each of the four spot trading platforms,ranging from 53% versus itBit to 55% versus Bitstamp, and four CME CS values rangingfrom 68% versus itBit to 91% versus Kraken. All of these tests find that the CME futuresled price discovery against each of the spot trading platforms.
● Chang et al. (2020)24 explored a more recent time period (the “second half of 2019”) andfound that CME futures led the spot market in price discovery with a CS of 63%.
Of course, we should address the three studies where the authors noted that the spot market ledthe CME futures market or had mixed results:
● Corbet et al. (2018) is the earliest study examining whether the futures or spot market ledin the bitcoin marketplace. It reached the conclusion that the spot market led, with IS andCS values assigned to the futures market of just 15% and 18%, respectively. The timeperiod of the price discovery analysis is not clear from the paper, and it is possible that,being the earliest paper, the period was very short. Akyildirim, Corbet, et al. (2019), astudy that shares the same co-author (Corbet) but examines different data sets, arrived atthe opposite conclusion, as noted above, determining that the futures market had thedominant share of price discovery. Discussing the difference between the two papers,Akyildirim, Corbet, et al. (2019) notes that Corbet et al. (2018) was based on a shortertime period, and for that reason, could have found a relationship that has since reversed.25
● Baur and Dimpfl (2019) is the other study that found the bitcoin spot markets led thebitcoin futures market. This paper, however, has an important methodological flaw thatled the the CME futures contribution to appear artificially low: The authors conductedtheir price discovery analysis on a per-lifetime-of-each-contract basis, rather than astandard rolling-contract basis.
25 Akyildirim, Corbet, et al. (2019) notes that “in contrast to results based on a shorter period as in Corbet et al.(2018a), it appears that as the new cryptocurrency futures markets developed, they presented substantial leadershipin price discovery over spot Bitcoin markets.” The view is repeated in the conclusion, which says, “while earlierresearch found that information flows and price discovery were transmitted from spot to futures markets, thisresearch verifies that this relationship has since reversed, most likely explained by the influx of institutional andsophisticated investors.”
24 Chang et al. (2020) Efficient price discovery in the bitcoin markets. Wilshire Phoenix.
23 Aleti, S., and Mizrach, B. (2021) Bitcoin spot and futures market microstructure. Journal of Futures Markets(41)2, 194-225.

Alexander and Heck (2019) explore this issue extensively, going as far as running asimilar per-lifetime-of-each-contract analysis to observe how much lower the futuresmarket contribution can appear, and concluded that, “This apparently leading role of thespot market is not surprising since, during the first few months after the introduction of acontract, there is always another contract with a nearer maturity where almost all tradingactivity occurs. So any finding that the spot market dominates the price discovery processis merely an artefact of very low trading volumes when the contract is first issued.”
Baur and Dimpfl (2019) acknowledge this issue in their own paper, and run arolling-futures model of the same analysis for contracts traded on the Cboe, using a fairlystandard methodology where the studied contract is rolled over one day prior to maturity.This led to a significantly higher share of price discovery for the Cboe contract, albeit onethat still did not dominate the bitcoin spot market. Unfortunately, the authors were notable to do the same analysis for CME futures, noting that the continuous price dataapproach was “only feasible for the CBOE futures as there are short gaps in our CMEdata.”
It is not clear why such data gaps existed, as CME data is readily available. Additionally,it is not appropriate to assume that, if the authors had studied a rolling-futures version ofthe CME analysis, the result would also have aligned with the findings of therolling-futures version of the Cboe analysis. There were fewer CME bitcoin futurescontracts in the data set than in the Cboe data set (four versus seven), and each of theCME contracts had a longer lifetime (or “Sample Period,” as shown in Table 1 of thepaper), likely leading to a stronger bias from this methodological flaw.
Therefore, this paper does not actually address the question at hand: whether the CMEbitcoin futures market (as a whole) leads price discovery versus the bitcoin spot market.
● Entrop et al. (2020)26 arrives at a mixed result. In aggregate, the paper finds that the CMEleads, noting that the futures exchange has an average IS value of 50% and average CSvalue of 53%. The paper also finds that the CME led price discovery in a majority ofmonths studied, noting, “We find that, on average, the futures market leads the priceformation process in 9 (contract) months, while the spot market is the leader in theremaining (6) months.”
The paper, however, does note that the spot market led the CME market in a statisticallysignificant way in the last two months of the study (February and March 2019), and innonsignificant ways in select other months. These findings led the authors to the claim
26 Entrop, O., Frijns B., Seruset, M. (2020) The determinants of price discovery on bitcoin markets, The Journal ofFutures Markets, (40)5, 816-837.

that “the leading market has changed.”
It is worth noting that Aleti et al. (2020) and Alexander and Heck (2019) explored pricediscovery in overlapping time periods and reached a different conclusion.
In summary, the majority of academic and practitioner papers support the view that the CMEbitcoin futures market leads price discovery as compared with the bitcoin spot market. Of the 10papers available in the literature, seven clearly find that the CME leads, and an eighth (Entrop etal. (2020)) has aggregate results in favor of CME leading. Of the two papers that conclude thatthe spot market leads, one was an early paper that potentially studied a very limited time period(Corbet et al. (2018)) and the other (Baur and Dimpfl (2019)) has an important methodologicalflaw that limits its applicability to the question at hand.
C. Analytical Methodology
We looked to extend and expand upon the academic literature by conducting a broad analysis ofIS/CS price discovery between the CME bitcoin futures market and 10 bitcoin spot tradingplatforms, including all five trading platforms that contribute prices to the CME CF BitcoinReference Rate and five additional trading platforms with significant reported trading volume.
These 10 spot trading platforms were:
● Binance● Bitfinex● Bitstamp● Coinbase● Gemini● Huobi● itBit● Kraken● LBank● OKEx
We used available trade data, from the inception of the CME bitcoin futures contract onDecember 18, 2017 through the end of the study on September 30, 2020. Data on spot tradingplatforms was downloaded from Coin Metrics and CoinAPI.27 Data on CME bitcoin futures wasacquired directly from the CME Group.
27 Coin Metrics data was used as the primary data source for all 10 spot trading platforms. CoinAPI data was usedonly to extend the time period back to December 18, 2017 for four trading platforms (Gemini, Huobi, itBit, andOKEx) that Coin Metrics did not have full time period coverage for.

We ran our IS/CS analysis using “pdshare,”28 a publicly available software package written in theprogramming language R, that includes an implementation of IS and CS based on Hasbrouck(1995) and Gonzalo and Granger (1995). We chose to use a publicly available software packageto increase the replicability of our research.
We took the following steps to run our analysis:
● Remove trades during non-CME trading hours. This includes removing holidays andweekends.
● For each pair of spot trading platform and CME bitcoin futures, align the price series into1-second intervals where both platforms have a trade, taking the last traded price of theinterval.
● Run pdshare’s IS/CS analysis on each pair of price series, outputting an IS and CS valuefor each spot platform/futures pair for each day (i.e., the CME bitcoin futures market’spercentage share of IS or CS versus the given spot trading platform for each day).
● Average the daily IS/CS values across the time periods, while running statisticalsignificance tests with a 95% confidence interval.
D. Results
The results of our analysis align with the majority of academic and practitioner research infinding that the CME bitcoin futures market leads all evaluated bitcoin spot trading platformsover the duration of the study. These results are statistically significant for all 10 tradingplatforms when evaluated from both an IS and a CS perspective.
Here, we present the results in both full time period and monthly formats. The full time periodresults are commonly how results are presented in academic literature. However, shorter timeperiods such as the monthly results may be more appropriate given the potential for timevariation in the cryptomarket.
Full Period Analysis
The table below shows the IS and CS for the CME versus each of the 10 spot trading platformsaveraged across the entire time period of this study (December 18, 2017 to September 30, 2020),along with a 95% confidence interval for those results. The * indicates that the results arestatistically significant (p-value < 0.05). Note that all of the IS and CS values and theirconfidence intervals are above the 50% mark, indicating that CME led all of the 10 spot tradingplatforms across this time period.
28 https://rdrr.io/rforge/ifrogs/man/pdshare.html. More details about the implementation including validation ofaccuracy can be found here: https://rdrr.io/rforge/ifrogs/f/inst/doc/pdshare.pdf.

CME IS Confidence Interval CME CS Confidence Interval
Binance 58.32%* 56.78% - 59.86% 57.38%* 55.45% - 59.32%
Bitfinex 65.75%* 64.22% - 67.29% 65.08%* 63.28% - 66.89%
Bitstamp 64.10%* 62.74% - 65.47% 68.03%* 66.21% - 69.86%
Coinbase 60.60%* 59.20% - 62.00% 60.88%* 58.99% - 62.77%
Gemini 56.44%* 55.03% - 57.84% 56.73%* 54.73% - 58.72%
Huobi 60.91%* 59.34% - 62.49% 58.97%* 56.96% - 60.98%
itBit 53.33%* 51.91% - 54.75% 52.97%* 50.93% - 55.00%
Kraken 63.17%* 61.58% - 64.76% 63.24%* 61.29% - 65.19%
LBank 66.03%* 63.95% - 68.11% 63.51%* 61.34% - 65.68%
OKEx 56.19%* 54.74% - 57.64% 53.60%* 51.73% - 55.47%
Monthly Period Analysis
To provide additional context to this finding, we also examined each market on acalendar-month-by-calendar-month basis, as discussed. This calendar-month-segmentedapproach allows us to evaluate the potential for time variation in price discovery leadershipbetween the CME bitcoin futures market and the bitcoin spot market over shorter periods.
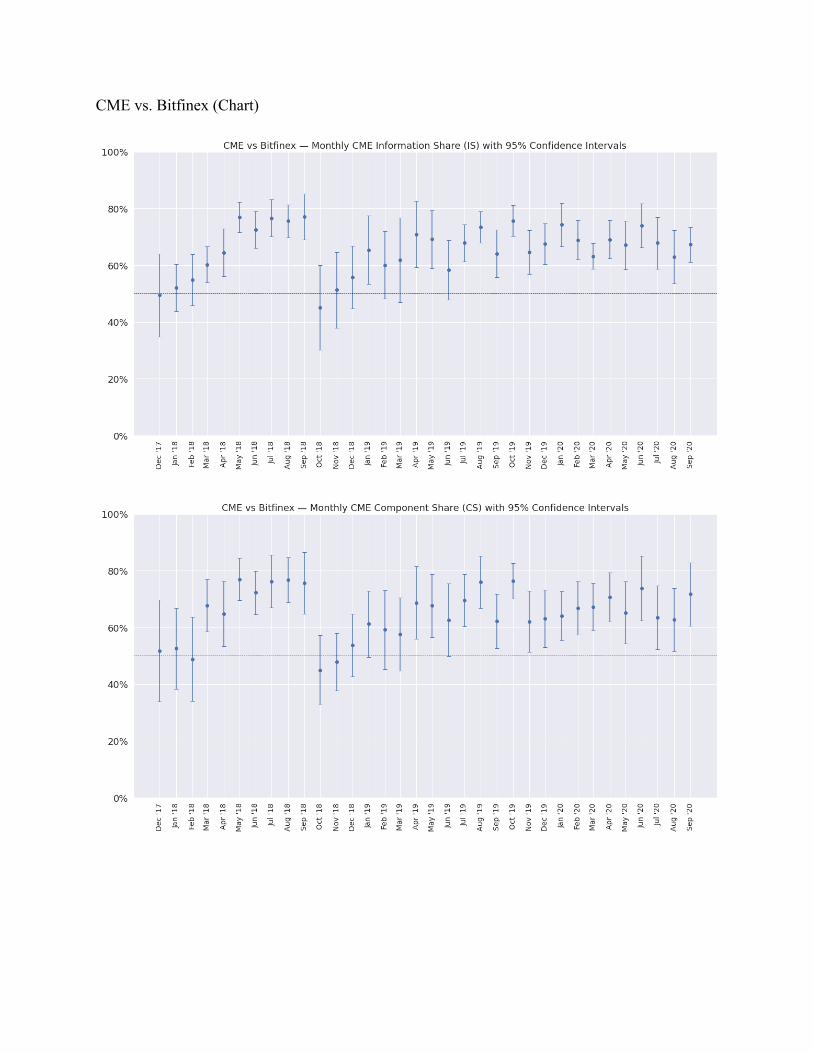
The charts below present this month-by-month data in a graphical format for the CME-Coinbasepair, as one example of the output of this analysis. For each month, the large dot represents themidpoint finding of the analysis (averaged across the findings for each day of the month), orwhat the literature would generally refer to as the CME’s IS or CS value for a given time period(in this case, a month). The confidence bars capture the values contained within a 95%confidence interval.
The results show that the CME has led price discovery versus Coinbase in 31 of 34 monthsstudied (91% of all months) from an IS perspective, and in 29 of 34 months studied (85% of allmonths) from a CS perspective. The wider confidence intervals versus the full-duration analysisis a matter of statistical power: Monthly analysis incorporates significantly fewer data pointsthan longer periods, and therefore has lower levels of statistical strength. It is worth noting thatthe month of December 2017 only has nine trading days worth of data, since the CME bitcoinfutures market launched on December 18, 2017.

As one would expect, each trading platform generates a slightly different profile and has slightlydifferent results. For instance, the CME versus Binance pair shows that CME led price discoveryin 29 of 34 months studied (85% of all months) from an IS perspective, and 27 of 34 monthsstudied (79% of all months) from a CS perspective.

The table below displays the percentage of months that the CME has led price discovery versuseach of the 10 evaluated spot trading platforms since the launch of the CME bitcoin futurescontract in December 2017. The exact numbers vary by exchange, but on average, CME has ledspot trading platforms from an IS perspective in 90% of evaluated months, and from a CSperspective in 81% of evaluated months. Month-by-month IS and CS charts are available for

each of the 10 trading platforms versus the CME in Appendix B.
% of Months CME Led IS % of Months CME Led CS
Binance 85% 79%
Bitfinex 94% 91%
Bitstamp 94% 91%
Coinbase 91% 85%
Gemini 82% 76%
Huobi 94% 84%
itBit 79% 62%
Kraken 94% 91%
LBank 90% 80%
OKEX 85% 65%
Average 89% 80%
Taken together, these findings support the notion that the CME leads price discovery comparedwith the bitcoin spot market, and that leadership is generally persistent across the full timeperiod.

V. Time-Shift Lead-Lag Analysis
The other popular academic approach to investigating market leadership is time-shift lead-laganalysis (TSLL). Time-shift lead-lag analysis is an attempt to find the direction and length of thelead-lag relationship between two price series that maximizes the predictive strength of one priceseries against another.
The analysis is performed by shifting one price series forward or backward in time relative toanother series and calculating the cross-correlation between the two series. This shifting isrepeated for many different lag periods to see which amount of lag of one price series results inthe highest cross-correlation between the two price series. The amount of lead or lag that resultsin the highest cross-correlation is referred to as “lead-lag time” in the literature.
A. Academic Overview
The literature on how to conduct lead-lag analysis has evolved over time. Initially,cross-correlations were calculated based on time series with price observations made at specificintervals. This is called the “synchronous” approach. Later, a “non-synchronous” approach wasdeveloped. The non-synchronous approach does not use fixed sampling intervals; rather, it usesall tick-by-tick price observations from each time series without matching up intervals in atime-rigid fashion.
Early research using time-shift lead-lag analysis, such as de Jong and Nijman (1997),29 describedthe synchronous approach, using fixed sampling intervals (such as one price every 10 minutes).The paper was one of the first to extensively explore lead-lag relationships between financialmarkets by calculating synchronous cross-correlations on leads and lags of different time series.It focused on the relationship between the S&P 500 Index and S&P 500 futures. The paperdetermined that, at all chosen intervals (10 minutes, 5 minutes, and 1 minute), futures returns ledindex returns.
The non-synchronous approach was proposed in Hayashi and Yoshida (2005)30 to addressconcerns that “the choice of regular interval size and data interpolation scheme (in thesynchronous approach) may lead to unreliable estimation … and bias… .” Hayashi-Yoshida hasbecome the dominant (but not exclusive) paradigm for conducting this type of analysis.
30 Hayashi, T., and Yoshida, N. (2005) On covariance estimation of non-synchronously observed diffusion processes.Bernoulli 11(2), 359-379.
29 de Jong, F., and Nijman, T. (1997) High frequency analysis of lead-lag relationships between financial markets.Journal of Empirical Finance (4)2-3, 259-277.

Hoffmann, Rosenbaum, and Yoshida (2013)31 extended the Hayashi-Yoshida cross-correlationfunction by describing how to apply it to leads and lags of one time series against another todetermine the lead-lag time between the two time series.
Alsayed and McGroarty (2014)32 applied the Hayashi-Yoshida cross-correlation function toidentify lead-lag relationships between S&P 500, FTSE 100, and DAX futures contracts. Theyalso confirmed that the non-synchronous approach was more robust in avoiding data errorscompared with the synchronous approach.
B. Bitcoin Markets Literature Review
Schei (2019)33 applied the Hayashi-Yoshida cross-correlation function to determine the lead-lagrelationship between various spot trading platforms. Schei looked at trades on Binance, Bitfinex,Bitstamp, Coinbase, HitBTC, Poloniex, and Kraken during 2018. He found that low-volumeexchanges (Poloniex and Kraken) tended to lag higher-volume exchanges (Bitfinex, Binance,Bitstamp, and Coinbase). Schei also found that similar volume exchanges showed weakerlead-lag relationships, such as between Bitstamp and Bitfinex.
Schei did not evaluate the lead-lag relationship between the bitcoin spot and bitcoin futuresmarkets. In fact, while the TSLL technique has been used to compare spot and futuresrelationships in multiple asset classes, as discussed above, this study is the first to apply thistechnique to the bitcoin spot and bitcoin futures markets.
C. Analytical Methodology
We analyzed the TSLL relationship between the CME bitcoin futures market and the same 10bitcoin spot trading platforms we evaluated using IS/CS price discovery analysis, including allfive trading platforms that contribute prices to the CME CF Bitcoin Reference Rate and fiveadditional trading platforms with significant reported trading volume.
We used available trade data from the inception of the CME bitcoin futures contract onDecember 18, 2017 through the end of the study on September 30, 2020. Data on spot trading
33 Schei, B. (2019) High frequency lead-lag relationships in the bitcoin market (unpublished master’s thesis).Copenhagen Business School, Copenhagen, Denmark.
32 Alsayed, H., and McGroarty, F. (2014) Ultra‐high‐frequency algorithmic arbitrage across international indexfutures. Journal of Forecasting, 33(6), 391-408.
31 Hoffmann, M., Rosenbaum, M., Yoshida, N. (2013) Estimation of the lead-lag parameter from non-synchronousdata. Bernoulli, 19(2), 426-461.

platforms were downloaded from Coin Metrics and CoinAPI.34 Data on CME bitcoin futures wasacquired directly from the CME Group.
We ran our TSLL analysis using “lead-lag,”35 a publicly available open source implementation ofTSLL written in the programming language Python based on Hoffmann, Rosenbaum, andYoshida (2013).
We took the following steps to run our analysis:
● Remove trades during non-CME trading days. This includes removing holidays andweekends.
● Remove zero-return trades (trades with the same price as the previous trade) from theprice series, consistent with the procedure used by Huth and Abergel (2014)36 andAlysayed and McGroarty (2014).
● For each pair of spot trading platform and CME bitcoin futures, run TSLL analysis foreach day, shifting the lag time from -60 seconds to +60 seconds in 0.2 second increments.Find the lead-lag time (LLT) that produces the highest cross-correlation.
● Average the daily lead-lag time across the full time period, while running statisticalsignificance tests with a 95% confidence interval.
D. Results
The results of our TSLL analysis align with the results of our IS/CS analysis and demonstratethat the CME bitcoin futures market leads all evaluated spot trading platforms over the durationof the study.
Here, again, we present the results in both full time period and monthly formats. The full timeperiod results are commonly how results are presented in academic literature. However, shortertime periods such as the monthly results may be more appropriate given the potential for timevariation in the cryptomarket.
Full Period Analysis
The table below shows the lead-lag time (the amount of lead or lag that results in the highestcross-correlation between two price series) for the CME versus each of the 10 spot tradingplatforms, calculated daily, and averaged across the entire time period of this study (December
36 Huth, N., and Abergel, F. (2014) High frequency lead/lag relationships: Empirical facts. Journal of EmpiricalFinance (26), 41-58.
35 https://github.com/philipperemy/lead-lag.
34 Coin Metrics data was used primarily for all 10 spot trading platforms. CoinAPI data was used only to extend thetime period back to December 18, 2017 for four trading platforms (Gemini, Huobi, itBit, and OKEx) that CoinMetrics did not have full time period coverage for.

18, 2017 to September 30, 2020). It also shows the 95% confidence interval for those results. Apositive value indicates the CME leading by that amount of seconds. A negative value wouldindicate CME lagging. The * indicates the result being statistically significant (p-value < 0.05),meaning the lead-lag time for the entire time period lies squarely within the positive (ornegative) value territory.
Lead-Lag Time (seconds) Confidence Interval (seconds)
Binance 7.28* 6.53 - 8.03
Bitfinex 9.03* 8.33 - 9.73
Bitstamp 6.52* 5.96 - 7.08
Coinbase 8.42* 7.65 - 9.18
Gemini 6.51* 5.91 - 7.11
Huobi 7.57* 6.96 - 8.18
itBit 8.63* 7.89 - 9.37
Kraken 17.19* 16.00 - 18.38
LBank 16.62* 15.37 - 17.87
OKEx 8.27* 7.41 - 9.13
The lead-lag times vary slightly by platform, but are all contained within a positive value band of6.51 - 17.19 seconds, indicating CME leading. All results are statistically significant.
Monthly Period Analysis
To provide additional context to this finding, we also examined each market on acalendar-month-by-calendar-month basis, as we did with our IS/CS analysis. Thiscalendar-month-segmented approach allows us to evaluate the potential for time variation inprice leadership between the CME bitcoin futures market and the bitcoin spot market overshorter periods, using the TSLL approach.
The chart below presents this month-by-month data in a graphical format for the CME-Coinbasepair, as one example of the output of this analysis. For each month, the dot represents themidpoint finding of the analysis (averaged across the findings for each day of the month), orwhat literature would generally refer to as the lead-lag time value for a given time period. Theconfidence bars capture the values contained within a 95% confidence interval.
The results show that the CME led Coinbase from a TSLL perspective in all 34 of the 34 monthsstudied (100% of all months). Additionally, the results were statistically significant for all 34 of34 months studied (100% of all months).

The chart displays a notable pattern, which is repeated in other trading platform pairs: TheCME’s “lead” versus Coinbase starts out long, with wide confidence bands, and then tightensover time and becomes more consistent.
For instance, the average monthly lead-lag time for CME versus Coinbase from December 2017through March 2019 is 15.18 seconds, and the confidence interval span is from 2.84 seconds to26.87 seconds. By comparison, from April 2019 through September 2020, the average monthlylead-lag time is 2.94 seconds, and the confidence interval span is from 0.27 seconds to 4.85seconds.
As one would expect, each trading platform generates a slightly different profile and has slightlydifferent results. For instance, the CME versus Binance pair also shows the CME has led pricediscovery in all 34 of 34 months studied (100% of all months), but with different exact leadtimes. The result is statistically significant in 30 of 34 months studied (88% of all months).
The results show the same general trend as the CME versus Coinbase pair, although in a moremuted fashion: starting wide, with the relationship tightening and becoming more consistent overtime.

Month-by-month TSLL analysis results for the remaining eight evaluated spot trading platformsare available in Appendix C. They share Coinbase’s and Binance’s results in that the CME leadsconsistently across an overwhelming majority of months.
Taken together, the results of our TSLL analysis support the conclusion of our IS/CS analysis,showing that the CME bitcoin futures market leads each of the 10 evaluated spot tradingplatforms in a statistically significant manner over the duration of the study.

VI. Conclusion
This study extends and improves upon prior literature by conducting a detailed survey andanalysis of academic and practitioner papers in the space, running a validation of the data feeds,incorporating a longer period of time, and using multiple statistical techniques to evaluate therelationship between the CME bitcoin futures market and the bitcoin spot market.
The results show that the CME bitcoin futures market leads the bitcoin spot market in asignificant fashion:
1. Academic and Practitioner Literature: The majority of academic and practitionerstudies conclude that the CME bitcoin futures market leads the bitcoin spot market.
2. IS/CS Price Discovery Analysis: The CME bitcoin futures market has the dominantshare of price discovery when compared with each of the 10 evaluated bitcoin spottrading platforms using both information share (IS) and component share (CS).
3. TSLL Analysis : The CME bitcoin futures market has led each of the 10 evaluatedbitcoin spot trading platforms using time-shift lead-lag analysis over the duration of thestudy.
We therefore conclude that the CME bitcoin futures market is the dominant source of pricediscovery when compared with the bitcoin spot market, and that prices on the CME bitcoinfutures market lead prices on bitcoin spot markets.
These findings are, perhaps, unsurprising. Futures markets often lead price discovery whencompared to spot markets. As described in papers like Garbade and Silver (1983),37 Chan(1992),38 and Fleming et al. (1996),39 futures benefit from leverage, lower transaction costs, andaccess to short exposure. In addition, in the bitcoin market, the regulated nature of the CMEbitcoin futures market may attract more professional investors than unregulated spot markets.These professional investors may have advantages over retail investors from an available capital,technology, information flow, and trading speed perspective. Such conditions may be expected tocontinue into the future, particularly as we see continued and expanded adoption of bitcoin as aninvestable asset by professional and institutional investors.
39 Fleming et al. (1996). Trading costs and the relative rates of price discovery in stock, futures, and option markets.Journal of Futures Markets 16(4), 353-387.
38 Chan, K. (1992). A further analysis of the lead-lag relationship between the cash market and stockindex futures market. The Review of Financial Studies (5)1, 123-152.
37 Garbade, K. and Silber, W. (1983). Price movements and price discovery in futures and cash markets.The Review of Economics and Statistics 65(2), 289-297.

Appendix A. Examining Lead-Lag Relationships Between The Unregulated Bitcoin FuturesTrading Platforms And The CME Bitcoin Futures Market
Introduction
Investors and traders have multiple ways of accessing the bitcoin market, including spot tradingplatforms like Coinbase, regulated futures markets like the CME bitcoin futures market, andunregulated futures trading platforms like BitMEX.
In the main body of this paper, we demonstrated that the regulated CME bitcoin futures marketleads price discovery compared to the largest bitcoin spot trading platforms. In this Appendix,we turn our attention to unregulated bitcoin futures trading platforms, and determine where pricediscovery occurs between those platforms and the CME.
Getting Started: The Selection of Unregulated Futures Trading Platforms And ContractsFor Analysis
The goal of our analysis was to determine whether price discovery on the CME bitcoin futuresmarket leads or lags relative to unregulated bitcoin futures trading platforms. We began ouranalysis by gathering general market data on unregulated futures trading platforms fromCoinGecko, a popular crypto data provider that maintains an extensive list of unregulated bitcoinfutures trading platforms and their futures contracts40.
The site tracks two categories of contracts: perpetual futures and quarterly futures. Perpetualfutures are cash-settled futures that do not have an expiration date, while quarterly futures settleon a calendar basis and must be rolled forward to maintain exposure. Aggregating these twocategories generated a list of 33 unregulated bitcoin futures trading platforms. We elected toevaluate the seven largest markets, which accounted for approximately 80% of all open interestand included the most recognized names in the unregulated bitcoin futures market: Binance,BitMEX, Bybit, Deribit, FTX, Huobi, and OKEx.41
Because some platforms offer both perpetual and quarterly contracts, on each platform, weselected the contract type with the highest level of open interest: Perpetuals for Binance,BitMEX, Bybit, Deribit, and FTX, and quarterlies for Huobi and OKEx.
We pulled data on these contracts from CoinMetrics and CoinAPI, the same data providers usedin our spot market analysis. Data on the CME bitcoin futures contract was pulled directly fromthe CME.
41 Data as of May 4, 2021.
40 https://www.coingecko.com/en/coins/bitcoin#markets. Navigate to the “Perpetuals” (perpetual futures)and “Futures” (predominantly quarterly futures) sub tabs within the “Markets” tab.

We used the full period of data available for each unregulated trading platform. The data startmonth for each trading platform was:
● Binance: September 2019● BitMEX: December 201742
● Bybit: October 2019● Deribit: August 2018● FTX: July 2019● Huobi: August 2019● OKEx: October 2018
The study ran through the end of Q1 2021.
For both CME’s monthly contract and the Huobi and OKEx’s quarterly contracts, we followedthe same technique used in our spot market analysis to create a continuous price series foranalysis, rolling contracts one day prior to expiration.
Important Context Regarding The Unregulated Bitcoin Futures Trading Platforms
Unregulated bitcoin futures trading platforms may be less familiar to casual market observersthan either the spot bitcoin trading platforms or the regulated CME bitcoin futures market. It maybe helpful, therefore, to provide context on the relative size, volume, and functioning of thesemarkets before we proceed to our statistical analysis.
The table below highlights three key statistics for the highest open interest contract on each ofthe evaluated trading platforms for the month of May 2021: Open Interest, Trading Volume, andRequired Margin. The CME row is highlighted in light blue.
Open Interest Trading Volume Required Margin
Bybit $1,666,878,515 $7,438,356,443 1%
Binance $1,575,326,903 $21,718,058,270 <1%
CME $1,404,125,298 $1,840,129,468 33%
FTX $1,232,139,553 $4,423,394,792 1%
OKEx $842,460,775 $2,112,965,793 <1%
Huobi $680,431,607 $5,823,998,157 <1%
42 BitMEX was the only platform that existed and has data available from the inception of the CME bitcoin futuresmarket on December 17, 2017. OKEx claims to have launched bitcoin futures trading as early as June 2013, buthistorical data for OKEx is not available before October 2018. Binance, Bybit, Deribit, FTX, and Huobi all launchedbitcoin futures trading after the inception of the CME bitcoin futures market, between 2018 and 2019.

BitMEX $664,421,615 $2,656,967,907 1%
Deribit $599,004,598 $1,264,134,910 1%
Three factors jump out from the table:
1. Open Interest: Open interest reflects the notional value of outstanding contracts and is acommon way to judge the size of a futures market. In this table, open interest at the endof each trading day was averaged across the month of May 2021.The largest contract(Bybit’s perpetuals) had $1.67 billion in average open interest in May, while the smallestcontract (Deribit’s perpetuals) had $600 million. The CME contract ranked third in thislist, with $1.40 billion in average open interest.
2. Trading Volume: Trading volume reflects the notional value traded in a given contracton each trading day averaged across the month of May 2021. The dispersion of tradingvolume statistics here is much wider than the dispersion of open interest: The most tradedcontract (Binance’s perpetuals) reported $21.72 billion in average daily trading volume inMay, while the least traded contract (Deribit’ perpetuals) reported $1.26 billion. TheCME contract ranked seventh by trading volume, at $1.84 billion.43
3. Required Margin: The required margin statistic highlights the major difference inpotential leverage between the regulated CME market and the unregulated bitcoin futurestrading platforms. The evaluated unregulated bitcoin futures trading platforms offerclients leverage at ratios ranging from 100-to-1 to 125-to-144, meaning required margin is1% or less of the notional value of open contract positions. By comparison, the maximumleverage ratio on the CME bitcoin futures market is 3-to-1, meaning a 33% requiredmargin ratio.45
The last point is of particular interest. While traders on a given platform do not always make useof the full amount of potential leverage, industry reports suggest that the level of realizedleverage on unregulated futures trading platforms is high. For instance, a 2019 report fromBitMEX found that the average level of realized leverage on that platform for the year endingApril 2019 was approximately 27-to-1, meaning an average maintained margin of less than 4%.46
46 https://blog.bitmex.com/bitmex-leverage-statistics-april-2019/45 https://www.cmegroup.com/trading/equity-index/us-index/bitcoin.html.
44 As of May 31, 2021, BitMEX, Bybit, Deribit offered 100-to-1 leverage, FTX offered 101-to-1 leverage,and Binance, Huobi and OKEx offered 125-to-1 leverage, according to each trading platform’s website.
43 Note that both trading volume and open interest statistics are self-reported. While most observers havea high degree of confidence in the data reported by regulated exchanges like the CME, the same cannotbe said for market statistics self-reported by unregulated futures trading platforms.

The high leverage ratios offered by unregulated bitcoin futures trading platforms mean that, atany given moment, the amount of capital committed to any one of these unregulated futurescontracts is likely significantly lower than the amount of capital committed to the CME bitcoinfutures contract.
As a hypothetical example, assuming an average margin of 4% (i.e., 25-to-1 leverage), theamount of capital backing the $7.26 billion in aggregate open interest across the sevenunregulated futures contracts can be estimated at $363 million. By comparison, assuming a 33%margin (the minimum required), the capital backing the $1.40 billion of open interest on theCME bitcoin futures contract is at least $462 million. In other words, it is very possible that theamount of capital committed to the CME bitcoin futures contract is larger than the capitalcommitted to all of the evaluated unregulated futures contracts, combined.
It is also worth noting that all evaluated unregulated bitcoin futures contracts have a higher ratioof trading volume to open interest than the CME bitcoin futures contract. This difference couldbe indicative of different styles of trading: highly levered short-term trades with frequent openingand closing of positions versus less levered longer-term trades with lower turnover.
The question of which style of trading and/or which features of a market are more important forprice leadership is interesting. In the following section, we examine whether the CME bitcoinfutures market or the unregulated bitcoin futures trading platforms leads price discovery usingestablished statistical techniques..
Methodology and Results
To determine whether the CME bitcoin futures market leads or lags price discovery compared tounregulated bitcoin futures trading platforms, we applied the same statistical tests that we didwhen comparing the CME to bitcoin spot trading platforms: Information Share/ComponentShare analysis (IS/CS) and Time-Shift Lead-Lag analysis (TSLL).
IS/CS Analysis
The table below shows the results of our IS and CS analysis comparing the CME with each ofthe seven unregulated bitcoin futures trading platforms over the duration of our study. Eachunregulated futures trading platform evaluation has its own date range, based on the length ofdata available for each trading platform.
IS and CS values above 50% indicate that the CME led price discovery against a givenunregulated futures trading platform over the duration of the study period. A * indicates that theresults are statistically significant (p-value < 0.05). We have also included a 95% confidence

interval for the results to provide further context.
The results show that the CME has led price discovery against each of the seven unregulatedtrading platforms across the duration of the study. The results are statistically significant for allplatforms when evaluated from an IS perspective, and for six of seven platforms from a CSperspective.
CME IS Confidence Interval CME CS Confidence Interval Data Range
Binance 55.30%* 53.64% - 56.96% 54.01%* 51.41% - 56.61% Sept 2019 - Mar 2021
BitMEX 63.67%* 62.30% - 65.04% 63.33%* 61.68% - 64.99% Dec 2017 - Mar 2021
Bybit 61.50%* 59.69% - 63.30% 60.26%* 57.75% - 62.77% Oct 2019 - Mar 2021
Deribit 56.91%* 55.56% - 58.26% 56.20%* 54.23% - 58.17% Aug 2018 - Mar 2021
FTX 56.73%* 55.13% - 58.32% 58.72%* 56.33% - 61.10% July 2019 - Mar 2021
Huobi 55.25%* 53.33% - 57.17% 53.85%* 51.36% - 56.33% Aug 2019 - Mar 2021
OKEx 53.04%* 51.45% - 54.63% 51.22% 49.14% - 53.31% Oct 2018 - Mar 2021
To add greater context to this full duration analysis, we also examined the results for eachunregulated futures trading platform on a month-by-month basis. The chart below showcasesthose findings for the CME-BitMEX pair, as the longest data range example; the IS/CS resultsfor all other unregulated futures trading platforms are available at the end of Appendix B.
For each month, the dot represents the midpoint finding averaged across the findings for eachday of the month, or what the literature would generally refer to as the CME’s IS or CS value forthe given month. Dots that appear above the black horizontal line at the 50% mark show that theCME led price discovery for that month, while dots below the 50% mark show that BitMEX led.Confidence bars capture a 95% confidence interval.

The results show that the CME led price discovery versus BitMEX in 37 of 40 months studied(93% of all months) from an IS perspective, and 36 or 40 months (90%) from a CS perspective.The results are statistically significant in a majority of months.

The wider confidence intervals versus the full duration analysis is a matter of statistical power:Monthly analysis incorporates significantly fewer data points than the full study period, andtherefore has lower levels of statistical strength.
Other trading platform pairs show similar results. The table below shows the percentage ofmonths that the CME led IS/CS price discovery against each trading platform:
% of Months CME Led IS % of Months CME Led CS Data Range
Binance 84% 74% Sept 2019 - Mar 2021
BitMEX 93% 90% Dec 2017 - Mar 2021
Bybit 100% 94% Oct 2019 - Mar 2021
Deribit 88% 78% Aug 2018 - Mar 2021
FTX 90% 95% July 2019 - Mar 2021
Huobi 85% 70% Aug 2019 - Mar 2021
OKEx 73% 60% Oct 2018 - Mar 2021
These monthly results support the conclusion of our full duration analysis in finding that theCME bitcoin futures market leads each of the seven unregulated bitcoin futures trading platformsfrom an IS and CS perspective.
TSLL Analysis
In addition to our IS/CS analysis, we also examined the CME bitcoin futures market versus theunregulated bitcoin futures trading platforms using Time-Shift Lead-Lag (TSLL) analysis. TSLLanalysis is a more intuitive approach to analyzing price discovery, using cross-correlationmeasures to determine which of two price series “leads” the other from a time-orderedperspective: i.e., are the prices on one platform ahead or behind prices on the other platformmore frequently.
The results of our TSLL analysis align with the results of our IS/CS analysis in finding that theCME bitcoin futures market leads all evaluated unregulated bitcoin futures trading platformsover the duration of the study. The results are statistically significant for all seven evaluatedtrading platforms.
The table below shows the lead-lag time (the amount of lead or lag that results in the highestcross-correlation between two price series) for the CME versus each of the seven unregulatedbitcoin futures trading platforms, calculated daily and averaged across the entire time period. Thetable also shows the 95% confidence interval for those results.

A positive value indicates the CME leading by that amount of seconds. A negative value wouldindicate CME lagging. The * indicates the result being statistically significant (p-value < 0.05),meaning the lead-lag time for the entire time period lies squarely within the positive (ornegative) value territory.
Lead-Lag Time(seconds)
Confidence Interval(seconds) Data Range
Binance 3.07* 2.50 - 3.65 Sept 2019 - Mar 2021
BitMEX 7.23* 6.76 - 7.70 Dec 2017 - Mar 2021
Bybit 5.13* 4.56 - 5.70 Oct 2019 - Mar 2021
Deribit 4.98* 4.47 - 5.49 Aug 2018 - Mar 2021
FTX 2.27* 2.08 - 2.46 July 2019 - Mar 2021
Huobi 2.34* 2.21 - 2.47 Aug 2019 - Mar 2021
OKEx 3.47* 2.94 - 4.00 Oct 2018 - Mar 2021
The results show that prices on the CME generally led prices on unregulated bitcoin futurestrading platforms by 2-7 seconds.
To add context, we also evaluated each platform on a month-by-month basis, as we did withIS/CS. The chart below shows the results for the CME-BitMEX pair, as the longest data rangeexample; the TSLL results for all other unregulated futures trading platforms are available at theend of Appendix C.

The results show that the CME led BitMEX from a TSLL perspective in all 40 of 40 monthsstudied (100% of all months). The results were statistically significant for 39 of 40 monthsstudied (98% of all months).
The lead-lag relationship between the CME and BitMEX does not follow the pattern seen inTSLL charts between the CME and spot platforms where the CME leads by a large number ofseconds in the early part of the study, with that lead time shortening substantially after Q1 2019.You can see that pattern, for instance, in the chart below comparing the CME and Coinbase.

The CME-BitMEX chart does not follow this pattern. This may be related to the prolonged bearmarket that occurred during the early period of our study, ending in Q1 2019. After all, spottrading platforms like Coinbase and futures trading platforms like BitMEX differ in the types ofexposure they provide: Spot trading platforms primarily facilitate long exposure, while futurestrading platforms allow traders to go both long and short. This difference could be the reasonwhy BitMEX diverged and lagged from the CME less compared to spot trading platforms suchas Coinbase during the prolonged bear market.
Regardless, however, in both CME-BitMEX and CME-Coinbase, the CME bitcoin futuresmarket consistently leads price discovery throughout the study period, and does so in astatistically significant manner.
Conclusion
In this appendix, we used established statistical techniques also used in the main body of thepaper to determine where price discovery occurs between seven unregulated bitcoin futurestrading platforms and the regulated CME bitcoin futures market. The results demonstrate that theCME has led each of the seven unregulated futures trading platforms over the duration of ourstudy, and has done so in most instances in a statistically significant manner.
These results may surprise some observers given the high notional trading volume statisticsreported by unregulated entities. These volume statistics, however, must be understood in thecontext of other important measures of market size, including open interest and capital-at-risk.

Viewed from these perspectives, unregulated bitcoin futures markets appear similar or smallerthan the regulated CME bitcoin futures market.
The question this study answered is an interesting one: Whether highly leveraged, unregulatedplatforms dominated by day-traders can lead price discovery against a regulated platform withlong-term oriented investors and more capital-at-risk. In this instance, the data lands in favor ofthe regulated market.

Appendix B: List Of IS/CS Price Discovery Analysis Monthly Results
CME vs. Binance (Chart)

CME vs. Binance (Table)
Month CME IS Confidence Interval CME CS Confidence Interval
Dec '17 73.88%* 57.83% - 89.92% 74.77%* 53.55% - 95.98%
Jan '18 48.38% 37.98% - 58.78% 52.54% 40.20% - 64.87%
Feb '18 53.00% 42.85% - 63.15% 48.38% 36.61% - 60.16%
Mar '18 58.03% 49.23% - 66.83% 63.90%* 50.70% - 77.09%
Apr '18 63.50%* 54.80% - 72.19% 64.66%* 53.48% - 75.83%
May '18 69.62%* 62.67% - 76.56% 70.95%* 62.13% - 79.76%
Jun '18 70.50%* 62.43% - 78.56% 72.58%* 63.06% - 82.10%
Jul '18 67.42%* 59.90% - 74.94% 65.54%* 57.43% - 73.64%
Aug '18 71.78%* 66.23% - 77.33% 75.22%* 68.13% - 82.31%
Sep '18 57.98% 47.31% - 68.64% 62.61% 48.13% - 77.09%
Oct '18 46.86% 34.51% - 59.20% 45.99% 32.76% - 59.22%
Nov '18 56.87% 45.85% - 67.88% 51.20% 37.57% - 64.83%
Dec '18 44.76% 33.85% - 55.68% 41.87% 27.89% - 55.85%
Jan '19 51.76% 38.93% - 64.60% 45.85% 32.54% - 59.16%
Feb '19 54.06% 43.89% - 64.22% 51.20% 40.02% - 62.37%
Mar '19 58.55% 48.62% - 68.48% 57.34% 45.26% - 69.42%
Apr '19 57.86% 46.88% - 68.84% 58.56% 48.18% - 68.94%
May '19 57.84% 45.51% - 70.18% 55.37% 45.25% - 65.49%
Jun '19 46.78% 35.95% - 57.62% 39.94% 25.34% - 54.55%
Jul '19 61.92%* 53.21% - 70.62% 62.06% 49.53% - 74.60%
Aug '19 65.71%* 58.85% - 72.57% 61.61%* 50.82% - 72.39%
Sep '19 61.95%* 52.07% - 71.82% 53.23% 41.30% - 65.17%
Oct '19 64.98%* 57.10% - 72.86% 64.49%* 53.32% - 75.66%
Nov '19 54.33% 45.37% - 63.29% 51.09% 40.60% - 61.57%
Dec '19 63.24%* 56.91% - 69.57% 63.09%* 54.13% - 72.06%
Jan '20 53.07% 44.00% - 62.13% 51.12% 41.00% - 61.24%
Feb '20 55.37% 45.41% - 65.33% 48.39% 37.76% - 59.02%
Mar '20 48.10% 39.99% - 56.21% 48.61% 36.71% - 60.50%
Apr '20 57.08%* 50.01% - 64.15% 56.04% 45.03% - 67.05%
May '20 59.90%* 53.37% - 66.42% 63.65%* 53.58% - 73.73%
Jun '20 56.85% 49.76% - 63.93% 60.70% 49.37% - 72.02%
Jul '20 58.40%* 50.55% - 66.24% 52.52% 39.98% - 65.06%
Aug '20 57.97%* 50.19% - 65.76% 55.63% 43.66% - 67.60%
Sep '20 60.11%* 54.02% - 66.19% 65.87%* 54.73% - 77.02%
2017-12-18 - 2020-09-30 58.32%* 56.78% - 59.86% 57.38%* 55.45% - 59.32%
CME vs. Bitfinex (Chart)

CME vs. Bitfinex (Table)
Month CME IS Confidence Interval CME CS Confidence Interval
Dec '17 49.44% 34.75% - 64.13% 51.78% 33.83% - 69.73%
Jan '18 52.12% 43.86% - 60.37% 52.57% 38.27% - 66.87%
Feb '18 54.82% 45.82% - 63.82% 48.82% 34.04% - 63.60%
Mar '18 60.22%* 53.88% - 66.56% 67.73%* 58.60% - 76.87%
Apr '18 64.47%* 56.08% - 72.85% 64.84%* 53.46% - 76.21%
May '18 76.94%* 71.66% - 82.22% 76.97%* 69.55% - 84.40%
Jun '18 72.50%* 66.05% - 78.95% 72.27%* 64.66% - 79.89%
Jul '18 76.62%* 70.09% - 83.15% 76.26%* 66.99% - 85.53%
Aug '18 75.55%* 69.77% - 81.32% 76.74%* 68.91% - 84.56%
Sep '18 77.13%* 68.98% - 85.29% 75.63%* 64.73% - 86.54%
Oct '18 45.08% 30.12% - 60.03% 44.99% 32.76% - 57.23%
Nov '18 51.30% 38.00% - 64.60% 47.82% 37.65% - 57.99%
Dec '18 55.81% 44.77% - 66.84% 53.80% 42.80% - 64.81%
Jan '19 65.40%* 53.33% - 77.46% 61.22% 49.55% - 72.88%
Feb '19 60.07% 48.18% - 71.96% 59.19% 45.37% - 73.01%
Mar '19 61.84% 46.94% - 76.75% 57.56% 44.71% - 70.40%
Apr '19 70.92%* 59.27% - 82.56% 68.74%* 55.88% - 81.60%
May '19 69.17%* 58.93% - 79.40% 67.67%* 56.57% - 78.78%
Jun '19 58.38% 47.95% - 68.81% 62.62% 49.82% - 75.42%
Jul '19 67.83%* 61.32% - 74.33% 69.52%* 60.28% - 78.76%
Aug '19 73.42%* 67.87% - 78.97% 75.99%* 66.84% - 85.14%
Sep '19 64.12%* 55.73% - 72.52% 62.21%* 52.69% - 71.73%
Oct '19 75.64%* 70.21% - 81.07% 76.37%* 70.08% - 82.66%
Nov '19 64.53%* 56.82% - 72.25% 62.11%* 51.43% - 72.80%
Dec '19 67.56%* 60.44% - 74.68% 63.12%* 52.96% - 73.27%
Jan '20 74.29%* 66.65% - 81.93% 64.12%* 55.48% - 72.76%
Feb '20 68.90%* 62.02% - 75.77% 66.73%* 57.34% - 76.12%
Mar '20 63.19%* 58.64% - 67.75% 67.27%* 58.92% - 75.62%
Apr '20 69.09%* 62.34% - 75.83% 70.71%* 62.11% - 79.31%
May '20 67.11%* 58.52% - 75.71% 65.24%* 54.36% - 76.12%
Jun '20 73.99%* 66.21% - 81.78% 73.83%* 62.44% - 85.22%
Jul '20 67.84%* 58.73% - 76.95% 63.50%* 52.24% - 74.77%
Aug '20 62.91%* 53.48% - 72.34% 62.67%* 51.49% - 73.86%
Sep '20 67.29%* 61.10% - 73.48% 71.74%* 60.62% - 82.87%
2017-12-18 - 2020-09-30 65.75%* 64.22% - 67.29% 65.08%* 63.28% - 66.89%

CME vs. Bitstamp (Chart)

CME vs. Bitstamp (Table)
Month CME IS Confidence Interval CME CS Confidence Interval
Dec '17 41.39% 19.72% - 63.05% 40.57% 17.33% - 63.82%
Jan '18 46.93% 38.42% - 55.43% 42.49% 31.06% - 53.91%
Feb '18 58.16%* 50.73% - 65.60% 54.52% 41.89% - 67.15%
Mar '18 61.80%* 55.78% - 67.81% 73.16%* 63.14% - 83.17%
Apr '18 68.67%* 62.45% - 74.90% 72.98%* 63.09% - 82.87%
May '18 69.66%* 61.96% - 77.36% 74.39%* 66.05% - 82.74%
Jun '18 72.13%* 64.37% - 79.89% 79.61%* 69.49% - 89.73%
Jul '18 76.50%* 71.35% - 81.65% 80.49%* 73.68% - 87.30%
Aug '18 78.01%* 73.85% - 82.18% 84.35%* 80.37% - 88.34%
Sep '18 67.85%* 57.83% - 77.86% 68.18%* 53.24% - 83.13%
Oct '18 52.84% 41.36% - 64.31% 49.48% 38.42% - 60.54%
Nov '18 62.57%* 52.92% - 72.22% 72.67%* 59.92% - 85.41%
Dec '18 57.05% 48.06% - 66.05% 63.52%* 50.88% - 76.16%
Jan '19 68.15%* 57.05% - 79.25% 62.81% 49.61% - 76.02%
Feb '19 66.53%* 59.58% - 73.48% 69.92%* 61.58% - 78.27%
Mar '19 59.56%* 50.18% - 68.93% 60.71% 48.40% - 73.02%
Apr '19 74.16%* 67.58% - 80.74% 80.55%* 73.93% - 87.17%
May '19 65.72%* 56.56% - 74.88% 70.38%* 58.61% - 82.14%
Jun '19 57.60% 47.54% - 67.66% 67.27%* 53.86% - 80.67%
Jul '19 72.58%* 68.42% - 76.75% 80.08%* 72.91% - 87.24%
Aug '19 66.48%* 58.78% - 74.17% 75.64%* 64.20% - 87.08%
Sep '19 68.96%* 62.35% - 75.57% 70.45%* 62.31% - 78.60%
Oct '19 71.24%* 65.87% - 76.60% 73.86%* 65.66% - 82.06%
Nov '19 64.77%* 56.12% - 73.43% 72.17%* 61.82% - 82.53%
Dec '19 73.52%* 68.55% - 78.48% 80.80%* 74.03% - 87.57%
Jan '20 61.80%* 52.42% - 71.17% 64.13%* 53.11% - 75.16%
Feb '20 63.47%* 53.98% - 72.96% 66.85%* 55.15% - 78.56%
Mar '20 53.01% 46.55% - 59.47% 55.52% 43.41% - 67.63%
Apr '20 61.12%* 54.97% - 67.28% 72.05%* 63.85% - 80.25%
May '20 65.27%* 58.99% - 71.56% 68.66%* 60.07% - 77.25%
Jun '20 58.02%* 50.65% - 65.40% 62.67%* 52.80% - 72.54%
Jul '20 56.27% 47.74% - 64.81% 57.57% 45.94% - 69.20%
Aug '20 60.97%* 51.70% - 70.25% 63.01% 48.90% - 77.12%
Sep '20 60.74%* 54.37% - 67.11% 61.44%* 50.30% - 72.57%
2017-12-18 - 2020-09-30 64.10%* 62.74% - 65.47% 68.03%* 66.21% - 69.86%

CME vs. Coinbase (Chart)

CME vs. Coinbase (Table)
Month CME IS Confidence Interval CME CS Confidence Interval
Dec '17 43.35% 21.24% - 65.47% 42.04% 13.35% - 70.73%
Jan '18 55.27% 46.14% - 64.40% 56.14% 44.35% - 67.94%
Feb '18 60.41%* 52.87% - 67.95% 63.39%* 51.42% - 75.36%
Mar '18 60.01%* 50.30% - 69.72% 66.22%* 56.22% - 76.22%
Apr '18 64.85%* 56.14% - 73.57% 62.74% 49.71% - 75.77%
May '18 66.99%* 57.75% - 76.22% 70.27%* 57.75% - 82.79%
Jun '18 62.44%* 53.09% - 71.80% 62.58%* 52.60% - 72.56%
Jul '18 67.66%* 58.67% - 76.64% 68.96%* 58.77% - 79.14%
Aug '18 75.08%* 70.12% - 80.04% 76.25%* 69.57% - 82.93%
Sep '18 70.47%* 61.62% - 79.32% 67.79%* 55.18% - 80.40%
Oct '18 58.67% 48.22% - 69.13% 46.47% 37.75% - 55.18%
Nov '18 57.32% 45.93% - 68.70% 60.57% 44.65% - 76.49%
Dec '18 48.71% 39.14% - 58.28% 46.33% 32.35% - 60.30%
Jan '19 54.51% 44.37% - 64.65% 44.48% 32.99% - 55.97%
Feb '19 58.78% 49.75% - 67.82% 53.44% 41.60% - 65.28%
Mar '19 61.65%* 53.36% - 69.93% 62.09%* 52.16% - 72.02%
Apr '19 62.15%* 54.11% - 70.20% 63.08%* 51.70% - 74.46%
May '19 56.17% 45.58% - 66.76% 54.16% 42.30% - 66.02%
Jun '19 50.37% 41.74% - 58.99% 59.07% 45.93% - 72.20%
Jul '19 64.11%* 57.28% - 70.93% 64.35%* 54.72% - 73.98%
Aug '19 64.46%* 58.71% - 70.20% 71.30%* 62.28% - 80.31%
Sep '19 59.90%* 52.40% - 67.39% 58.73% 47.13% - 70.32%
Oct '19 65.40%* 60.40% - 70.41% 65.62%* 57.33% - 73.90%
Nov '19 53.97% 46.13% - 61.81% 55.05% 42.19% - 67.92%
Dec '19 66.79%* 61.94% - 71.63% 76.40%* 68.06% - 84.75%
Jan '20 57.65% 48.46% - 66.85% 53.68% 42.62% - 64.74%
Feb '20 60.62%* 52.16% - 69.08% 58.53% 47.69% - 69.37%
Mar '20 48.14% 40.83% - 55.45% 46.63% 34.36% - 58.90%
Apr '20 63.43%* 58.53% - 68.32% 67.69%* 58.99% - 76.39%
May '20 63.06%* 56.76% - 69.35% 65.05%* 54.74% - 75.35%
Jun '20 57.92% 49.73% - 66.11% 60.11% 47.53% - 72.70%
Jul '20 62.50%* 54.88% - 70.12% 63.65%* 52.76% - 74.53%
Aug '20 63.04%* 53.97% - 72.12% 62.53%* 50.01% - 75.05%
Sep '20 62.16%* 54.77% - 69.54% 61.43%* 50.84% - 72.01%
2017-12-18 - 2020-09-30 60.60%* 59.20% - 62.00% 60.88%* 58.99% - 62.77%

CME vs. Gemini (Chart)

CME vs. Gemini (Table)
Month CME IS Confidence Interval CME CS Confidence Interval
Dec '17 49.51% 29.28% - 69.74% 47.63% 25.70% - 69.57%
Jan '18 51.75% 43.74% - 59.77% 54.46% 42.45% - 66.48%
Feb '18 51.88% 42.91% - 60.85% 45.18% 34.04% - 56.32%
Mar '18 54.11% 46.21% - 62.00% 57.06% 43.00% - 71.12%
Apr '18 53.69% 43.81% - 63.58% 54.81% 38.40% - 71.21%
May '18 60.37%* 52.95% - 67.80% 59.83% 47.29% - 72.36%
Jun '18 59.72% 49.55% - 69.88% 53.73% 41.81% - 65.65%
Jul '18 67.94%* 60.52% - 75.36% 67.80%* 58.52% - 77.09%
Aug '18 55.11% 47.00% - 63.22% 60.59%* 50.15% - 71.03%
Sep '18 53.18% 43.22% - 63.14% 50.22% 38.31% - 62.12%
Oct '18 48.84% 35.30% - 62.38% 44.20% 30.61% - 57.79%
Nov '18 53.41% 45.40% - 61.41% 59.07% 45.66% - 72.47%
Dec '18 47.44% 38.87% - 56.01% 40.08% 26.60% - 53.56%
Jan '19 56.96% 45.88% - 68.03% 50.63% 39.72% - 61.53%
Feb '19 54.32% 44.47% - 64.17% 48.56% 33.36% - 63.76%
Mar '19 45.40% 33.10% - 57.70% 44.14% 34.80% - 53.48%
Apr '19 62.51%* 53.49% - 71.53% 66.39%* 54.39% - 78.39%
May '19 59.55%* 51.42% - 67.69% 63.26%* 50.18% - 76.34%
Jun '19 48.97% 39.68% - 58.26% 46.42% 31.63% - 61.21%
Jul '19 58.24%* 53.20% - 63.29% 66.62%* 55.34% - 77.89%
Aug '19 61.93%* 54.42% - 69.44% 58.82% 48.75% - 68.90%
Sep '19 47.24% 38.36% - 56.13% 49.61% 38.02% - 61.21%
Oct '19 56.04% 48.47% - 63.61% 52.20% 41.40% - 63.00%
Nov '19 58.03%* 50.36% - 65.70% 60.91%* 51.42% - 70.40%
Dec '19 61.10%* 53.37% - 68.82% 62.63% 49.35% - 75.91%
Jan '20 55.08% 43.44% - 66.72% 57.20% 43.57% - 70.83%
Feb '20 60.05%* 50.81% - 69.29% 59.75% 48.15% - 71.36%
Mar '20 56.31%* 50.71% - 61.90% 56.89% 45.27% - 68.51%
Apr '20 57.31%* 52.65% - 61.97% 60.43% 49.07% - 71.79%
May '20 63.18%* 56.71% - 69.65% 63.51%* 53.45% - 73.57%
Jun '20 61.83%* 55.42% - 68.23% 68.58%* 57.76% - 79.39%
Jul '20 55.66% 46.90% - 64.43% 54.34% 41.31% - 67.37%
Aug '20 61.81%* 53.40% - 70.22% 63.45%* 51.87% - 75.03%
Sep '20 62.98%* 57.07% - 68.88% 66.02%* 57.08% - 74.96%
2017-12-18 - 2020-09-30 56.44%* 55.03% - 57.84% 56.73%* 54.73% - 58.72%

CME vs. Huobi (Chart)

CME vs. Huobi (Table)
Month CME IS Confidence Interval CME CS Confidence Interval
Mar '18 66.17%* 57.72% - 74.62% 67.72%* 57.64% - 77.79%
Apr '18 71.96%* 65.56% - 78.37% 72.53%* 62.80% - 82.25%
May '18 77.35%* 71.04% - 83.66% 77.14%* 68.84% - 85.45%
Jun '18 76.84%* 68.75% - 84.92% 77.30%* 67.23% - 87.37%
Jul '18 72.59%* 65.28% - 79.90% 68.88%* 59.58% - 78.18%
Aug '18 76.21%* 70.24% - 82.19% 80.93%* 72.70% - 89.15%
Sep '18 66.04%* 60.30% - 71.78% 76.70%* 68.07% - 85.33%
Oct '18 45.26% 31.92% - 58.59% 39.42% 26.82% - 52.01%
Nov '18 57.49% 45.51% - 69.46% 52.16% 39.80% - 64.52%
Dec '18 51.64% 40.90% - 62.38% 45.47% 32.15% - 58.79%
Jan '19 57.58% 46.33% - 68.84% 50.48% 39.74% - 61.23%
Feb '19 61.48%* 50.84% - 72.12% 59.33% 49.04% - 69.61%
Mar '19 60.41%* 50.36% - 70.45% 54.27% 42.20% - 66.33%
Apr '19 59.15% 46.41% - 71.89% 60.74% 49.54% - 71.94%
May '19 56.79% 43.38% - 70.20% 55.45% 43.49% - 67.40%
Jun '19 50.71% 40.85% - 60.57% 43.93% 29.91% - 57.95%
Jul '19 64.42%* 55.80% - 73.04% 63.51%* 51.96% - 75.05%
Aug '19 63.04%* 56.18% - 69.91% 60.41% 49.40% - 71.41%
Sep '19 62.43%* 53.62% - 71.24% 52.40% 39.04% - 65.77%
Oct '19 63.86%* 57.33% - 70.40% 60.04% 49.19% - 70.88%
Nov '19 55.56% 47.98% - 63.14% 56.59% 44.66% - 68.51%
Dec '19 63.88%* 57.76% - 70.00% 64.41%* 55.42% - 73.40%
Jan '20 53.46% 44.72% - 62.21% 53.35% 42.05% - 64.65%
Feb '20 55.27% 45.18% - 65.36% 45.44% 35.54% - 55.35%
Mar '20 48.81% 40.58% - 57.04% 45.94% 33.22% - 58.66%
Apr '20 57.88%* 51.21% - 64.55% 54.09% 42.78% - 65.39%
May '20 61.55%* 55.05% - 68.05% 62.69%* 52.65% - 72.73%
Jun '20 56.51% 49.45% - 63.57% 57.71% 46.60% - 68.82%
Jul '20 55.99% 48.12% - 63.87% 52.40% 39.67% - 65.14%
Aug '20 58.05%* 50.43% - 65.68% 54.64% 43.71% - 65.57%
Sep '20 59.24%* 52.83% - 65.65% 60.74% 48.22% - 73.25%
2018-03-01 - 2020-09-30 60.91%* 59.34% - 62.49% 58.97%* 56.96% - 60.98%

CME vs. itBit (Chart)

CME vs. itBit (Table)
Month CME IS Confidence Interval CME CS Confidence Interval
Dec '17 44.83% 22.06% - 67.60% 48.07% 19.80% - 76.34%
Jan '18 43.81% 31.60% - 56.02% 37.59% 22.97% - 52.22%
Feb '18 52.34% 42.47% - 62.22% 57.90% 44.94% - 70.86%
Mar '18 44.58% 36.07% - 53.09% 45.48% 31.89% - 59.08%
Apr '18 49.45% 37.29% - 61.61% 52.17% 37.12% - 67.22%
May '18 56.59% 46.39% - 66.80% 53.66% 43.23% - 64.09%
Jun '18 51.92% 40.81% - 63.04% 58.86% 45.12% - 72.59%
Jul '18 57.16% 48.30% - 66.02% 64.78%* 54.73% - 74.83%
Aug '18 61.13%* 53.03% - 69.23% 64.89%* 51.88% - 77.90%
Sep '18 57.99% 46.37% - 69.61% 53.08% 38.97% - 67.18%
Oct '18 54.59% 41.03% - 68.14% 54.88% 45.00% - 64.77%
Nov '18 55.19% 44.54% - 65.85% 60.70% 46.54% - 74.86%
Dec '18 52.04% 45.22% - 58.87% 48.78% 34.43% - 63.14%
Jan '19 50.93% 40.54% - 61.33% 49.66% 40.13% - 59.20%
Feb '19 53.53% 43.74% - 63.33% 56.04% 39.96% - 72.12%
Mar '19 50.92% 42.78% - 59.07% 45.50% 31.74% - 59.26%
Apr '19 58.38%* 52.03% - 64.73% 55.63% 42.95% - 68.31%
May '19 51.24% 42.61% - 59.87% 55.63% 44.13% - 67.13%
Jun '19 52.85% 45.08% - 60.63% 55.33% 41.16% - 69.51%
Jul '19 59.71%* 55.68% - 63.75% 65.99%* 55.69% - 76.30%
Aug '19 52.06% 45.52% - 58.61% 50.34% 35.83% - 64.84%
Sep '19 52.01% 44.32% - 59.70% 48.43% 33.34% - 63.52%
Oct '19 51.03% 43.23% - 58.83% 44.71% 33.67% - 55.75%
Nov '19 48.99% 42.06% - 55.92% 45.81% 32.52% - 59.10%
Dec '19 46.61% 37.11% - 56.11% 46.30% 33.02% - 59.58%
Jan '20 51.36% 41.28% - 61.43% 47.78% 36.24% - 59.32%
Feb '20 55.26% 47.32% - 63.19% 58.97% 45.57% - 72.37%
Mar '20 46.90% 42.00% - 51.80% 47.23% 37.19% - 57.26%
Apr '20 59.25%* 53.21% - 65.28% 55.19% 48.55% - 61.83%
May '20 54.13% 46.39% - 61.87% 55.21% 43.82% - 66.61%
Jun '20 53.33% 43.51% - 63.15% 51.48% 38.54% - 64.43%
Jul '20 54.25% 44.08% - 64.43% 45.87% 32.97% - 58.78%
Aug '20 55.00% 44.64% - 65.36% 53.75% 41.54% - 65.97%
Sep '20 59.68%* 51.79% - 67.56% 50.98% 40.36% - 61.59%
2017-12-18 - 2020-09-30 53.33%* 51.91% - 54.75% 52.97%* 50.93% - 55.00%

CME vs. Kraken (Chart)

CME vs. Kraken (Table)
Month CME IS Confidence Interval CME CS Confidence Interval
Dec '17 44.29% 17.93% - 70.64% 39.83% 17.90% - 61.75%
Jan '18 57.74% 45.33% - 70.15% 56.19% 42.04% - 70.33%
Feb '18 54.59% 46.24% - 62.95% 46.51% 36.25% - 56.77%
Mar '18 69.46%* 62.36% - 76.55% 77.45%* 70.81% - 84.10%
Apr '18 68.42%* 56.37% - 80.46% 64.73%* 53.81% - 75.66%
May '18 58.56% 46.50% - 70.63% 57.41% 43.86% - 70.96%
Jun '18 65.83% 49.91% - 81.75% 66.25%* 52.04% - 80.45%
Jul '18 70.81%* 60.49% - 81.13% 72.48%* 61.41% - 83.54%
Aug '18 70.52%* 61.70% - 79.33% 71.16%* 59.58% - 82.74%
Sep '18 56.26% 44.40% - 68.11% 53.70% 37.96% - 69.45%
Oct '18 49.77% 35.44% - 64.10% 43.74% 30.31% - 57.17%
Nov '18 63.05%* 54.18% - 71.92% 69.62%* 56.76% - 82.49%
Dec '18 57.40% 47.22% - 67.58% 54.29% 39.79% - 68.79%
Jan '19 54.97% 42.53% - 67.41% 56.85% 44.14% - 69.56%
Feb '19 64.26%* 54.50% - 74.02% 58.89% 46.36% - 71.43%
Mar '19 61.37% 46.73% - 76.01% 63.48% 47.54% - 79.42%
Apr '19 72.02%* 64.46% - 79.58% 76.92%* 66.26% - 87.58%
May '19 64.33%* 52.94% - 75.71% 66.35%* 54.39% - 78.31%
Jun '19 58.56% 47.04% - 70.08% 59.46% 46.19% - 72.73%
Jul '19 75.22%* 69.12% - 81.33% 79.66%* 73.23% - 86.09%
Aug '19 65.97%* 57.49% - 74.45% 71.62%* 60.68% - 82.55%
Sep '19 63.67%* 53.47% - 73.87% 61.96% 49.68% - 74.24%
Oct '19 61.50%* 50.89% - 72.11% 61.77%* 51.98% - 71.56%
Nov '19 61.42%* 54.11% - 68.74% 59.48% 48.67% - 70.28%
Dec '19 67.95%* 61.17% - 74.73% 68.73%* 55.70% - 81.75%
Jan '20 58.23% 47.69% - 68.77% 53.39% 42.64% - 64.15%
Feb '20 66.15%* 59.41% - 72.89% 67.20%* 57.02% - 77.37%
Mar '20 56.18% 49.78% - 62.58% 55.11% 43.52% - 66.69%
Apr '20 65.64%* 58.14% - 73.14% 65.72%* 56.76% - 74.69%
May '20 67.04%* 60.40% - 73.67% 68.96%* 57.88% - 80.04%
Jun '20 62.35%* 53.94% - 70.75% 61.04% 49.11% - 72.98%
Jul '20 60.01%* 50.64% - 69.39% 57.99% 47.34% - 68.65%
Aug '20 63.71%* 53.69% - 73.73% 62.07%* 50.01% - 74.12%
Sep '20 68.42%* 61.13% - 75.71% 71.02%* 62.68% - 79.37%
2017-12-18 - 2020-09-30 63.17%* 61.58% - 64.76% 63.24%* 61.29% - 65.19%

CME vs. LBank (Chart)

CME vs. LBank (Table)
Month CME IS Confidence Interval CME CS Confidence Interval
Apr '18 57.83% 22.09% - 93.57% 63.03% 22.42% - 100.00%
May '18 70.04%* 58.06% - 82.02% 74.46%* 50.33% - 98.60%
Jun '18 69.76% 48.11% - 91.41% 54.64% 41.29% - 67.99%
Jul '18 63.43% 49.76% - 77.10% 55.50% 38.86% - 72.14%
Aug '18 71.01%* 59.68% - 82.33% 72.84%* 61.74% - 83.95%
Sep '18 49.00% 34.44% - 63.55% 49.12% 28.68% - 69.56%
Oct '18 50.51% 18.48% - 82.54% 39.74% 9.72% - 69.76%
Nov '18 58.21% 47.99% - 68.42% 61.78% 48.66% - 74.90%
Dec '18 48.84% 37.23% - 60.45% 37.26% 23.74% - 50.78%
Jan '19 50.57% 33.95% - 67.20% 49.99% 35.49% - 64.49%
Feb '19 56.52% 43.00% - 70.04% 49.73% 36.98% - 62.48%
Mar '19 58.61% 46.43% - 70.78% 51.95% 36.68% - 67.22%
Apr '19 67.27%* 56.20% - 78.34% 66.46%* 55.12% - 77.80%
May '19 61.60% 49.10% - 74.11% 60.30% 48.73% - 71.87%
Jun '19 53.08% 40.44% - 65.72% 55.55% 43.09% - 68.01%
Jul '19 67.06%* 59.02% - 75.10% 67.61%* 61.44% - 73.79%
Aug '19 66.47%* 58.37% - 74.58% 68.23%* 59.07% - 77.39%
Sep '19 44.33% 32.48% - 56.17% 40.01% 27.73% - 52.29%
Oct '19 56.64%* 51.27% - 62.01% 50.37% 41.71% - 59.02%
Nov '19 56.03% 44.12% - 67.94% 50.12% 36.81% - 63.43%
Dec '19 61.73%* 53.00% - 70.46% 59.91% 48.80% - 71.03%
Jan '20 74.07%* 60.21% - 87.93% 71.33%* 59.55% - 83.11%
Feb '20 70.92%* 58.33% - 83.51% 71.94%* 62.78% - 81.11%
Mar '20 82.90%* 74.52% - 91.28% 82.54%* 73.99% - 91.10%
Apr '20 74.42%* 66.11% - 82.72% 69.07%* 60.79% - 77.34%
May '20 78.85%* 70.62% - 87.09% 74.41%* 66.23% - 82.59%
Jun '20 73.73%* 65.78% - 81.69% 73.88%* 65.10% - 82.66%
Jul '20 71.17%* 61.18% - 81.15% 64.98%* 55.75% - 74.22%
Aug '20 77.58%* 68.24% - 86.92% 74.31%* 66.15% - 82.47%
Sep '20 87.70%* 81.30% - 94.10% 87.71%* 81.36% - 94.06%
2018-04-05 - 2020-09-30 66.03%* 63.95% - 68.11% 63.51%* 61.34% - 65.68%

CME vs. OKEx (Chart)

CME vs. OKEx (Table)
Month CME IS Confidence Interval CME CS Confidence Interval
Dec '17 60.69% 34.76% - 86.62% 56.88% 35.39% - 78.37%
Jan '18 43.77% 35.33% - 52.21% 46.03% 39.93% - 52.12%
Feb '18 57.14% 48.66% - 65.62% 47.43% 34.29% - 60.57%
Mar '18 55.36% 49.34% - 61.39% 61.20%* 51.79% - 70.61%
Apr '18 52.26% 45.49% - 59.03% 50.68% 41.26% - 60.09%
May '18 57.72% 47.34% - 68.10% 50.67% 35.46% - 65.88%
Jun '18 53.80% 47.17% - 60.43% 53.50% 40.47% - 66.53%
Jul '18 52.19% 46.60% - 57.79% 47.32% 36.68% - 57.96%
Aug '18 54.66% 49.63% - 59.70% 55.22% 42.45% - 67.99%
Sep '18 46.76% 40.42% - 53.10% 38.31%* 29.91% - 46.71%
Oct '18 47.59% 36.46% - 58.72% 45.09% 34.53% - 55.64%
Nov '18 60.12% 48.61% - 71.62% 52.16% 39.30% - 65.03%
Dec '18 46.87% 34.90% - 58.85% 43.68% 30.70% - 56.65%
Jan '19 54.28% 41.49% - 67.08% 48.89% 35.83% - 61.95%
Feb '19 58.41% 46.93% - 69.89% 58.17% 46.94% - 69.39%
Mar '19 60.57%* 51.12% - 70.02% 58.34% 46.55% - 70.14%
Apr '19 60.41% 48.80% - 72.03% 59.27% 49.52% - 69.01%
May '19 59.84% 46.25% - 73.42% 54.39% 42.96% - 65.81%
Jun '19 51.93% 41.59% - 62.27% 49.34% 35.19% - 63.49%
Jul '19 64.22%* 56.85% - 71.60% 63.56%* 52.90% - 74.22%
Aug '19 65.14%* 59.34% - 70.94% 63.51%* 53.90% - 73.13%
Sep '19 58.56% 49.90% - 67.22% 47.42% 36.56% - 58.28%
Oct '19 63.16%* 57.12% - 69.19% 64.07%* 54.10% - 74.03%
Nov '19 53.53% 45.58% - 61.49% 54.27% 42.43% - 66.10%
Dec '19 68.21%* 62.71% - 73.70% 68.32%* 60.55% - 76.10%
Jan '20 55.30% 46.83% - 63.77% 54.66% 44.15% - 65.18%
Feb '20 56.71% 47.34% - 66.07% 49.04% 39.17% - 58.90%
Mar '20 48.68% 41.20% - 56.16% 45.06% 33.15% - 56.97%
Apr '20 55.51% 48.97% - 62.05% 52.67% 41.67% - 63.67%
May '20 58.81%* 52.46% - 65.16% 59.26% 48.18% - 70.34%
Jun '20 55.22% 48.78% - 61.67% 56.69% 45.17% - 68.21%
Jul '20 55.70% 47.74% - 63.66% 45.71% 33.76% - 57.66%
Aug '20 56.31% 48.85% - 63.78% 57.72% 46.96% - 68.47%
Sep '20 59.35%* 53.03% - 65.68% 58.01% 45.53% - 70.49%
2017-12-18 - 2020-09-30 56.19%* 54.74% - 57.64% 53.60%* 51.73% - 55.47%

CME vs. Binance Perpetual Futures (Chart)

CME vs. Binance Perpetual Futures (Table)
Month CME IS Confidence Interval CME CS Confidence Interval
Sep '19 59.69%* 51.29% - 68.09% 52.15% 36.80% - 67.50%
Oct '19 66.52%* 59.33% - 73.71% 62.19%* 54.26% - 70.12%
Nov '19 48.70% 40.17% - 57.22% 44.21% 31.75% - 56.67%
Dec '19 62.65%* 56.37% - 68.92% 61.10%* 51.93% - 70.27%
Jan '20 52.08% 43.89% - 60.27% 50.20% 38.35% - 62.04%
Feb '20 53.77% 43.78% - 63.75% 47.68% 36.04% - 59.33%
Mar '20 51.04% 43.22% - 58.86% 47.39% 35.41% - 59.36%
Apr '20 58.35%* 51.60% - 65.10% 57.84% 47.31% - 68.37%
May '20 61.66%* 55.89% - 67.44% 63.14%* 51.65% - 74.63%
Jun '20 53.27% 45.65% - 60.89% 56.58% 44.72% - 68.43%
Jul '20 54.90% 47.42% - 62.37% 53.31% 41.57% - 65.04%
Aug '20 56.36% 48.93% - 63.78% 55.83% 42.84% - 68.82%
Sep '20 59.16%* 52.59% - 65.72% 60.41% 47.88% - 72.95%
Oct '20 50.16% 41.92% - 58.40% 44.90% 34.35% - 55.45%
Nov '20 54.06% 48.06% - 60.07% 61.01% 47.79% - 74.23%
Dec '20 49.87% 42.23% - 57.52% 50.91% 38.93% - 62.89%
Jan '21 54.31% 46.75% - 61.87% 58.55% 43.82% - 73.29%
Feb '21 55.25% 46.67% - 63.82% 52.30% 37.67% - 66.92%
Mar '21 49.93% 43.86% - 56.00% 46.30% 35.12% - 57.48%
2019-09-10 - 2021-03-31 55.30%* 53.64% - 56.96% 54.01%* 51.41% - 56.61%

CME vs. BitMEX Perpetual Futures (Chart)

CME vs. BitMEX Perpetual Futures (Table)
Month CME IS Confidence Interval CME CS Confidence Interval
Dec '17 45.88% 27.96% - 63.80% 44.61% 24.45% - 64.78%
Jan '18 48.95% 43.55% - 54.36% 44.64% 31.83% - 57.45%
Feb '18 51.78% 43.83% - 59.73% 51.66% 39.22% - 64.10%
Mar '18 52.66% 46.35% - 58.98% 58.47% 46.45% - 70.49%
Apr '18 66.32%* 56.29% - 76.36% 69.58%* 58.62% - 80.53%
May '18 68.32%* 59.52% - 77.11% 65.62%* 55.51% - 75.73%
Jun '18 76.72%* 70.58% - 82.86% 77.21%* 69.63% - 84.78%
Jul '18 73.58%* 65.67% - 81.49% 75.07%* 65.96% - 84.18%
Aug '18 66.49%* 58.69% - 74.29% 68.85%* 58.52% - 79.18%
Sep '18 70.49%* 62.11% - 78.87% 76.45%* 67.23% - 85.68%
Oct '18 69.40%* 59.19% - 79.62% 62.08%* 52.24% - 71.93%
Nov '18 54.57% 43.56% - 65.57% 54.17% 43.07% - 65.27%
Dec '18 48.00% 35.93% - 60.07% 45.20% 31.61% - 58.78%
Jan '19 69.22%* 58.49% - 79.94% 62.34%* 50.82% - 73.87%
Feb '19 57.87% 46.60% - 69.14% 56.39% 43.86% - 68.93%
Mar '19 65.19%* 58.27% - 72.11% 67.07%* 57.81% - 76.33%
Apr '19 72.84%* 65.93% - 79.74% 76.40%* 69.10% - 83.70%
May '19 71.09%* 61.61% - 80.57% 69.16%* 58.36% - 79.97%
Jun '19 55.28% 44.79% - 65.76% 61.96% 48.76% - 75.15%
Jul '19 61.46%* 51.65% - 71.28% 67.54%* 56.67% - 78.41%
Aug '19 66.44%* 58.99% - 73.88% 71.76%* 61.26% - 82.27%
Sep '19 61.21%* 52.70% - 69.71% 55.46% 45.35% - 65.58%
Oct '19 62.23%* 54.30% - 70.17% 64.54%* 54.09% - 74.99%
Nov '19 60.16%* 51.35% - 68.97% 58.79% 47.33% - 70.25%
Dec '19 72.62%* 66.11% - 79.12% 71.78%* 63.58% - 79.98%
Jan '20 59.64% 49.03% - 70.26% 55.30% 45.47% - 65.13%
Feb '20 69.59%* 60.29% - 78.89% 65.69%* 54.74% - 76.64%
Mar '20 55.27% 46.95% - 63.58% 60.46%* 50.38% - 70.55%
Apr '20 66.04%* 58.99% - 73.09% 71.67%* 63.94% - 79.40%
May '20 74.48%* 67.01% - 81.95% 76.47%* 67.80% - 85.13%
Jun '20 71.90%* 64.07% - 79.73% 72.17%* 62.42% - 81.91%
Jul '20 73.12%* 64.76% - 81.49% 67.16%* 57.87% - 76.45%
Aug '20 70.67%* 60.63% - 80.71% 65.75%* 55.27% - 76.23%
Sep '20 72.84%* 64.03% - 81.66% 65.98%* 56.05% - 75.91%
Oct '20 63.65%* 54.47% - 72.82% 58.57% 47.59% - 69.55%
Nov '20 63.87%* 57.02% - 70.71% 67.95%* 59.63% - 76.27%
Dec '20 56.34% 48.56% - 64.13% 48.65% 37.59% - 59.71%

Jan '21 56.40%* 50.96% - 61.85% 61.18%* 50.01% - 72.36%
Feb '21 55.76% 47.12% - 64.39% 53.13% 41.24% - 65.01%
Mar '21 54.11% 47.04% - 61.18% 52.08% 39.13% - 65.03%
2017-12-18 - 2021-03-31 63.67%* 62.30% - 65.04% 63.33%* 61.68% - 64.99%

CME vs. Bybit Perpetual Futures (Chart)

CME vs. Bybit Perpetual Futures (Table)
Month CME IS Confidence Interval CME CS Confidence Interval
Oct '19 70.72%* 64.78% - 76.66% 72.99%* 64.26% - 81.72%
Nov '19 64.73%* 56.52% - 72.94% 62.95%* 53.13% - 72.76%
Dec '19 70.03%* 62.83% - 77.22% 68.10%* 57.96% - 78.24%
Jan '20 54.68% 44.39% - 64.96% 46.28% 36.83% - 55.72%
Feb '20 61.92%* 52.64% - 71.21% 57.58% 47.07% - 68.09%
Mar '20 50.85% 43.24% - 58.47% 51.33% 36.43% - 66.24%
Apr '20 61.13%* 54.12% - 68.14% 61.64%* 50.60% - 72.68%
May '20 65.19%* 58.17% - 72.21% 66.06%* 56.64% - 75.49%
Jun '20 61.27%* 54.50% - 68.04% 65.61%* 54.84% - 76.38%
Jul '20 63.47%* 54.41% - 72.53% 56.03% 45.53% - 66.53%
Aug '20 67.12%* 57.19% - 77.05% 63.64%* 53.48% - 73.80%
Sep '20 65.97%* 58.19% - 73.75% 62.13%* 52.11% - 72.15%
Oct '20 62.63%* 54.10% - 71.16% 58.88% 49.20% - 68.56%
Nov '20 64.19%* 57.07% - 71.30% 70.14%* 61.02% - 79.26%
Dec '20 55.07% 47.23% - 62.91% 52.37% 40.03% - 64.70%
Jan '21 55.96%* 50.75% - 61.16% 63.33%* 50.61% - 76.04%
Feb '21 57.39% 49.14% - 65.64% 55.12% 40.84% - 69.39%
Mar '21 54.77% 47.19% - 62.35% 51.20% 38.01% - 64.39%
2019-10-01 - 2021-03-31 61.50%* 59.69% - 63.30% 60.26%* 57.75% - 62.77%

CME vs. Deribit Perpetual Futures (Chart)

CME vs. Deribit Perpetual Futures (Table)
Month CME IS Confidence Interval CME CS Confidence Interval
Aug '18 61.28% 48.19% - 74.38% 65.98%* 50.08% - 81.87%
Sep '18 55.84% 47.69% - 63.99% 50.64% 36.37% - 64.91%
Oct '18 46.58% 33.08% - 60.08% 41.62% 31.66% - 51.59%
Nov '18 58.09% 47.16% - 69.02% 53.79% 40.59% - 66.99%
Dec '18 43.94% 34.39% - 53.50% 37.03%* 24.45% - 49.61%
Jan '19 57.53% 47.24% - 67.82% 50.61% 37.06% - 64.17%
Feb '19 51.80% 41.34% - 62.26% 52.01% 39.76% - 64.27%
Mar '19 57.55% 49.20% - 65.89% 60.70% 49.79% - 71.61%
Apr '19 60.77%* 53.51% - 68.04% 67.66%* 56.92% - 78.39%
May '19 60.67%* 51.10% - 70.24% 59.40% 46.41% - 72.40%
Jun '19 55.07% 45.51% - 64.63% 62.55%* 50.89% - 74.22%
Jul '19 63.16%* 57.07% - 69.25% 65.70%* 54.52% - 76.88%
Aug '19 65.04%* 58.24% - 71.84% 71.53%* 61.69% - 81.38%
Sep '19 59.07%* 53.04% - 65.10% 54.61% 45.99% - 63.23%
Oct '19 61.49%* 54.81% - 68.17% 59.07% 49.08% - 69.06%
Nov '19 53.70% 47.51% - 59.89% 51.73% 41.54% - 61.92%
Dec '19 65.24%* 59.47% - 71.00% 68.34%* 59.34% - 77.35%
Jan '20 52.13% 43.76% - 60.49% 44.35% 32.74% - 55.95%
Feb '20 60.22%* 51.29% - 69.16% 60.38% 48.70% - 72.06%
Mar '20 53.20% 46.13% - 60.26% 52.59% 41.50% - 63.69%
Apr '20 57.02%* 51.38% - 62.65% 62.60%* 50.40% - 74.80%
May '20 63.87%* 57.95% - 69.79% 65.08%* 56.99% - 73.17%
Jun '20 60.97%* 54.73% - 67.21% 64.16%* 54.69% - 73.64%
Jul '20 62.44%* 55.18% - 69.71% 60.97%* 51.28% - 70.67%
Aug '20 58.57% 49.26% - 67.87% 54.05% 41.49% - 66.61%
Sep '20 57.66%* 51.43% - 63.88% 51.12% 38.88% - 63.37%
Oct '20 52.81% 44.79% - 60.83% 48.25% 37.68% - 58.82%
Nov '20 56.14%* 51.43% - 60.86% 61.68%* 50.97% - 72.38%
Dec '20 49.31% 41.06% - 57.56% 45.64% 33.47% - 57.82%
Jan '21 56.91%* 51.43% - 62.39% 60.18% 46.90% - 73.45%
Feb '21 52.34% 44.71% - 59.98% 46.79% 34.07% - 59.51%
Mar '21 48.59% 43.03% - 54.14% 46.04% 32.52% - 59.56%
2018-08-14 - 2021-03-31 56.91%* 55.56% - 58.26% 56.20%* 54.23% - 58.17%

CME vs. FTX Perpetual Futures (Chart)

CME vs. FTX Perpetual Futures (Table)
Month CME IS Confidence Interval CME CS Confidence Interval
Jul '19 56.20%* 51.89% - 60.50% 54.61% 46.46% - 62.76%
Aug '19 53.27% 42.81% - 63.74% 57.90% 45.76% - 70.04%
Sep '19 49.65% 40.26% - 59.03% 53.79% 41.62% - 65.97%
Oct '19 52.86% 44.58% - 61.13% 53.12% 41.66% - 64.58%
Nov '19 51.15% 43.36% - 58.93% 55.66% 45.52% - 65.81%
Dec '19 62.96%* 57.42% - 68.49% 68.15%* 59.59% - 76.70%
Jan '20 59.39%* 50.09% - 68.69% 55.18% 44.72% - 65.64%
Feb '20 55.02% 46.16% - 63.88% 58.78% 43.40% - 74.16%
Mar '20 53.29% 44.61% - 61.98% 57.91% 46.31% - 69.51%
Apr '20 59.38%* 54.43% - 64.34% 64.94%* 55.91% - 73.98%
May '20 60.01%* 53.93% - 66.10% 62.34%* 51.64% - 73.04%
Jun '20 56.43% 49.58% - 63.27% 65.03%* 53.25% - 76.80%
Jul '20 61.48%* 54.36% - 68.60% 60.89%* 50.33% - 71.45%
Aug '20 63.27%* 54.41% - 72.13% 62.62%* 50.66% - 74.58%
Sep '20 65.94%* 59.27% - 72.61% 67.35%* 55.45% - 79.25%
Oct '20 58.44% 48.91% - 67.97% 56.62% 45.55% - 67.68%
Nov '20 58.18%* 51.65% - 64.72% 60.40%* 50.66% - 70.13%
Dec '20 49.47% 41.42% - 57.52% 48.17% 34.06% - 62.28%
Jan '21 55.62%* 50.12% - 61.12% 60.72%* 50.03% - 71.41%
Feb '21 56.97%* 50.21% - 63.74% 56.99% 42.69% - 71.29%
Mar '21 50.83% 44.75% - 56.91% 50.53% 37.88% - 63.18%
2019-07-01 - 2021-03-31 56.73%* 55.13% - 58.32% 58.72%* 56.33% - 61.10%

CME vs. Huobi Quarterly Futures (Chart)

CME vs. Huobi Quarterly Futures (Table)
Month CME IS Confidence Interval CME CS Confidence Interval
Aug '19 59.26%* 50.51% - 68.01% 57.18% 46.00% - 68.36%
Sep '19 61.11%* 50.50% - 71.73% 56.69% 44.90% - 68.49%
Oct '19 59.93%* 50.62% - 69.23% 57.76% 46.12% - 69.40%
Nov '19 52.74% 41.92% - 63.56% 48.58% 34.86% - 62.31%
Dec '19 66.59%* 59.53% - 73.65% 65.67%* 54.67% - 76.67%
Jan '20 50.80% 39.32% - 62.28% 48.19% 35.93% - 60.46%
Feb '20 58.46% 49.13% - 67.79% 52.99% 40.04% - 65.94%
Mar '20 51.83% 42.81% - 60.84% 51.37% 39.30% - 63.44%
Apr '20 53.23% 46.28% - 60.17% 51.40% 38.97% - 63.83%
May '20 62.29%* 54.49% - 70.09% 59.10% 48.14% - 70.06%
Jun '20 56.07% 46.94% - 65.20% 55.88% 44.49% - 67.26%
Jul '20 62.10%* 51.86% - 72.35% 58.99% 47.46% - 70.51%
Aug '20 61.82%* 55.32% - 68.32% 66.42%* 54.80% - 78.04%
Sep '20 58.81% 49.90% - 67.73% 60.03%* 50.48% - 69.57%
Oct '20 44.52% 36.53% - 52.51% 38.91% 27.20% - 50.62%
Nov '20 51.51% 44.68% - 58.33% 47.78% 33.99% - 61.58%
Dec '20 44.86% 36.33% - 53.40% 45.93% 36.74% - 55.12%
Jan '21 51.31% 42.25% - 60.37% 53.78% 43.30% - 64.26%
Feb '21 50.35% 40.93% - 59.77% 52.16% 39.77% - 64.55%
Mar '21 47.34% 39.83% - 54.84% 48.01% 37.40% - 58.62%
2019-08-01 - 2021-03-31 55.25%* 53.33% - 57.17% 53.85%* 51.36% - 56.33%

CME vs. OKEx Quarterly Futures (Chart)

CME vs. OKEx Quarterly Futures (Table)
Month CME IS Confidence Interval CME CS Confidence Interval
Oct '18 57.57% 43.38% - 71.76% 57.20% 44.97% - 69.43%
Nov '18 39.06%* 28.29% - 49.84% 38.94%* 28.32% - 49.57%
Dec '18 41.80% 30.72% - 52.88% 37.58%* 25.48% - 49.67%
Jan '19 57.28% 44.70% - 69.87% 50.95% 38.77% - 63.14%
Feb '19 56.77% 45.78% - 67.77% 49.54% 36.46% - 62.62%
Mar '19 56.63% 47.74% - 65.51% 49.10% 36.09% - 62.10%
Apr '19 60.75%* 50.24% - 71.27% 55.78% 42.55% - 69.01%
May '19 53.63% 43.54% - 63.73% 48.78% 36.89% - 60.66%
Jun '19 55.51% 48.60% - 62.42% 58.15%* 50.82% - 65.47%
Jul '19 54.64% 43.89% - 65.39% 53.26% 42.51% - 64.01%
Aug '19 53.63% 43.47% - 63.78% 52.86% 42.02% - 63.71%
Sep '19 57.66% 47.06% - 68.25% 50.70% 38.69% - 62.72%
Oct '19 58.75%* 50.13% - 67.38% 62.58%* 51.03% - 74.13%
Nov '19 47.52% 38.75% - 56.29% 44.62% 29.40% - 59.84%
Dec '19 58.20%* 51.15% - 65.26% 58.16% 44.40% - 71.91%
Jan '20 51.61% 41.84% - 61.37% 49.79% 40.25% - 59.33%
Feb '20 53.77% 45.17% - 62.36% 51.43% 36.71% - 66.14%
Mar '20 50.08% 41.87% - 58.29% 51.18% 39.02% - 63.34%
Apr '20 46.90% 39.53% - 54.27% 39.67% 26.92% - 52.41%
May '20 57.45%* 50.84% - 64.06% 54.88% 41.96% - 67.80%
Jun '20 53.02% 45.62% - 60.43% 54.44% 41.44% - 67.44%
Jul '20 59.85%* 50.53% - 69.17% 58.92% 48.01% - 69.84%
Aug '20 60.21%* 54.11% - 66.30% 63.33%* 53.10% - 73.56%
Sep '20 51.62% 43.40% - 59.85% 49.27% 37.06% - 61.47%
Oct '20 43.50% 35.44% - 51.56% 42.26% 32.32% - 52.19%
Nov '20 51.00% 42.86% - 59.14% 45.03% 31.94% - 58.12%
Dec '20 50.85% 43.75% - 57.96% 46.57% 34.26% - 58.87%
Jan '21 50.14% 42.27% - 58.01% 51.95% 40.36% - 63.54%
Feb '21 49.91% 40.85% - 58.96% 54.53% 43.62% - 65.44%
Mar '21 49.72% 43.08% - 56.36% 52.63% 39.75% - 65.51%
2018-10-03 - 2021-03-31 53.04%* 51.45% - 54.63% 51.22% 49.14% - 53.31%

Appendix C: List Of Time-Shift Lead-Lag Analysis Monthly Results
CME vs. Binance (Chart)

CME vs. Binance (Table)
Month Lead-Lag Time (seconds) Confidence Interval (seconds)
Dec '17 16.58 -0.74 - 33.90
Jan '18 24.16* 18.24 - 30.09
Feb '18 21.38* 14.71 - 28.05
Mar '18 15.23* 11.83 - 18.62
Apr '18 10.94* 8.55 - 13.34
May '18 14.19* 11.61 - 16.77
Jun '18 12.76* 8.26 - 17.27
Jul '18 6.97* 5.80 - 8.14
Aug '18 6.76* 5.71 - 7.80
Sep '18 6.08* 4.07 - 8.09
Oct '18 12.85* 8.00 - 17.70
Nov '18 5.47 -0.01 - 10.94
Dec '18 7.10* 5.83 - 8.37
Jan '19 10.65* 5.42 - 15.87
Feb '19 3.6 -5.97 - 13.17
Mar '19 1.76 -8.27 - 11.79
Apr '19 5.70* 3.69 - 7.72
May '19 3.95* 3.18 - 4.71
Jun '19 5.64* 4.24 - 7.04
Jul '19 3.37* 2.92 - 3.83
Aug '19 2.81* 2.40 - 3.22
Sep '19 3.36* 2.58 - 4.15
Oct '19 6.70* 1.84 - 11.55
Nov '19 4.38* 2.48 - 6.28
Dec '19 6.58* 1.14 - 12.03
Jan '20 2.81* 2.34 - 3.28
Feb '20 3.28* 2.22 - 4.35
Mar '20 3.28* 2.47 - 4.09
Apr '20 3.63* 2.20 - 5.05
May '20 2.49* 2.02 - 2.95
Jun '20 3.86* 2.45 - 5.28
Jul '20 5.48* 1.92 - 9.04
Aug '20 2.77* 2.04 - 3.50
Sep '20 5.39* 1.47 - 9.31
2017-12-18 - 2020-09-30 7.28* 6.53 - 8.03

CME vs. Bitfinex (Chart)

CME vs. Bitfinex (Table)
Month Lead-Lag Time (seconds) Confidence Interval (seconds)
Dec '17 1.09 -5.05 - 7.23
Jan '18 14.59* 9.79 - 19.40
Feb '18 14.29* 10.70 - 17.88
Mar '18 10.48* 7.70 - 13.25
Apr '18 7.58* 4.73 - 10.43
May '18 12.03* 9.23 - 14.82
Jun '18 10.62* 8.31 - 12.93
Jul '18 7.25* 6.11 - 8.38
Aug '18 8.46* 6.65 - 10.27
Sep '18 9.90* 7.05 - 12.75
Oct '18 18.61* 10.84 - 26.38
Nov '18 11.96* 4.97 - 18.95
Dec '18 7.89* 6.26 - 9.52
Jan '19 12.77* 7.42 - 18.12
Feb '19 16.14* 10.20 - 22.08
Mar '19 23.33* 15.22 - 31.45
Apr '19 10.11* 6.99 - 13.24
May '19 5.35* 4.14 - 6.57
Jun '19 7.14* 5.74 - 8.54
Jul '19 4.11* 3.72 - 4.51
Aug '19 4.34* 3.91 - 4.77
Sep '19 6.81* 3.22 - 10.40
Oct '19 5.35* 4.10 - 6.60
Nov '19 7.96* 4.35 - 11.57
Dec '19 11.28* 4.18 - 18.37
Jan '20 5.23* 4.31 - 6.15
Feb '20 6.03* 4.52 - 7.54
Mar '20 4.95* 3.30 - 6.61
Apr '20 4.12* 3.38 - 4.87
May '20 4.66* 2.64 - 6.68
Jun '20 7.16* 3.53 - 10.79
Jul '20 13.80* 6.64 - 20.96
Aug '20 5.10* 2.95 - 7.24
Sep '20 2.95* 2.52 - 3.38
2017-12-18 - 2020-09-30 9.03* 8.33 - 9.73
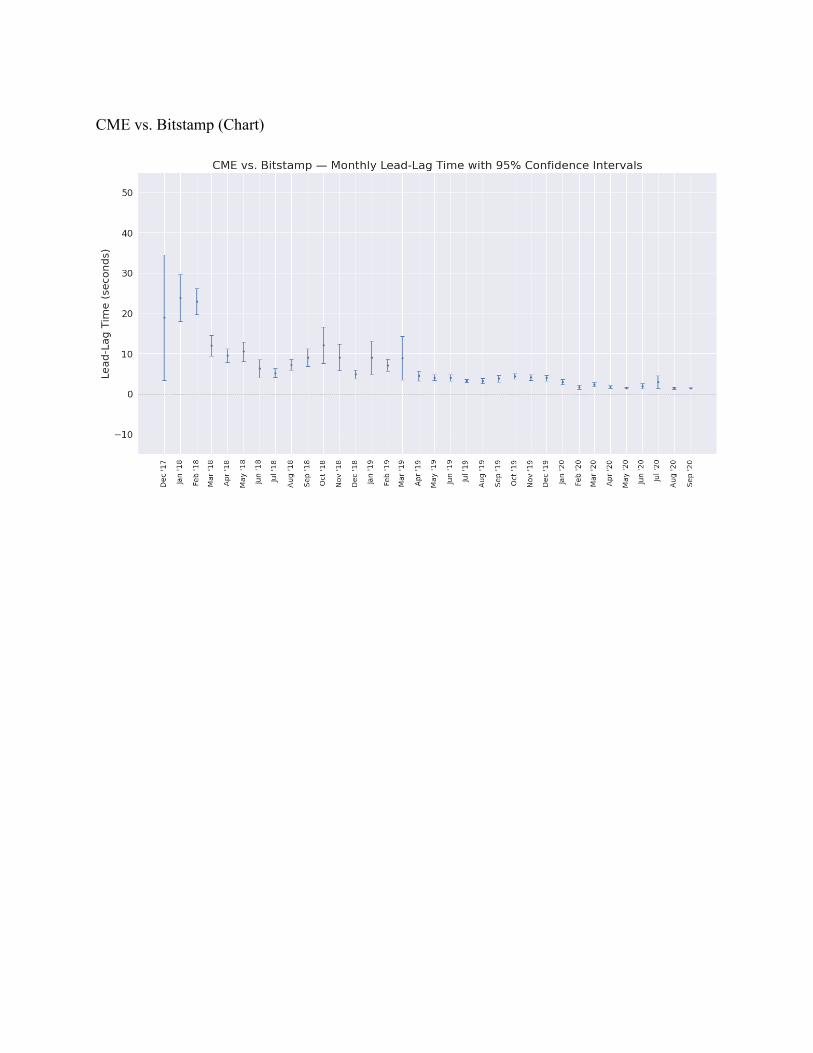
CME vs. Bitstamp (Chart)

CME vs. Bitstamp (Table)
Month Lead-Lag Time (seconds) Confidence Interval (seconds)
Dec '17 18.87* 3.31 - 34.43
Jan '18 23.77* 17.94 - 29.61
Feb '18 22.90* 19.72 - 26.08
Mar '18 11.96* 9.37 - 14.56
Apr '18 9.50* 7.82 - 11.19
May '18 10.46* 8.08 - 12.84
Jun '18 6.23* 3.94 - 8.51
Jul '18 5.14* 4.05 - 6.22
Aug '18 7.23* 5.88 - 8.59
Sep '18 8.98* 6.83 - 11.13
Oct '18 12.04* 7.55 - 16.54
Nov '18 9.04* 5.81 - 12.27
Dec '18 4.80* 3.74 - 5.86
Jan '19 8.92* 4.76 - 13.09
Feb '19 7.10* 5.63 - 8.57
Mar '19 8.86* 3.40 - 14.32
Apr '19 4.46* 3.24 - 5.68
May '19 3.98* 3.30 - 4.66
Jun '19 4.00* 3.22 - 4.78
Jul '19 3.16* 2.81 - 3.51
Aug '19 3.15* 2.49 - 3.80
Sep '19 3.79* 2.95 - 4.63
Oct '19 4.30* 3.68 - 4.93
Nov '19 4.02* 3.28 - 4.76
Dec '19 3.93* 3.22 - 4.64
Jan '20 2.95* 2.31 - 3.59
Feb '20 1.65* 1.10 - 2.21
Mar '20 2.31* 1.81 - 2.81
Apr '20 1.71* 1.36 - 2.07
May '20 1.43* 1.26 - 1.60
Jun '20 1.87* 1.27 - 2.48
Jul '20 2.94* 1.44 - 4.44
Aug '20 1.42* 1.18 - 1.66
Sep '20 1.38* 1.22 - 1.54
2017-12-18 - 2020-09-30 6.52* 5.96 - 7.08

CME vs. Coinbase (Chart)

CME vs. Coinbase (Table)
Month Lead-Lag Time (seconds) Confidence Interval (seconds)
Dec '17 26.16* 12.72 - 39.59
Jan '18 24.31* 17.89 - 30.73
Feb '18 26.91* 20.86 - 32.96
Mar '18 20.43* 15.52 - 25.34
Apr '18 12.46* 8.74 - 16.17
May '18 13.85* 10.11 - 17.59
Jun '18 8.92* 7.00 - 10.85
Jul '18 7.91* 6.49 - 9.33
Aug '18 10.30* 8.47 - 12.14
Sep '18 13.42* 9.22 - 17.62
Oct '18 20.79* 13.38 - 28.20
Nov '18 14.52* 6.63 - 22.42
Dec '18 5.67* 4.22 - 7.12
Jan '19 8.66* 6.48 - 10.83
Feb '19 11.58* 7.90 - 15.26
Mar '19 16.95* 9.75 - 24.16
Apr '19 4.07* 2.65 - 5.48
May '19 3.39* 2.62 - 4.16
Jun '19 3.93* 3.03 - 4.83
Jul '19 2.49* 2.23 - 2.75
Aug '19 3.17* 2.70 - 3.64
Sep '19 3.96* 2.58 - 5.35
Oct '19 3.37* 2.67 - 4.06
Nov '19 3.88* 2.00 - 5.75
Dec '19 2.32* 1.94 - 2.70
Jan '20 2.17* 1.79 - 2.55
Feb '20 2.80* 2.11 - 3.49
Mar '20 2.12* 1.65 - 2.58
Apr '20 2.26* 1.51 - 3.01
May '20 1.83* 1.69 - 1.96
Jun '20 2.26* 1.85 - 2.68
Jul '20 4.51* 2.08 - 6.93
Aug '20 2.36* 1.77 - 2.96
Sep '20 2.11* 1.77 - 2.46
2017-12-18 - 2020-09-30 8.42* 7.65 - 9.18

CME vs. Gemini (Chart)

CME vs. Gemini (Table)
Month Lead-Lag Time (seconds) Confidence Interval (seconds)
Dec '17 4.36 -2.08 - 10.80
Jan '18 18.52* 14.00 - 23.04
Feb '18 17.22* 13.38 - 21.06
Mar '18 15.40* 12.35 - 18.45
Apr '18 10.29* 7.29 - 13.28
May '18 8.71* 5.07 - 12.36
Jun '18 6.70* 4.75 - 8.64
Jul '18 4.65* 3.46 - 5.85
Aug '18 7.11* 4.17 - 10.06
Sep '18 8.54* 3.93 - 13.15
Oct '18 16.00* 7.40 - 24.60
Nov '18 9.21* 4.93 - 13.49
Dec '18 6.51* 5.09 - 7.93
Jan '19 5.90* 4.07 - 7.72
Feb '19 11.64* 4.81 - 18.47
Mar '19 13.49* 7.24 - 19.74
Apr '19 3.93* 2.72 - 5.14
May '19 3.28* 2.40 - 4.16
Jun '19 3.87* 2.97 - 4.77
Jul '19 2.75* 2.17 - 3.32
Aug '19 3.04* 2.41 - 3.66
Sep '19 3.63* 2.55 - 4.71
Oct '19 3.90* 2.34 - 5.45
Nov '19 3.75* 2.42 - 5.09
Dec '19 2.97* 2.30 - 3.64
Jan '20 2.92* 2.41 - 3.44
Feb '20 4.37* 3.58 - 5.16
Mar '20 2.37* 1.88 - 2.87
Apr '20 2.20* 1.41 - 2.99
May '20 2.06* 1.77 - 2.35
Jun '20 2.00* 1.62 - 2.38
Jul '20 3.97* 2.34 - 5.59
Aug '20 2.91* 1.74 - 4.08
Sep '20 1.86* 1.59 - 2.12
2017-12-18 - 2020-09-30 6.51* 5.91 - 7.11

CME vs. Huobi (Chart)

CME vs. Huobi (Table)
Month Lead-Lag Time (seconds) Confidence Interval (seconds)
Mar '18 24.21* 18.46 - 29.95
Apr '18 14.86* 11.03 - 18.69
May '18 14.50* 11.59 - 17.41
Jun '18 14.56* 11.00 - 18.13
Jul '18 9.14* 8.54 - 9.73
Aug '18 10.92* 9.49 - 12.36
Sep '18 9.44* 7.68 - 11.20
Oct '18 16.70* 11.80 - 21.59
Nov '18 14.30* 7.24 - 21.35
Dec '18 7.57* 6.43 - 8.71
Jan '19 10.87* 8.62 - 13.12
Feb '19 10.28* 8.32 - 12.24
Mar '19 13.88* 9.65 - 18.11
Apr '19 4.78 -0.11 - 9.67
May '19 5.02* 4.58 - 5.46
Jun '19 5.75* 4.91 - 6.59
Jul '19 3.64* 3.18 - 4.11
Aug '19 3.10* 2.62 - 3.58
Sep '19 3.46* 2.55 - 4.36
Oct '19 4.43* 2.48 - 6.37
Nov '19 3.94* 1.31 - 6.57
Dec '19 2.76* 2.37 - 3.16
Jan '20 2.56* 2.26 - 2.86
Feb '20 2.96* 2.38 - 3.54
Mar '20 3.07* 2.34 - 3.81
Apr '20 2.91* 2.03 - 3.80
May '20 2.02* 1.72 - 2.32
Jun '20 3.15* 2.14 - 4.17
Jul '20 4.15* 1.90 - 6.39
Aug '20 3.25* 1.77 - 4.73
Sep '20 2.70* 2.13 - 3.26
2018-03-01 - 2020-09-30 7.57* 6.96 - 8.18

CME vs. itBit (Chart)

CME vs. itBit (Table)
Month Lead-Lag Time (seconds) Confidence Interval (seconds)
Dec '17 13.58 -0.86 - 28.01
Jan '18 25.57* 19.88 - 31.27
Feb '18 25.33* 20.01 - 30.65
Mar '18 18.86* 16.42 - 21.29
Apr '18 14.77* 9.81 - 19.73
May '18 14.83* 10.00 - 19.67
Jun '18 10.15* 8.40 - 11.90
Jul '18 8.56* 6.53 - 10.60
Aug '18 10.59* 7.84 - 13.34
Sep '18 9.42* 6.02 - 12.82
Oct '18 11.40* 5.65 - 17.15
Nov '18 7.43* 3.66 - 11.20
Dec '18 7.72* 1.97 - 13.47
Jan '19 6.54* 2.53 - 10.56
Feb '19 6.67* 3.83 - 9.52
Mar '19 15.44* 10.54 - 20.34
Apr '19 7.38* 4.69 - 10.07
May '19 5.03* 3.96 - 6.10
Jun '19 4.95* 3.99 - 5.91
Jul '19 3.30* 2.75 - 3.85
Aug '19 3.49* 2.84 - 4.14
Sep '19 3.51* 2.52 - 4.51
Oct '19 6.02* 2.87 - 9.17
Nov '19 1.66 -3.45 - 6.76
Dec '19 6.08* 3.47 - 8.68
Jan '20 6.10* 2.09 - 10.12
Feb '20 4.33* 3.22 - 5.43
Mar '20 3.76* 1.75 - 5.78
Apr '20 2.76* 2.36 - 3.16
May '20 2.89* 2.36 - 3.41
Jun '20 5.92* 0.96 - 10.88
Jul '20 7.97* 1.65 - 14.28
Aug '20 5.97* 3.14 - 8.80
Sep '20 6.84* 2.49 - 11.19
2017-12-18 - 2020-09-30 8.63* 7.89 - 9.37

CME vs. Kraken (Chart)

CME vs. Kraken (Table)
Month Lead-Lag Time (seconds) Confidence Interval (seconds)
Dec '17 39.91* 20.45 - 59.38
Jan '18 35.66* 20.18 - 51.13
Feb '18 42.38* 38.21 - 46.55
Mar '18 37.23* 32.49 - 41.97
Apr '18 31.17* 24.90 - 37.45
May '18 31.59* 25.75 - 37.43
Jun '18 33.53* 28.91 - 38.16
Jul '18 21.09* 14.18 - 28.00
Aug '18 18.33* 14.62 - 22.04
Sep '18 23.13* 16.66 - 29.60
Oct '18 24.24* 18.12 - 30.37
Nov '18 15.29* 5.03 - 25.54
Dec '18 15.35* 13.03 - 17.67
Jan '19 17.63* 11.96 - 23.30
Feb '19 17.34* 10.70 - 23.98
Mar '19 26.30* 19.11 - 33.48
Apr '19 9.49* 5.13 - 13.85
May '19 10.15* 8.35 - 11.96
Jun '19 15.48* 8.50 - 22.46
Jul '19 8.37* 7.17 - 9.56
Aug '19 9.35* 6.97 - 11.74
Sep '19 11.97* 7.77 - 16.18
Oct '19 7.82* 5.87 - 9.77
Nov '19 7.52* 4.32 - 10.73
Dec '19 8.65* 3.93 - 13.37
Jan '20 9.24* 5.02 - 13.46
Feb '20 10.76* 6.43 - 15.09
Mar '20 8.62* 4.26 - 12.98
Apr '20 7.30* 3.02 - 11.57
May '20 4.57* 2.12 - 7.02
Jun '20 8.73* 4.22 - 13.23
Jul '20 14.94* 8.56 - 21.31
Aug '20 8.82* 6.23 - 11.41
Sep '20 6.96* 4.04 - 9.88
2017-12-18 - 2020-09-30 17.19* 16.00 - 18.38

CME vs. LBank (Chart)

CME vs. LBank (Table)
Month Lead-Lag Time (seconds) Confidence Interval (seconds)
Mar '18 37.55* 29.64 - 45.46
Apr '18 37.64* 31.68 - 43.59
May '18 31.65* 25.83 - 37.47
Jun '18 39.79* 30.78 - 48.80
Jul '18 37.56* 31.61 - 43.52
Aug '18 30.40* 25.05 - 35.75
Sep '18 23.45* 16.56 - 30.34
Oct '18 41.35* 33.97 - 48.73
Nov '18 25.55* 18.79 - 32.32
Dec '18 21.23* 17.05 - 25.41
Jan '19 20.04* 12.93 - 27.15
Feb '19 23.18* 15.32 - 31.04
Mar '19 27.57* 20.13 - 35.01
Apr '19 12.37* 7.10 - 17.64
May '19 6.86* 5.61 - 8.12
Jun '19 8.22* 6.47 - 9.97
Jul '19 7.83* 5.42 - 10.23
Aug '19 6.76* 5.36 - 8.17
Sep '19 5.99* 5.08 - 6.90
Oct '19 6.07* 5.18 - 6.96
Nov '19 8.62* 5.51 - 11.73
Dec '19 7.42* 2.47 - 12.37
Jan '20 5.29* 4.34 - 6.23
Feb '20 6.21* 4.60 - 7.82
Mar '20 7.42* 4.16 - 10.68
Apr '20 6.65* 5.95 - 7.35
May '20 5.21* 4.25 - 6.17
Jun '20 4.61* 4.02 - 5.20
Jul '20 6.54* 4.15 - 8.93
Aug '20 4.04* 3.41 - 4.67
Sep '20 7.32* 4.52 - 10.13
2018-03-14 - 2020-09-30 16.62* 15.37 - 17.87

CME vs. OKEx (Chart)

CME vs. OKEx (Table)
Month Lead-Lag Time (seconds) Confidence Interval (seconds)
Dec '17 22.71* 5.45 - 39.97
Jan '18 17.06* 13.82 - 20.30
Feb '18 23.70* 15.14 - 32.26
Mar '18 25.89* 18.20 - 33.58
Apr '18 18.18* 11.57 - 24.79
May '18 16.97* 7.33 - 26.61
Jun '18 9.83* 5.90 - 13.77
Jul '18 9.99* 5.24 - 14.74
Aug '18 7.73* 4.68 - 10.78
Sep '18 9.28 -0.23 - 18.79
Oct '18 14.37* 10.34 - 18.41
Nov '18 10.79* 5.82 - 15.76
Dec '18 6.57* 4.88 - 8.26
Jan '19 8.41* 6.29 - 10.53
Feb '19 11.96* 1.94 - 21.98
Mar '19 14.02* 7.52 - 20.52
Apr '19 7.43* 2.86 - 12.00
May '19 4.56* 3.98 - 5.15
Jun '19 5.84* 4.43 - 7.25
Jul '19 3.41* 2.73 - 4.09
Aug '19 2.63* 2.38 - 2.88
Sep '19 2.73* 2.32 - 3.14
Oct '19 3.02* 2.64 - 3.39
Nov '19 2.75* 2.46 - 3.04
Dec '19 2.41* 2.20 - 2.62
Jan '20 2.51* 2.10 - 2.92
Feb '20 2.76* 2.23 - 3.29
Mar '20 2.65* 2.00 - 3.30
Apr '20 3.90* 2.19 - 5.60
May '20 2.11* 1.78 - 2.45
Jun '20 3.52* 2.32 - 4.72
Jul '20 5.65* 1.49 - 9.82
Aug '20 2.24* 1.53 - 2.95
Sep '20 2.62* 1.73 - 3.51
2017-12-18 - 2020-09-30 8.27* 7.41 - 9.13

CME vs. Binance Perpetual Futures (Chart)

CME vs. Binance Perpetual Futures (Table)
Month Lead-Lag Time (seconds) Confidence Interval (seconds)
Sep '19 2.60* 1.64 - 3.56
Oct '19 3.63* 2.03 - 5.24
Nov '19 4.56 -3.10 - 12.22
Dec '19 3.70* 1.97 - 5.42
Jan '20 2.03* 1.64 - 2.42
Feb '20 1.64* 1.21 - 2.07
Mar '20 4.12* 2.03 - 6.20
Apr '20 4.21* 2.41 - 6.00
May '20 2.32* 1.66 - 2.99
Jun '20 4.08 -0.20 - 8.36
Jul '20 3.59* 2.14 - 5.04
Aug '20 1.94* 1.38 - 2.51
Sep '20 2.19* 1.41 - 2.97
Oct '20 1.95* 1.41 - 2.50
Nov '20 2.29* 1.29 - 3.29
Dec '20 4.21 -0.80 - 9.22
Jan '21 2.19* 1.84 - 2.54
Feb '21 2.41* 1.84 - 2.98
Mar '21 4.28* 1.83 - 6.73
2019-09-09 - 2021-03-31 3.07* 2.50 - 3.65

CME vs. BitMEX Perpetual Futures (Chart)
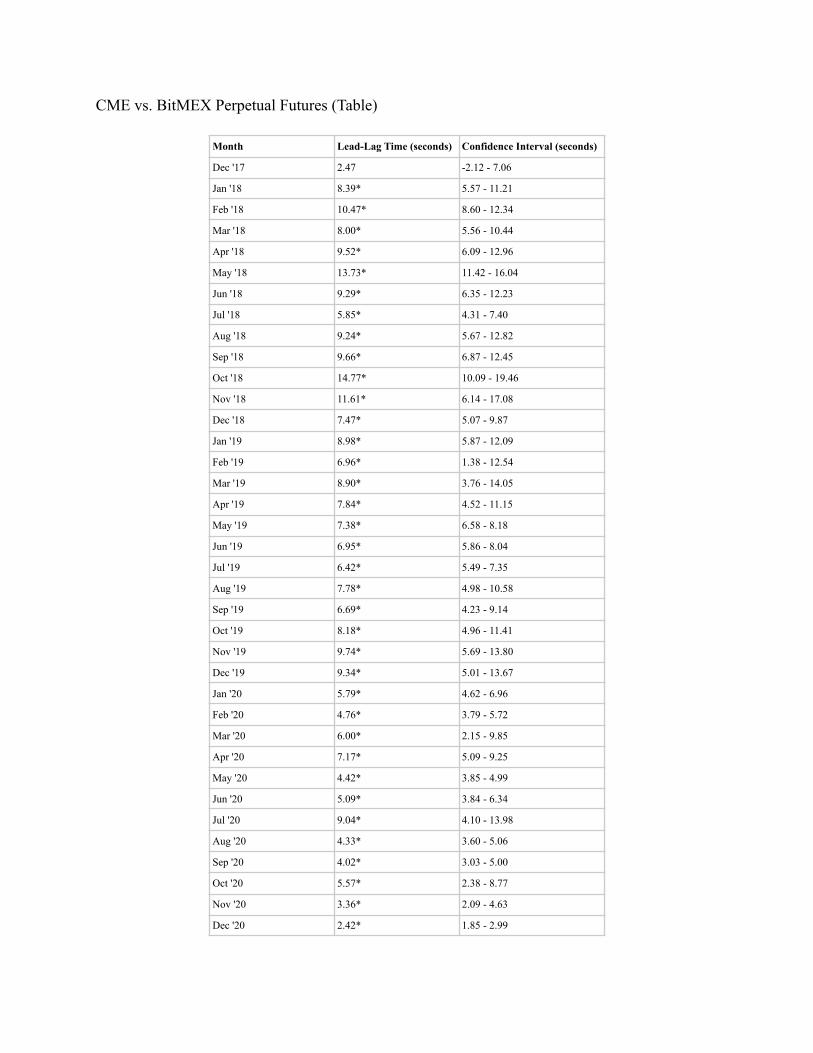
CME vs. BitMEX Perpetual Futures (Table)
Month Lead-Lag Time (seconds) Confidence Interval (seconds)
Dec '17 2.47 -2.12 - 7.06
Jan '18 8.39* 5.57 - 11.21
Feb '18 10.47* 8.60 - 12.34
Mar '18 8.00* 5.56 - 10.44
Apr '18 9.52* 6.09 - 12.96
May '18 13.73* 11.42 - 16.04
Jun '18 9.29* 6.35 - 12.23
Jul '18 5.85* 4.31 - 7.40
Aug '18 9.24* 5.67 - 12.82
Sep '18 9.66* 6.87 - 12.45
Oct '18 14.77* 10.09 - 19.46
Nov '18 11.61* 6.14 - 17.08
Dec '18 7.47* 5.07 - 9.87
Jan '19 8.98* 5.87 - 12.09
Feb '19 6.96* 1.38 - 12.54
Mar '19 8.90* 3.76 - 14.05
Apr '19 7.84* 4.52 - 11.15
May '19 7.38* 6.58 - 8.18
Jun '19 6.95* 5.86 - 8.04
Jul '19 6.42* 5.49 - 7.35
Aug '19 7.78* 4.98 - 10.58
Sep '19 6.69* 4.23 - 9.14
Oct '19 8.18* 4.96 - 11.41
Nov '19 9.74* 5.69 - 13.80
Dec '19 9.34* 5.01 - 13.67
Jan '20 5.79* 4.62 - 6.96
Feb '20 4.76* 3.79 - 5.72
Mar '20 6.00* 2.15 - 9.85
Apr '20 7.17* 5.09 - 9.25
May '20 4.42* 3.85 - 4.99
Jun '20 5.09* 3.84 - 6.34
Jul '20 9.04* 4.10 - 13.98
Aug '20 4.33* 3.60 - 5.06
Sep '20 4.02* 3.03 - 5.00
Oct '20 5.57* 2.38 - 8.77
Nov '20 3.36* 2.09 - 4.63
Dec '20 2.42* 1.85 - 2.99

Jan '21 1.87* 1.61 - 2.13
Feb '21 2.17* 1.94 - 2.40
Mar '21 3.11* 2.61 - 3.61
2017-12-18 - 2021-03-31 7.23* 6.76 - 7.70

CME vs. Bybit Perpetual Futures (Chart)

CME vs. Bybit Perpetual Futures (Table)
Month Lead-Lag Time (seconds) Confidence Interval (seconds)
Oct '19 6.82* 5.20 - 8.43
Nov '19 7.82* 5.36 - 10.28
Dec '19 4.25 -1.30 - 9.80
Jan '20 5.51* 4.36 - 6.67
Feb '20 4.40* 3.81 - 4.99
Mar '20 4.46* 2.53 - 6.40
Apr '20 4.91* 3.55 - 6.27
May '20 3.75* 3.01 - 4.49
Jun '20 4.99* 3.18 - 6.80
Jul '20 11.15* 4.87 - 17.43
Aug '20 4.86* 2.70 - 7.01
Sep '20 5.12* 3.99 - 6.26
Oct '20 5.95* 1.97 - 9.92
Nov '20 4.44* 3.39 - 5.49
Dec '20 3.23* 2.59 - 3.87
Jan '21 2.59* 2.12 - 3.06
Feb '21 3.89* 2.83 - 4.95
Mar '21 4.38* 3.34 - 5.43
2019-10-01 - 2021-03-31 5.13* 4.56 - 5.70

CME vs. Deribit Perpetual Futures (Chart)

CME vs. Deribit Perpetual Futures (Table)
Month Lead-Lag Time (seconds) Confidence Interval (seconds)
Aug '18 8.59* 6.69 - 10.48
Sep '18 11.50* 8.67 - 14.33
Oct '18 23.22* 16.78 - 29.66
Nov '18 12.56* 6.82 - 18.30
Dec '18 6.30* 4.93 - 7.67
Jan '19 8.10* 4.87 - 11.32
Feb '19 8.36* 5.56 - 11.16
Mar '19 11.06* 6.11 - 16.01
Apr '19 5.30* 4.03 - 6.56
May '19 4.08* 3.52 - 4.64
Jun '19 4.43* 3.62 - 5.24
Jul '19 3.09* 2.84 - 3.34
Aug '19 3.06* 2.61 - 3.52
Sep '19 3.56* 2.85 - 4.27
Oct '19 3.73* 2.77 - 4.69
Nov '19 4.97* 2.70 - 7.24
Dec '19 2.50* 2.10 - 2.91
Jan '20 2.17* 1.73 - 2.62
Feb '20 2.46* 1.92 - 3.01
Mar '20 2.61* 1.52 - 3.70
Apr '20 2.50* 1.79 - 3.20
May '20 3.13* 1.14 - 5.12
Jun '20 2.94* 1.91 - 3.96
Jul '20 5.20* 1.80 - 8.60
Aug '20 2.37* 1.60 - 3.14
Sep '20 1.64* 1.40 - 1.88
Oct '20 2.26* 1.27 - 3.26
Nov '20 1.64* 1.41 - 1.87
Dec '20 1.62* 1.42 - 1.82
Jan '21 1.47* 1.34 - 1.60
Feb '21 1.67* 1.44 - 1.90
Mar '21 1.65* 1.46 - 1.84
2018-08-14 - 2021-03-31 4.98* 4.47 - 5.49

CME vs. FTX Perpetual Futures (Chart)

CME vs. FTX Perpetual Futures (Table)
Month Lead-Lag Time (seconds) Confidence Interval (seconds)
Jul '19 2.76* 0.59 - 4.92
Aug '19 2.92* 2.16 - 3.67
Sep '19 4.16* 2.22 - 6.10
Oct '19 2.48* 2.06 - 2.90
Nov '19 3.00* 2.38 - 3.62
Dec '19 1.77* 1.60 - 1.95
Jan '20 1.59* 1.43 - 1.75
Feb '20 1.72* 1.51 - 1.92
Mar '20 1.75* 1.36 - 2.13
Apr '20 1.97* 1.70 - 2.24
May '20 1.58* 1.47 - 1.69
Jun '20 1.76* 1.55 - 1.97
Jul '20 3.56* 1.11 - 6.00
Aug '20 2.04* 1.83 - 2.25
Sep '20 2.39* 1.98 - 2.81
Oct '20 2.87* 2.00 - 3.74
Nov '20 1.78* 1.61 - 1.95
Dec '20 1.72* 1.50 - 1.95
Jan '21 1.78* 1.56 - 2.00
Feb '21 2.09* 1.77 - 2.41
Mar '21 1.96* 1.77 - 2.15
2019-07-01 - 2021-03-31 2.27* 2.08 - 2.46

CME vs. Huobi Quarterly Futures (Chart)

CME vs. Huobi Quarterly Futures (Table)
Month Lead-Lag Time (seconds) Confidence Interval (seconds)
Aug '19 3.20* 2.73 - 3.67
Sep '19 3.50* 2.76 - 4.23
Oct '19 3.91* 3.12 - 4.70
Nov '19 2.95* 2.49 - 3.42
Dec '19 3.05* 2.65 - 3.45
Jan '20 2.40* 1.84 - 2.96
Feb '20 2.81* 1.95 - 3.67
Mar '20 2.85* 2.17 - 3.52
Apr '20 2.29* 1.92 - 2.66
May '20 2.47* 1.93 - 3.00
Jun '20 1.92* 1.63 - 2.20
Jul '20 1.51* 1.33 - 1.69
Aug '20 1.26* 1.20 - 1.32
Sep '20 1.24* 1.14 - 1.33
Oct '20 2.31* 1.31 - 3.31
Nov '20 1.86* 1.48 - 2.24
Dec '20 1.64* 1.45 - 1.83
Jan '21 1.64* 1.45 - 1.83
Feb '21 1.96* 1.69 - 2.23
Mar '21 1.77* 1.61 - 1.94
2019-08-01 - 2021-03-31 2.34* 2.21 - 2.47

CME vs. OKEx Quarterly Futures (Chart)

CME vs. OKEx Quarterly Futures (Table)
Month Lead-Lag Time (seconds) Confidence Interval (seconds)
Oct '18 8.20* 3.80 - 12.60
Nov '18 5.32* 2.20 - 8.44
Dec '18 2.83* 2.39 - 3.27
Jan '19 3.98* 3.19 - 4.77
Feb '19 3.38* 2.82 - 3.94
Mar '19 4.70* 3.34 - 6.05
Apr '19 2.36* 1.98 - 2.75
May '19 2.44* 2.08 - 2.79
Jun '19 2.69* 1.96 - 3.42
Jul '19 2.69* 1.27 - 4.11
Aug '19 1.96* 1.62 - 2.31
Sep '19 -0.73 -6.92 - 5.46
Oct '19 6.63* 2.29 - 10.98
Nov '19 5.01 -0.40 - 10.42
Dec '19 8.30* 1.70 - 14.89
Jan '20 2.13* 1.74 - 2.53
Feb '20 7.85* 0.78 - 14.92
Mar '20 5.66* 1.49 - 9.83
Apr '20 3.30* 1.85 - 4.74
May '20 2.57* 1.81 - 3.34
Jun '20 2.33* 0.80 - 3.85
Jul '20 6.69* 0.42 - 12.97
Aug '20 2.01* 1.59 - 2.43
Sep '20 1.61* 1.30 - 1.91
Oct '20 1.88* 1.35 - 2.41
Nov '20 1.44* 1.16 - 1.72
Dec '20 1.51* 1.19 - 1.83
Jan '21 1.55* 1.38 - 1.72
Feb '21 1.96* 1.55 - 2.37
Mar '21 1.82* 1.42 - 2.21
2018-10-01 - 2021-03-31 3.47* 2.94 - 4.00