Embed Size (px)
Citation preview

1For professional clients only*
This document is for the exclusive use of investors acting on their own account and categorised either as “eligible counterparties” or “professional clients” within the meaning of markets in financial instruments directive 2004/39/ce.
Informed Investor: Money Monitor February 2018
By Marlène Hassine Konqui, Head of ETF Research and Kristo Durbaku, ETF Research Analyst
-€412M€537M
Positive month for Commodities
Significant outflows for Smart Beta
European ETF Market flows slowed in February but remain at record levels for the first two months of any year. Net New Assets (NNA) fell to €7.6bn from the stellar €13.4bn we saw in January. Equities attracted most of the inflows (€5.4bn) despite Global Equity ETFs recording their worst month ever (-€1.8bn).
ETFs enjoy their best ever start to a year
�ETF�flows�slowed�to�€7.6bn�in�February�from�€13.4bn
Still�an�outstanding�start�to�the�year� for�ETFs�� €7.6bn
What happened last month?
Slight pick-up for Fixed income
€5.4bn €1.7bn
Another strong month for Equities
Source: Monthly data in EURM from 01/02/2018 to 28/02/2018, Bloomberg, Lyxor. The figures relatingto past performances refer to past periods and are not a reliable indicator for future results.

2For professional clients only*
This document is for the exclusive use of investors acting on their own account and categorised either as “eligible counterparties” or “professional clients” within the meaning of markets in financial instruments directive 2004/39/ce.
US equities inflows accelerated (€2.3bn vs. €1.7bn in January 2018)
Strong, albeit slightly less positive, month for Europe Equities (€2.9bn vs. €3.7bn in January 2018)
Global equity ETFs endured their worst month ever (-€1.8bn)
Inflows of €1.1bn into Japan equities – continuing their best ever start to a year
Developed market government bonds enjoyed their best month ever (€1.7bn vs. -€236M)
Strong rebound for European government bonds (€1.1bn vs. -€485M)
Weaker month for inflation-linked bonds at €158M (vs. €645M) Slower month for Emerging
Markets government bonds at €174M (vs. €896M)
What were the major trends?
Monthly Net inflows on European Equity ETFs
Monthly Net inflows on European Fixed Income ETFs
Strong month for Equities
Slight pick-up for Fixed Income
Source: Monthly data in EURM from 01/02/2018 to 28/02/2018, Bloomberg, Lyxor. The figures relatingto past performances refer to past periods and are not a reliable indicator for future results.
€1.7bn
€5.4bn
1,733Developed
Market Govies 1,058
Europe Govies
-8Corporate
Bonds
174Emerging
Market Govies
-1,179High Yield
158 Inflation Linked602
US Govies 413Money Market
6,192Developed
Market Equities
2,285US Equities
2,918Europe Equities
1 005Emerging Market
Equities
-1,770Global Equities
932World Equities
1,125Asia Pacific Equities
Worst month ever for High Yield bonds
3For professional clients only*
This document is for the exclusive use of investors acting on their own account and categorised either as “eligible counterparties” or “professional clients” within the meaning of markets in financial instruments directive 2004/39/ce.
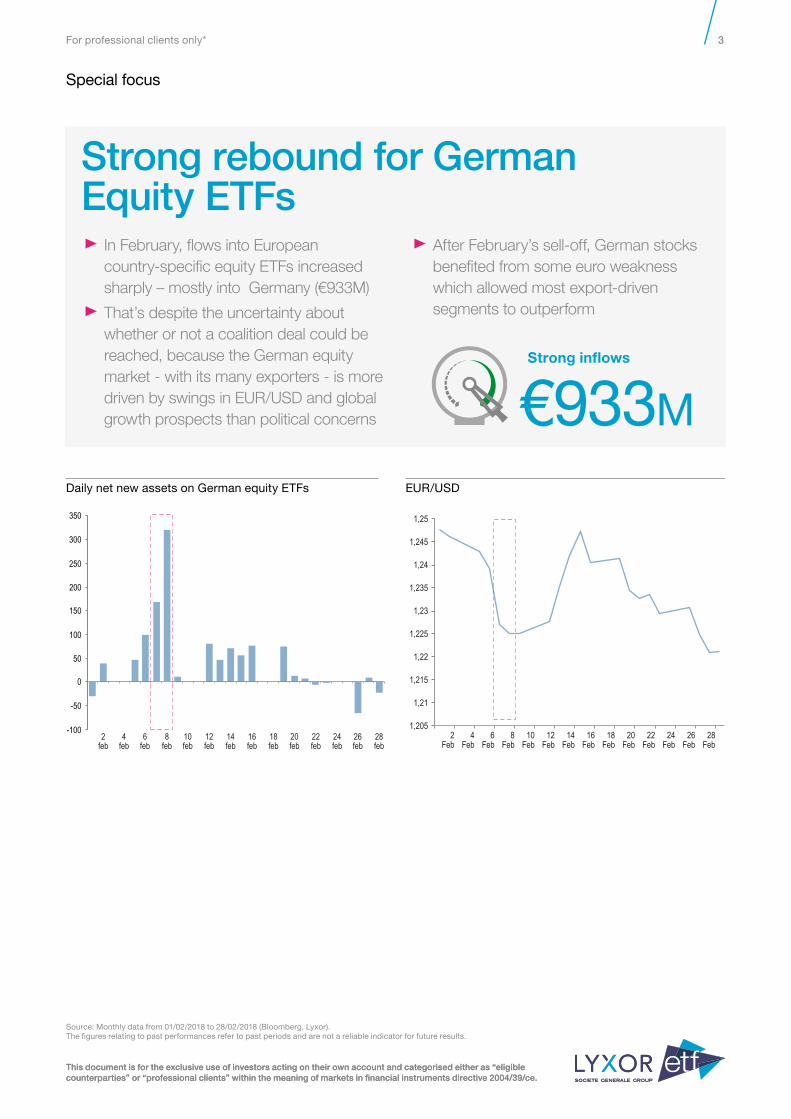
Strong rebound for German Equity ETFs In�February,�flows�into�European�
country-specific�equity�ETFs�increased�sharply�–�mostly�into��Germany�(€933M)�
That’s�despite�the�uncertainty�about�whether�or�not�a�coalition�deal�could�be�reached,�because�the�German�equity�market�-�with�its�many�exporters�-�is�more�driven�by�swings�in�EUR/USD�and�global�growth�prospects�than�political�concerns�
After�February’s�sell-off,�German�stocks�benefited�from�some�euro�weakness�which�allowed�most�export-driven�segments�to�outperform�
Special focus
Daily net new assets on German equity ETFs EUR/USD
This document is for the exclusive use of investors acting on their own account and categorised either as “eligible counterparties” or “professional clients” within the meaning of markets in financial instruments directive 2004/39/ce.
350
300
250
200
150
100
50
0
-50
-1004
feb2
feb6
feb10feb
12feb
14feb
16feb
18feb
20feb
22feb
24feb
26feb
28feb
8feb
Source: Monthly data from 01/02/2018 to 28/02/2018 (Bloomberg, Lyxor). The figures relating to past performances refer to past periods and are not a reliable indicator for future results.
1,205
1,21
1,215
1,22
1,225
1,23
1,235
1,24
1,245
1,25
US inflation ETF NNAEurope inflation ETF NNA
2Feb
4Feb
6Feb
8Feb
10Feb
12Feb
14Feb
16Feb
18Feb
20Feb
22Feb
24Feb
26Feb
28Feb
€933mStrong inflows

4For professional clients only*
This document is for the exclusive use of investors acting on their own account and categorised either as “eligible counterparties” or “professional clients” within the meaning of markets in financial instruments directive 2004/39/ce.
436804
-1,237-81
1,0707085731,497
3,043
567
2,726
694
6,574
2,293
3,940
1,013
17,075
Total Equities
Developed Market Equities
USEquities
MoneyMarket
InflationLinkedHigh
YieldCorporate
Bonds
EmergingMarketGoviesUS
GoviesEuropeGovies
Developed Market Govies
TotalFixed
Income
All World
EmergingMarket Equities
Developed World
EuropeEquities
AsiaPacificEquities
Commodities
13,782
Record for Commodity ETFs after two months (€1.0bn)
What does it all mean?
Explore our online analytics toolswww.lyxoretf.co.uk/en/instit/etfresearch/type/monthly-flows
Discover more
Source: Monthly data in EURM from 01/01/2018 to 28/02/2018, Bloomberg, Lyxor. The figures relatingto past performances refer to past periods and are not a reliable indicator for future results.
Find out whether the money is going to the right place with our Manager Monitor
Read more
Check out our key investment calls with the Latest from Lyxor
Read more
Check out the most relevant big investment idea
Read more
YTD Net Inflows on European ETFs by asset class
€20.8bn
Total AUM is up 3% since 2017ETFs on the rise
€652bn
Still the best start to a year for ETFs
Best start to a year for Equity ETFs with €17.1bn of inflows
Modest start for Fixed income ETFs (€3.0bn )

5For professional clients only*
This document is for the exclusive use of investors acting on their own account and categorised either as “eligible counterparties” or “professional clients” within the meaning of markets in financial instruments directive 2004/39/ce.
Appendix: The month in numbersTotal
Equity Equity Emerging MarketBest start to a year for Equity ETFs with €17.2bn of inflows Cumulated monthly NNA on equity ETFs
Fixed income CommoditiesModest start for Fixed income ETFs (€2.5bn ) Cumulated monthly NNA on fixed income ETFs
European ETFs in February 2018 Net Inflows (EURm)NNA slowed to €7.6bn from €13.4bn in January Monthly NNA on European ETFs
Outstanding start to a year for European ETFs Cumulated monthly NNA w assets on European ETFs
Record start for Emerging Markets Equity ETFs (€986bn) Cumulated monthly NNA on emerging market equity ETFs
A new record for Commodity ETFs (€986bn) Cumulated monthly NNA on commodity ETFs
10,164
4,507
10,186
8,272
7,646
8,340
3,228
6,888
7,08910,364
4,119
13,531
0 2,000 4,000 6,000 8,000 10,000 16,00012,000 14,000
Jan-2018
Feb-2018
Mar-2017
Apr-2017
May-2017
Jun-2017
Jul-2017
Aug-2017
Sep-2017
Nov-2017
Dec-2017
Oct-2017
2015 2016 2017 2018
0
10,000
20,000
30,000
40,000
50,000
60,000
70,000
80,000
90,000
100,000
Jan Feb Mar Apr May Jun Jul Aug Sep Oct Nov Dec
0
Jan Feb Mar Apr May Jun Jul Aug Sep Oct Nov Dec-10,000
10,000
20,000
30,000
40,000
50,000
60,000
70,000 2015 2016 2017 2018
0
5,000
10,000
15,000
20,000
25,000
30,000
Jan Feb Mar Apr May Jun Jul Aug Sep Oct Nov Dec
2015 2016 2017 2018
-4,000
4,000
6,000
8,000
10,000
-2,000
2,000
0
Jan Feb Mar Apr May Jun Jul Aug Sep Oct Nov Dec
2015 2016 2017 2018
Jan Feb Mar Apr May Jun Jul Aug Sep Oct Nov Dec
2015 2016 2017 2018
3,000
3,500
2,500
2,000
-500
1,500
1,000
500
0
Source: Monthly data in EURM from 01/01/2015 to 28/02/2018, Bloomberg, Lyxor. The figures relatingto past performances refer to past periods and are not a reliable indicator for future results.

6For professional clients only*
This document is for the exclusive use of investors acting on their own account and categorised either as “eligible counterparties” or “professional clients” within the meaning of markets in financial instruments directive 2004/39/ce.
Fixed IncomeSlight increase for Fixed income ETFs (€1.4bn) Monthly NNA on fixed income ETFs
CommoditiesVery positive month for commodities (€537M) Monthly NNA on commodity ETFs
EquityEquity ETFs NNA halved but still strong (€5.4bn) Monthly NNA on equity ETFs
Developed market equities outdo EM peers Monthly NNA on developed vs. emerging markets equity ETFs
Developed markets bonds gather most of the flows Monthly NNA on developed vs. emerging markets fixed income ETFs
Broad commodity ETFs gather all the flows Monthly NNA on broad & precious metals ETFs
0
2,000
4,000
6,000
8,000
10,000
12,000
14,000
Nov-2017
Dec-2017
Jan-2018
Feb-2018
Mar-2017
Apr-2017
May-2017
Jun-2017
Jul-2017
Aug-2017
Sep-2017
Oct-2017
0
1,000
2,000
3,000
4,000
5,000
Nov-2017
Dec-2017
Jan-2018
Feb-2018
Mar-2017
Apr-2017
May-2017
Jun-2017
Jul-2017
Aug-2017
Sep-2017
Oct-2017
-200
0
200
400
600
800
1,000
Nov-2017
Dec-2017
Jan-2018
Feb-2018
Mar-2017
Apr-2017
May-2017
Jun-2017
Jul-2017
Aug-2017
Sep-2017
Oct-2017
0
2,000
4,000
6,000
8,000
10,000 Developed Market Emerging Market
Nov-2017
Dec-2017
Jan-2018
Feb-2018
Mar-2017
Apr-2017
May-2017
Jun-2017
Jul-2017
Aug-2017
Sep-2017
Oct-2017
-1,000
0
1,000
2,000
3,000
4,000
Nov-2017
Dec-2017
Jan-2018
Feb-2018
Mar-2017
Apr-2017
May-2017
Jun-2017
Jul-2017
Aug-2017
Sep-2017
Oct-2017
Developed Market Emerging Market
Broad Commodities Precious Metals
-400
-200
0
200
400
600
800
Nov-2017
Dec-2017
Jan-2018
Feb-2018
Mar-2017
Apr-2017
May-2017
Jun-2017
Jul-2017
Aug-2017
Sep-2017
Oct-2017
Overview by asset class
Source: Monthly data in EURM from 01/03/2017 to 28/02/2018, Bloomberg, Lyxor. The figures relatingto past performances refer to past periods and are not a reliable indicator for future results.

7For professional clients only*
This document is for the exclusive use of investors acting on their own account and categorised either as “eligible counterparties” or “professional clients” within the meaning of markets in financial instruments directive 2004/39/ce.
Slight outflows from Spanish and Italian equities (-€38M) Monthly NNA on peripheral Europe equity ETFs
Rebound confirmed for Financials (€710M) Monthly NNA on Financials Europe equity ETFs
European EquitiesEuropean equities continued their strong start to the year (€2.9bn)Monthly NNA on European equity ETFs
Flows surged into German equities (€993M) Monthly NNA on German equity ETFs
Eurozone flows slowed sharply (€999m) Monthly NNA on Eurozone equity ETFs
Flows into Value still virtually non-existent Monthly NNA on European Value equity ETFs
-1,000
0
500
-500
1,000
1,500
2,000
2,500
3,000
3,500
4,000
Nov-2017
Dec-2017
Jan-2018
Feb-2018
Mar-2017
Apr-2017
May-2017
Jun-2017
Jul-2017
Aug-2017
Sep-2017
Oct-2017
-100
-200
-300
-400
0
100
200
300
Nov-2017
Dec-2017
Jan-2018
Feb-2018
Mar-2017
Apr-2017
May-2017
Jun-2017
Jul-2017
Aug-2017
Sep-2017
Oct-2017
-200
0
200
400
600
800
1,000
1,200
1,400
Nov-2017
Dec-2017
Jan-2018
Feb-2018
Mar-2017
Apr-2017
May-2017
Jun-2017
Jul-2017
Aug-2017
Sep-2017
Oct-2017
-1,000
-500
0
500
1,000
1,500
Nov2017
Dec-2017
Jan-2018
Feb-2018
Mar-2017
Apr-2017
May-2017
Jun-2017
Jul-2017
Aug-2017
Sep-2017
Oct-2017
-500
0
500
1,000
1,500
2,000
3,000
2,500
Nov-2017
Dec-2017
Jan-2018
Feb-2018
Mar-2017
Apr-2017
May-2017
Jun-2017
Jul-2017
Aug-2017
Sep-2017
Oct-2017
-200
0
200
400
600
800
Nov-2017
Dec-2017
Jan-2018
Feb-2018
Mar-2017
Apr-2017
May-2017
Jun-2017
Jul-2017
Aug-2017
Sep-2017
Oct-2017
Equities
Source: Monthly data in EURM from 01/03/2017 to 28/02/2018, Bloomberg, Lyxor. The figures relatingto past performances refer to past periods and are not a reliable indicator for future results.
8For professional clients only*
This document is for the exclusive use of investors acting on their own account and categorised either as “eligible counterparties” or “professional clients” within the meaning of markets in financial instruments directive 2004/39/ce.
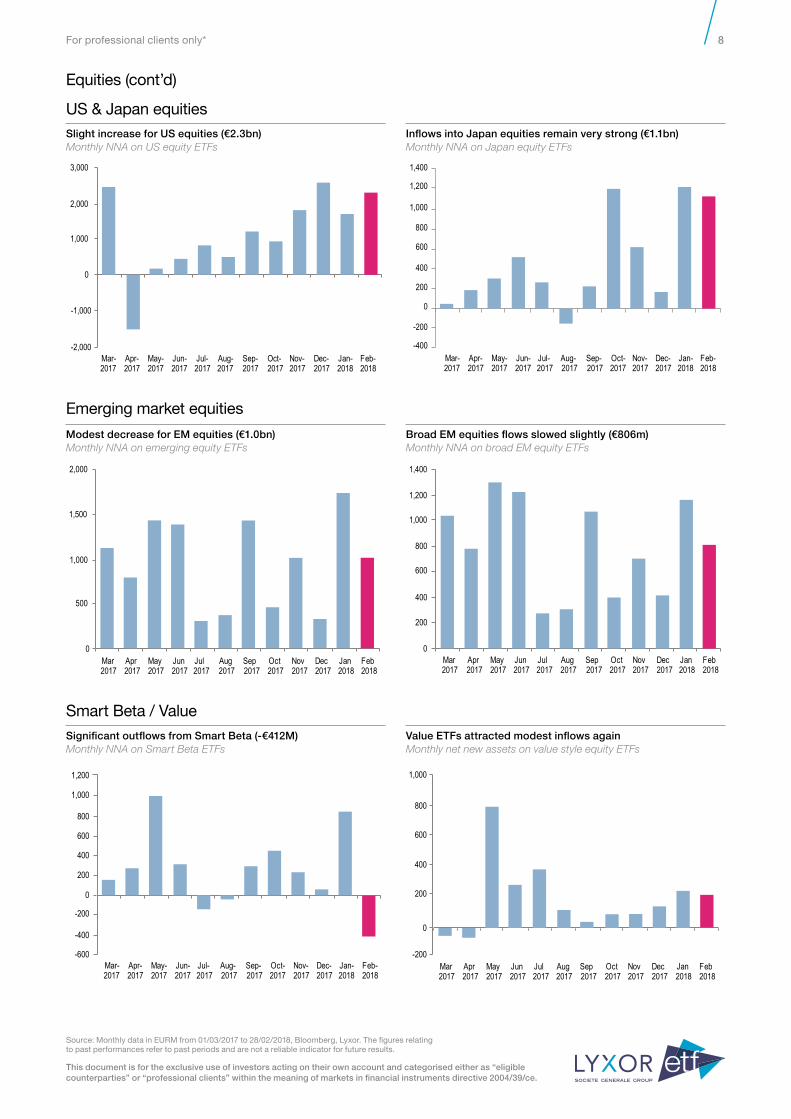
Modest decrease for EM equities (€1.0bn) Monthly NNA on emerging equity ETFs
Significant outflows from Smart Beta (-€412M) Monthly NNA on Smart Beta ETFs
US & Japan equities
Emerging market equities
Smart Beta / Value
Slight increase for US equities (€2.3bn) Monthly NNA on US equity ETFs
Inflows into Japan equities remain very strong (€1.1bn) Monthly NNA on Japan equity ETFs
Broad EM equities flows slowed slightly (€806m) Monthly NNA on broad EM equity ETFs
Value ETFs attracted modest inflows again Monthly net new assets on value style equity ETFs
-2,000
-1,000
0
1,000
2,000
3,000
Nov-2017
Dec-2017
Jan-2018
Feb-2018
Mar-2017
Apr-2017
May-2017
Jun-2017
Jul-2017
Aug-2017
Sep-2017
Oct-2017
0
500
1,000
1,500
2,000
2017Nov2017
Dec2017
Jan2018
Feb2018
Mar2017
Apr2017
May2017
Jun2017
Jul2017
Aug2017
Sep2017
Oct
-200
-400
-600
0
200
400
600
800
1,000
1,200
2017Nov-2017
Dec-2017
Jan-2018
Feb-2018
Mar-2017
Apr-2017
May-2017
Jun-2017
Jul-2017
Aug-2017
Sep-2017
Oct-
-400
-200
0
200
400
600
800
1,200
1,000
1,400
Oct-2017
Nov-2017
Dec-2017
Jan-2018
Feb-2018
Mar-2017
Apr-2017
May-2017
Jun-2017
Jul-2017
Aug-2017
Sep-2017
0
800
600
400
200
1,200
1,000
1,400
Oct2017
Nov2017
Dec2017
Jan2018
Feb2018
Mar2017
Apr2017
May2017
Jun2017
Jul2017
Aug2017
Sep2017
-200
0
200
400
600
800
1,000
2017Nov2017
Dec2017
Jan2018
Feb2018
Mar2017
Apr2017
May2017
Jun2017
Jul2017
Aug2017
Sep2017
Oct
Equities (cont’d)
Source: Monthly data in EURM from 01/03/2017 to 28/02/2018, Bloomberg, Lyxor. The figures relatingto past performances refer to past periods and are not a reliable indicator for future results.

9For professional clients only*
This document is for the exclusive use of investors acting on their own account and categorised either as “eligible counterparties” or “professional clients” within the meaning of markets in financial instruments directive 2004/39/ce.
Flows into inflation-linked bonds stalled (€158M) Monthly NNA on inflation-linked bonds ETFs
Virtually flat month for credit (€24m), but worst month ever for HY (-€1.2bn) Monthly NNA on corporate & High Yield bond ETFs
European Govies US Govies
Inflation Linked EM debt
Crédit Market Short Bond Stategy
Flows surged into EU government bonds (€1.1bn) Monthly NNA on EU government bond ETFs
Flows into US government bonds accelerated sharply (€602m) Monthly NNA on US government bond ETFs
Modest inflows for EM debt (€202m) Monthly NNA on Emerging Market debt ETFs
Outflows from short bond strategies (-€118m) Monthly NNA short bond strategy ETFs
-1,000
-500
0
500
1,000
1,500
2017Nov-2017
Dec-2017
Jan-2018
Feb-2018
Mar-2017
Apr-2017
May-2017
Jun-2017
Jul-2017
Aug-2017
Sep-2017
Oct-
-1,000
-600
-400
-200
-800
0
600
400
200
800
2017Nov-2017
Dec-2017
Jan-2018
Feb-2018
Mar-2017
Apr-2017
May-2017
Jun-2017
Jul-2017
Aug-2017
Sep-2017
Oct-
-1,500
-1,000
-500
0
500
1,000
1,500
2,000
2,500 Corporate Bonds High Yields
2017Nov-2017
Dec-2017
Jan-2018
Feb-2018
Mar-2017
Apr-2017
May-2017
Jun-2017
Jul-2017
Aug-2017
Sep-2017
Oct-
0
100
200
400
500
600
300
700
2017Nov-2017
Dec-2017
Jan-2018
Feb-2018
Mar-2017
Apr-2017
May-2017
Jun-2017
Jul-2017
Aug-2017
Sep-2017
Oct-
-1,000
-500
0
500
1,500
1,000
2,000
2017Nov-2017
Dec-2017
Jan-2018
Feb-2018
Mar-2017
Apr-2017
May-2017
Jun-2017
Jul-2017
Aug-2017
Sep-2017
Oct-
-300
-200
-100
0
100
200
300
400
2017Nov-2017
Dec-2017
Jan-2018
Feb-2018
Mar-2017
Apr-2017
May-2017
Jun-2017
Jul-2017
Aug-2017
Sep-2017
Oct-
Fixed Income
Source: Monthly data in EURM from 01/03/2017 to 28/02/2018, Bloomberg, Lyxor. The figures relatingto past performances refer to past periods and are not a reliable indicator for future results.

10For professional clients only*
Marlène Hassine KonquiHead�of�ETF�Research+33�1�42�13�59�[email protected]
Kristo DurbakuETF�Research�Analyst+33�1�57�29�25�[email protected]
Check out the Q3 2017Informed Investor ManagerMonitor
Read more
Read the full 2016 analysison active and passiveperformance
Read more
This document is for the exclusive use of investors acting on their own account and categorised either as “eligible counterparties” or “professional clients” within the meaning of markets in financial instruments directive 2004/39/ce.
Contact [email protected] | +33 (0)1 42 13 59 56
1
This document is for the exclusive use of investors acting on their own account and categorised either as “eligible counterparties” or “professional clients” within the meaning of markets in financial instruments directive 2004/39/ce.
Source: Morningstar and Bloomberg data from 30 June 2007 to 30 June 2017. The figures relating to past performances refer to past periods and are not a reliable indicator for future results. This also applies to historical market data.
Q3 2017 – Average % of active funds outperforming their benchmark
For professional clients only*
Informed Investor: Manager Monitor Q3 2017
Q3 2017: A poor quarter for active managersBy Marlène Hassine Konqui, Head of ETF Research and Clément Chaulot, Fund Analyst
of active equity managers outperformed. European and Global managers enjoyed some notable improvements, as did those focused on value
of all active managers outperformed their benchmark vs 28% in 2016
of fixed income active managers outperformed. Euro high yield and euro government bond managers fared worst
▼15% on Q2
▼23% on Q2
▼26% on Q2
20%
32%
37%
2016 10 years8%
17%
20%
Fixed Income Equity Average
31%
28%
27%
Q3 summary ► Less favourable conditions for
active managers
► Stable macro environment, fewnew catalysts and low volatilitylimit alpha opportunities for equitymanagers
► Declining rate environment againimpedes fixed income managers
Blending active and passive funds Comparing 2016 performances and 2017 outlook
FOR PROFESSIONAL AND QUALIFIED INVESTORS ONLYThis document is reserved and must be given in Switzerland exclusively to Qualified Investors as defined by the Swiss Collective Investment Scheme Act of 23 June 2006 (as amended from time to time, CISA).
ETF Research Team

11For professional clients only*
Important informationThis�document�is�of�a�commercial�nature�and�not�of�a�regulatory�nature.�It�is�each�investor’s�responsibility�to�ascertain�that�it�is�authorised�to�subscribe,�or�invest�into�this�product.�Prior�to�investing�in�the�product,�investors�should�seek�independent�financial,�tax,�accounting�and�legal�advice.
The�indexes�and�the�trademarks�used�in�this�document�are�the�intellectual�property�of�index�sponsors�and/or�its�licensors.�The�indexes�are�used�under�license�from�index�sponsors.�The�Funds�based�on�the�indexes�are�in�no�way�sponsored,�endorsed,�sold�or�promoted�by�index�sponsors�and/�or�its�licensors�and�neither�index�sponsors�nor�its�licensors�shall�have�any�liability�with�respect�thereto.�
Lyxor�UCITS�ETFs�referred�on�this�document�are�open�ended�mutual�investment�funds�(i)�established�under�the�French�law�and�approved�by�the�Autorité�des�Marchés�Financiers�(the�French�Financial�Markets�Authority)�or�(ii)�established�under�Luxembourg�law�and�approved�by�the�Commission�de�Surveillance�du�Secteur�Financier�(the�Luxembourg�Financial�Markets�Authority)�(CSSF)�and�authorized�for�marketing�of�their�units�or�shares�in�various�European�countries�(the�Marketing�Countries)�pursuant�to�the�article�93�of�the�2009/65/EC�Directive.
Société�Générale,�Lyxor�AM�and�Lyxor�Asset�Management�Luxembourg�recommend�that�investors�read�carefully�the�“risk�factors”�section�of�the�product’s�prospectus�and�the�“Risk�and�reward”�section�of�the�Key�Investor�Information�Document�(KIID).�The�prospectus�in�French�for�French�Lyxor�UCITS�ETFs�and�in�English�for�Luxembourg�Lyxor�UCITS�ETFs�and�the�KIID�in�the�local�languages�of�the�Marketing�Countries�are�available�free�of�charge�on�www.lyxoretf.com�or�upon�request�to�[email protected].
The�attention�of�investors�is�drawn�to�the�fact�that,�the�prospectus�of�Luxembourg�Lyxor�UCITS�ETFs�is�only�available�in�English.
Updated�composition�of�the�product’s�investment�portfolio�is�available�on�www.lyxoretf.com.�I�ndicative�net�asset�value�is�published�on�the�Reuters�and�Bloomberg�pages�of�the�products,�and�might�also�be�mentioned�on�the�websites�of�the�stock�exchanges�where�the�product�is�listed.�The�products�are�the�object�of�market-�making�contracts,�the�purpose�of�which�is�to�ensure�the�liquidity�of�the�products�on�the�exchange,�assuming�normal�market�conditions�and�normally�functioning�computer�systems.�Units�of�a�specific�UCITS�ETF�managed�by�an�asset�manager�and�purchased�on�the�secondary�market�cannot�usually�be�sold�directly�back�to�the�asset�manager�itself.�Investors�must�buy�and�sell�units�on�a�secondary�market�with�the�assistance�of�an�intermediary�(e.g.�a�stockbroker)�and�may�incur�fees�for�doing�so.�In�addition,�investors�may�pay�more�than�the�current�net�asset�value�when�buying�units�and�may�receive�less�than�the�current�net�asset�value�when�selling�them.
These�products�include�a�risk�of�capital�loss.�The�redemption�value�of�these�products�may�be�less�than�the�amount�initially�invested.�In�a�worst�case�scenario,�investors�could�sustain�the�loss�of�their�entire�investment.
The�indices�referred�to�herein�(the�“Index”)�are�not�sponsored,�approved�or�sold�by�Société�Générale,�Lyxor�AM�or�Lyxor�Asset�Management�Luxembourg.�Société�Générale,�Lyxor�AM�and�Lyxor�
Asset�Management�Luxembourg�shall�not�assume�any�responsibility�in�this�respect.
The�accuracy,�completeness�or�relevance�of�the�information�which�has�been�drawn�from�external�sources�is�not�guaranteed�although�it�is�drawn�from�sources�reasonably�believed�to�be�reliable.�Subject�to�any�applicable�law,�Société�Générale,�Lyxor�AM�and�Lyxor�Asset�Management�Luxembourg�shall�not�assume�any�liability�in�this�respect.
The�market�information�displayed�in�this�document�is�based�on�data�at�a�given�moment�and�may�change�from�time�to�time.
This�document�does�not�constitute�an�offer�for�sale�of�securities�in�the�United�States�of�America.�The�product�herein�described�will�not�be�registered�under�the�U.S.�Securities�Act�of�1933,�as�amended�(the�“U.S.�Securities�Act”)�and�may�not�be�offered�or�sold�in�the�United�States�of�America�without�being�registered�or�being�exempted�from�registration�under�the�U.S.�Securities�Act.�This�document�does�not�constitute�an�offer,�or�an�invitation�to�make�an�offer,�from�Société�Générale,�Lyxor�Asset�Management�(Lyxor�AM)�or�any�of�their�respective�subsidiaries�to�purchase�or�sell�the�product�referred�to�herein.
Société�Générale�is�a�French�credit�institution�(bank)�authorised�by�the�Autorité�de�contrôle�prudential�et�de�résolution�(the�French�Prudential�Control�Authority).
Lyxor�Asset�Management�Luxembourg,�18,�boulevard�Royal�L-2449�Luxembourg,�is�a�Luxembourg�société�anonyme�authorized�by�the�Commission�de�Surveillance�du�Secteur�Financier�as�management�company.
Lyxor�International�Asset�Management�(Lyxor�AM)�is�a�French�investment�management�company�authorized�by�the�Autorité�des�marchés�financiers�and�placed�under�the�regulations�of�the�UCITS�Directive�(2009/65/CE).
©�COPYRIGHT�2014�LYXOR�INTERNATIONAL�ASSET�MANAGEMENT�ALL�RIGHTS�RESERVED
Notice�to�UK�Investors:�This�material�is�issued�in�the�UK�by�Lyxor�Asset�Management�UK�LLP,�which�is�authorized�and�regulated� by�the�Financial�Conduct�Authority�in�the�UK�under�registration�number�435658.
Notice�to�Swiss�Investors:�This�document�and�the�information�contained�therein�do�not�constitute�an�issue�prospectus�according�to�articles�652a�and�1156�of�the�Swiss�Code�of�Obligations�(“CO”)�or�a�listing�prospectus�according�the�Listing�Rules�of�the�SIX�Swiss�Exchange.�The�products�are�authorized�for�the�offer�and�distribution�in�Switzerland�or�from�Switzerland�pursuant�to�the�Swiss�Federal�Act�on�Collective�Investment�Schemes�(CISA).�The�Swiss�Financial�Market�Supervisory�Authority�FINMA�has�authorized�Société�Générale,�Zurich�Branch�(Talacker�50,�Case�postale�1928,�8021�Zürich),�to�act�as�Swiss�Representative�and�Paying�Agent�of�the�Funds�in�Switzerland.�The�product’s�documentation�(prospectus,�KIID,�articles�of�association,�annual�and�semi-annual�reports)�can�be�obtained�free�of�charge�at�the�Swiss�representative’s�office.
Knowing your riskIt�is�important�for�potential�investors�to�evaluate�the�risks�described�below�and�in�the�fund�prospectus�on�our�website�www.lyxoretf.com
Capital at riskThe�capital�invested�is�not�guaranteed.
Replication riskThe�fund�objectives�might�not�be�reached�due�to�unexpected�events�on�the�underlying�markets�which�will�impact�the�index�calculation�and�the�efficient�fund�replication.
Fund liquidity riskThe�fund’s�liquidity�and/or�value�may�be�negatively�affected�by� different�factors.
Counterparty riskThe�fund�may�be�exposed�to�the�counterparty�risk�resulting�from�the�use�of�otc�forward�financial�instruments�contracted�with�a�lending�institution,�or�from�the�use�of�a�securities�lending�programme.
Currency risk The�funds�are�exposed�to�currency�risk,�as�they�may�be�denominated�in�a�currency�different�from�the�index.
This document is for the exclusive use of investors acting on their own account and categorised either as “eligible counterparties” or “professional clients” within the meaning of markets in financial instruments directive 2004/39/ce.

Ref
. 714
438
- S
tudi
o S
ocie
te G
ener
ale
- 03
/201
8
This document is for the exclusive use of investors acting on their own account and categorised either as “eligible counterparties” or “professional clients” within the meaning of markets in financial instruments directive 2004/39/ce.
Contact [email protected] | +33 (0)1 42 13 59 56