Embed Size (px)
Citation preview
science for a changing world
by Kernell G. Ries III, Peter A. Steeves, Jacqueline D. Coles, Alan H. Rea, and David W. Stewart
Introduction
The U.S. Geological Survey (USGS) provides streamflow and other stream-related infor
mation needed to protect people and property from floods, to plan and man age water resources, and to protect water quality. Streamflow statistics pro vided by the USGS, such as the 100-year flood, the annual mean flow, and the 7- day 10-year low flow (7Q10), frequently are used by engineers, land managers, biologists, and many others to help guide
decisions in their everyday work. For example, streamflow statistics are used for flood-plain mapping, which is used as the basis for setting insurance rates and zoning land use. Streamflow statistics also are used for dam, bridge, and cul vert design; water-supply planning and management, and water-use appropria tions and permitting; wastewater and industrial discharge permitting; hydropower facility design and regula tion; and habitat preservation for protec tion of endangered species. In addition, researchers, planners, regulators, and others often need to know the physical
Ittahu StremmStats Prototype
and climatic characteristics (basin charac teristics) of the drainage basins upstream from locations of interest to help them understand the mechanisms that control water availability and water quality at these locations.
Streamflow statistics can be needed at any location along a stream. Commonly, the statistics are computed from available data when they are need ed at the locations of USGS data-collec tion stations, which include streamgaging stations, where streamflow data are col lected continuously; partial-record sta tions, where streamflow measurements
QB&Favorites Took Help
J^j ,Sf] -j .f- Search Favorites ^f*Media <a -
«t
& ^%tl
'
- t >&:
^»- v-^:r^!sar'r-r JF r * ^^~. ^M* W^^^fe«» .-. - v '&£$^^-^'--fy0 MM}^" v-
.: iMrXUtV. (.TV- M it*\* I:'
<-^i. a"vi" ' ' "/^*.^^; ;^>k;
a water feature
Enter Water Resource Name
Map Layers j
r BASE LAYERSCjShaded_Reliet
CMK QUAD Boundaries
* WATEREi Water Bodies
EMnets
DHUCs
aUns'.-ailableArea
El Undefined Area
DWatershed Delineation
D Stream Gages
Figure 1. View of the StreamStats user interface zoomed in to Idaho.
U.S. Department of the Interior U.S. Geological Survey
USGS Fact Sheet FS 2004-3115 2005
are collected systematically over a period of years to estimate peak-flow or low- flow statistics; and miscellaneous-meas urement stations, where streamflow measurements usually are collected for specific hydrologic studies with various objectives. More often, however, the sta tistics are needed at ungaged sites, where no observed data are available to compute the statistics.
StreamStats is a map-based Web application that makes it easy for users to obtain streamflow statistics, basin characteristics, and other information for user-selected USGS data-collection sta tions and ungaged sites of interest. If a user selects the location of a data-collec tion station, StreamStats will provide pre viously published information for the sta tion from a database. If a user selects a location where no data are available (an ungaged site), StreamStats will run a Geographic Information System (CIS) program to measure basin characteristics and estimate streamflow statistics for the site. These estimates assume that natural flow conditions exist at the ungaged site. In the past, it could take an experienced person more than a day to determine the estimates. StreamStats reduces the effort to only a few minutes.
StreamStats was developed coopera tively by the USGS and the Environmental Systems Research Institute, Inc. (ESRI, at Web page http://www.esri.com), and was designed for national implementation. The appli cation consists of five major compo nents: (1) a user interface that displays maps and allows users to select stream locations where they want streamflow statistics information (fig. 1), (2) a data base that contains previously published streamflow statistics and descriptive information for USGS data-collection sta tions, (3) an automated CIS process that determines drainage boundaries for user- selected ungaged sites and measures the basin characteristics for those sites, (4) a CIS database that stores base-map data needed for users to locate sites of inter est and other map data needed for measuring basin characteristics, and (5) an automated process that takes the measured basin characteristics for ungaged sites as input, solves regression equations to estimate various streamflow statistics, and outputs the estimates for display to the user in a Web browser window. Each of these components are described below and guidance for using the application is provided.
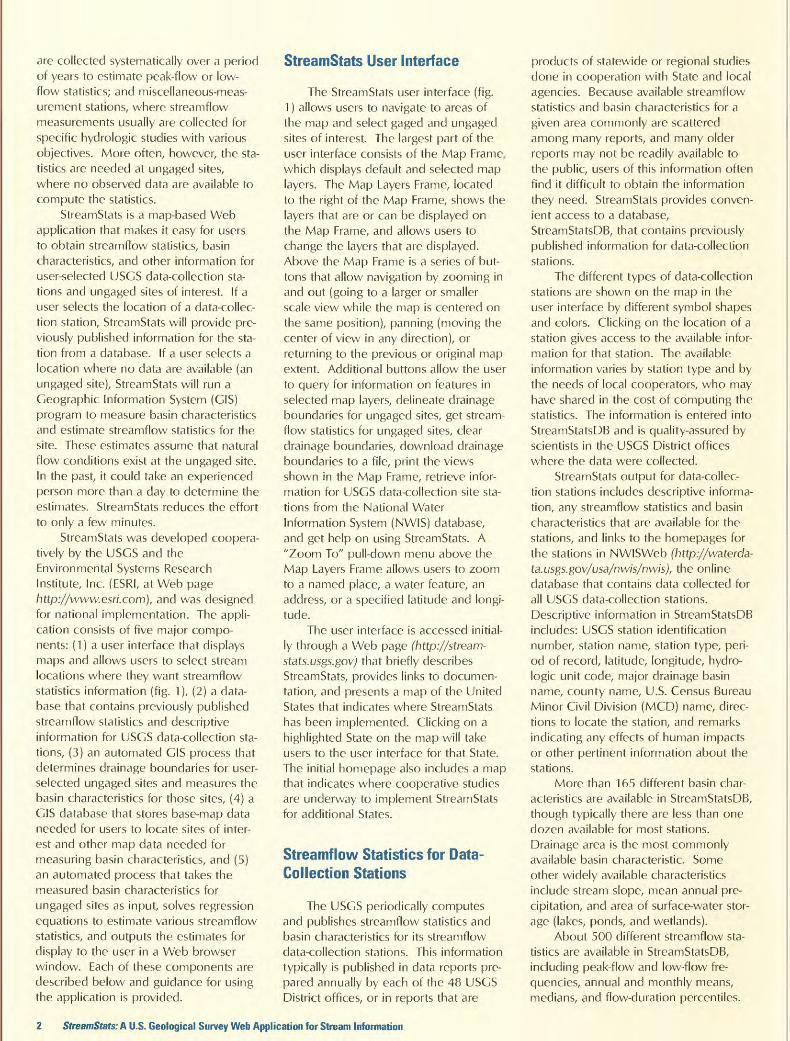
StreamStats User Interface
The StreamStats user interface (fig. 1) allows users to navigate to areas of the map and select gaged and ungaged sites of interest. The largest part of the user interface consists of the Map Frame, which displays default and selected map layers. The Map Layers Frame, located to the right of the Map Frame, shows the layers that are or can be displayed on the Map Frame, and allows users to change the layers that are displayed. Above the Map Frame is a series of but tons that allow navigation by zooming in and out (going to a larger or smaller scale view while the map is centered on the same position), panning (moving the center of view in any direction), or returning to the previous or original map extent. Additional buttons allow the user to query for information on features in selected map layers, delineate drainage boundaries for ungaged sites, get stream- flow statistics for ungaged sites, clear drainage boundaries, download drainage boundaries to a file, print the views shown in the Map Frame, retrieve infor mation for USGS data-collection site sta tions from the National Water Information System (NWIS) database, and get help on using StreamStats. A "Zoom To" pull-down menu above the Map Layers Frame allows users to zoom to a named place, a water feature, an address, or a specified latitude and longi tude.
The user interface is accessed initial ly through a Web page (http://stream- stats.usgs.gov) that briefly describes StreamStats, provides links to documen tation, and presents a map of the United States that indicates where StreamStats has been implemented. Clicking on a highlighted State on the map will take users to the user interface for that State. The initial homepage also includes a map that indicates where cooperative studies are underway to implement StreamStats for additional States.
Streamflow Statistics for Data- Collection Stations
The USGS periodically computes and publishes streamflow statistics and basin characteristics for its streamflow data-collection stations. This information typically is published in data reports pre pared annually by each of the 48 USGS District offices, or in reports that are
products of statewide or regional studies done in cooperation with State and local agencies. Because available streamflow statistics and basin characteristics for a given area commonly are scattered among many reports, and many older reports may not be readily available to the public, users of this information often find it difficult to obtain the information they need. StreamStats provides conven ient access to a database, StreamStatsDB, that contains previously published information for data-collection stations.
The different types of data-collection stations are shown on the map in the user interface by different symbol shapes and colors. Clicking on the location of a station gives access to the available infor mation for that station. The available information varies by station type and by the needs of local cooperators, who may have shared in the cost of computing the statistics. The information is entered into StreamStatsDB and is quality-assured by scientists in the USGS District offices where the data were collected.
StreamStats output for data-collec tion stations includes descriptive informa tion, any streamflow statistics and basin characteristics that are available for the stations, and links to the homepages for the stations in NWISWeb (http://waterda- ta.usgs.gov/usa/nwis/nwis), the online database that contains data collected for all USGS data-collection stations. Descriptive information in StreamStatsDB includes: USGS station identification number, station name, station type, peri od of record, latitude, longitude, hydro- logic unit code, major drainage basin name, county name, U.S. Census Bureau Minor Civil Division (MCD) name, direc tions to locate the station, and remarks indicating any effects of human impacts or other pertinent information about the stations.
More than 165 different basin char acteristics are available in StreamStatsDB, though typically there are less than one dozen available for most stations. Drainage area is the most commonly available basin characteristic. Some other widely available characteristics include stream slope, mean annual pre cipitation, and area of surface-water stor age (lakes, ponds, and wetlands).
About 500 different streamflow sta tistics are available in StreamStatsDB, including peak-flow and low-flow fre quencies, annual and monthly means, medians, and flow-duration percentiles.
StreamStats: A U.S. Geological Survey Web Application for Stream Information
Most stations, however, have only a small number of statistics available. Data from NWISWeb were used to determine the statistics. Though there is some overlap in the information contained in NWISWeb and StreamStatsDB, NWISWeb was not designed to store most of the streamflow statistics and many of the basin characteristics con tained in StreamStatsDB.
All streamflow statistics and basin characteristics for stations in StreamStatsDB were published in previ ous reports, and citations for those reports are provided in the StreamStats output. Methods used to determine the information are described in the reports. A link from the StreamStats homepage provides definitions of the streamflow statistics and basin characteristics in the database.
Streamflow Statistics for Ungaged Sites
The USGS has developed numerous equations that can be used to estimate various streamflow statistics for locations
on ungaged streams throughout the Nation. The equations were obtained by use of regression analysis to statistically relate the streamflow statistics to the basin characteristics of the drainage basins for a group of data-collection sta tions. The basin characteristics can be measured for an ungaged site and insert ed into the regression equations to obtain estimates of the streamflow statis tics under natural flow conditions for the site. (See box on p. 4)
Use of the regression equations has been limited in the past because measur ing the basin characteristics was difficult and time-consuming, and the equations sometimes are difficult to calculate. Historically, most physical characteristics were measured by hand from various maps. This process could take from an hour to a few days to complete for a sin gle site, depending on the size of the basin and the characteristics measured. In addition, many of the maps were not widely circulated, and many potential users did not possess the equipment or expertise necessary to measure the val ues from the maps. StreamStats elimi nates these problems by automatically
defining the drainage boundary, measur ing the basin characteristics, and solving the regression equations to obtain esti mates of streamflow statistics for user- selected ungaged sites in a process that takes only a few minutes. Users simply select the location of interest from the map displayed in the user interface, and StreamStats does the rest.
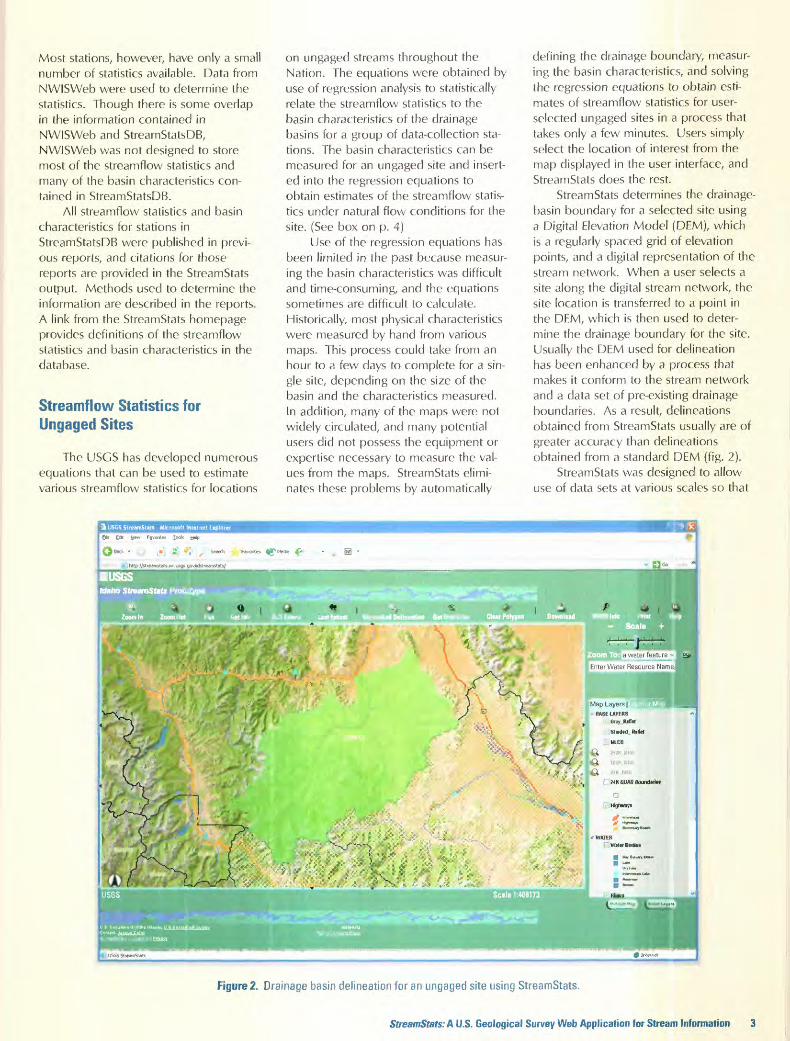
StreamStats determines the drainage- basin boundary for a selected site using a Digital Elevation Model (DEM), which is a regularly spaced grid of elevation points, and a digital representation of the stream network. When a user selects a site along the digital stream network, the site location is transferred to a point in the DEM, which is then used to deter mine the drainage boundary for the site. Usually the DEM used for delineation has been enhanced by a process that makes it conform to the stream network and a data set of pre-existing drainage boundaries. As a result, delineations obtained from StreamStats usually are of greater accuracy than delineations obtained from a standard DEM (fig. 2).
StreamStats was designed to allow use of data sets at various scales so that
; *" * g^-j'&&.w<"' &%*% ,'?- ' &*$*$$f &*&*>.*&***? * v*'., - ^ *lmf*te&&$&^M^A t£^^%&t
Figure 2. Drainage basin delineation for an ungaged site using StreamStats.
StreamStats: A U.S. Geological Survey Web Application for Stream Information 3
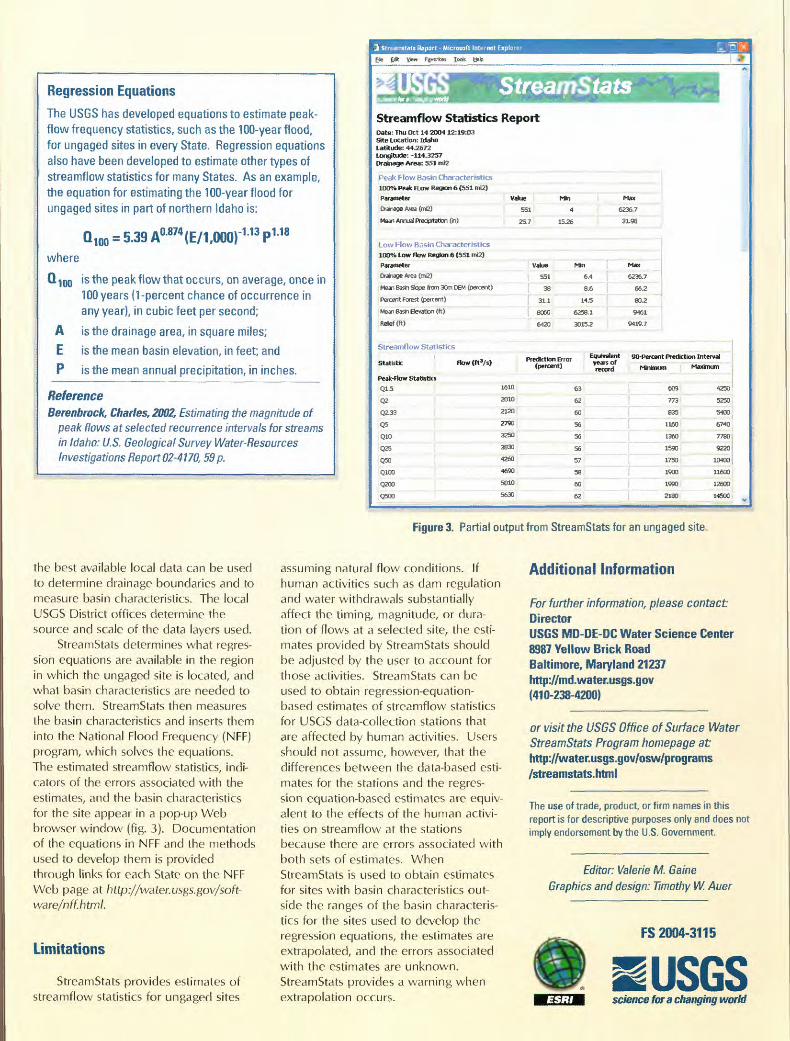
Regression Equations
The USGS has developed equations to estimate peak- flow frequency statistics, such as the 100-year flood, for ungaged sites in every State. Regression equations also have been developed to estimate other types of Streamflow statistics for many States. As an example, the equation for estimating the 100-year flood for ungaged sites in part of northern Idaho is:
Q 100 = 5.39 A0874 (E/1,000)-113 P118
where
Q 100 is the peak flow that occurs, on average, once in 100 years (1 -percent chance of occurrence in any year), in cubic feet per second;
A is the drainage area, in square miles;
E is the mean basin elevation, in feet; and
P is the mean annual precipitation, in inches.
ReferenceBerenbrock, Charles, 2002, Estimating the magnitude of
peak flows at selected recurrence intervals for streams in Idaho: U.S. Geological Survey Water-Resources Investigations Report 02-4170,59 p.
fie £* Stow Fjyortw loob
treamStatsStreamflow Statistics ReportDate: Thu Dct 14 2004 12:19:03 Site Location: Idaho Latitude: 44.2672 Longitude: -1143257 Drainage Area: 551 mi2
Peak Flow Basin Characteristics ___100% Peak Flow Region 6 (551 m!2)Parameter ________[ Value \~~
Drainage Area (<rt2) ( 551 r
Mean Annual Precipitation On) "" I 25.7
Low Flow Basin Characteristics
100% Low Flow Region 6 (551 mi2)
Parameter
Oarage Area (mc2)
Mean Basin Slope from 30m DEM (percent)
Percent Forest (percent)
Mean Basin Etevatcn (ft)
Rj*8f(ft)
I Value i |" 551 '
T 38
7-31.1
f eoeo6420
8.6
M.5
6258.1
3015.2
Max
6236.7
9461
9419.7
Streamflow Statistics
Statistic How(tt3/s)
Peak-flow Statistics
Q1.5 ______,_____________MM,
Q2 | 20101
Q2.33 | ~ 2120
Q5 | 2790
Q10_______f 3250[
Q25 I
Q50
Q100
Q200 ___|_________________Q500 ' 5630'
Prediction Error (percent)
Equivatent 90-Percent Prediction Interval
Minimum Maximum
609
773
8351
4250
5250
5400
3830 |
4260
4690
5010.
11601
1360 f1590 l~"
1750
1900
1990|
2180
6740
7780
9220
10400
11600
12600
14500
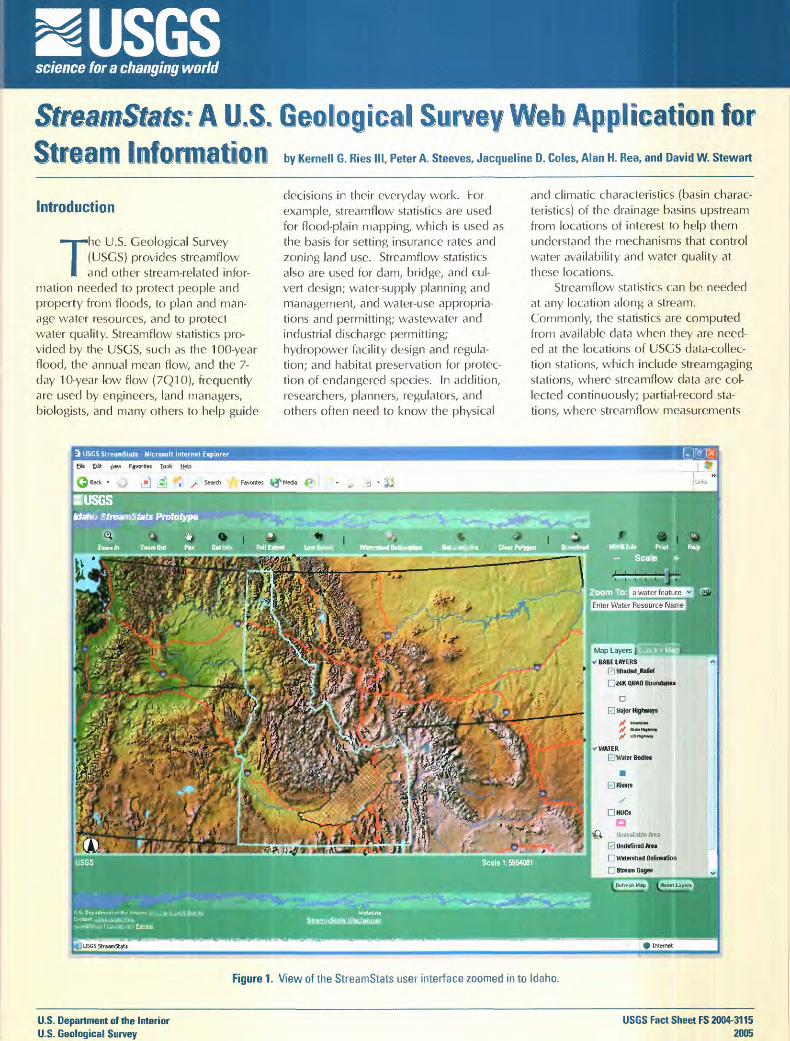
Figure 3. Partial output from StreamStats for an ungaged site.
the best available local data can be used to determine drainage boundaries and to measure basin characteristics. The local USCS District offices determine the source and scale of the data layers used.
StreamStats determines what regres sion equations are available in the region in which the ungaged site is located, and what basin characteristics are needed to solve them. StreamStats then measures the basin characteristics and inserts them into the National Flood Frequency (NFF) program, which solves the equations. The estimated Streamflow statistics, indi cators of the errors associated with the estimates, and the basin characteristics for the site appear in a pop-up Web browser window (fig. 3). Documentation of the equations in NFF and the methods used to develop them is provided through links for each State on the NFF Web page at http://water.usgs.gov/soft- ware/nff.html.
Limitations
StreamStats provides estimates of Streamflow statistics for ungaged sites
assuming natural flow conditions. If human activities such as dam regulation and water withdrawals substantially affect the timing, magnitude, or dura tion of flows at a selected site, the esti mates provided by StreamStats should be adjusted by the user to account for those activities. StreamStats can be used to obtain regression-equation- based estimates of Streamflow statistics for USGS data-collection stations that are affected by human activities. Users should not assume, however, that the differences between the data-based esti mates for the stations and the regres sion equation-based estimates are equiv alent to the effects of the human activi ties on Streamflow at the stations because there are errors associated with both sets of estimates. When StreamStats is used to obtain estimates for sites with basin characteristics out side the ranges of the basin characteris tics for the sites used to develop the regression equations, the estimates are extrapolated, and the errors associated with the estimates are unknown. StreamStats provides a warning when extrapolation occurs.
Additional Information
For further information, please contact:DirectorUSGS MD-DE-DC Water Science Center8987 Yellow Brick RoadBaltimore, Maryland 21237http://md.water.usgs.gov(410-238-4200)
or visit the USGS Office of Surf ace Water StreamStats Program homepage at http://water.usgs.gov/osw/programs /streamstats.html
The use of trade, product, or firm names in this report is for descriptive purposes only and does not imply endorsement by the U.S. Government.
Editor: Valeria M. Gaine Graphics and design: Timothy W. Auer
FS 2004-3115
USGSscience for a changing world