Embed Size (px)
Citation preview

DATA ANALYSISBY JUSTIN BIEBER
RESA-FKA

What is Data?
A collection of fact!!!

What is Data AnalysisData analysis is about manipulating and presenting results
Data need to be organised, summarised, and analysed in order to draw/infer conclusion
Commonly used approaches or tools Statistics ModelsStandards

What is Statistics?
The science of collecting and analyzing data

Sources of data
Lab ExperimentationSurveyCensusTheoretical analysis Numerical analysis – softwareOther researchers data

Classes of experiment/data collection
1) Estimation of parameter mean values
2) Estimation of parameter variability
3) Comparison of parameter mean values
4) Comparison of parameter variability
5) Modeling the dependence of dependant variable on several quantitative and qualitative independent variables

Data checkingBefore doing data analysis and interpretation :
Watch for invalid data using whatever data checking procedure
Weeding out of ‘bad’ data is to be done continuously throughout data gathering process
Bad data can bias results and interpretation
Repeat data gathering or experimentation if there exist suspicious data.

OutliersAn outlier is an observation that lies outside
the overall pattern of the data distribution.
There are several statistically robust methods for outlier detection, an idea analogous to measuring onset latencies, one of which is the box plot

Box Plot Method

Trial Test
Do a simple trial test, so that :
to ensure that all parts in the testing set-up function well
to determine the range of measurement to be taken
to anticipate the time taken for each step in the experiment
to see the error

Error (Uncertainty)When writing a measurement result with e, it doesn’t
mean that we have done error.
It is uncertainty due to the limit of equipment and technique of experiment
Case I:Theory said, deflection = 5.0 mm. In the experiment,
deflection = 5.5 mm. Is it meant that the theory wrong ? Ask first what is the error limit. If the error is 0.75 mm, the theory is correct.

Error (Uncertainty)Case II :Two experimentalist doing measurement on the time taken for
……………. The first researcher give the result as 20.4 0.4 sec. While the second researcher give 19.8 0.8 sec.
Is their result contradict ?
No, their results is actually overlapping. However, we are more confident with the first one because the error is half of the second, meaning that the measurement is done very carefully.

ANALYSIS AND INTERPRETATION

Analysis and Interpretation
Statistical
Numerical – software
Graphical
Combination

Line chartsA powerful tool to explain results in terms of ‘cause and effect’
The horizontal x-axis is normally used for the independent variable (the cause or controlled variable)
The vertical y-axis is normally used for dependent variable (the effect).
To describe the development or progression
To show trends, response or behaviour in data

Line graph

Pie chartPresent data in segments
Convey simple and straightforward proportion of each category
Each segment is presented in terms of percentage
Can only be used with one data set

Academic Staff

Bar chartAn effective way of presenting frequencies
Common in reports of small scale research
The bar height represents quantity or amount
The number of bars represents the categories
Visually striking and simple to read

Bar chart

Scatter chartsUseful to present many data values
To show correlations between two variables
To draw conclusions about relationship in the data

CONSTRUCTION OF HISTOGRAM

WHAT IS HISTOGRAM?
A histogram is a graphical display of tabulated frequencies as well as a graphical version of a table that shows what proportion of cases fall into each of several or many specified categories.

HISTOGRAMA histogram is the most important graphical
tool for exploring the shape of data distributions (Scott, 1992).
The shape examined from the histogram puts the type of distribution into view.
A histogram can be constructed by plotting the frequency of observation against midpoint class of the data.

Number of class
where;a : number of bin / classn : number of observation (data)


TIPS!If there are too few classes, it is difficult to see how the data vary.
If there are too many classes, then the table is less of a summary

SUMMARIZING DATA BY NUMERICAL MEASURES

SAMPLE MEANThe sample mean is defined as the sum of the
observed variable, x divided by the number of observed values.

SAMPLE MEDIAN & MODEThe sample median of a variable x is
defined as the middle value when the n sample observations of x are ranked in increasing order of magnitude
The sample mode of a variable x is defined as the value with the highest frequency

When to use mean, median & mode?Mean – for normally distributed data (symmetrical distribution)
Median & Mode – for markedly skewed data

Sample Standard DeviationStd measures the deviation of variable x
from its sample mean.

Other Measures of VariationVariation = Std2

COEFFICIENT OF VARIATIONCOV is expressed as a percentage and can be
defined as a ratio of Std to sample mean. It is frequently used to compare the variabilities of two sets data.

SKEWNESSMeasure the asymmetry of the probability
distribution of a random variable.

SKEWNESSPearson’s skewness coefficient

KURTOSISKurtosis (from the Greek word κυρτός, kyrtos or
kurtos, meaning bulging) is a measure of the "peakedness" of the probability distribution of a real-valued random variable
Kurtosis is a measure of whether the data are peaked or flat relative to a normal distribution
Higher kurtosis means more of the variance is due to infrequent extreme deviations, as opposed to frequent modestly-sized deviations.


CONTINOUS PROBABILITY DISTRIBUTION
NORMAL DISTRIBUTION

NORMAL DISTRIBUTIONThe normal distribution is the most important
in Statistics.
It has a symmetrical bell shape, with most values concentrates towards the middle, a few extreme values, and it is unimodal.
It has two parameters, m and s

NORMAL DISTRIBUTION

NORMAL DISTRIBUTIONApproximately 68% of the area under any
normal distribution curve lies within one standard deviation of the mean.
Approximately 95% of the area under any normal distribution curve lies within two standard deviation of the mean.
Approximately 99% of the area under any normal distribution curve lies within one standard deviation of the mean.

Normal DistributionTotal area under the curve = 1.0
or 100%The area under the curve :
within 1 std. deviation = 0.68 or 68%; within 2 std deviation = 95% within 3 std deviation = 99.7
-2s s 2s-3s 3s-s
s-s
-2s 2s
-3s 3s
95%
99.7%
68%

NORMAL DISTRIBUTION

STANDARD NORMAL DISTRIBUTIONA standard normal distribution is a normal distribution
with zero mean and one unit variance , given by the probability function and distribution function

SAMPLES AND POPULATION
STATISTICAL INFERENCE

INTRODUCTIONStatistical Inference is drawing a conclusions
from sample data about the larger populations from which the samples are drawn.
A population is the whole set of a measurements or counts about which we want to draw a conclusion.
A sample is a subset of the population, a set of some of the measurements or counts which comprise the population.

CONNECTIONWhat is the connection between the mean, std
and shape of the parent population and the mean, std and shape of the sampling distribution of the sample mean?

CONFIDENCE INTERVAL ESTIMATION

INTERVAL ESTIMATEStatistical theory indicates that the size of
the error term and hence the width of the interval, depend on;
1. The sample size2. The variability of the variable3. The level of confidence we wish to have that
the population mean does in fact lie within the specified interval

95% CONFIDENCE INTERVALIt means that on 95% of occasions when such
intervals are calculated the population mean will actually fall inside the interval we have calculated from the sample data.
On the other 5% of occasions, it will fall outside the interval.

95% CONFIDENCE INTERVAL

95% CONFIDENCE INTERVAL FOR SMALL SAMPLE SIZE

Student’s DistributionThe Student's t-distribution (or also t-
distribution), in probability and statistics, is a probability distribution that arises in the problem of estimating the mean of a normally distributed population when the sample size is small.
It is the basis of the popular Student's t-tests for the statistical significance of the difference between two sample means, and for confidence intervals for the difference between two population means.

Why use t-distribution?Confidence intervals and hypothesis tests rely on Student's t-distribution to cope with uncertainty resulting from estimating the standard deviation from a sample, whereas if the population standard deviation were known, a normal distribution would be used.

RELIABILITY TESTING Questionnaire and Survey Data

CRONBACH’S ALPHA (Α) COEFFICIENTCronbach's alpha is a measure of internal
consistency, that is, how closely related a set of items are as a group.
In theory this is the proportion of the observed data that can be attributed to the population data
This method is used to measure the internal consistency of multiple-item measurements, representing the averaged correlation between the items.

CRONBACH’S ALPHA (Α) COEFFICIENT
Internal consistency is typically a measure based on the correlations between different items on the same test (or the same subscale on a larger test).
It measures whether several items that propose to measure the same general construct produce similar scores.
For example, if a respondent expressed agreement with the statements "I like to ride bicycles" and "I've enjoyed riding bicycles in the past", and disagreement with the statement "I hate bicycles", this would be indicative of good internal consistency of the test.

CRONBACH’S ALPHA (Α) COEFFICIENT As multiple-item measurements are in theory repeated
measurements of the same thing, the coefficient represents the reliability of the overall measurement.
A "high" value of alpha is often used (along with substantive arguments and possibly other statistical measures) as evidence that the items measure an underlying (or latent) construct.
However, a high alpha does not imply that the measure is unidimensional.
Spearman-Brown coefficients is another reliability testing method

SOURCE: George, D., & Mallery, P. (2003). SPSS for Windows step by step: A simple guide and reference. 11.0 update (4th ed.). Boston: Allyn & Bacon

HYPOTHESIS TESTINGANOTHER BRANCH OF STATISTICAL
INFERENCE

HYPOTHESIS TESTING
A hypothesis is a conjecture about a population parameter. This conjecture may or may not be true.
An educated guess based on theory and background information
Hypothesis Testing is a process of using sample data and statistical procedures to decide whether to reject or not reject a hypothesis (statement) about a population parameter value.

Hypothesis - exampleSituation A: A researcher is interested in finding out
whether a new medicine will have any undesirable side effects on the pulse rate of the patient. Will the pulse rate increase, decrease or remain unchanged. Since the researcher knows the pulse rate of the population under study is 82 beats per minute, the hypothesis will be
Ho : = 82 (remain unchanged)H1 : 82 (will be different)
This is a two-tailed test since the possible effect could be to raise or lower the pulse

Hypothesis - example
Situation B: A chemist invents an additive to increase the life of an automobile battery. The mean life time of ordinary battery is 36 months. The hypothesis will be:
Ho : 36Ha : > 36
The chemist is interested only in increasing the lifespan of the battery. His alternative hypothesis is that the mean is larger than 36. Therefore the test is called right-tailed, interested in the increase only.

Hypothesis - example
Situation C: A contractor wishes to lower heating bill by using a special type of insulation in house. If the average monthly bill is RM100, his hypothesis will be
Ho : RM 100H1 : RM 100
This is a left-tailed test since the contractor is only interested in reducing the bill

HYPOTHESIS TEST STEPS1. Decide on null hypothesis, H0.2. Decide on an alternative hypothesis, H13. Decide on a significance level4. Calculate the appropriate test statistic, using the
sample data5. Find from tables the appropriate tabulated test
statistic6. Compare the calculated and tabulated test statistics,
and decide whether to reject the null hypothesis, H0.7. State a conclusion, after checking to see whether the
assumptions required for the test in question are valid.

HYPOTHESISThe null hypothesis generally expresses the
idea of no difference.
The alternative hypothesis, which we denote by H1, expresses the idea of some difference.
Alternative hypothesis may be one-sided (greater or less than) or two-sided (not equal to)

Test of significanceA z-test is used for testing the mean of a population versus a standard, or comparing the means of two populations, with large (n ≥ 30) samples whether you know the population standard deviation or not. It is also used for testing the proportion of some characteristic versus a standard proportion, or comparing the proportions of two populations.
Example: Comparing the average engineering salaries of men versus women.
Example: Comparing the fraction defectives from 2 production lines.

Test of significanceA t-test is used for testing the mean of one population against a standard or comparing the means of two populations if you do not know the populations’ standard deviation and when you have a limited sample (n < 30). If you know the populations’ standard deviation, you may use a z-test.
Example: Measuring the average diameter of shafts from a certain machine when you have a small sample.
An F-test is used to compare 2 populations’ variances. The samples can be any size. It is the basis of ANOVA.
Example: Comparing the variability of bolt diameters from two machines.

WHAT IS A SIGNIFICANCE LEVELA significance level of 5% is the risk we take in rejecting the null hypothesis.

CHI-SQUARE GOODNESS OF FIT TESTChi-square value or can be denoted as 2
provided a good test to fit the hypothesis distribution with the real one.
The observed data can be grouped into class interval and observed frequency, O.
Suppose that for a group of observation data, a distribution can be specified for any whatsoever type by making hypothesis based on the histogram shape.

CHI-SQUARE GOODNESS OF FIT TEST
For each class of the grouped data, the expected frequency for each class can be estimated on the basis of the hypothecal distribution.
It can be carried out by multiplying the reliability density function of hypothesis distribution for each class interval with number of data, n to obtain expected frequency, E.
The 2 then can be estimated for each class using the given formula;

CHI-SQUARE GOODNESS OF FIT TESTAll single value of 2 for each class can be summed up.
The hypothesis can be verified by comparing the estimated 2 with the critical value for 2 statistic from Chi-square statistic table
If the critical value for 2 statistics is less than the calculated value, the proposed distribution will be rejected.
The 2 value from the statistic table can be determined based on level of significance

ESTIMATED CHI-SQUARE
2 = chi-square value.E = expected value.O = observed value.k = degree of freedom.n = number of class

THE SHAPIRO-WILK TEST

LINEAR REGRESSIONSINGLE AND MULTIPLE REGRESSION

CORRELATION COEFFICIENT, rPearson’s Sample Correlation Coefficient, r,
is used to measure the strength and direction of the association between two numerical paired variables
r can be any value from –1 to +1. The closer r is to one (in magnitude) the
stronger the linear association is. If r equals zero, then there is no linear
association between the two variables.

LINEAR REGRESSIONLinear regression give estimate / predict the
outcome of one variable upon another dependent variable. based on linear relationship.

MULTIPLE REGRESSIONMultiple Regression is an extension of simple
regression.
Simple regression has only one independent (explanatory) variable.
Multiple Regression fits a model for one dependent (response) variable based on more than one independent (explanatory) variables.

MULTIPLE REGRESSION

VISUAL REPRESENTATION
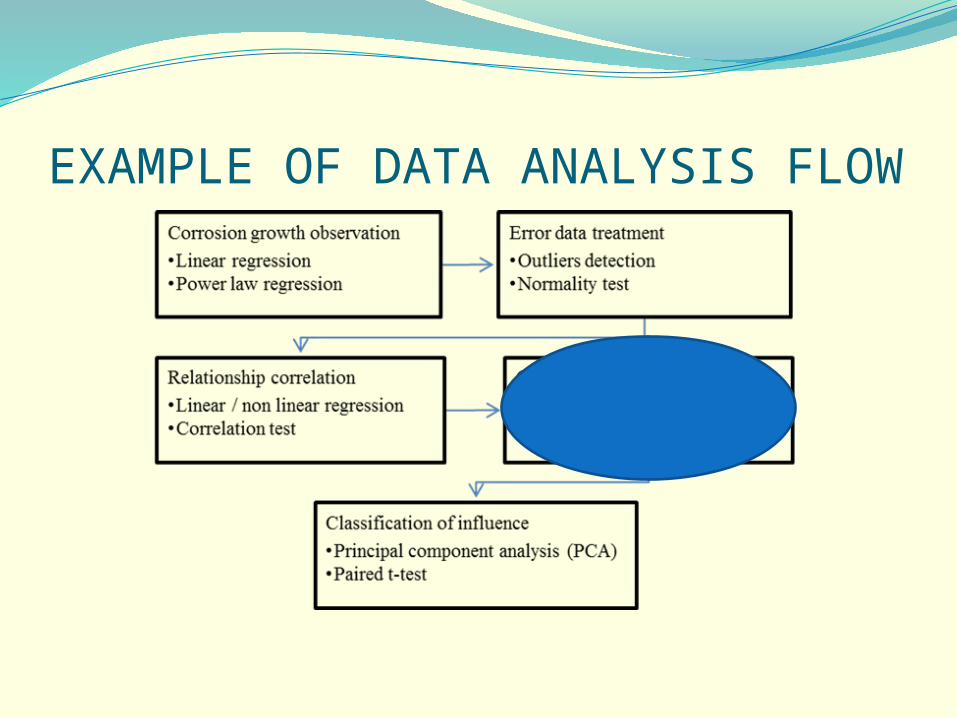
EXAMPLE OF DATA ANALYSIS FLOW

Normality TestNormality is one of the important underlying
assumptions for the many statistical tests. Some of the statistical test have the limitation which the data set must follow a normal distribution.
If this condition is not satisfied, the test result may give a wrong finding. The purpose of normality test is to test the degree of normality of variables.
The normality test can be carried out using Shapiro-Wilk (S-W) and Kolmogorov-Smirnov (K-S) test .

Principal component analysis (PCA) Principal component
analysis (PCA) is widely used in statistics, signal processing and neural computing to reduce the number of variables in database and to detect structure in the relationships between variables, that is to classify variables

![Justin Bieber The Key Eau du Parfum 100mL Justin Bieber ...files.shoppersdrugmart.ca/offers/justin-bieber/july2013/JB3_presell... · [ ] Justin Bieber The Key 100mL $70.00* [ ] Justin](https://img.pdfslide.us/doc/110x75/5e5cf67620150154c60a2919/justin-bieber-the-key-eau-du-parfum-100ml-justin-bieber-files-justin-bieber.jpg)