Embed Size (px)
Citation preview

▲281The Journal of The South African Institute of Mining and Metallurgy JUNE 2003
Introduction
Since 1967, the South African coal miningindustry has been served well by the coal pillardesign method of Salamon and Munro (1967).The formula was created in the aftermath ofthe infamous Coalbrook Colliery pillar collapsedisaster in 1960. Since the introduction of theformula, there has not been a repetition of acollapse of that magnitude, although there wasat least one close call when workers had timeto evacuate a collapsing area at the SpringlakeColliery in 2001.
The Salamon-Munro formula was derivedempirically, making use of two data bases; onefor failed pillar cases and one for stable cases.The empirical approach may be faulted for its
lack of scientific explanation of all the factorsthat impact on pillar stability, but in a complexand variable environment, such as coalmining, it has no practical equal.
In 1965, Salamon and Munro approved 27cases of failed pillars for inclusion in the faileddata base. Since that time, additional failureshave occurred. An additional 17 wereidentified by Madden (1995), who re-analysedthe data and found a formula that wasdifferent from the original Salamon-Munroone, but not sufficiently different to warrantchanging what had become a national designmethod.
Since 1995, still more failures haveoccurred and some earlier ones that had notbeen reported, became known. There arecurrently over 70 known cases of pillarcollapse. It is therefore warranted to re-analysethe data to ascertain whether the strengthformula of Salamon and Munro (1967) is stillthe best to use for pillar design.
Since it had been shown that there aredistinct differences in the strength of coalpillars in some areas of South Africa, it ismotivated in this paper to split the data base offailed pillars into ‘Weak’ and ‘Normal’ strengthsections. The ‘Normal’ section was re-analysedusing the statistical procedure that results inthe maximum separation of the ‘Failed’ and‘Stable’ data bases as this reduces theuncertainty to the lowest level.
The resulting pillar strength formula islinear with respect to the width-to-height ratio,corresponding with recent laboratory tests andthe full size formula that was proposed byBieniawski (1968).
It should be borne in mind throughout thatin both this and the Salamon and Munro(1967) analysis, the work on failed pillars wasbased on the data base of failed pillars,representing less than 0.3% of the totalpopulation of pillars.
New pillar strength formula for South African coalby J.N. van der Merwe*
Synopsis
The data base of failed pillar cases as used by Salamon and Munro(1967) in their original analysis to determine the strength of coalpillars empirically, has been updated for this study. It is shown thatthe Vaal Basin and Klip River coal fields exhibit similar behaviourthat differs from the failures in other areas, i.e. failure at highsafety factors within a short period of time. Those collapse caseshave been omitted from the new data base. Failures in the otherareas that occurred after 1967 have been added.
Using a technique to minimize the area of overlap between thepopulations of safety factors of failed and intact pillar cases, thenew data base was re-analysed in conjunction with the originalSalamon-Munro data base of intact pillar cases, from which thecases in the areas of weak coal were likewise eliminated.
It was found that a linear formula reduced the overlap area by22%. The new formula predicts higher strength for pillars with awidth-to-height ratio greater than approximately 2.0 to 3.0 and alower strength for smaller pillars. It was also found that in order toobtain the same relative measure of stability as with the Salamon-Munro formula, the strength constant in the new formula should bewithin a range of 2.8 to 3.5 MPa.
For most current South African coal mining conditions, usingthe new formula for pillar strength will result in leaving smallerpillars without sacrificing stability. The reason for this is that theSalamon-Munro formula under-estimated the strength of largerpillars and over-estimated the strength of smaller pillars. The newformula will thus result in improved reserve utilization withoutsacrificing stability.
* Department of Mining Engineering, University ofPretoria.
© The South African Institute of Mining andMetallurgy, 2003. SA ISSN 0038–223X/3.00 +0.00. Paper received Nov. 2002; revised paperreceived Feb. 2003

New pillar strength formula for South African coal
The data base
In performing empirical analyses, the data base is of criticalimportance. The data base for failed cases that was used forthis investigation was based on the Salamon-Munro one,with the addition of selected post- 1965 failures and theelimination of collapses from the ‘weak coal areas’, see nextsection. The data base for intact pillars was the Salamon-Munro data base, from which 9 cases originating in the same‘Weak coal areas’ were likewise eliminated.
The ‘Weak coal’ areas
It is well known that there are areas in the country where thecoal is distinctly weaker than elsewhere, even if the reducedstrength cannot be quantified in all cases. The Vaal Basin isone for which the reduced strength has been quantified usingempirical methods, Van der Merwe (1993). A method todistinguish between the strength of different coal samplesbased on laboratory strength was developed by Van derMerwe (2001), which confirmed that the Vaal Basin coal issignificantly weaker than elsewhere.
Figure 1 shows the Safety Factors for all failed cases as afunction of time. From that, it is seen that the Vaal Basin andKlip River Coalfield exhibit similar patterns, namely failuresat high safety factors in a relatively short time, while the restof the failures all tend to form a unified, if spread, group.
The Vaal Basin and Klip River failures were thenexcluded from the data base.
Addition of new failures
The original Salamon-Munro data base consisted of 27 casesof failed panels, including 3 from the Vaal Basin which wereexcluded from the new data base. Madden (1995) identifieda further 17 cases, including 2 from the Vaal Basin whichwere likewise not added to the new data base.
Since 1995, a further 28 failures became known. Someoccurred after 1995 while others had occurred earlier butwere not reported, as there were no losses associated withthe failures. Of these, 8 were from the Vaal Basin and 5 fromthe Klip River coal field. The remaining 15 were added to thedata base.
The data base containing 54 cases of failed panels, as itwas used for this analysis, is contained in Appendix A.Figure 2 shows the numbers of cases from the different coalfields. Table I lists the limits of the important parameters thatare contained in the data base of failed pillar cases.
The intact data base
The data base of intact cases, was the original one created bySalamon and Munro (1967), from which 9 cases that wereknown to have been in the Vaal Basin (the ‘Weak coal area’)were eliminated. Table II lists the limits of the importantparameters that are contained in the data base of intact pillarcases.
Method of analysis
For the analysis, it was postulated that in order to be optimal,the formula that is used should result in the greatest possibleseparation (or minimum overlap) of the safety factors in thedata bases of failed and intact cases. The technique that wasused, is based on the technique to predict probabilities offailure using the distributions of demand and capacity of asystem.
The technique, described by Harr (1987), essentiallyentails calculating the area of overlap between two distrib-utions. In this case, the one distribution was the distributionof safety factors of failed pillar cases and the other was thedistribution of safety factors of stable pillar cases. The perfect
▲
282 JUNE 2003 The Journal of The South African Institute of Mining and Metallurgy
*The two Delmas samples were tested in different laboratories under different conditions
Figure 1—Failures shown as function of Safety Factor and Time, for the different coal fields
FOS vs. Life—all failed cases
Life
6.00
5.00
4.00
3.00
2.00
1.00
0.000 10 20 30 40 50 60
◆ Free State
▲ Klip River
▲ South Rand
✕ Utrecht
■ Vaal Basin
● Witbank
▲
■
Fac
tor
of
Saf
ety

New pillar strength formula for South African coal
▲283The Journal of The South African Institute of Mining and Metallurgy JUNE 2003
Appendix A.
Data base of failed pillarsIn the following table, the prefix ‘s’ in front of the case numbers, indicate that the data is from the original Salamon-Munro data base. Likewise, the prefix ‘m’indicates that the data was gathered by Madden and ‘n’ that the data is post- 1995.
Case no. Colliery Seam Coalfield Depth (m) Pillar width (m) Bord width (m) Mining height (m)
s9 New Largo W4 Witbank 30.5 3.4 6.4 2.6s67 Springfield Main South Rand 184.7 15.9 5.5 5.5s66 Springfield Main South Rand 193.2 15.9 5.5 5.5s64 South Witbank W4 Witbank 61.0 4.7 6.9 3.5s60 Coalbrook OFS2 Vaal Basin 152.4 12.2 6.1 4.9s59 Cornelia OFS2 Vaal Basin 57.9 5.2 6.4 3.7s58 South Witbank W5 Witbank 57.9 5.2 6.4 5.5s57 Koornfontein W2 Witbank 88.4 7.2 6.6 4.9s55 Blesbok W5 Witbank 68.6 3.4 5.8 1.5s54 Welgedacht Springs Springs-Witbank 62.5 6.1 7.6 2.4s42 South Witbank W5 Witbank 53.3 5.2 6.4 3.7s41 Crown Douglas W2 Witbank 30.5 4.6 7.6 3.7s40 Wolvekrans W2 Witbank 33.5 6.1 6.7 5.5s39 Kendal W5 Witbank 36.6 4.6 7.6 2.4s19 Apex Springs Springs-Witbank 36.6 6.1 7.6 4.9s18 Witbank W2 Witbank 27.4 3.7 7.9 2.1s17 Wolvekrans W2 Witbank 29.6 5.2 7.0 5.5s16 M Steam W2 Witbank 21.3 4.0 8.2 4.6s126 Vierfontein Main Free State 87.8 6.1 6.1 2.0s122 Springfield Main South Rand 167.6 15.9 5.5 5.5s120 Cornelia OFS1 Vaal Basin 128.0 9.8 5.5 3.7s12 Coronation W1 Witbank 25.9 3.7 8.5 3.1s119 W. Consol. W4 Witbank 41.1 4.3 6.4 3.1s118 Waterpan W2 Witbank 57.9 6.1 7.6 4.0s117 Waterpan W2 Witbank 61.0 6.1 7.6 3.1s116 Waterpan W2 Witbank 61.0 6.1 6.1 4.6s115 Union Ermelo Breyten Eastern Transvaal 76.2 4.9 6.1 1.4n204 Vierfontein Main Free State 21.0 6.8 5.3 3.2n203 Vierfontein Main Free State 53.0 5.6 6.1 1.8n202 Vierfontein Main Free State 60.0 7.0 6.0 1.8n201 Vierfontein Main Free State 29.0 5.4 6.3 2.9n200 New Largo W Witbank 43.0 4.8 6.2 2.8n199 New Largo W4 Witbank 32.5 3.2 6.5 2.1n198 New Largo W4 Witbank 32.0 3.3 6.4 2.3n196 Sigma OFS2a Vaal Basin 104.0 12.0 6.0 3.0n195 Sigma OFS3 Vaal Basin 82.0 12.0 6.0 3.0n194 Sigma OFS2a Vaal Basin 96.0 12.0 6.0 6.0n188 Umgala Alfred Utrecht 51.5 6.0 6.0 3.9n187 Umgala Alfred Utrecht 97.0 9.0 6.6 3.7n186 Umgala Alfred Utrecht 100.0 8.5 6.5 3.3n185 Umgala Alfred Utrecht 101.0 9.0 6.0 3.8n184 Sigma OFS2a Vaal Basin 112.0 11.5 5.5 2.9n183 Sigma OFS2b Vaal Basin 88.0 11.0 6.0 2.9n182 Sigma OFS2b Vaal Basin 70.0 12.5 5.5 2.9n181 Sigma OFS3 Vaal Basin 96.0 12.0 6.0 2.9n180 Sigma OFS3 Vaal Basin 82.0 10.0 5.0 2.8n179 Ballengeigh 74.0 10.0 5.0 4.0n173 Wolvekrans W2 Witbank 41.0 6.4 6.4 6.2n172 Wolvekrans W2 Witbank 41.0 6.4 6.4 6.2n171 Wolvekrans W2 Witbank 41.0 6.4 6.4 6.2m170 Springfield Main South Rand 205.0 17.0 6.0 5.9m169 Springfield Main South Rand 195.0 17.0 6.0 4.9m168 Springfield Main South Rand 165.7 15.0 5.0 5.9m167 Tweefontein W2 Witbank 62.0 6.1 6.1 4.0m166 Tweefontein W2 Witbank 62.0 6.1 6.1 4.0m165 Springbok W5 Witbank 22.0 3.5 6.5 1.6m164 Wolvekrans W2 Witbank 33.0 6.4 6.4 4.9m163 South Witbank W4 Witbank 56.0 5.1 6.5 3.3m162 Tweefontein W2 Witbank 62.0 7.3 6.2 4.0m159 Sigma OFS2 Vaal Basin 108.0 10.6 6.5 3.2m157 Sigma OFS2 Vaal Basin 112.0 10.6 6.5 2.8m151 Tweefontein W2 Witbank 62.0 7.5 6.4 4.0m150 Blesbok W5 Witbank 57.0 3.6 5.4 1.4m149 Koornfontein W2 Witbank 90.0 7.5 6.0 4.8m148b New Largo W4 Witbank 34.0 3.5 6.7 2.7m148a New Largo W4 Witbank 34.0 3.5 6.7 2.7m148 New Largo W4 Witbank 28.5 3.8 5.8 2.7
New pillar strength formula for South African coal
formula would result in no overlap between these distrib-utions. While perfection is not yet possible, the formula canbe optimized by minimizing the overlap area, see Figure 3.
It is common cause that the strength of a pillar is afunction of its width-to-height ratio (w/h) and a constantrepresenting the strength of the coal material, the mostcommon notion of the latter being that it is the strength of acubic block of coal with dimensions of a metre.
Then,
[1]
Where k = constant representing the strength of the coalmaterial
w = pillar widthh = pillar heightα,β = constants.
In the Salamon-Munro formula, k = 7.17 MPa, α = 0.46and β = -0.66.
The Safety Factor is then simply the ratio of pillarstrength to load, the latter being calculated using theTributary Area Theory.
The method that was used, was to vary α and β between0.2 and 2.0 in increments of 0.2. For each combination, thesafety factors of the cases in both the failed and intact pillardata bases were calculated. This resulted in 100 data sets ofsafety factors for each of the failed and intact pillar case databases. Then, the overlap area between the frequency distrib-utions of the safety factors of failed and intact pillar cases foreach set of data was calculated. This was then compared tothe overlap area using the Salamon and Munro (1967)strength formula.
The following procedure, from Harr (1987), was used todetermine the relative change in the overlap areas betweenfailed and intact pillar cases:
[2]
where Ms = Mean safety factor of the population of stablepillars
Mf = Mean safety factor of the population of failedpillars
fM M
S S
s f
s f
=−
+2 2
σ β= kw ha
▲
284 JUNE 2003 The Journal of The South African Institute of Mining and Metallurgy
Figure 2—Localities of the cases of failed pillar cases
Table I
Limits of mining depth, pillar width, bord width, mining height and width-to-height ratio that are contained in thefailed data base
Depth (m) Pillar width (m) Bord width (m) Mining height (m) Width-to-height
Maximum 205.0 17.0 8.5 6.2 3.8Minimum 21.0 3.2 5.0 1.4 0.9Average 65.7 6.7 6.4 3.7 1.9Standard deviation 47.2 3.7 0.8 1.4 0.8
Table II
Limits of mining depth, pillar width, bord width, mining height and width-to-height ratio that are contained in theintact data base
Depth (m) Pillar width (m) Bord width (m) Mining Height (m) Width-to-height
Maximum 219.5 21.7 7.6 5.2 8.8Minimum 19.8 2.7 3.7 1.2 1.2Average 82.7 9.1 6.0 2.8 3.7Standard deviation 43.0 3.7 0.5 1.1 1.8
Witbank69%
Free State9% South Rand
11%
Springs-Witbank4%
Utrecht7%

Ss = Standard deviation of the safety factors of thestable pillars
Sf = Standard deviation of the safety factors of thefailed pillars.
Then,
[3]
and the overlap area between the two populations is
[4]
Finally, the improvement factor, I, for each of the sets is:
[5]
where As = overlap area with the original Salamon andMunro formula
An = overlap area with the new formula.It should be noted that the k-constant does not influence
the overlap area, as changing it merely has the effect ofshifting both the intact and the failed distributions by thesame amount.
Optimizing α and β
The results of the investigation are shown in Figure 4. TheFigure shows contours of the percentage reduction of theoverlap area between the safety factors in the failed andintact pillar data bases for using different values of α and β,using the Salamon-Munro values as a basis for comparison.
It is seen that the best improvement can be obtained byusing values of 1.15 and 1.2 for α and β respectively. Usingthese values will result in a 23% reduction of the overlaparea between the data bases of failed and intact pillar cases.
However, it was seen on numerous previous occasions,including the analysis of van der Merwe (2001) and the workof Bieniawski (1968), that there is a linear relationship
between the strength of a coal specimen and the w/h ratio. Itwas therefore decided for the rest of the investigation toadopt a conservative approach by using the linear form, i.e. α = β = 1.0. This combination results in a 22% reduction ofthe overlap area.
The frequency distribution of safety factors of the datasets of failed and intact pillar cases using the Salamon-Munro constants is shown in Figure 5. Figure 6 shows thesame distributions, for the case where the linear constantsare used. Visual comparison of the two Figures also showsthe reduction of the overlap area for the case where a linearrelationship is used.
Matching k to α and β
The constants k, α and β are inter-dependent andconsequently changing one also requires changing theothers. It was decided to adhere to the accepted norm that ata safety factor of 1.0, the probability of having a stable lay-out should be 0.5. The probability of having a stable lay-outfrom the point of view of the collapsed pillar cases, is givenby the cumulative frequency distribution of the population offailed pillar cases.
Note that the real probability of having a stable lay-out ismuch greater, as that should be determined using all thecases of stable lay-outs at specific safety factors incomparison with the recorded cases of failed pillar cases. It isestimated that less than 0.3% of all pillars have failed—thedata base of failed pillar cases thus represents less than 0.3%of all the pillar cases (a ‘pillar case’ in this sense refers to apanel mined with bord-and-pillar mining). As a very roughindicator, the real probability of failure (the inverse of theprobability of having a stable lay-out) is therefore approxi-mately 0.003 times the probability of failure based on thefailed cases only. For simplicity, the probabilities of having astable lay-out as referred to in this paper, reflects theprobabilities based on failed cases only.
IA A
As n
s
=−
A = −0 5. .ψ
ψ π= − ( ) −
−0 51
22
0 52
. exp.
f
f
New pillar strength formula for South African coal
▲285The Journal of The South African Institute of Mining and Metallurgy JUNE 2003
Figure 3—Concept of separating the distributions of failed and stable pillar cases
Overlap
Safety factor
Nor
mal
ized
fre
quen
cy
Distribution of stable casesDistribution of failed cases

New pillar strength formula for South African coal
Using the original data base created by Salamon andMunro (1967) with their formula, the requirement of having50% of pillars in the failed data base fail at a safety factor of1.0 was satisfied, see Figure 7. However, when using theextended data base with the original Salamon-Munrostrength formula, it was found that the probability of havinga stable lay-out at a safety factor of 1.0 is only about 0.3 or30%. The k-value should be reduced to 6.5 MPa from theoriginal value of 7.17 MPa in order to satisfy therequirement. With the adjustment, the probability of having astable lay-out is approximately 50%, at a safety factor of 1.0.The adjusted Salamon-Munro formula will be used as a basisfor comparison with the linear formula.
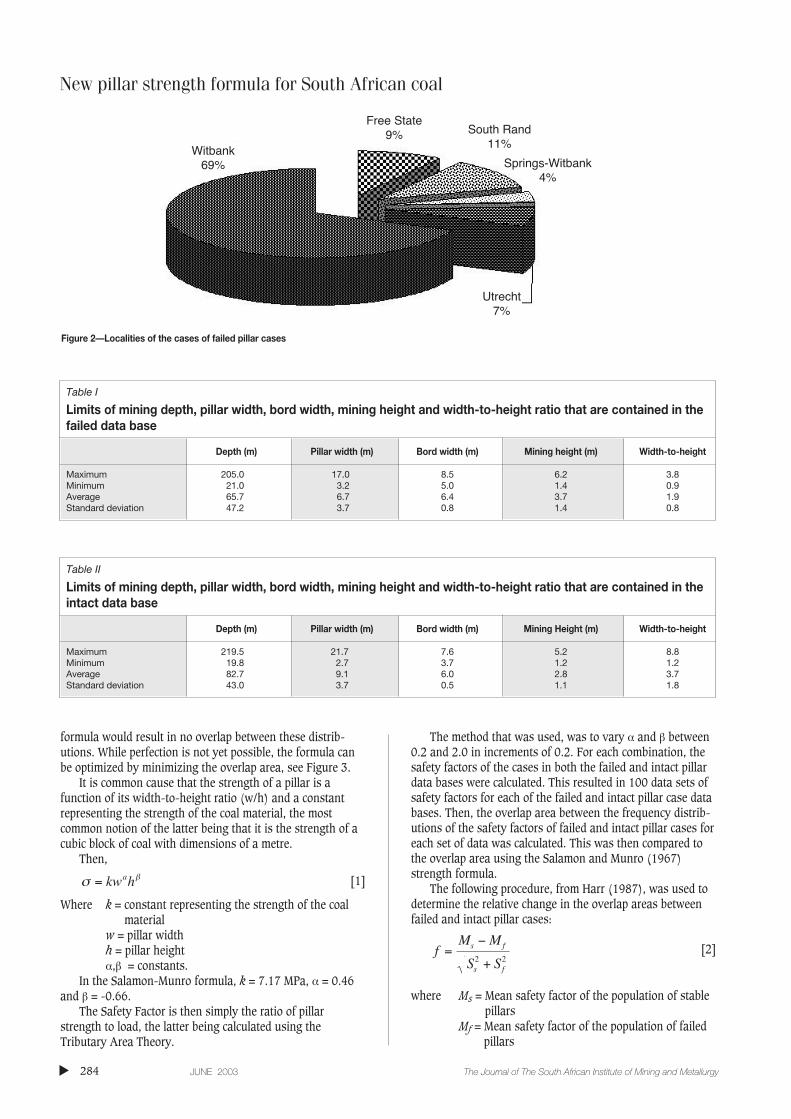
Once α and β have been fixed, the required value of k toresult in a 50% probability of having a stable lay-out at asafety factor of 1.0 can be found by adjusting it until thesafety factor of 1.0 results in a probability of having a stablelay-out of 0.5 (or 50%). It was found that for the linearrelationship, the value of k should be 3.5 MPa. At that valuethe probability of having a stable lay-out is 0.5 with a safetyfactor of 1.0, see Figure 8. It is also seen that the distributionis almost identical to the distribution obtained by using theadjusted Salamon-Munro formula.
This implies that the probability of having a stable lay-out is the same for the linear formula with k = 3.5 as it iswith the adjusted Salamon-Munro formula.
▲
286 JUNE 2003 The Journal of The South African Institute of Mining and Metallurgy
Figure 4—Contours of the reduction of overlap area between the data sets of safety factors of failed and intact pillar cases for variation of α and β
Figure 5—Distribution of the normalized frequencies of safety factors of failed and intact pillar cases showing the overlap area using the Salamon-Munroconstants
Salamon-Munro normalized frequencydistributions
Safety factor
0.6
0.5
0.4
0.3
0.2
0.1
00 1 2 3 4 5 6 7 8
Failed
Intact
OverlapNo
rmal
ized
fre
qu
ency
Percentage reduction of overlap area
Beta
6.00
5.00
4.00
3.00
2.00
1.00
0.00
2
1.8
1.6
1.4
1.2
1
0.8
0.6
0.4
0.2
20-2416-2012-168-124-80-4-4-0
Salamon-Munro
Alpha
2 1.8 1.6 1.4 1.2 1 0.8 0.6 0.4 0.2

New formula for strength
Based on the foregoing, where it was shown that α = β = 1and k = 3.5 MPa results in the smallest overlap between thepopulations of failed and intact pillar cases while satisfyingthe requirement that a safety factor of 1.0 should imply afailure probability of 50%, it is seen that the followingformula reflects coal pillars for South Africa, excluding theVaal Basin and Klip River coal fields:
[6]
However, an issue that has to be addressed is the safetyfactor that is to be used in practical mining. The originalnorm that for production panels, the safety factor should be1.6, was based on Salamon and Munro’s (1967) observationthat the most frequent value of safety factor in the stabledata base was 1.6, see Figure 5. According to Figure 6, thatvalue when using the linear formula is approximately 2.0. Ifthe same norm is to be used, then the safety factor forproduction panels should be increased to 2.0 when the linearformula is used.
σ = 3 5.w
h MPa
New pillar strength formula for South African coal
▲287The Journal of The South African Institute of Mining and Metallurgy JUNE 2003
Figure 6—Distribution of the normalized frequencies of safety factors of failed and intact pillar cases showing the overlap area using the linear constants
Figure 7—Probability of having a stable lay-out as a function of safety factor, for the Salamon-Munro formula
Linear formula normalized frequencydistributions
Safety Factor
0.6
0.5
0.4
0.3
0.2
0.1
0
0 1 2 3 4 5 6 7 8
Failed
Intact
OverlapNo
rmal
ized
fre
qu
ency
FOS vs. Probability of stability
Safety factor
1
0.9
0.8
0.7
0.6
0.5
0.4
0.3
0.2
0.1
00. 0.5 1 1.5 2 2.5 3
Salamon— adjusted formula, new data base
Salamon - original formula, new data base
Salamon original formula, old data base
Pro
bab
ility
of
stab
ility
New pillar strength formula for South African coal
However, reference to Figure 8 indicates that using eitherformula will result in the same measure of stability at a safetyfactor of 1.6. Comparison of the distributions in Figures 7and 8 indicates that using either formula results in a lowerprobability of stability at a safety factor of 1.6 than wasoriginally believed to be the case, using the limited data baseof the 1960s. This implies that in order to achieve the sameconfidence that pillars will be stable, it is required to designto higher safety factors, no matter which formula is used. Thereason for this conclusion is not because the formulaechanged, but because the new data base contains double theamount of information than was available in the 1960s.
Implementing a new norm for safety factor into coalmining after more than 30 years will be a traumaticexperience. It is therefore suggested, seeing that the safetyfactor Is directly proportional to the strength constant, or k, inthe formula, to rather reduce k by a factor 1.6/2.0 = 0.8 andthen maintain the existing norms for magnitude of safetyfactor, i.e. that production panels should be designed to asafety factor of 1.6, etc. The upper limit for k should then be3.5 and the lower limit should be 2.8 in the linear formula.
Thus, Equation [6] will be the upper limit for strengthand Equation [7] the lower limit:
[7]
Figure 9 shows the comparison of pillar strengths fordifferent w/h obtained with the adjusted Salamon-Munro andthe lower and upper limits of the linear strength formulae.The pillar height used for this comparison was constant at 3 m.
The value of k, in the range 2.8 to 3.5 MPa, that is to beused on individual mines, should be determined by localexperience and controlled experimentation.
Power vs. linear format
The proposed new formula is linear, as opposed to the power
format of Salamon-Munro. Much has been argued about theformat of the strength formula and this issue needs to beaddressed. In South Africa, the power form has beenpreferred, while in the USA the linear form appears to bemore popular. Both have been proposed for Australia, Galvinet al. (1999).
There appears to be general consensus that the strengthof a pillar is a function of the material strength, representedby the symbol k, the pillar width, w and the pillar height h.
The generic form for most strength formulae is given byEquation [1], repeated here:
The difference in form between the different formulae, isdue to the difference between the magnitudes of α and β.
In the linear formula, α = 1β = -1According to Salamon-Munro (1967),α = 0.46β = -0.66.
Accounting for volume
In the strict sense of the word, both forms only account fordifferences in the shapes of pillars, and not for volume. It hasbeen argued that the power formula of Salamon-Munro doesaccount for volume. In the strict sense, however, it onlyaccounts for volume provided that the pillar shape is not suchthat
For all cases where w = h1.43, the Salamon-Munro (1967)formula will predict exactly the same strength, irrespective ofpillar volume.
The same argument is valid for the linear format, withdifferent numbers. For a linear formula, it can be stated thatit does account for volume for all cases except if the pillarshape is such that
w h= 1 43. .
σ β= kw ha
σ = 2 8.w
h
▲
288 JUNE 2003 The Journal of The South African Institute of Mining and Metallurgy
Figure 8—Comparison of the probabilities of having a stable lay-out as a function of safety factor, using the adjusted Salamon-Munro formula and thelinear formula on the extended data base
FOS vs. Probability of stability
Safety factor
1
0.9
0.8
0.7
0.6
0.5
0.4
0.3
0.2
0.1
00. 0.5 1 1.5 2 2.5 3
Salamon—adjusted formula, new data base
Linear, new data base
Pro
bab
ility
of
stab
ility

Either formula can be written in a form that creates theimpression that it does account for volume, V, as follows—
For the Salamon-Munro power formula, after Salamon(1992):
[7]
The equivalent containing a term for volume in the caseof the linear formula can be expressed as:
[8]
However, the argument is to some extent academic. Thevolume consideration does not have significant effect inpractice, as it has been shown several times, for instance byBieniawski (1968) and Van der Merwe (2001), that beyond apillar size of 1.5 m to 2 m the size (or volume) effectbecomes insignificant. Real mine pillars mostly havedimensions of several metres and consequently the volumeeffect on pillar strength for real mine pillars can be ignored.
Strength of the weaker coal
The technique as outlined in the ‘Method of analysis’ sectionof this report cannot be used for the weaker coal areas usingthe same data base for the intact pillars. It would be incorrectto compare a specific group of failures in a known area ofweak coal with the general intact data base, which is moresuited to stronger coal areas.
Implications for industry
As shown in Figure 9, The linear formula predicts a higher
strength for pillars with w/h greater than approximately 2.0to 3.0 at a pillar height of 3 m. Figure 10 shows thedifference in percentage recovery for bord-and-pillarworkings with safety factors of 1.6 and 2.0 respectively, forthe depth range of 30 m to 200 m,using the upper and lowerlimits for k. For this example, the mining height was 3 m. Atother mining heights, the numbers will be different althoughthe trends will be the same—the greater the mining height,the greater the benefit of using the linear formula. The SquatPillar formula was used in conjunction with the Salamon-Munro formula where the width-to-height ratio of the pillarsexceeded 5.0.
It is seen from the Figure that industry will benefit byusing the linear formula for production panels with a safetyfactor of 1.6 for cases where the depth exceeds approximately50 to 80 m, depending on whether the upper or lower limitfor k is used. For a safety factor of 2.0, the benefit will startat a depth of 30 to 70 m.
Note that this benefit does not come at the cost ofstability. As shown in Figure 7, the probability of having astable lay-out for any given safety factor is for all practicalpurposes the same for the linear as the Salamon-Munroformula. The price is paid at shallow depth, where the pillarswill have to be larger with the linear formula than whenusing the Salamon-Munro formula.
If South Africa produces 100 Mt of coal per year usingbord-and-pillar mining at an average depth of 100 m, miningheight of 3 m and a safety factor of 1.6, the Salamon-Munroformula implies a percentage extraction of 58%. This resultsin the sterilization of 72 Mt per year. Using the new formulawill improve utilization to 62% at the average k of 3.15,which will decrease the sterilization to 61 Mt, resulting insaving of reserves of approximately 11 Mt per year, which ismore than the total production of a very large mine.
σ = kV
h
0 5
1 5
.
. MPa
σ =
k
w
hV
0 59
0 0667
.
. MPa
w h= 1.
New pillar strength formula for South African coal
▲289The Journal of The South African Institute of Mining and Metallurgy JUNE 2003
Figure 9—Comparison of predicted pillar strength, using the adjusted Salamon-Munro and the upper and lower limit linear formulae. For the comparison,the pillar width was varied while the mining height was constant at 3 m
Strength vs. Width-to-height
Width-to-height
14
12
10
8
6
4
2
0
0. 0.5 1 1.5 2 2.5 3 3.5 4 4.5 6
Adjusted Salamon-Munro
Lower Limit Linear
Upper Limit Linear
Str
eng
th (
MP
a)

New pillar strength formula for South African coal
Conclusions
Format of strength formula
It has been shown that the separation between thepopulations of failed and stable pillar cases can be improvedby 22% by adopting a strength formula which is linear withrespect to the width-to-height ratio of the pillars. It has alsobeen shown that there are sufficiently significant differencesbetween the groups of ‘Weak’ and ‘Normal’ coal to warrantseparate analysis.
Optimum formula for ‘Normal’ coal
For ‘Normal’ coal, comprising the Witbank, South Rand,Utrecht, Springs-Witbank and Free State coal fields, theoptimum strength formula is:
This category can perhaps later be sub-divided to identifya ‘Strong’ coal group.
Implications for stability
It has been shown that using the linear formula results incomparable probability of having as stable lay-out as usingthe power formula. There is therefore no increased risk whenpillars are designed using the linear formula. The balance isobtained by the consideration that at smaller w/h, the linearformula predicts lower strength and at higher w/h it predictshigher strength than the Salamon and Munro (1967)formula.
Implications for industry
It has been shown that at depth exceeding approximately 30to 80 m, there will be a benefit with regard to the percentageextraction. At shallower depth, the percentage extraction willbe less. The greater the depth, the greater the benefit and the
higher the safety factor, the greater the benefit. This hasimportant implications for situations where surface structuresare to be undermined at higher safety factors.
Acknowledgements
This work was sponsored by the Coaltech 2020 researchinitiative, whose support is gratefully acknowledged. Thispaper is based on a similar one that was published by theauthor at the 21st International Conference on GroundControl in Morgantown, West Virginia in August 2002. Theorganizers of that conference are thanked for theirpermission to re-publish the concept in this paper. Mr BillAbel of Anglo American is gratefully acknowledged for hiscontribution through thorough discussion.
References
BIENIAWSKI, Z.T. The effect of specimen size on compressive strength of coal.Int. J. Rock Mech. Min. Sci. Pergamon Press 1968. vol. 5 pp. 325– 335.
BIENIAWSKI, Z.T. A method revisited: coal pillar strength formula based on fieldinvestigations. Proc. Workshop on coal pillar mechanics and design. USBureau of Mines IC 9315. 1992.
GALVIN, J.M., HEBBLEWHITE, B.K., and SALAMON, M.D.G. University of New SouthWales Coal Pillar Strength Determinations for Australian and SouthAfrican Mining Conditions. Proc. Second Intnl. Workshop Coal PillarMech. And Design. NIOSH Inf Circ. 9448. 1999.
HARR, M.E. Reliability-Based Design In Civil Engineering. McGraw-Hill BookCompany 1987. pp. 130–134.
MADDEN, B.J. A re-assessment of coal pillar design. J. S. Afr. Inst. Min. Metall.January 1991.
SALAMON, M.D.G. and MUNRO, A.H. A study of the strength of coal pillars. J. S.Afr. Inst. Min. Metall. September 1967.
SALAMON, M.D.G. Strength and stability of coal Pillars. Proc. Workshop on Coalpillar mechanics and design. US Bureau of Mines IC 9315. 1992.
VAN DER MERWE, J.N. Revised strength factor for coal in the Vaal Basin. J. S. Afr.Inst. Min. Metall. March 1993.
VAN DER MERWE, J.N. A Method to Group Coal in Terms of Strength UsingLaboratory Tests. Research Report to Coaltech 2020, December 2001.
σ = kw
hk to, . .with in the range of MPa2 8 3 5
▲
290 JUNE 2003 The Journal of The South African Institute of Mining and Metallurgy
Figure 10—Comparison of recovery rates for a mining height of 3 m, at different depths and for safety factors of 2.0 and 1.6
Difference in % extraction
Depth (m)
16
14
12
10
8
6
4
2
0
-2
-4
-6
20.0 40.0 60.0 80.0 100.0 120.0 140.0 160.0 180.0 200.0
SF = 1.6 Lower Limit
SF = 2.0 Lower Limit
SF = 2.0 Upper Limit
SF = 1.6 Upper Limit
% E
xtra
ctio
n d
iffe
ren
ce

New pillar strength formula for South African coal
▲291The Journal of The South African Institute of Mining and Metallurgy JUNE 2003
Appendix B
Data base of intact pillarsThis table contains the original data in imperial units and the converted data to metric units
Case Depth (ft) Bord width (ft) Pillar width (ft) Mining height (ft) Depth (m) Bord width (m) Pillar width (m) Mining height (m)
1 150 17 18 6 45.72 5.18 5.49 1.832 70 22 20 9 21.34 6.71 6.10 2.744 100 18 9 5.1 30.48 5.49 2.74 1.555 130 20 20 8.5 39.62 6.10 6.10 2.596 140 18 18 8.5 42.67 5.49 5.49 2.596a 140 18 14 8.5 42.67 5.49 4.27 2.597 120 20 20 12 36.58 6.10 6.10 3.668 100 20 20 10.5 30.48 6.10 6.10 3.2010 150 20 20 13 45.72 6.10 6.10 3.9611 150 18 14 3.9 45.72 5.49 4.27 1.1913 150 20 20 9.5 45.72 6.10 6.10 2.9014 170 20 30 5.5 51.82 6.10 9.14 1.6821 160 21 24 8 48.77 6.40 7.32 2.4422 210 20.5 20 11.3 64.01 6.25 6.10 3.4423 100 21 21 12 30.48 6.40 6.40 3.6624 150 21 21.5 11.5 45.72 6.40 6.55 3.5125 200 22 23 11 60.96 6.71 7.01 3.3526 170 20 25 12 51.82 6.10 7.62 3.6627 300 20 35 14 91.44 6.10 10.67 4.2728 100 22 18 8.5 30.48 6.71 5.49 2.5928a 200 22 23 8.5 60.96 6.71 7.01 2.5929 225 18 17 3.9 68.58 5.49 5.18 1.1931 210 25 25 10 64.01 7.62 7.62 3.0532 200 20 25 13 60.96 6.10 7.62 3.9633 150 20 20 5.5 45.72 6.10 6.10 1.6834 300 20 20 5.1 91.44 6.10 6.10 1.5535 250 18 22 9 76.20 5.49 6.71 2.7436 150 20 16 5.4 45.72 6.10 4.88 1.6537 200 20 16 5.1 60.96 6.10 4.88 1.5538 280 18 27 10.5 85.34 5.49 8.23 3.2038a 280 20 25 10.5 85.34 6.10 7.62 3.2043 155 25 20 17 47.24 7.62 6.10 5.1844 150 20 20 15 45.72 6.10 6.10 4.5745 145 20 20 14 44.20 6.10 6.10 4.2746 280 20 25 10 85.34 6.10 7.62 3.0548 200 20 25 5.5 60.96 6.10 7.62 1.6849 160 20 30 14 48.77 6.10 9.14 4.2750 200 20 25 9.5 60.96 6.10 7.62 2.9051 296 22 28 9.5 90.22 6.71 8.53 2.9052 300 20 20 5 91.44 6.10 6.10 1.5261 320 18 32 10.5 97.54 5.49 9.75 3.2061a 320 20 30 10.5 97.54 6.10 9.14 3.2062 300 18 20 3.9 91.44 5.49 6.10 1.1963 380 20 25 6 115.82 6.10 7.62 1.8368 356 22 25 7.5 108.51 6.71 7.62 2.2969 356 22 28 7.5 108.51 6.71 8.53 2.2970 150 20 20 10 45.72 6.10 6.10 3.0572 250 20 30 13 76.20 6.10 9.14 3.9673 300 20 40 13 91.44 6.10 12.19 3.9674a 460 18 57 8 140.21 5.49 17.37 2.4476 250 20 30 5.5 76.20 6.10 9.14 1.6877 479 18 54 7.9 146.00 5.49 16.46 2.4177a 528 20.7 49 9.7 160.93 6.31 14.94 2.9677b 538 20.4 49.2 9.2 163.98 6.22 15.00 2.8077c 592 19.6 50 9.8 180.44 5.97 15.24 2.9979 450 18 42 12 137.16 5.49 12.80 3.6680 356 21 29 7.5 108.51 6.40 8.84 2.2982 125 18 14 5 38.10 5.49 4.27 1.5283 135 21 21 6.5 41.15 6.40 6.40 1.9884 720 18.3 71.3 10.4 219.46 5.58 21.73 3.1787 350 20 40 14 106.68 6.10 12.19 4.2788 650 18.7 56.3 9.3 198.12 5.70 17.16 2.8389 250 20 25 15 76.20 6.10 7.62 4.5790 600 18 52 16 182.88 5.49 15.85 4.88

New pillar strength formula for South African coal
▲
292 JUNE 2003 The Journal of The South African Institute of Mining and Metallurgy
Appendix B (continued)
Data base of intact pillarsThis table contains the original data in imperial units and the converted data to metric units
Case Depth (ft) Bord width (ft) Pillar width (ft) Mining height (ft) Depth (m) Bord width (m) Pillar width (m) Mining height (m)
91 600 19.5 55.5 8 182.88 5.94 16.92 2.4465 550 12.1 47 6.5 167.64 3.69 14.33 1.9892 300 20 40 5 91.44 6.10 12.19 1.5293 290 20 30 10 88.39 6.10 9.14 3.05112 250 20 30 9.5 76.20 6.10 9.14 2.90113 300 20 35 9.5 91.44 6.10 10.67 2.90128 250 20 25 4.5 76.20 6.10 7.62 1.37130 350 18 22 3.9 106.68 5.49 6.71 1.19132 300 20 30 15 91.44 6.10 9.14 4.57133 300 20 20 5.5 91.44 6.10 6.10 1.68133a 300 20 25 5.5 91.44 6.10 7.62 1.68134 65 20 25 10.5 19.81 6.10 7.62 3.20135 470 18 42 5.5 143.26 5.49 12.80 1.68136 110 18 22 13 33.53 5.49 6.71 3.96137 380 20 30 6 115.82 6.10 9.14 1.83138 350 20 30 5.5 106.68 6.10 9.14 1.68142 166 20 20 4.5 50.60 6.10 6.10 1.37143 250 20 30 4.5 76.20 6.10 9.14 1.37144 115 16 24 8.5 35.05 4.88 7.32 2.59145 120 16 24 6 36.58 4.88 7.32 1.83146 150 20 25 16 45.72 6.10 7.62 4.88146a 200 20 30 16 60.96 6.10 9.14 4.88146b 250 20 35 16 76.20 6.10 10.67 4.88146c 300 20 40 16 91.44 6.10 12.19 4.88146d 350 20 50 16 106.68 6.10 15.24 4.88