Embed Size (px)
Citation preview

A PRELIMINARY STUDY OF THE EFFECT OF CALCIUM CHLORIDE
HIGHWAY ANTI-ICER LIQUID ON ROADSIDE TREES IN
LEAVENWORTH, WASHINGTON
By
JASON LENNART DIRKSE
A thesis submitted in partial fulfillment of the requirements for the degree of
MASTER OF SCIENCE IN ENVIRONMENTAL SCIENCE
WASHINGTON STATE UNIVERSITY Program in Environmental Science and Regional Planning
MAY 2006

ii
To the faculty of Washington State University:
The members of the Committee appointed to examine the thesis of JASON
LENNART DIRKSE find it satisfactory and recommend that it be accepted.
___________________________________ Chair
___________________________________
___________________________________

iii
ACKNOWLEDGEMENT
I am well aware that the completion of this project has been aided, nay, made
possible, by the help of many generous individuals, some of whom I would like to offer
my special thanks: Naomi Calkins in the Center for Multiphase Environmental Research
for assisting me with the chromatography samples, about which I knew nothing
beforehand and was able to complete only with her help; Beth Marshall for putting up
with my messes in the Environmental Science lab and going out of her way to help me in
many ways; Dr. Franz for the helpful direction as my chair in this study; Drs. Budd and
Yonge for also consenting to be on my committee; Ted Always of Derby Canyon Natives
for his interest in the project and for providing the tree specimens for the greenhouse study
at a very generous rate; America West Environmental Supplies, Inc., for working with me
to obtain anti- icer liquid with which to work; and anyone else I may have failed to
mention. Thank you!

iv
A PRELIMINARY STUDY OF THE EFFECT OF CALCIUM CHLORIDE
HIGHWAY ANTI-ICER LIQUID ON ROADSIDE TREES IN
LEAVENWORTH, WASHINGTON
Abstract
By Jason Lennart Dirkse
Washington State University May 2006
Chair: Eldon Franz
Recently observed foliar injury of trees along roads in and around Leavenworth,
Washington, has elicited concern as to the cause of the injury. Leaves of certain trees,
most noticeably big- leaf maple (Acer macrophullym), become browned, dried, and curled
in early summer. However, these symptoms are only seen along certain stretches of
certain roads, most severely along a 7-mile portion of State Highway 2 west from
Leavenworth, and along the first ~4 miles of Icicle Road near Leavenworth. While the
symptoms look similar to those of drought conditions, drought cannot sufficiently explain
the limited and specific geographic distribution of the observed symptoms. A survey of
relevant scientific literature reveals that highway anti- icer liquids applied to prevent ice
build-up can have a similar effect on roadside trees as that which is observed. This
explanation would more adequately explain the observations, and upon further
investigation, there are a number of compelling reasons to suspect anti- icers as the cause
of the observed injury symptoms. This study investigates the effect of highway anti- icers

v
(specifically calcium chloride) on trees when added to the soil in which the tree is
growing. Tree saplings were grown in a greenhouse, divided into five treatment groups,
each containing three individuals of four species—black cottonwood, Douglas fir
(Pseudotsuga menziesii), big- leaf maple (Acer macrophyllum), and Ponderosa pine (Pinus
ponderosa)—for a total of 12 trees per treatment group. Each treatment group was given
a different concentration of anti- icer liquid diluted with deionized water, added to the soil,
once weekly for eight weeks. Growth was monitored both during and at the conclusion of
the experimental period to determine if different concentrations of anti- icer resulted in
different growth rates among the treatment groups. It was found that the anti- icer
treatments caused significant injury to the trees, producing leaf browning and die-back,
and likely killed all trees except the control group. Further study of this topic is
warranted, as this study provided reason to suspect that highway anti- icers can cause
significant damage to trees growing in the soil to which the anti- icer is added.

vi
TABLE OF CONTENTS
ACKNOWLEDGEMENTS ............................................................................................... iii ABSTRACT....................................................................................................................... iv LIST OF MAPS ............................................................................................................... viii LIST OF PHOTOGRAPHS ............................................................................................. viii LIST OF FIGURES.......................................................................................................... viii LIST OF TABLES ........................................................................................................... viii LIST OF GRAPHS........................................................................................................... viii LIST OF APPENDICIES................................................................................................... ix 1 INTRODUCTION......................................................................................................... 1 2 LITERATURE REVIEW.............................................................................................. 8 2.1 About Anti-Icers/De-Icers .................................................................................... 8 2.2 Common Anti-Icers .............................................................................................. 9 2.2.1 NaCl ....................................................................................................... 10 2.2.2 CaCl2 ...................................................................................................... 11 2.3 Relationship Between Foliar Injury and Elevated Soil Salt Concentrations ...... 12 2.4 Two Vectors of Injury........................................................................................ 13 2.4.1 Salt Spray Injury (Coniferous Trees) ..................................................... 13 2.4.2 Soil Salt Uptake (Deciduous Trees)....................................................... 13 2.5 Tree Species Documented with Salt Injury........................................................ 14 2.6 Drought ............................................................................................................... 15 2.7 Calcium and Chlorine in Plants.......................................................................... 15 2.7.1 Calcium .................................................................................................. 15 2.7.2 Chlorine .................................................................................................. 16 2.8 Toxicity Levels................................................................................................... 16 2.9 How Damage Occurs ......................................................................................... 17 2.10 Conclusion.......................................................................................................... 18 3 MATERIALS AND METHODS ................................................................................ 19 3.1 Field Samples ..................................................................................................... 19 3.2 Greenhouse Experiment ..................................................................................... 19 3.2.1 Visual Observations ............................................................................... 20

vii
3.2.2 Soil and Root Tissue Chloride Content.................................................. 21 3.2.3 Tree Height Increase .............................................................................. 22 3.2.4 Tree Weight Measurements ................................................................... 22 3.2.5 Leaf Surface Area................................................................................... 22 4 RESULTS ................................................................................................................... 24 4.1 Visual Observations ........................................................................................... 24 4.2 Soil and Plant Tissue Chloride Content ............................................................. 24 4.2.1 Root Tissue—Greenhouse Experiment .................................................. 24 4.2.2 Leaf Tissue—Field Experiment ............................................................. 25 4.2.3 Soil Samples—Greenhouse Experiment ................................................ 26 4.2.4 Soil Samples—Field Experiment ........................................................... 27 4.3 Tree Height Increase .......................................................................................... 28 4.4 Tree Growth Measurements............................................................................... 31 4.4.1 Leaf Mass ............................................................................................... 31 4.4.2 Stem Mass .............................................................................................. 34 4.4.3 Root Mass............................................................................................... 35 4.4.4 Total Mass.............................................................................................. 36 4.5 Leaf Surface Area............................................................................................... 37 5 DISCUSSION ............................................................................................................. 41 5.1 Visual Observations ........................................................................................... 41 5.2 Chloride Content ................................................................................................ 42 5.3 Tree Height Increase .......................................................................................... 43 5.4 Tree Growth Measurements............................................................................... 43 5.4.1 Leaf Mass ............................................................................................... 43 5.4.2 Stem Mass .............................................................................................. 44 5.4.3 Root Mass............................................................................................... 44 5.4.4 Total Mass.............................................................................................. 44 5.5 Leaf Surface Area............................................................................................... 45 6 CONCLUSIONS......................................................................................................... 46 6.1 Summary of Findings ......................................................................................... 46 6.2 Study Design Flaws............................................................................................ 47 6.3 Further Study...................................................................................................... 48 7 REFERENCES............................................................................................................ 50

viii
LIST OF MAPS
Map 1: Vicinity map of Leavenworth, Tumwater Canyon/Wenatchee River, and Icicle Canyon/River ....................................................................................................... 2 Map 2: Shaded relief map of Leavenworth, Tumwater Canyon/Wenatchee River, and Icicle Canyon/River.............................................................................................. 3 Map 3: Icicle Road with main affected areas and approximate location of Snow Lakes Trailhead/“End of County Maintenance” gate..................................................... 4
LIST OF PHOTOGRAPHS
Photograph 1: Typical injury symptoms observed; notice the browned, curled leaf margins; 9-18-04 ...................................................................................... 1 Photograph 2: “End of County Road” sign on Icicle Road; injury symptoms are observed no further................................................................................... 4 Photograph 3: Injured maple trees that appear before the “End of County Road” sign on Icicle Road................................................................................................ 5 Photograph 4: Apparently health maple trees after the “End of County Road” sign ...... 5 Photograph 5: Bridge over the Wenatchee River ............................................................ 6 Photograph 6: Injured maple trees that appear along Hwy 2........................................... 6 Photograph 7; Apparently health maple trees immediately across the river from Hwy 2 .............................................................................................. 6 Photograph 8: Leaf area meter, calculating surface area of leaves................................ 23
LIST OF FIGURES
Figure 1: Spatial arrangement of treatment groups ........................................................ 20
LIST OF TABLES
Table 1: Treatment groups and CaCl2 : deionized water ratio ...................................... 20 Table 2: Chloride content of root samples .................................................................... 25 Table 3: Leaf chloride content of field samples ............................................................ 26 Table 4: Chloride content of soil samples ..................................................................... 26 Table 5: Soil chloride content of field soil samples ...................................................... 28
LIST OF GRAPHS
Graph 1: Cottonwood final height vs. initial height ....................................................... 29 Graph 2: Douglas fir final height vs. initial height ......................................................... 29 Graph 3: Big- leaf maple final height vs. initial height................................................... 30

ix
Graph 4: Ponderosa pine final height vs. initial height .................................................. 30 Graph 5: Cottonwood leaf mass versus total height increase......................................... 32 Graph 6: Douglas fir leaf mass vs. total height increase ................................................ 33 Graph 7: Big- leaf maple leaf mass vs. total height increase .......................................... 33 Graph 8: Ponderosa pine leaf mass vs. total height increase.......................................... 34 Graph 9: Stem mass........................................................................................................ 35 Graph 10: Root mass ........................................................................................................ 36 Graph 11: Average total tree mass of each species within each treatment group ............ 36 Graph 12: Leaf surface area ............................................................................................. 38 Graph 13: Cottonwood leaf surface area vs. total height increase ................................... 38 Graph 14: Douglas fir leaf surface area vs. total height increase ..................................... 39 Graph 15: Big- leaf maple leaf surface area vs. total height increase............................... 39 Graph 16: Ponderosa pine leaf surface area vs. total height increase .............................. 40 LIST OF APPENDICIES Appendix A: Photographs ............................................................................................ 53

1
1 INTRODUCTION
In recent years, it has been observed that certain trees growing along roads in and
around the city of Leavenworth, Washington, appear less than healthy. The leaves of
these trees dry out and turn brown in early- to mid-summer. Leaf margins become
browned, while the center of the leaf typically remains more or less green (Photograph 1).
In severe cases, the entire leaf is brown. The symptoms are most obvious in deciduous
trees. Big- leaf maple (Acer macrophyllum) is the most affected, but black cottonwood
(Populus trichocarpa) and ocean spray (Holodiscus discolor), among others, also display
symptoms. The symptoms observed immediately call to mind drought as a likely cause,
due to the dry appearance of the leaves. However, it will be shown in this paper that a
more thoroughly satisfying explanation of the observed symptoms is that the trees are
being injured by highway anti- icing chemicals.
Photograph 1: Typical injury symptoms observed; notice the browned, curled leaf margins; 9-18-04

2
It is not just the peculiar symptoms that are worthy of note, but also the spatial
distribution of the symptoms. Symptoms occur only on trees in particular stretches along
certain roads. Along State Highway 2 in Tumwater Canyon, just west of Leavenworth,
the road closely parallels the Wenatchee River (see Figures 1, 2). Throughout this 7-mile
stretch of highway, big- leaf maple trees have prominently displayed browned leaves each
of the past several summers. Yet immediately across the river, the same maple species
shows no such symptoms. Maples along Icicle Road leading west from Leavenworth
also display browned leaves every summer, but only for approximately the first four
miles of Icicle Road, at the point where county road maintenance ends and a gate
occasionally blocks winter automobile traffic. Beyond this gate, none of the previously
mentioned symptoms have been observed among any tree, maple or otherwise.
Map 1: Vicinity map of Leavenworth, Tumwater Canyon/Wenatchee River, and Icicle Canyon/River (Delorme Topo 5.0)
Site Locations

3
Map 2: Shaded relief map of Leavenworth, Tumwater Canyon/Wenatchee River, and Icicle Canyon/River (National Map)
Though the brown, dried leaf edges suggest drought, apparently healthy trees
grow near obvious ly injured trees, as close as approximately 200 meters up the same
road, or just across the river, with no apparent ly different ecological circumstances that
would justify such a difference. It would seem that, if drought alone were the cause of
the injury, that symptoms would appear more consistently, and would not only appear
along roads. As it is, injury symptoms are only observed along certain stretches of
certain roads.
Highway anti- icers as the cause would better explain the symptoms observed up
Icicle Road. County road maintenance of Icicle Road ends at the Snow Lakes Trailhead,
where there is a sign reading “End of County Road” (see Figure 3). This is the point
where winter snowplow service and anti- icer application end. If anti- icers are indeed the

4
cause, it would follow that injury symptoms would only be observed for the length of
road to which anti- icers are applied.
Map 3: Icicle Road with main affected areas (in brown) and approximate location of Snow Lakes Trailhead/ “End of County Maintenance” gate (in red) (National Map)
Photograph 2: “End of County Road” sign on Icicle Road; injury symptoms are observed no further

5
Photographs 3, 4: Contrast between injured maple trees that appear before the “End of County Road” sign (at left), and apparently health maple trees thereafter (at right); photographs taken on 9-18-04
This would also explain the symptoms along Hwy 2 in Tumwater Canyon only
being observed along the road and not immediately across the river. It seems that
drought would affect more trees than just those along roads. But highway anti- icer
chemicals would only affect trees along roads. If anti- icer chemicals drain from the road
when they turn the snow to water, they would enter the soil and, depending on the
chemicals used for the anti- icer, could possibly affect the physiology of vegetation along
the road.

6
Photograph 5: Bridge over the Wenatchee River; maple trees on the west side of the road (opposite side as the highway; at left in this picture) show none of the injury symptoms shown in maple trees on the east side along the highway
Photographs 6, 7: Contrast between injured maple trees that appear along Hwy 2 (at left), and apparently health maple trees immediately across the river (at right); photographs taken on 9-18-04
7
As mentioned above, these symptoms have been noticed only in recent years. No
record exists that indicates when the symptoms first appeared, but local knowledge
(including that of the author) indicates the injury symptoms appeared only within the past
decade, implying that the causal agent is likely be something that has only been present in
recent years. Local residents also recall the change in winter highway maintenance
practices. Historically, sand was used to increase traction on snow-covered roads.
However, in recent years, sand has been all but abandoned in favor of a liquid chemical
anti- icer. A press release from November, 2003 by the Washington State Department of
Transportation (WSDOT), corroborates with this observed change in highway
maintenance:
“The Washington State Department of Transportation initiated the chemical anti- icing program, statewide, four years ago. The WSDOT North Central Region (which includes Leavenworth) began testing the chemical anti- icers first, and this is its sixth winter utilizing chemical anti- icers.” (WSDOT 2003)
If the “ant i- icing program” was initiated between four and six years prior to 2003—
between 1997 and 1999—this would approximately coincide with the timing of the first
observation of the injury symptoms on the trees in question. This timeline also
corresponds with the observed changes in highway maintenance.
Because of the circumstances described above, it is hypothesized that the
observed foliar injury in Leavenworth, Washington, is a result of highway anti- icer
chemicals applied to winter roads. The purpose of this paper is to review pertinent
literature on the topic and to discuss research that has been conducted to test that
hypothesis.

8
2 LITERATURE REVIEW
While anecdotal connections between observed leaf injury and highway anti- icers
can be hypothesized, this is not enough to assign a causal relationship. To determine the
state of scientific knowledge regarding anti- icers and any relation to vegetation injury,
the existing body of scientific literature has been examined. As it turns out, in the words
of Barrick, “reports of deicing salt damage in highway plantings are legion.” (Barrick, p.
203, 1980) Deicing salts have been in use since the early 1900s, and their effect on
roadside plant life has been documented since the 1940s. Following is a review of
pertinent scientific literature.
2.1 About Anti- / De-icers
The WSDOT defines “anti- icing” as “the practice of applying chemicals to
roadways to prevent frost and ice from forming or if it does, to keep it from compacting
and bonding onto the highway (WSDOT 2003).” Anti- icing agents lower the freezing
point of the water on roadways (in the form of snow, ice, or water), thus either reversing
or preventing the process of ice accumulation on roadways that causes dangerous driving
conditions. They are either applied before an ice or snow event to prevent accumulation,
or after an event to melt accumulated ice and snow. Typically, liquid anti- icers (Calcium
Magnesium Acetate [CMA], Calcium Chloride [CaCl2]) are used before snow events as a
preventative measure, and solid anti- icers (sand, rock salt) are used after snow events to
melt the accumulation and improve traction (WSDOT 2003).
Historically, either rock salt (NaCl) or sand has been most commonly used to
improve traction. For decades, NaCl has been applied in prodigious quantities to both
North American and European roads. From 1965 through 1970, Great Britain applied an

9
average of 1,052,400 tons of NaCl to roadways every year, West Germany applied
887,200 tons, and The Netherlands applied 269,400 (Dobson, 1991). Naturally, more
severe winters require more NaCl. In especially severe winters, it has been reported that
up to 5 kg of NaCl can be applied to each square meter of roadway (Dobson, 1991). This
liberal application of NaCl has been documented as leading to corrosion of bridge
structures, automobiles, and the road surface itself (Dobson, 1991).
Sand has also commonly been used to improve winter driving conditions. While
lacking the ice-melting properties of salt, sand improves traction by increasing friction on
the road surface. But sand requires frequent re-application, as it is easily blown to the
shoulder by passing vehicles. Sand kicked up by passing cars has had a demonstrable
effect on air quality, has been shown to increase turbidity in nearby surface water, and
reduces the aesthetics of the roadside environment (WSDOT 2003).
Liquid anti- icers attempt to address the problems of corrosion, excessive
environmental stress, and air and water quality degradation. Liquid anti- icers are able to
remain on the road surface longer, are designed to be less corrosive to automobiles, and
to minimize detrimental effects on the roadside environment. (WSDOT 2003)
2.2 Common Anti-Icers
While the first and still most common ice-melting agent used on highways is
NaCl, other chemical anti- icers are being more widely-used lately: 1) Calcium
Magnesium Acetate (CMA), the “least aggressive (weakest), but most environmentally
benign;” 2) Magnesium Chloride, “stronger and used in most parts of the state on roads at
higher elevations or those subject to colder temperatures;” and 3) Calcium Chloride
(CaCl2), “used when conditions can be most severe. It is effective to temperatures well

10
below freezing where other anti- icers are not (WSDOT, 2003).” The North Central
Region’s highway maintenance supervisor, Dwayne Standerford, indicated that CaCl2 is
used in the region due to the severe winter conditions (pers. comm., 2004). CaCl2 has
more ice-melting ability than NaCl: “Whereas NaCl has deicing effect till about -8ºC,
CaCl2 can be used till about -20ºC” (Bogemans, Neirinckx, Stassart, p. 203, 1989). Rich
notes that “calcium chloride is effective in ice removal, but is more expensive and more
difficult to store and handle than sodium chloride.” (Rich, p. 78a)
This literature review will only address anti- icers that are relevant to the present
research question: NaCl and CaCl2.
2.2.1 NaCl
NaCl has been the subject of the most studies of any anti- icer chemical. The
damage done by NaCl has been well documented: “There is no doubt that salinity
adversely affects the growth of plants (Strogonov, p. 45, 1964).” Symptoms similar to
those observed around Leavenworth are frequently described in trees affected by NaCl.
Buschbom indicates that NaCl used to melt ice on German highways results in “negative
effects on the lively environment. Most noticeable is the injury to roadside trees and
shrubs (Buschbom, 350, 1980).” Symptoms are often described in similar terms: “burning
or browning,” “chlorosis,” (Bryson, Barker, pp. 67, 69, 2002; Günter, Wilke, p. 211,
1983), “leaf burn,” “limb die-back,” (Button, Peaslee, p. 121, 1970; Guttay, p. 952,
1976), “necroses at the edges of leaves,” “dead branches,” (Günter, Wilke, p. 211, 1983),
“marginal leaf scorch,” “early autumn leaf coloration and defoliation,” “reduced shoot
growth,” (Guttay, p. 952, 1976), “brown” or “necrotic tissue,” (Hall et al., p. 245, 1972),
“severe leaf scorch,” (Holmes, Baker, p. 633, 1966), “browning or burning of the

11
foliage,” leaf tip burning,” (Kliejunas, p. 3, 1989), “premature foliar coloration,”
“marginal leaf scorch,” “defoliation,” (Lacasse, Rich, p. 1071, 1964), etc.
A US Forest Service study of conifer damage and mortality in the Lake Tahoe
area determined the cause to be “excessive levels of sodium and chloride as the cause” of
the “foliar injury (Kliejunas, 1989).” Kliejunas also noted more severe injury on sides of
the affected trees that faced the road. Buschbom reports “negative effects of chloride on
the lively environment” along highways in Germany as a result of NaCl use as a deicing
salt (Buschbom, 1980).
Rich found that the appearance of leaf damage symptoms was not dependent on
the age or size of the tree: “The correlation between symptoms and dbh was not
significant…(77a)” Bicknell and Smith found that certain tree seeds germinated at a
lower rate when in soil that received NaCl treatments at concentrations similar to those
found in roadside soil due to NaCl deicers (Bicknell and Smith, 1975).
2.2.2 CaCl2
While fewer studies have been done on CaCl2 than on NaCl, these studies
document CaCl2 causing vegetation damage similar to that caused by NaCl.
Paul et al. conducted studies into the effect of CaCl2 on certain deciduous
roadside tree species and found that CaCl2 causes “foliar necrosis”, though species differ
in their sensitivity to CaCl2 (Paul et al, p. 277, 1987). Strong observes that, since 1930,
many cases of “injury”—also described as “leaf scorch”—to trees along roads treated
with calcium chloride as a “dust palliative” have been recorded (Strong, 1944). In the
1920s, CaCl2 was used extensively to reduce dust on gravel roads. “The chemical was
first used by spreading heavy applications on the road surface, and it was during this

12
period that considerable injury to roadside vegetation was observed and public criticism
consequently aroused (210).” Strong notes that CaCl2 was responsible for many of the
reported cases of leaf scorch, but not all (209).
2.3 Relationship Between Foliar Injury and Elevated Soil Salt Concentrations
Many studies have found a relationship between visible leaf injury and
abnormally high concentrations of sodium or chloride in soil or leaf tissue. Button found
that trees along the side of a road that directly received highway drainage had less vigor,
more leaf burn, more limb dieback, and significantly higher chloride content (percent leaf
dry matter) than trees on the side of the road with a highway drainage system that
diverted road runoff away from the trees (Button, 1964). Buschbom found that, while
elevated soil salt levels do coincide with leaf damage, there does not appear to be a
reliable linear relationship between soil salt levels and the degree of damage to the tree
(Buschbom, 1980). Guttay, however, found that “progressively greater dieback was
significantly correlated with…increased Na and chloride in roots and in the soil of the
rhizosphere (Guttay, p. 952, 1976).” Hofstra and Hall found that, in trees grown in
controlled temperature chambers, “the amount of injury that developed after 3 weeks at
15º C appeared to be directly related to the concentration of sodium and chloride in the
leaf tissue (p. 244).” Other studies (Holmes, Baker 1966; Kliejunas et al. 1989; Lacasse,
Rich 1964; Monk, Wiebe 1961; etc.) document similar conclusions of foliar injury
coinciding with elevated sodium and/or chloride concentrations in soil or leaves.

13
2.4 Two Vectors of Injury
Two vectors of salt injury in plants have been noted: direct spray of road melt,
and soil/root uptake. It has been noted that salt spray injury is more commonly observed
in conifer trees, while soil uptake injury is more common in deciduous trees.
2.4.1 Salt Spray Injury (Coniferous Trees)
Coniferous trees have been observed to display severe symptoms and seem to be
affected most by deicer salts. Kliejunas et al. conducted their study in response to
widespread conifer damage mortality in the Lake Tahoe region. They concluded that
roadside conifers were damaged by highway salts, and since greater damage was
observed on sides of trees facing the road, conifers suffer salt injury by receiving direct
spray of highway ice and snow that has been melted by NaCl and turned to salt water.
This type of damage is commonly associated with conifers because, unlike deciduous
trees, they retain their foliage during the winter and thus have more foliar surface area by
which to receive salt spray (Bryson and Barker, 2002).
2.4.2 Soil Salt Uptake (Deciduous Trees)
Soil uptake injury symptoms are typically more dispersed throughout the tree
(rather than being more severe on the side of the tree facing the road), and manifest in
spring and summer when deciduous trees begin leafing (Button 1964). Both vectors of
salt injury manifest similar symptoms.
In Guttay’s study, entitled, “Impact of Deicing Salts Upon the Endomycorrhizae
of Roadside Sugar Maples,” (Guttay, 1976) the same symptoms observed in big- leaf
maple trees in Leavenworth are described in sugar maples in Connecticut. Guttay makes
a connection between the symptoms and deicing treatments: “Unusual levels of Na

14
(sodium) and chloride in plant tissues combined with the symptoms of marginal leaf
scorch, early autumn leaf coloration and defoliation, reduced shoot growth, and branch
dieback suggest a cause and effect relationship (952).” Guttay concludes that “salt
damage on sugar maple is attributed to a progressive root destruction as annual salt
applications continue and an increasing top dieback as the diminishing root system is
unable to sustain the top (952).” Holmes also identifies NaCl as causing leaf scorch in
roadside sugar maples, reasoning from the coincidence of injury symptoms and high
foliar chloride: “trees with little or no foliar injury had low foliar chloride levels (0.05-
0.6% of dry weight), whereas those with severe leaf scorch had high foliar chloride levels
(about 1%) (Holmes, 1966).”
2.5 Tree Species Documented with Salt Injury
Salt injury symptoms have been reported in a number of tree species, including:
• Abies (fir) (Kliejunas et al. 1989; von Sury, Flückiger 1989)
• Acer (maple) (Button 1964; Holmes, Baker 1966; Horsley et al. 2002;
Hutchinson, Olson 1967; Lacasse, Rich 1964; Shortle, Kothemier, Rich 1972;
Paul, Rocher, Impens 1987)
• Kalmia (mountain laurel) (Bryson, Barker 2002)
• Picea (spruce) (Bryson, Barker 2002; Bogemans, Neirinckx, Stassart 1989)
• Pinus (pine) (Bryson, Barker 2002; Hofstra, Hall; Kliejunas et al. 1989; Sands,
Clarke 1977; Foster, Sands 1977)
• Platanus (sycamore) (Paul, Rocher, Impens 1987)
• Pseudotsuga (Douglas fir) (Kliejunas et al.1989)
• Rhus (sumac) (Bryson, Barker 2002)

15
• Sorbus (mountain ash) (Paul, Rocher, Impens 1987)
• Thuja (cedar) (Hofstra, Hall; Kliejunas et al.)
• Tilia (linden) (Paul, Rocher, Impens 1987)
2.6 Drought
Drought conditions can induce similar- looking symptoms in trees. “Since the
symptoms were no different from leaf scorch caused by drought, it was impossible to
determine how much injury was due to each factor.” (Lacasse, Rich, p. 1071) Sucoff
notes that drought conditions and soil salts result in greater injury than either factor does
separately (1975).
2.7 Calcium and Chlorine in Plants
Both calcium and chlorine are “essential elements”—those a plant requires in
order to complete its growth and development. Essential elements are divided into two
general categories—macronutrients and micronutrients. Macronutrients are those needed
in relatively high concentrations (typically in excess of about 10 mmole kg-1 of dry
weight), and micronutrients are those needed in far lower concentrations (typically less
than 3 mmole kg-1 of dry weight) (Hopkins, 1995). While both calcium and chlorine are
essential elements, both can be toxic to plants if present in excess.
2.7.1 Calcium
According to Hopkins, calcium is a macronutrient, required at 125 mmole/kg-1 of
dry weight in higher plants. Calcium is typically found in the form of an ion, meaning
that a single calcium atom exists by itself and possesses an electrical charge—positive in
the case of calcium, making calcium a “cation”. In fact, calcium ions bear a double
positive charge—Ca++.

16
Calcium is critical to plants due to its role in cell division. It is cruc ial in the
formation of a mitotic spindle during cell division of higher plants, and also contributes
to the formation of a cell plate that forms between the newly divided cells. Calcium is
also known to contribute to the physical integrity and functionality of membranes
(Hopkins, 1995).
2.7.2 Chlorine
Chlorine is classified as a micronutrient and is required in far lower
concentrations than calcium. The element chlorine is most commonly found in nature in
the form of an ion—chloride (Cl-)—making chloride an “anion”. Chloride is primarily
used by higher plants in oxygen-evolving reactions as a part of photosynthesis. It is a
major counterion and acts to maintain electrical neutrality across intracellular
membranes. Chloride is also one of the major osmotically active solutes in cellular
vacuoles, facilitating water transfer across cellular membranes (Hopkins, 1995).
2.8 Toxicity Levels
It has been noted that “leaf chloride concentration is a better indicator of the salt
status of the plant, relative to damage rating, than is the leaf sodium concentration
(Scharpf and Srago, 1974, p.5, 1989).” There is record of chloride toxicity in plants, with
injury symptoms similar to those observed in Leavenworth. Chloride toxicity in lychee
trees in Australia is noted, and symptoms described as “lack of vigor, leaf drop, signs of
desiccation or burning on the leaf margins, fruit drop, and failure to develop fruit.”
(“Chloride toxicity in Lychee,” 2005) Harper noted that visible injury to pecan trees
occurs when chloride content is less than 0.6% of dry weight of leaf (1946). For these
reasons, leaf and soil chloride level will be the focus of this study.

17
2.9 How Damage Occurs
Paul et al. propose three hypotheses to explain highway salt phytotoxicity: 1)
chloride could accumulate in the leaves and reach a phytotoxic level, 2) high
concentrations of chloride in soils could modify mineral nutrition, and 3) water
absorption via the roots could be disturbed, on account of an increase in osmotic pressure
of the soil solution. (277)
Sucoff, in his study on highway anti- icers in Minnesota, concludes that his study
“either confirmed or newly established that salt is responsible for damage to woody
plants growing along many Minnesota Roads.” He offers a number of explanations as to
why anti- icers cause injury:
After entering soil:
• NaCl added to soil decreases the availability of soil water, which decreases the
plant’s ability to take up water, reducing growth (p. 13)
• NaCl may also decrease the availability of other ions—like calcium—to the roots,
decreasing root growth, which leads to more water deficits in the tree (p. 13)
• elevated sodium levels in the soil breaks down soil aggregates or prevents their
formation, leading to or maintaining soil compaction (p. 13)
• sodium raises soil pH above optimum level for ion uptake and root growth (p. 13)
• sodium can accelerate leaching of organic matter from soil (p. 13)
After entering plant:
• In high enough concentrations, Na+ and Cl- are toxic to plant cells—ions
adversely affect cell membrane stability, leading to reduced growth and leaf death
by bleaching of the chlorophyll (p. 13)

18
• NaCl has been found to decrease the cold resistance of hardwood twigs and
potentially interact with low winter temperatures to produce twig dieback (p. 13)
Sucoff observed symptoms commonly noted with anti- icer injury: reduction of growth,
marginal necrosis, premature fall coloration, premature leaf drop, leaves small and
yellowing, leaves fewer in number, twig dieback, followed by dieback of entire branch
systems, and finally tree death (p. 13)
2.10 Conclusion
As has been demonstrated, the existing body of scientific literature
overwhelmingly supports the possibility of highway anti- icers causing damage to
roadside vegetation. Both NaCl and CaCl2 applied to roads have led to injury symptoms
similar to those seen around Leavenworth.

19
3 MATERIALS AND METHODS
3.1 Field Samples
Many of the studies of foliar salt injury reviewed above noted unusually high
levels of chloride in injured leaves and accompanying soil. If observed injury symptoms
are indeed a result of anti- icer damage, then leaves displaying those symptoms and the
soil in which affected trees were growing should have chloride levels significantly higher
than those not showing such symptoms. To test this, both obviously injured and
obviously uninjured leaves were collected from both Tumwater Canyon and Icicle
Canyon. Soil samples were taken from underneath affected trees along sections of road
to which anti- icer was known to be applied, and also from underneath unaffected trees in
areas where anti- icers are known to not be applied. Samples were prepared in accordance
with University of Idaho standard methods for preparation (Case, 2002) and tested by ion
chromatography for chloride content.
3.2 Greenhouse Experiment
A greenhouse experiment was conducted from February 18 through April 15.
Four tree species common around Leavenworth—Douglas fir (Pseudotsuga menziesii -
PSME), Ponderosa pine (Pinus ponderosa - PIPO), Big- leaf maple (Acer macrophyllum –
ACMA), and Black cottonwood (Populous trichocarpa - POTRI)—were selected for the
experiment. Fifteen seedlings of each species were purchased from a native nursery near
Leavenworth, potted with common potting soil in 1-gallon pots, and placed in a
greenhouse.
The seedlings were divided into five treatment groups, each consisting of three
individuals of each of the four species, for a total of 12 individual trees in each group,

20
and a total of 60 trees. To avoid unequal growth due to edge effects, treatment groups
and species were rotated weekly.
Figure 1: Spatial arrangement of treatment groups. Treatment Group
Species 1 2 3 4 5
PIPO ACMA PSME POTRI
The trees were given artificial light and elevated temperatures to accelerate
growth. A 300 mL treatment of a common CaCl2 anti- icer was applied to the soil of each
tree once weekly. Each of the five treatment groups was given a different concentration
of CaCl2 diluted with deionized water (Table 1). Additionally, all trees were watered
once weekly with 300 mL of deionized water. Treatments were applied for a period of 8
weeks.
Table 1: Treatment groups and CaCl2 : deionized water ratio
Group CaCl2 : Deionized Water Of Treatment
mL CaCl2 Per Treatment
mL Water Per Treatment
1 100 : 0 300 0
2 50 : 50 150 150 3 25 : 75 75 225
4 12.5 : 87.5 37.5 262.5
5 0 : 100 0 300
3.2.1 Visual Observations
Photographs of the trees growing in the greenhouse experiment were taken
weekly to visually document the condition of the trees. The intent was to compare visual
symptoms to those observed in the field (leaf browning, early dieback, retarded growth,

21
etc.). It is hypothesized that greenhouse-grown trees receiving CaCl2 treatments (i.e. all
but the control group—Group 5) will display injury symptoms before the experiment
period is ended, though treatment groups receiving lower concentrations of CaCl2 will
display less severe symptoms.
3.2.2 Soil and Root Tissue Chloride Content
As mentioned above, many studies noted injury symptoms coinciding with high
soil and plant tissue chloride levels. To test this, at the end of the experimental growing
period soil and root samples were prepared from both the greenhouse trees and the field-
collected soil and leaf samples. Samples were analyzed by ion chromatography to
determine chloride content. (Originally, it was intended that leaf tissue be sampled for
chloride; however, many greenhouse trees receiving CaCl2 treatment failed to produce
leaves, so roots were used instead. Because of this, greenhouse samples and field
samples could not be directly compared for chloride concentration.) Samples were
prepared using the method mentioned above. It was thought that samples taken from the
field and samples taken from greenhouse trees that were given comparable anti- icer
concentration treatments would have similar chloride levels (highway CaCl2 is typically
applied at 30% CaCl2, 70% water—Standerford pers. comm., 2004).
Chloride content was compared across different treatment groups, and tree injury
was visually documented and compared against chloride content. It was hypothesized
that chloride levels will be highest in Group 1 and decrease with each treatment group as
CaCl2 concentration decreases, with Group 4 having the lowest chloride content, and
Group 5 having normal chloride levels. It was also hypothesized that an inverse

22
relationship will exist between root/soil chloride content and tree mass, due to expected
reduction of growth of trees receiving higher chloride treatments.
3.2.3 Tree Height Increase
During the experiment period individual tree heights were recorded weekly to
monitor growth. It was hypothesized that the less chloride a tree receives, the taller it
would grow. It was also hypothesized that tree height increase and root chloride
concentration would be inversely correlated—trees with more chloride will not grow as
much. Height was measured in centimeters from the top of the edge of the pot to the top
of the tree stem. Leaves extending above the top of the tree stem were generally not
included in the height measurements.
3.2.4 Tree Weight Measurements
Upon completion of the experiment period, trees were weighed—leaves, stems,
and roots separately, then combined for a total individual tree weight—and compared to
examine differences in growth between different treatment groups. Trees were measured
in grams. It was hypothesized that trees receiving higher concentrations of CaCl2
treatment would have less mass according to the strength of the concentration—trees in
the control group would be most massive, and masses would decrease as CaCl2
concentration of treatment increased.
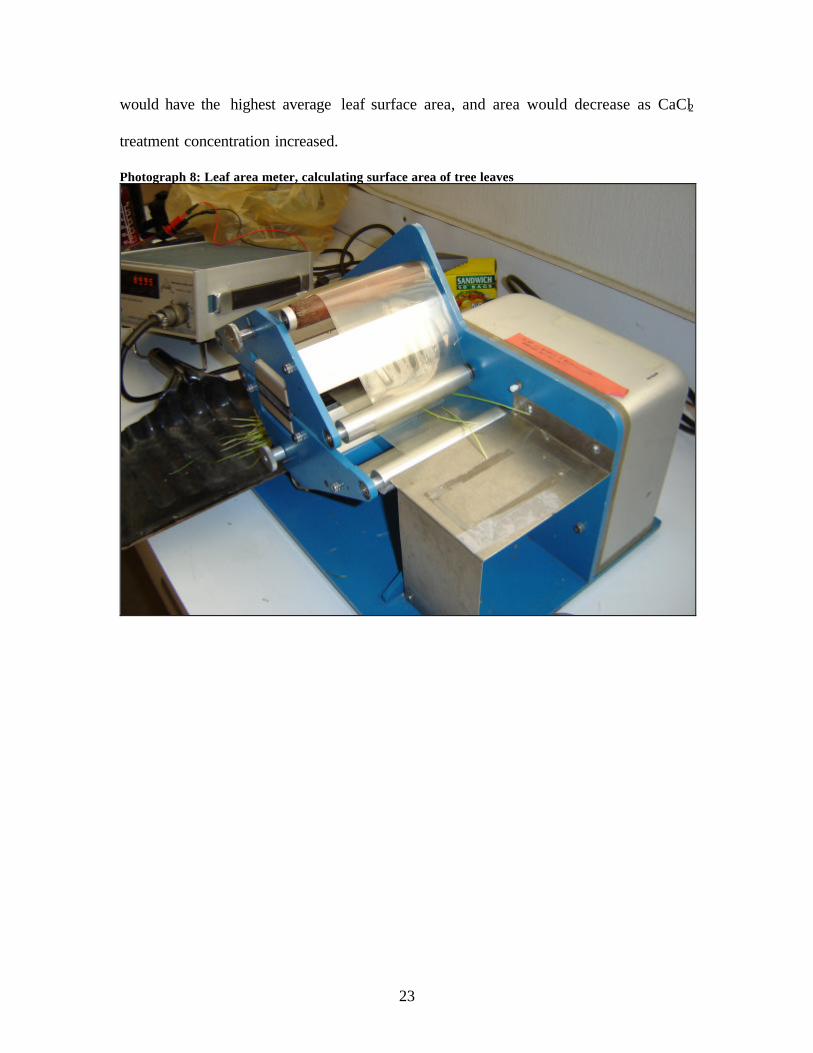
3.2.5 Leaf Surface Area
Upon completion of the experiment period, total leaf surface area of each tree was
calculated using a leaf area meter (Photograph X). Surface area was measured in square
centimeters. It was hypothesized that leaf surface area would exhibit an inverse
relationship with concentration of CaCl2 in treatment given to the tree—the control group
23
would have the highest average leaf surface area, and area would decrease as CaCl2
treatment concentration increased.
Photograph 8: Leaf area meter, calculating surface area of tree leaves

24
4 RESULTS
Since the greenhouse experiments represented a relatively small sample size—
essentially 20 groups of three—no statistical analyses were conducted on the data. Initial
height measurements were recorded for each individual tree prior to the experimental
period. Final height was plotted against this initial height for each tree, as described in
Section 4.3. Final mass and final leaf surface area have been plotted against total height
increase, as described in Sections 4.4 and 4.5.
4.1 Visual Observations
As the photographs in Appendix 1 show, trees receiving anti- icer treatments
displayed severe injury symptoms, such as browned, curled leaves and withered stems.
Many trees failed to produce any leaves at all. Ponderosa pines in Groups 1-4 had
browned needles one week into the experimental period (Appendix 1: Photograph 5). By
the following week, Douglas firs began to show browned needles (Appendix 1:
Photograph 9), and soon thereafter cottonwood leaves began turning brown as well
(Appendix 1: Photograph 12). These symptoms are similar to symptoms observed in the
field and symptoms described in the literature, though symptoms observed here were
generally more severe than those observed in the field. See Appendix 1 for all the
photographs.
4.2 Soil and Plant Tissue Chloride Content
4.2.1 Root Tissue—Greenhouse Experiment
Ion chromatographic analysis of root samples revealed significantly different
levels of chloride among the five treatment groups. In all four species, chloride levels in

25
the root samples—measured in parts per million—decreased as the concentration of
deicer in the treatment decreased, as was expected.
Root samples of all four species in the group receiving 100% CaCl2 showed levels
above 1,000 ppm (see Table 2): cottonwoods averaged 1,289.19 ppm chloride, Douglas
fir averaged 1,081.33 ppm, maple averaged 1,193.79, and Ponderosa pine averaged
1,098.29. Root samples receiving only deionized water averaged 7.11 ppm
(cottonwood), 18.12 ppm (Douglas fir), 3.65 ppm (maple) and 16.68 ppm (Ponderosa
pine). These data indicate that trees growing in soil to which deicer has been applied
have significantly elevated chloride levels, and that chloride levels within plant tissue
increase with the increased concentration of deicer applied. These results are consistent
with the literature in that trees displaying injury symptoms have elevated root chloride
levels (Guttay, 1976; Button, 1964). This also supports the hypothesis.
Table 2: Chloride content of root samples, average of three individuals of each species in each treatment group
Average Root Chloride Concentration (ppm) Treatment Group
Cottonwood Douglas Fir Big-Leaf Maple Ponderosa Pine
Group 1 1289.19 1081.33 1193.79 1098.29 Group 2 1124.79 890.45 804.15 866.78 Group 3 812.86 675.36 609.87 703.04 Group 4 460.76 350.20 585.72 431.32 Group 5 7.11 18.12 3.65 16.68
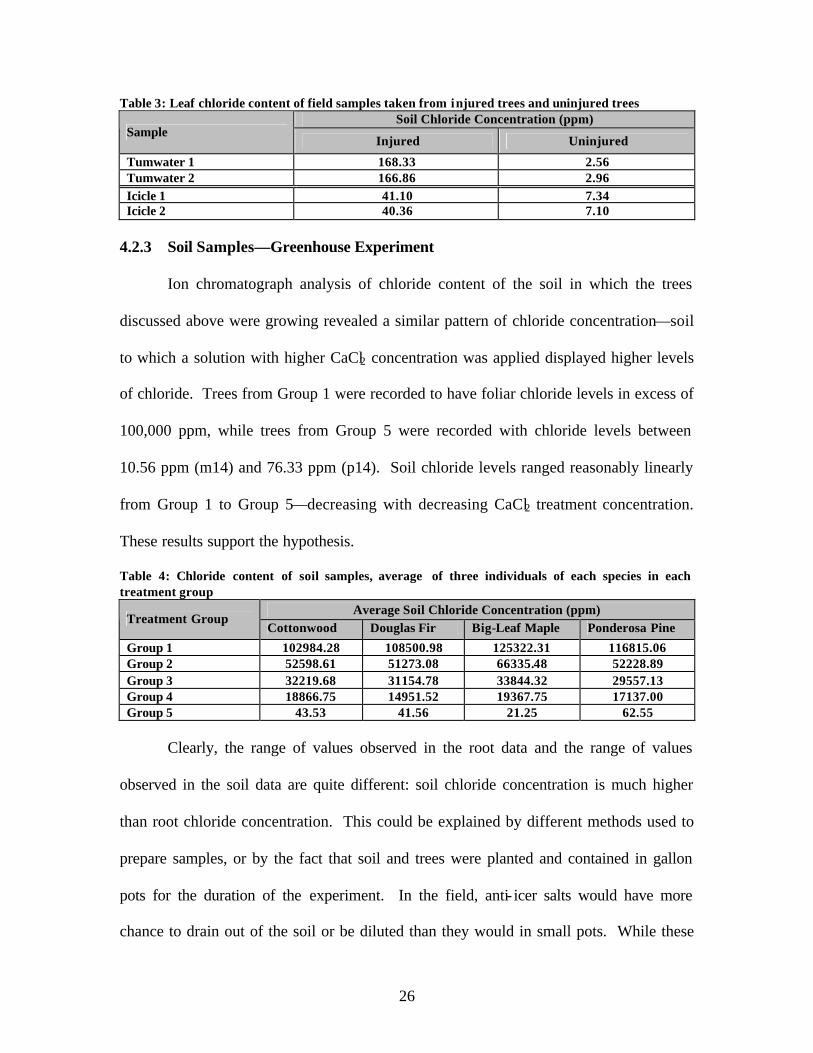
4.2.2 Leaf Tissue—Field Experiment
Field leaf samples taken from both trees displaying injury symptoms and trees
appearing healthy were also measured for chloride concentration (see Table 3). Leaves
that visually appeared healthy had chloride levels between 2 and 8 ppm. Leaves that
showed injury symptoms had much higher chloride levels—between 40 and 167 ppm.
This is consistent with the literature and supports the hypothesis, although the small
sample size makes it difficult to draw any conclusions from the results.
26
Table 3: Leaf chloride content of field samples taken from injured trees and uninjured trees Soil Chloride Concentration (ppm)
Sample Injured Uninjured
Tumwater 1 168.33 2.56 Tumwater 2 166.86 2.96 Icicle 1 41.10 7.34 Icicle 2 40.36 7.10
4.2.3 Soil Samples—Greenhouse Experiment
Ion chromatograph analysis of chloride content of the soil in which the trees
discussed above were growing revealed a similar pattern of chloride concentration—soil
to which a solution with higher CaCl2 concentration was applied displayed higher levels
of chloride. Trees from Group 1 were recorded to have foliar chloride levels in excess of
100,000 ppm, while trees from Group 5 were recorded with chloride levels between
10.56 ppm (m14) and 76.33 ppm (p14). Soil chloride levels ranged reasonably linearly
from Group 1 to Group 5—decreasing with decreasing CaCl2 treatment concentration.
These results support the hypothesis.
Table 4: Chloride content of soil samples, average of three individuals of each species in each treatment group
Average Soil Chloride Concentration (ppm) Treatment Group
Cottonwood Douglas Fir Big-Leaf Maple Ponderosa Pine
Group 1 102984.28 108500.98 125322.31 116815.06 Group 2 52598.61 51273.08 66335.48 52228.89 Group 3 32219.68 31154.78 33844.32 29557.13 Group 4 18866.75 14951.52 19367.75 17137.00 Group 5 43.53 41.56 21.25 62.55
Clearly, the range of values observed in the root data and the range of values
observed in the soil data are quite different: soil chloride concentration is much higher
than root chloride concentration. This could be explained by different methods used to
prepare samples, or by the fact that soil and trees were planted and contained in gallon
pots for the duration of the experiment. In the field, anti- icer salts would have more
chance to drain out of the soil or be diluted than they would in small pots. While these
27
values may not accurately reflect the levels of deicer present in roadside soil, they do
indicate that higher concentrations of deicer applications result in higher soil chloride
levels.
4.2.4 Soil Samples—Field Experiment
Soil samples taken from along roads in the affected areas (Icicle and Tumwater
Canyons) were also analyzed for chloride concentration. Results show little difference
between affected and unaffected areas. Soils from unaffected sites in the Tumwater
Canyon had values of chloride between 30 and 36 ppm; unaffected soils in the Icicle
Canyon had between 36 and 91 ppm chloride. Soils from affected sites along Tumwater
Canyon had between 22 and 58 ppm chloride; soils from affected sites in Icicle Canyon
had between 43 and 75 ppm chloride. These results do not support the hypothesis, as it
was expected that soils in which are growing trees showing injury symptoms would have
much higher chloride levels than those from apparently unaffected areas. However, this
could be partially explained by the fact that soils sampled from along roadways were
sandy/gravelly soils, such that would drain quickly and would not likely hold anti- icer
residue for long. Additionally, soil samples were taken to a depth of 12 inches. It is
possible that the ions leach further down from the soil surface than 12 inches. Finally,
such a small sample size makes it difficult to draw any conclusions from the results. Due
to the variability of results, a true test of the hypothesis would need to be based on an
more thorough sampling design to determine the scale and pattern of soil concentrations
in the field.

28
Table 5: Soil chloride content of field soil samples taken from under uninjured trees and under injured trees (Sample “Tumwater Uninjured 3” and “Icicle Uninjured 2” were lost)
Soil Chloride Concentration (ppm) Sample
Injured Uninjured
Tumwater 1 44.92 30.67 Tumwater 2 22.83 35.90 Tumwater 3 57.08 Icicle 1 53.76 36.13 Icicle 2 74.74 Icicle 3 43.77 90.22
4.3 Tree Height Increase
As hypothesized, trees in Group 5 exhibited the most growth over the eight-week
period, typically around 10 centimeters. Also as hypothesized, growth in Groups 1-4 was
significantly less (Graph 1). All treatment groups that received anti- icer exhibited little
growth. In fact, many appear to have shrunk. Contrary to what was hypothesized, there
was not a linear pattern of decreasing growth with increasing anti- icer concentration.
Rather, it appears that all trees given anti- icer treatment were killed, and thus exhibited
no real growth.
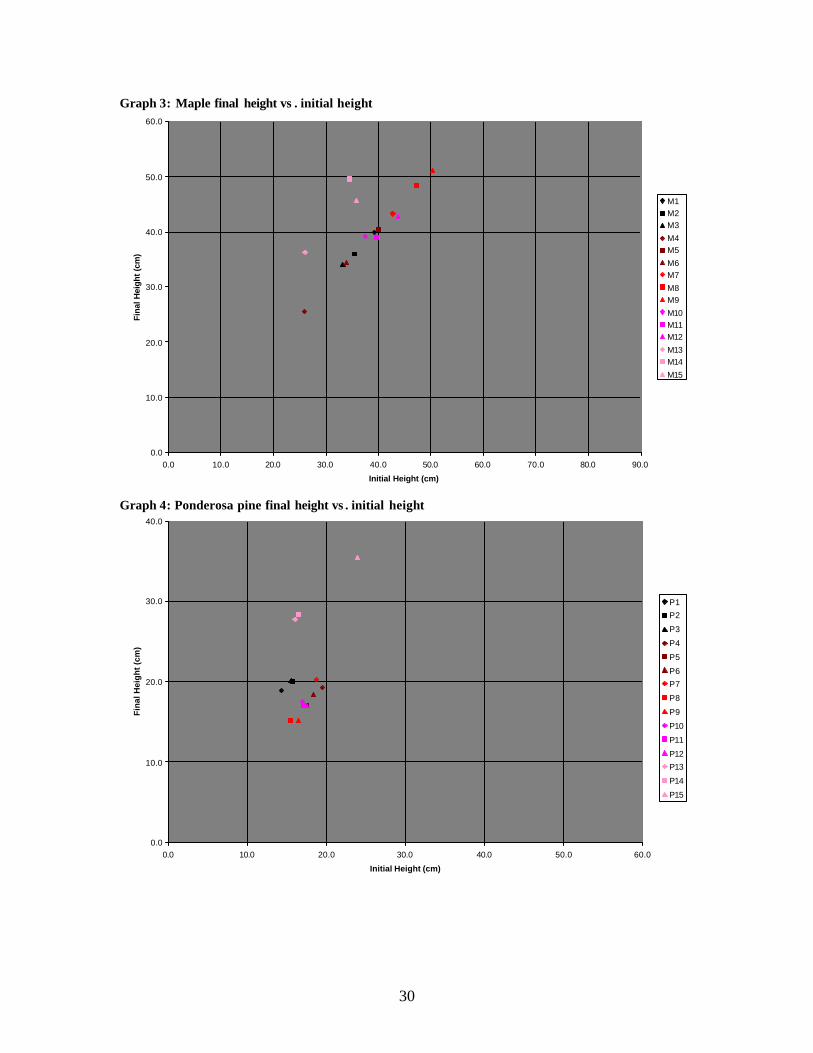
Graphs 1-4 plot initial tree height versus final tree height. All individuals, except
those in Group 5, are tightly clustered along a diagonal line, indicating little or no change
in height between the initial measurement and the final measurement. Group 5 trees are
typically above this diagonal line pattern, showing that their final height was greater than
their initial height. These graphs show that, basically, any tree receiving anti- icer
treatment virtually did not grow or grew very little, so as to make it seem likely that they
died soon after treatments started. Thus, differences of growth rates between Groups 1-4
will not be discussed; rather, only differences of growth between trees receiving anti- icer
treatment (Groups 1-4) and trees not receiving anti- icer treatment (Group 5) will be
discussed.

29
Graph 1: Cottonwood final height vs . initial height
0.0
20.0
40.0
60.0
80.0
100.0
0.0 20.0 40.0 60.0 80.0 100.0 120.0 140.0
Initial Height (cm)
Fin
al H
eig
ht (
cm)
C1
C2
C3
C4
C5
C6
C7
C8
C9
C10
C11
C12
C13
C14
C15
Graph 2: Douglas fir final height vs . initial height
0.0
10.0
20.0
30.0
40.0
50.0
60.0
0.0 10.0 20.0 30.0 40.0 50.0 60.0 70.0 80.0 90.0
Initial Height (cm)
Fina
l H
eign
t (c
m)
D1D2
D3D4D5
D6D7
D8D9
D10D11
D12D13D14
D15
30
Graph 3: Maple final height vs . initial height
0.0
10.0
20.0
30.0
40.0
50.0
60.0
0.0 10.0 20.0 30.0 40.0 50.0 60.0 70.0 80.0 90.0
Initial Height (cm)
Fina
l Hei
ght
(cm
)
M1M2M3
M4M5
M6M7
M8M9
M10M11M12
M13M14
M15
Graph 4: Ponderosa pine final height vs . initial height
0.0
10.0
20.0
30.0
40.0
0.0 10.0 20.0 30.0 40.0 50.0 60.0
Initial Height (cm)
Fin
al H
eig
ht
(cm
)
P1
P2
P3
P4
P5
P6
P7
P8
P9
P10
P11
P12
P13
P14
P15

31
These results support the hypothesis in that trees that would grow the most would
be those with the lowest levels of root chloride. However, it was expected that trees
would exhibit more or less growth based on the concentration of root chloride. Instead, it
seems that trees that received any CaCl2 essentially did not grow at all, while trees that
received no CaCl2 grew much more.
4.4 Mass Measurements
4.4.1 Leaf Mass
Trees given the control treatment exhibited the most leaf mass of all groups.
Again, there does not appear to be a linear relationship between leaf mass and anti- icer
concentration. Among deciduous trees grown in the greenhouse (cottonwood and maple)
there was virtually no leaf growth among treatment groups receiving anti- icer. Because
of this, no significant relationship was observed between leaf growth and anti- icer
treatment concentration. Cottonwoods receiving any anti- icer developed leaves for 2-3
weeks, then leaf growth stopped and the immature leaves that had developed began to
shrivel (see Appendix 1: Photographs ). Maples given any anti- icer failed to even develop
leaves. There did not appear to be any difference in leaf development for cottonwood
and maple trees given different anti- icer concentration treatments—no cottonwood tree
produced more than 0.39 grams of leaves, and maple trees receiving any anti- icer
produced no actual leaves (leaf weight measurements were of leaf primordia).
Coniferous trees (Douglas fir and Ponderosa pine) had already produced needles
when the experiment began. At the end, trees from Groups 1-4 generally had produced
less leaf mass than those of Group 5. This would be consistent with the hypothesis that
the trees had been killed by the treatments early on, and any further needle development

32
was due to the energy stored up in the cells prior to the commencement of the
experiment. These results support the hypothesis that trees given anti- icer treatments
would display less leaf growth, though the treatment concentrations appear to have been
too high to elicit meaningful differentials of leaf development.
Graphs 6-9 plot leaf mass versus total height increase over the 8-week
experimental period. Group 5 trees tend to align roughly around a diagonal plane,
indicating a correlation between leaf mass and height increase.
Graph 5: Cottonwood leaf mass versus total height increase
0
0.5
1
1.5
2
2.5
3
3.5
4
4.5
5
-4.0 -2.0 0.0 2.0 4.0 6.0 8.0 10.0 12.0 14.0
Height increase (cm)
Lea
f mas
s (g
ram
s)
C1
C2
C3
C4
C5
C6
C7
C8
C9
C10
C11
C12
C13
C14
C15

33
Graph 6: Douglas fir leaf mass versus total height increase
0
2
4
6
8
10
12
14
-2.0 0.0 2.0 4.0 6.0 8.0 10.0 12.0 14.0
Height increase (cm)
Lea
f m
ass
(gra
ms)
D1D2
D3D4
D5D6
D7D8
D9D10
D11D12D13
D14D15
Graph 7: Big-leaf maple leaf mass versus total height increase
0
1
2
3
4
5
6
7
-2.0 0.0 2.0 4.0 6.0 8.0 10.0 12.0 14.0 16.0 18.0
Height increase (cm)
Lea
f m
ass
(gra
ms)
M1M2
M3M4
M5M6
M7M8
M9M10
M11M12M13
M14M15

34
Graph 8: Ponderosa pine leaf mass versus total height increase
0
0.5
1
1.5
2
2.5
3
-2.0 0.0 2.0 4.0 6.0 8.0 10.0 12.0 14.0
Height increase (cm)
Lea
f mas
s (g
ram
s)
P1
P2
P3
P4
P5
P6
P7
P8
P9
P10
P11
P12
P13
P14
P15
4.4.2 Stem Mass
Stems were weighed to determine different growth rates among trees receiving
different concentrations of anti- icer treatments. While Group 5 trees produced the most
stem mass, there seemed to be little, if any, difference among treatment groups. Further,
it is doubtful that any real stem mass increase occurred, as it seems that trees receiving
anti- icer treatments were killed by the treatments.
Group 5 stem masses averaged 12.55 grams for cottonwoods, 11.64 grams for
Douglas fir, 10.69 grams for maple, and 3.73 grams for pines. There does not appear to
be any clear trend of increasing mass with decreasing anti- icer treatment concentration.
This experiment supported the hypothesis in that Group 5 trees produced the most stem
mass, but the hypothesized decrease in stem growth corresponding with increasing anti-
icer was not observed, probably due to the likely death of the trees.

35
Graph 9: Stem mass, arithmetic mean of three individuals of same species in same treatment group, measured in grams
0.00
2.00
4.00
6.00
8.00
10.00
12.00
14.00
16.00
18.00
Species
Mas
s in
gra
ms
Group 1 (100% CaCl2) 9.34 6.73 13.21 2.29
Group 2 (50% CaCl2) 15.73 4.84 9.62 2.33
Group 3 (25% CaCl2) 9.90 3.26 13.95 2.20
Group 4 (12.5% CaCl2) 8.63 3.76 6.07 2.22
Group 5 (Control) 12.55 11.64 10.69 3.73
Cottonwood Douglas Fir Maple Pine
4.4.3 Root Mass
Roots were weighed to determine growth differences between concentrations of
anti- icer treatments. Surprisingly, Group 1 trees developed the most root mass—an
average of 7.79 grams for cottonwoods, 6.88 g for Douglas fir, 10.95 g for maples, and
2.76 g for pines. In none of the species did Group 5 produce the most root mass. It
would seem from these results that, at least after an 8-week period, anti- icer treatments
have no noticeable ill-effect on root growth. This was unexpected due to the
preponderance of literature indicating severe root dieback as a result of anti- icer
treatment. However, the differences between treatment groups were not very much, and
it is difficult to pull any clear pattern from the data. If the trees did indeed die, then any
apparent differences are unimportant and must be dismissed as random variation.

36
Graph 10: Root mass, arithmetic mean of three individuals of same species in same treatment group, measured in grams
0.00
2.00
4.00
6.00
8.00
10.00
12.00
Species
Mas
s in
gra
ms
Group 1 (100% CaCl2) 7.79 6.88 10.95 2.76
Group 2 (50% CaCl2) 9.37 4.67 5.16 2.06
Group 3 (25% CaCl2) 5.30 2.57 7.86 1.39
Group 4 (12.5% CaCl2) 6.79 2.47 3.96 1.40
Group 5 (Control) 9.03 5.55 9.81 1.44
Cottonwood Douglas Fir Maple Pine
4.4.4 Total Mass
Leaf, stem, and root masses were combined to determine total weight of each tree
in order to highlight differences in growth rates between trees receiving different
concentrations of anti- icer. Again, since it appears that the trees in Groups 1-4 died as a
result of the treatments, and since there is little that can be considered a pattern that
emerges from the data of stem and root mass, total tree mass is not very helpful, and
really only reflects the difference in leaf mass between groups. Trees from Group 5
produced the most total mass of all treatment groups—cottonwoods in the control
treatment averaged 25.65 grams, Douglas firs 25.79 g, maples 25.66 g, and pines 7.18 g.
Trees in Groups 1 through 4 less mass than those of Group 5, but did not show any
obvious pattern.

37
Graph 11: Average total tree mass of each species within each treatment group
0.00
5.00
10.00
15.00
20.00
25.00
30.00
Species
Mas
s in
gra
ms
Group 1 (100% CaCl2) 17.32 18.59 24.17 6.53
Group 2 (50% CaCl2) 25.39 12.45 14.86 5.80
Group 3 (25% CaCl2) 15.38 8.18 21.92 4.85
Group 4 (12.5% CaCl2) 15.68 8.95 10.07 4.64
Group 5 (Control) 25.65 25.79 25.66 7.18
Cottonwood Douglas Fir Maple Pine
4.5 Leaf Surface Area
At the end of the experiment period, leaves from each individual tree were
removed and total leaf surface area was calculated for each tree. Since trees in Groups 1-
4 died, obviously Group 5 trees produced the most leaf area of all the treatment groups.
Graph 13 shows leaf surface area averages from each species by treatment group. Graphs
14-17 plot leaf surface area against total height increase and show that trees that produced
the most leaf mass also increased in height the most.

38
Graph 12: Leaf surface area
0.00
200.00
400.00
600.00
800.00
1000.00
1200.00
1400.00
1600.00
1800.00
2000.00
Species
Are
a (s
quar
e ce
ntim
eter
s)
100% CaCl250% CaCl2
25% CaCl2
12.5% CaCl2Control
100% CaCl2 1.70 100.12 0.06 14.55
50% CaCl2 3.84 59.66 0.91 16.91
25% CaCl2 3.01 47.74 1.23 13.36
12.5% CaCl2 8.05 64.49 0.39 12.82
Control 716.52 399.08 1807.29 78.90
Cottonwood Douglas Fir Maple Pine
Graph 13: Cottonwood leaf surface area vs. total height increase
0
100
200
300
400
500
600
700
800
900
1000
-4.0 -2.0 0.0 2.0 4.0 6.0 8.0 10.0 12.0 14.0
Height increase (cm)
Lea
f su
rfac
e ar
ea (s
qu
are
cm)
C1C2
C3C4
C5C6
C7C8
C9C10
C11C12C13
C14C15
116.43 81.32 65.34 85.75 3001.79

39
Graph 14: Douglas fir leaf surface area vs. total height increase
0
100
200
300
400
500
600
700
-2.0 0.0 2.0 4.0 6.0 8.0 10.0 12.0 14.0
Height increase (cm)
Lea
f su
rfac
e ar
ea (s
qu
are
cm)
D1D2
D3D4
D5D6
D7D8
D9D10
D11D12D13
D14D15
Graph 15: Big leaf maple leaf surface area vs. total height increase
0
500
1000
1500
2000
2500
-2.0 0.0 2.0 4.0 6.0 8.0 10.0 12.0 14.0 16.0 18.0
Height increase (cm)
Lea
f su
rfac
e ar
ea (s
qu
are
cm)
M1M2
M3M4
M5M6
M7M8
M9M10
M11M12M13
M14M15

40
Graph 16: Ponderosa pine leaf surface area vs. total height increase
0
20
40
60
80
100
120
-2.0 0.0 2.0 4.0 6.0 8.0 10.0 12.0 14.0
Height increase (cm)
Lea
f su
rfac
e ar
ea (s
qu
are
cm)
P1P2
P3P4
P5P6
P7P8
P9P10
P11P12P13
P14P15

41
5 DISCUSSION
5.1 Visual Observations
After only two weeks, Ponderosa pine and Douglas fir from Groups 1-4 began to
dry out and turn brown—classic salt injury symptoms. Ponderosa needles were
especially dry and brown, while Douglas fir needles seemed to grow slightly over the
experiment period. Cottonwood trees started to produce leaves in all treatment groups;
however, after a few weeks, the leaves stopped growing, turned brown at the tips, and
dried out completely. Maple trees did not produce any leaves. The photographs show
the obvious injury and lack of leaf development from trees receiving treatments
containing anti- icer, regardless of the concentration.
The symptoms observed in the greenhouse are very similar in appearance to those
observed along Highway 2 and Icicle Road around Leavenworth. The similar nature of
the injury symptoms observed in the greenhouse experiments and in the field would
support the hypothesis that anti- icers are the cause of the injury.
However, the severity of the symptoms observed in the greenhouse experiment
and the growth pattern of the trees given anti- icer treatments make it fairly certain that
even the lowest concentration treatment was lethal to the trees in Groups 1-4. Leaf break
did occur in the cottonwood trees within a few weeks, and Douglas fir needles seemed to
increase in size and quantity over the 8-week period. However, this could be explained
by the trees receiving artificial light and elevated temperatures, just enough stimulation to
begin bud break and use up the metabolic energy present when the experiment began. It
is not clear that any growth or development that occurred in the trees in Groups 1-4 is a
result of true biological growth, but could just be a physical process of cell expansion,

42
after which the trees did not “grow” any further. Thus, since all the treatments were
lethal, it is of little use to discuss the differences of the effects on trees observed between
different concentrations of anti- icer, and any apparent differences are most likely little
more than random variation.
5.2 Chloride Content
As the ion chromatograph results indicate, trees receiving higher concentrations
of deicer treatment had higher root chloride content. Similarly, as logic would suggest,
the soil of trees to which deicer was added had elevated chloride content, increasing with
the concentration of deicer in the treatment solution. It is clearly reasonable to deduce
that soil to which deicer is applied will have higher chloride content, and trees growing in
that soil will also have higher chloride content.
Soil samples taken from the field do not seem to show any clear pattern of
chloride content : values were too similar in affected and unaffected sites to discern any
significant difference in chloride content. This is possibly a result of roadside soils being
very well-drained, containing mostly sand and gravel, which thus retain little anti- icer
residue. This is also a result of the small sample size.
Leaf samples, however, do seem to show a pattern. Leaves that obviously
displayed injury symptoms consistently had higher chloride levels than those taken from
the same area but displayed no injury symptoms. Again, the small sample size was part
of the problem. More samples would improve the statistical power of this experiment.
Samples were simply collected in two groups—injured leaves from areas known to
receive deicer, and uninjured leaves from areas known not to receive deicer—and

43
homogenized within each of the two groups. At the least, there appears to be a
correlation between visual leaf injury and elevated chloride content.
Only a cursory visual examination of trees grown in the greenhouse is needed to
see the injury symptoms in the trees receiving anti- icer treatments (see 1: Photographs).
Trees receiving any anti- icer at all displayed severe injury symptoms, consistent with
symptoms described in the literature: leaf browning, leaf scorch, limb dieback, marginal
necrosis, etc. Since these symptoms only occurred in trees and soil that received anti- icer
treatment and no injury symptoms were observed in Group 5, there is reason to believe
that anti- icer is responsible for the injury symptoms. However, a larger sample size
would be needed in order to generate statistically-significant results
5.3 Height Increase
Group 5 trees increased in height most out of all groups over the eight-week
experiment period, as expected. However, it is not clear that any trees in Groups 1-4
truly increased in height at all. As stated above, they were likely killed by the anti- icer
treatments.
This experiment supported the hypothesis that anti- icer treatments would stunt
tree growth. However, the expected “gradient” of tree growth—higher concentration of
anti- icer treatment would result in a progressively lower growth rate—was not observed.
Again, this is likely explained by the trees having been killed by the anti- icer treatments.
5.4 Tree Growth Measurements
5.4.1 Leaf Mass
Clearly, Group 5 trees produced far more leaf mass than that of Groups 1-4. This,
again, is mostly due to the deaths of all trees in Groups 1-4. Thus, the only real insight

44
that this and the following mass measurements give into the effect of anti- icers on the
greenhouse trees is that the doses were above lethal levels. For that reason, it is
unnecessary to discuss stem and root mass.
A cursory observation at the end of the experiment would have led one to believe
that the deciduous species fared much worse than the coniferous species, since the
deciduous trees had no leaves of which to speak, while the coniferous trees at least had
needles, brown and shriveled though they may have been. However, it must be noted that
none of the cottonwoods or maples used in this experiment had developed any leaves by
the beginning of the experiment, while the coniferous trees already had needles. It is
possible that treatments had equally devastating effects on both deciduous and coniferous
species, but since the coniferous trees had already produced needles, they appeared less
affected by the treatments.
5.4.2 Stem Mass
Due to the mortality of the trees, discussion of stem mass measurements is
unnecessary.
5.4.3 Root Mass
Due to the mortality of the trees, discussion of stem mass measurements is
unnecessary.
5.4.4 Total Mass
Without being able to weigh trees before the experiment period and after, the
possibility that the average weight of trees in Group 5 was initially higher by random
chance, and the average weight of trees in Group 4 was lower, cannot be eliminated.
However, it can be assumed from these experiments that anti- icer can be lethal to trees in

45
sufficient quantity. It can therefore be assumed that anti- icer is detrimental to tree
growth. If it can kill the trees, it likely can retard growth in lower quantities.
5.5 Leaf Surface Area
If the treatments killed trees in Groups 1-4, then leaf surface area is irrelevant.
Any growth is simply the tree using up all the energy it had stored up in last-gasp growth
efforts. Only Group 5 (the control group) reflects true growth.

46
6 CONCLUSION
6.1 Summary of Findings
The scale of this experiment was too small to produce statistically-powerful
results or make any claims to scientific certainty. Further, the likelihood that anti- icer
treatments were lethal to Groups 1-4 renders any apparent growth comparisons
meaningless. The main finding of this experiment was that the anti- icer CaCl2 is lethal to
trees if present in excess.
Other general observations support this conclusion:
• CaCl2 added to soil has a detrimental effect on growth of trees growing in that
soil.
• Chloride levels are significantly higher in soil to which CaCl2 is added.
• Chloride levels are significantly higher in root tissue of plants growing in soil to
which CaCl2 is added.
• All trees that displayed retarded or aborted leaf development also had elevated
soil and root tissue chloride levels.
As to the question of whether anti- icer liquid could be the cause of injury
symptoms observed around Leavenworth, consider the findings: Trees grown in the
greenhouse that were given CaCl2 treatments were killed. Ion chromatography tests
clearly indicate that trees given CaCl2 treatments had severely elevated soil and plant
tissue chloride levels. Trees with elevated soil and plant tissue chloride levels also
exhibited severe injury symptoms, similar to those observed in Tumwater and Icicle
Canyons. Leaves from trees observed in both locations to have injury symptoms also had
elevated chloride symptoms. It is clearly reasonable to believe that CaCl2 highway anti-

47
icer can be detrimental to trees in high concentrations. Though it cannot be concluded
from this experiment with scientific certainty that anti- icers are the cause of observed
foliar injury around Leavenworth, since the experiments were conducted in a
greenhouse/laboratory setting, yet considering the chronology and distribution of the
observed symptoms, the existing body of scientific literature on the topic, and the
findings of this experiment, it is reasonable to consider it quite possible, if not likely, that
the leaf injury symptoms observed around Leavenworth are due, at least in part, to CaCl2
highway anti- icer.
6.2 Study Design Flaws
While this study shed some light on the question of how highway anti- icers affect
roadside trees, the study could have been improved upon in a number of ways. A larger
sample size for the greenhouse experiments would have yielded more statistically
powerful data that could be analyzed more quantitatively. As it was, the population of 60
trees was, in effect, divided up into 20 groups of three individuals each. If there had been
more individuals in each group, an effective statistical analysis could have provided more
powerful results.
Additionally, the anti- icer treatments given to the trees were, in retrospect, far too
strong. Even the lowest concentration of anti- icers appeared to have killed the trees. Had
each succeeding the concentration been one-tenth of the previous, rather than one-half,
there may have been more of a gradation of response to the treatments, rather than simply
killing each tree from Groups 1-4.
It may have also been more enlightening had the greenhouse experiment been
conducted over a longer period of time. The trees were given eight weeks to grow,

48
though this time frame was chosen largely because of time constraints related to the
academic semester and the observation that all trees in Groups 1-4 appeared to have died
within 4-5 weeks. Had they been given more time to grow, along with lower
concentrations of anti- icer application, there may have been a more visible pattern of
response. However, with treatment concentrations that were used, more time would not
have made a difference, as the trees appear to have been killed within a few weeks.
Well-thought-out field studies would have contributed significantly to this study
as well. One field study that was considered was to work with the WSDOT and have
anti- icers applied further up the Icicle than normal for one winter, then observe leaf
development of trees along that stretch of road the following growing season. However,
this was not practicable due to geographical distance from the study area.
6.3 Further Study
Unfortunately, due to the brief nature of this study, not all pertinent questions
were adequately addressed. However, it is clear that further study into the environmental
effects of highway anti- icers is warranted. A more extensive study of chloride levels of
trees observed to have injury symptoms is needed, such as further ion chromatographic
analysis of field samples of both apparently affected and unaffected trees—soil, leaf
tissue, root tissue, etc. These chloride levels could then be correlated with treatment
quantities or distance from the road.
Another enlightening study would be to observe trees along highways that do not
receive anti- icer treatment, and compare visual observations of leaf conditions. Do
symptoms occur along roads that do not receive anti- icer treatment? Certainly, along the
two particular roads observed in this study, symptoms clearly coincided with the stretches

49
to which anti- icer is applied and ended abruptly when anti- icer application ended.
However, a study that focused on a larger set of roads is warranted.
Leaf injury among trees along Hwy 2 in Tumwater Canyon was much more
severe than on those along Icicle Road in Icicle Canyon. One possible explanation is the
speed limits on roads in the respective canyons. Hwy 2 along Tumwater Canyon has a
speed limit of 50, while Icicle Road has a speed limit of 35. Cars driving at high rates of
speed likely spray melted snow further than cars traveling slower. Also, there is more
traffic on Hwy 2 than on Icicle Road, which is a dead end. Thus, it is possible that the
more severe symptoms seem in Tumwater Canyon are due to the higher speed limit and
more cars to spray the melted snow/deicer liquid further into the vegetation along the side
of the road. However, this question was not addressed in this study. A study inquiring
about the effects of traffic speed and distance of spray and severity of symptoms would
be interesting.
50
7 REFERENCES
Barrick, W.E., and Davidson, H. (1980) “Deicing Salt Spray Injury in Norway Maple as
Influenced by Temperature and Humidity Treatments.” HortScience 15:2 pp. 203-205.
Bicknell, S., and Smith, W. (1975). “Influence of soil salt, at levels characteristic of some
roadside environments, on the germination of certain tree seeds.” Plant and Soil. Vol. 43. 719-722.
Bogemans, J., Neirinckx, L., and Stassart, J.M. (1989). “Effect of deicing chloride salts
on ion accumulation in spruce.” Plant and Soil. 113. p. 3-11. Buschbom, U. (1980). “Experiences with de- icing salts in Germany.” Eur. J. For. Path.
10:349-353. Button, E. F. (1964). “Uptake of Chlorides By Sugar Maples From Rock Salt Used For
Highway Ice Control.” Turf Bulletin December 1964 p.11-13. Bryson, G.M. and Barker, A.V. (2002). “Sodium accumulation in soils and plants along
Massachusetts roadsides.” Commun. Soil Sci. Plant Anal. Vol. 33 (1&2). 67-78. Buschbom, U. (1980) “Experiences with de-icing salts in W. Germany.” European
Journal of Forest Pathology. 10. pp. 349-353. Case, T. E. (2002) “Plant Extractable Chloride.” Analytical Sciences Laboratory
Standard Methods. Regents of the University of Idaho. “Chloride toxicity in Lychee.” (2005) The State of Queensland, Australia. Retrieved
from http://www.dpi.qld.gov.au/lychee/12416.html on 3-26-05 Delorme Topo USA 5.0. (2004) Western Region. CD-ROM. Dobson, M.C. (1991) De-icing Salt Damage to Trees and Shrubs. Forestry Commission
Bulletin 101. London. Foster, R.C., and Sands, R. (1977) “Response of radiata pine to salt stress, II. Aust. J.
Plant Physiol. 4. p. 637-646. Guttay, A.J.R. (1976). “Impact of Deicing Salts upon the Endomycorrhizae of Roadside
Sugar Maples.” Soil Sci. Am. J. Vol. 40. 952-954. Harper, H.J. (1946) “Effect of Chloride on Physical Appearance and Chemical
Composition of Leaves on Pecans and Other Native Oklahoma Trees.” Technical Bulletin No. T-22. Oklahoma Agricultural Experiment Station.
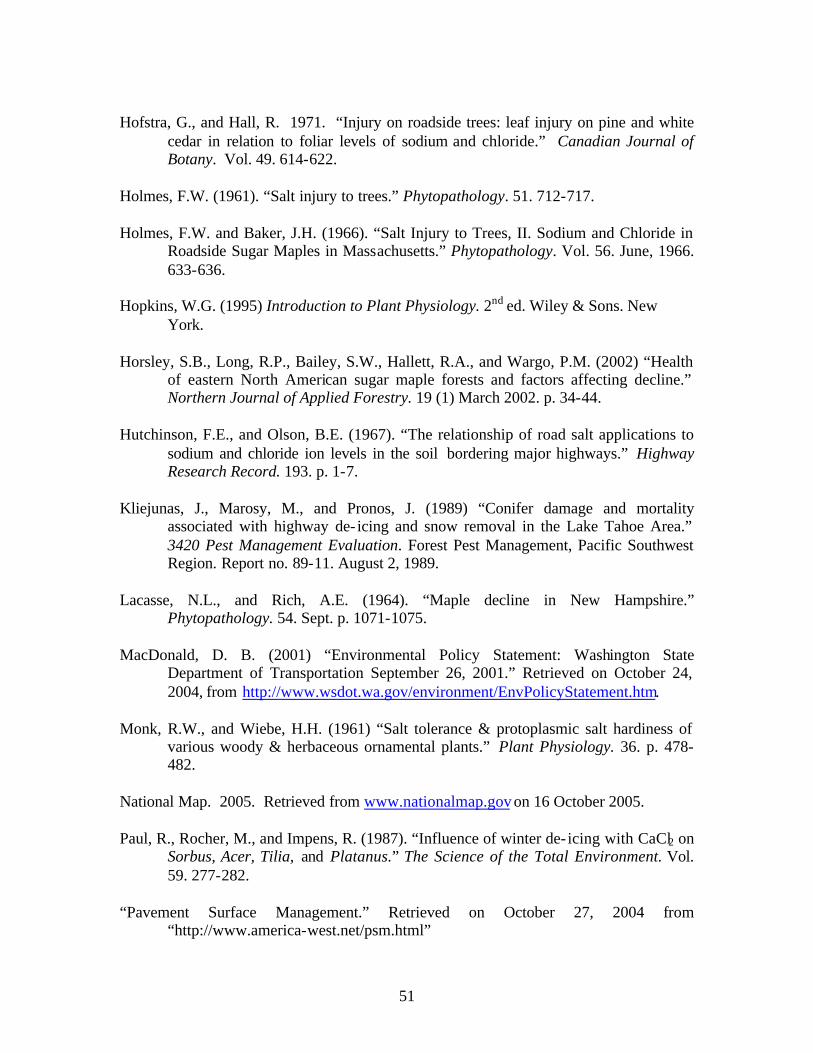
51
Hofstra, G., and Hall, R. 1971. “Injury on roadside trees: leaf injury on pine and white
cedar in relation to foliar levels of sodium and chloride.” Canadian Journal of Botany. Vol. 49. 614-622.
Holmes, F.W. (1961). “Salt injury to trees.” Phytopathology. 51. 712-717. Holmes, F.W. and Baker, J.H. (1966). “Salt Injury to Trees, II. Sodium and Chloride in
Roadside Sugar Maples in Massachusetts.” Phytopathology. Vol. 56. June, 1966. 633-636.
Hopkins, W.G. (1995) Introduction to Plant Physiology. 2nd ed. Wiley & Sons. New
York. Horsley, S.B., Long, R.P., Bailey, S.W., Hallett, R.A., and Wargo, P.M. (2002) “Health
of eastern North American sugar maple forests and factors affecting decline.” Northern Journal of Applied Forestry. 19 (1) March 2002. p. 34-44.
Hutchinson, F.E., and Olson, B.E. (1967). “The relationship of road salt applications to
sodium and chloride ion levels in the soil bordering major highways.” Highway Research Record. 193. p. 1-7.
Kliejunas, J., Marosy, M., and Pronos, J. (1989) “Conifer damage and mortality
associated with highway de- icing and snow removal in the Lake Tahoe Area.” 3420 Pest Management Evaluation. Forest Pest Management, Pacific Southwest Region. Report no. 89-11. August 2, 1989.
Lacasse, N.L., and Rich, A.E. (1964). “Maple decline in New Hampshire.”
Phytopathology. 54. Sept. p. 1071-1075. MacDonald, D. B. (2001) “Environmental Policy Statement: Washington State
Department of Transportation September 26, 2001.” Retrieved on October 24, 2004, from http://www.wsdot.wa.gov/environment/EnvPolicyStatement.htm.
Monk, R.W., and Wiebe, H.H. (1961) “Salt tolerance & protoplasmic salt hardiness of
various woody & herbaceous ornamental plants.” Plant Physiology. 36. p. 478-482.
National Map. 2005. Retrieved from www.nationalmap.gov on 16 October 2005. Paul, R., Rocher, M., and Impens, R. (1987). “Influence of winter de- icing with CaCl2 on
Sorbus, Acer, Tilia, and Platanus.” The Science of the Total Environment. Vol. 59. 277-282.
“Pavement Surface Management.” Retrieved on October 27, 2004 from
“http://www.america-west.net/psm.html”

52
Rich, A. E. and Lacasse, N. L.. “Salt Injury to Roadside Trees.” Forest Notes. Winter
1963-1964. Sands, R. and Clarks, A.R.P. (1977). “Response of Radiata Pine to salt stress. I. Water
relations, osmotic adjustment, and salt uptake.” Aust. J. Plant Physiology. 4. p. 637-646.
Shortle, W.C., Kotheimer, J.B., and Rich, A.E. (1972). “Effect of salt injury on shoot
growth of sugar maple, Acer saccharum.” Plant Disease Reporter. 56:11. p. 1004-1007.
Standerford, Dwayne. (2004) Personal communication. Phone interview. October 2004. Strogonov, B.P. (1965) Physiological Basis of Salt Tolerance of Plants (as affected by
various types of salinity). transl. from Russian. Daniel Davey & Co. NY Strong, F.C. (1944) “A Study Of Calcium Chloride Injury to Roadside Trees.” Michigan
Quarterly Bulletin. Vol. 27 (2). 209-224. Sucoff, Edward. (1975) Effect of Deicing Salts on Woody Vegetation Along Minnesota
Roads. Investigation No. 636 Final Report. Minnesota Highway Dept., Univ. of Minn.
von Sury, R. and Flückiger, W. (1982) “The effect of different mixtures of NaCl and
CaCl2 on the silver fir (Abies alba Miller).” Botanisches Institut der Unversität Basel (Switzerland).
Washington State Department of Transportation (WSDOT). (2003) “2003 WSDOT Anti
Icer/Snow and Ice Control Update.” Retrieved on October 27, 2004, from “http://www.wsdot.wa.gov/winter/anti.htm.”

53
APPENDIX A: PHOTOGRAPHS

54
Photograph 1: February 25, all groups
Photograph 2: February 25, Douglas Fir Gr oup 1

55
Photograph 3: March 4, Ponderosa pine Group 1
Photograph 4: March 4, Maple Group 5
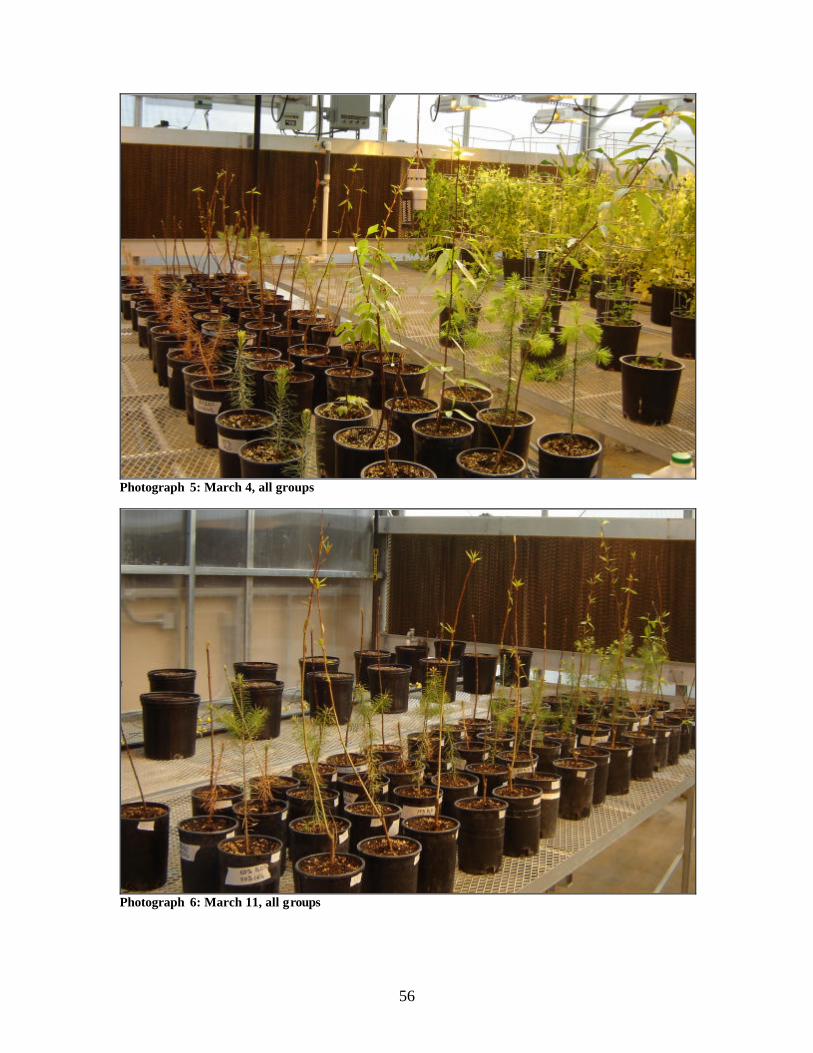
56
Photograph 5: March 4, all groups
Photograph 6: March 11, all groups

57
Photograph 7: March 11, Group 5
Photograph 8: March 11, Group 4 Ponderosa pine

58
Photograph 9: March 11, Group 3
Photograph 10: March 18, all groups

59
Photograph 11: March 18, Group 1
Photograph 12: March 18, Group 2 cottonwood leaves
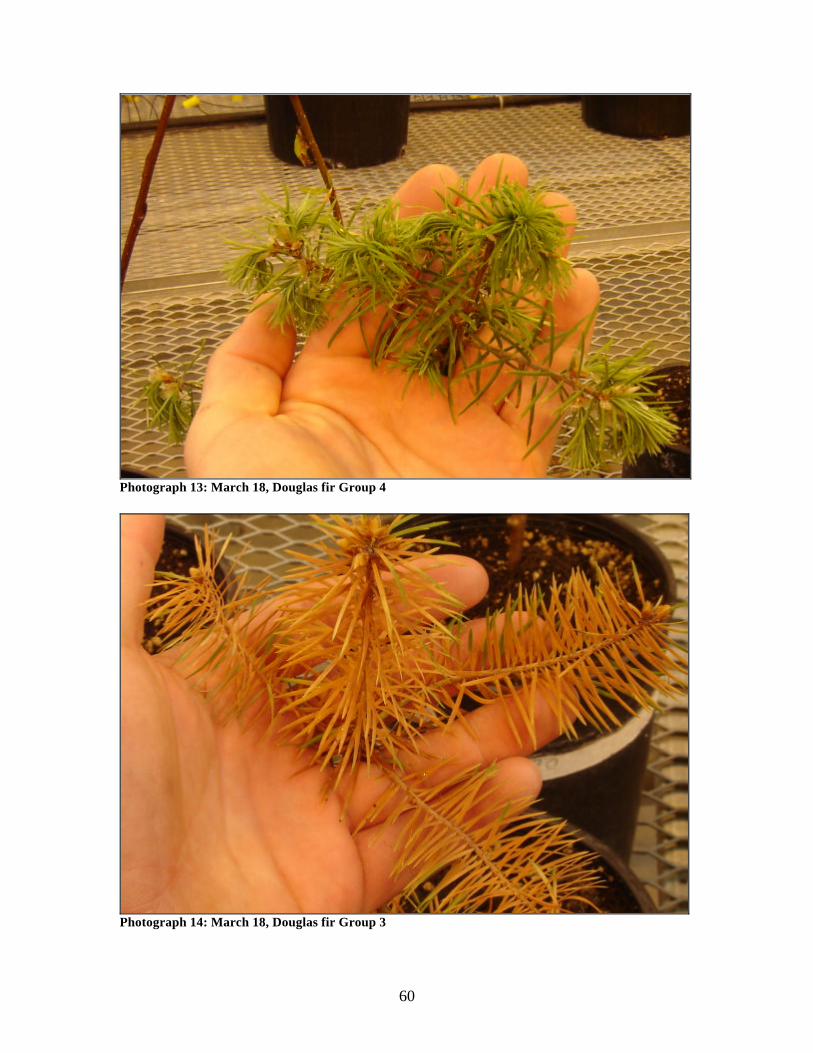
60
Photograph 13: March 18, Douglas fir Group 4
Photograph 14: March 18, Douglas fir Group 3
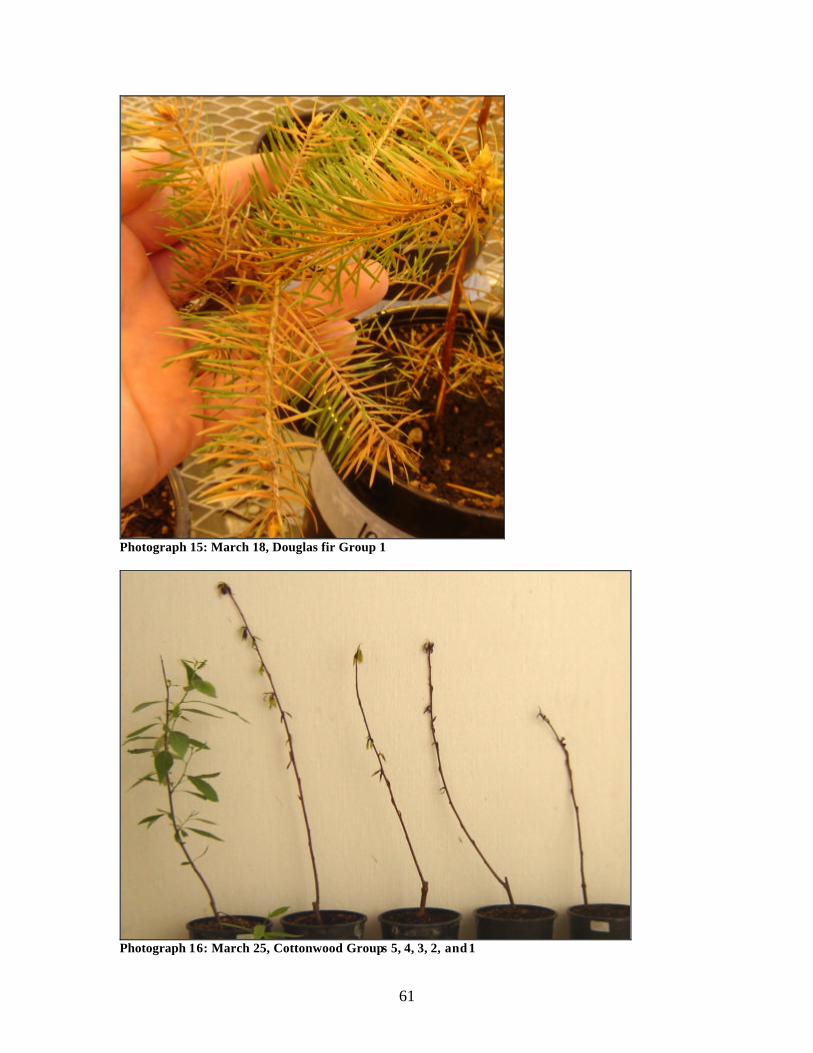
61
Photograph 15: March 18, Douglas fir Group 1
Photograph 16: March 25, Cottonwood Groups 5, 4, 3, 2, and 1

62
Photograph 17: March 25, Douglas fir Groups 5, 4, 3, 2, and 1
Photograph 18: March 25, Maple from Groups 5, 4, 3, 2, and 1
Photograph 19: March 25, Ponderosa pine, Groups 5, 4, 3, 2, and 1

63
Photograph 20: April 16, Cottonwood Group 1 Photograph 21: April 16, Cottonwood Group 2
Photograph 22: April 16, Cottonwood Group 3 Photograph 23: April 16, Cottonwood, Group 4
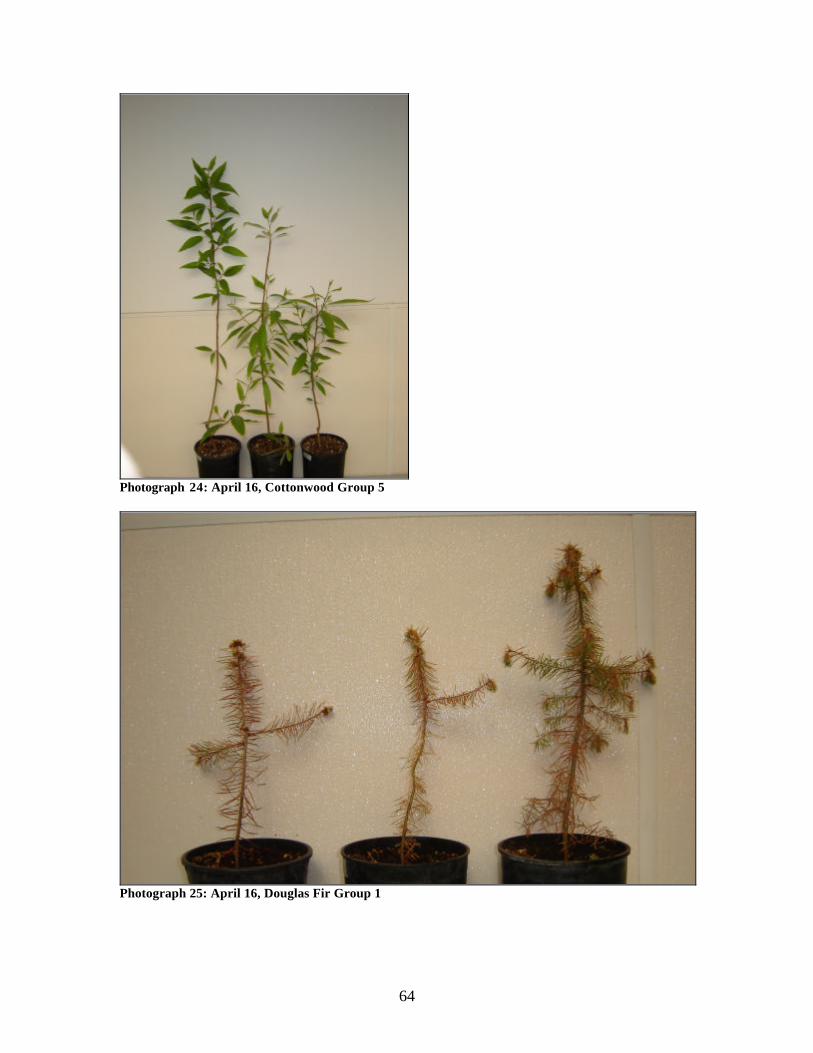
64
Photograph 24: April 16, Cottonwood Group 5
Photograph 25: April 16, Douglas Fir Group 1

65
Photograph 26: April 16, Douglas Fir Group 2
Photograph 27: April 16, Douglas Fir Group 3

66
Photograph 28: April 16, Douglas fir Group 4
Photograph 29: April 16, Douglas fir Group 5

67
Photograph 30: April 16, Big-leaf Maple Group 1 Photograph 31: April 16, Big-leaf Maple Group 2
Photograph 32: April 16, Big-leaf Maple Group 3 Photograph 33: April 16, Big-leaf Maple Group 4

68
Photograph 34: April 16, Big-leaf Maple Group 5
Photograph 35: April 16, Ponderosa Pine Group 1

69
Photograph 36: April 16, Ponderosa Pine Group 2
Photograph 37: April 16, Ponderosa Pine Group 3

70
Photograph 38: April 16, Ponderosa Pine Group 4
Photograph 39: April 16, Ponderosa Pine Group 5

71
Photograph 40: Injury symptoms along Icicle Road, mid-late summer 2004
Photograph 41: Injury symptoms along Icicle Road, mid-late summer 2004

72
Photograph 42: Injury symptoms in big-leaf maple leaves: browned, curled leaf margins
Photograph 43: Injury symptoms in big-leaf maple leaves: browned, curled leaf margins