Embed Size (px)
Citation preview

Chemistry
UNITED STATES DEPARTMENT OF THE INTERIOR
GEOLOGICAL SURVEY
By
Irving A. Breger
May 1956
This preliminary report is distributed | //. without editorial and technical review < * for conformity with official standards and nomenclature. It is not for public inspection or quotation*
*This report concerns work done on behalf of the Division of Research of the U. S* Atomic Energy Commission.

USGS -
CHEMISTRY
Distribution Ho. of copies
Division of Raw Materials, Albuq.uerq.ue .............................. 1Division of Raw Materials, Austin ................................... 1Division of Raw Materials, Casper ................................... 1Division of Raw Materials, Denver ................................... 1Division of Raw Materials, Rapid City ............................... 1Division of Raw Materials, Salt Lake City .......................... 1Division of Raw Materials, Spokane .................................. 1Division of Raw Materials, Washington ............................... 3Division of Research, Washington ..................................... 1Grand Junction Operations Office .................................... 1Production Evaluation Division, GJOQ ................................ 6Technical Information Service Extension, Oak Ridge .................. 6
U, S« Geological Survey:Foreign Geology Branch, Washington .................................. 1Fuels Branch, Washington ............................................ 1Geochemistry and Petrology Branch, Washington ....................... 10Geophysics Branch, Washington ....................................... 1Mineral Deposits Branch, Washington ................................. 1A. L. Brokaw, Grand Junction .................................. ,, ...... 2N, M. Denson, Denver ................................................ 1R, L. Griggs, Albuquerque .*.,..................».,...,,..»*..».»,... 1W, R* Keefer, Laramie ............................................... 1H. W. Lakin, Denver ................................................. 1E. M. MacKevett, Menlo Park ......................................... 1L. R. Page, Washington ....... 0 ...................................... 1'P. K« Sims, Denver .................................................. 1Q. D. Singewald, Beltsville ......................................... 1F* N. Ward, Denver ..... 0 ............................................ 1A. E. Weissenborn, Spokane ...................................... «.*.. 1P.. E, Hots, Menlo Park ...*.*..»,»....,............................. ITEPCO, Denver ............,,....,....„.*..,..........,.....*.......«. 2TEPCO, RPS, Washington, (including master) .......»..........*....... 2

CCTOEHTS
Abstract .*.*»...»..,....»»..,....,,».............**..*.*...*.«*.*.»*»... 5IntrotarfcIon ...».......,...,.,...„...»,.«.....»..,..*...*..*...*,»...>.»* 5Aeknowledgrapsts ...»,.»*..*.......,..,,.»..»..*»»*,.»...«.*,.»..,.*...... 6Samples 0 ......................................... e .. s ................... 7Discussion .*............................................................. 25
Mature of the plant debris ......................................... 25Correlation between uranium and constituent elements of the coalified wood ......•:•.».«*»».»....••,•»..*..».».»...*,,.•».*..»,.•*. 28
Correlation of uranium with elements in ash from coalifled -wood .... J8Autoradiographic studies ........................................... k&
Introduction and retention of uranium ................................... k£Conclusions ....»*....*»**..,.....,»...«.**...,....,»*...,....,*.,,.««..» VfLiterature cited • .•.»».»»«.••........»*...».••*•.»..•....»..»«•».»,».»..... W
ILLUSTRATIONS
Figure 1. Analyses of coalif ied wood samples from the Colorado Plateauplotted on Seyler coal chart ................................. 27
2. Variations in coalif ication within the same specimen andwithin the same mine ......................................... 27
3» Relationship of organic carbon (moisture- and ash- free) touranium in coalif ied wood .................................... 30
4. Relationship of organic hydrogen (moisture- and ash-free) touranium in coalif ied wood, semilogarithmic plot .,...,.,....». >1
5. Relationship of organic hydrogen (moisture- and ash-free) to uranium in coalif ied wood, linear plot. Straight line based on a least squares calculation assuming straight line relationship ..................................... . . ........
6. Relationship of volatile content (moisture- and ash-free) to uranium in coalif ied wood ..................................
7. Relationship of sulfur (moisture- and ash-free) to uranium incoalif ied wood ............................................... 36
8. Relationship between Btu content of coalif ied wood and itsuranium content .............................................. 37
9. Relationship between oxygen, (0 + N + total S), or (0 + N4- organic S ) and uranium for coalif ied wood .................. 39
10. Concentration of alpha -particle tracks about fracture zone inautoradiographic study of sample DD-2 (diagrammatic) ......... V>

Table 1. Description of coalifled -rood specimens from the Colorado Plateau . 8
2. Analysis of coalified wood sample EF-1 from the Colorado Plateau ». i4
3. Analysis of coalified -wood sample DD-2 from the Colorado Plateau ..15
4* Analysis of coalified -wood sample DD-3 from the Colorado Plateau *. l6
5. Analysis of coalified wood sample P-l from the Colorado Plateau »,. 17
6. Analysis of coalified wood sample AG-1 from the Colorado Plateau *» 18
7. Analysis of coalified wood sample JJ-2 from the Colorado Plateau ..19
8. Analysis of coalified wood sample SF-1 from the Colorado Plateau ». 20
9. Analysis of coalified wood sample JIA-1 from the Colorado Plateau ,. 23J
10* Analysis of coalified wood sample V-l from the Colorado Plateau ».. 22
11. Analysis of coalified wood sample MD^2B-3 from the ColoradoPlateau »*.*...»........»..»».....»......,...... . # ...........**.... 23
12. Analyses for plant debris from the Colorado Plateau ............... 2^
13. Equivalent classification of samples of coalif ied wood ............ 26
1%. Data for the correlation of oxygen, nitrogen, and sulfur withuranium in coalified wood ..A...................................... 40•
15 » Semi quant itatiire spectrographic analyses of ashes from samples ofcoalified wood from the Colorado Plateau ..A.,.....,.*..........*.. ^1
16. X-ray diffraction analyses of several samples of coalified wood ...

OF" CUALiFiJbUJ HOOD ASSOCIATED
ABSTRACT
In a study of the relationship of fossil plant debris to uranium on the
Colorado Plateau, analyses of logs hare shorn that the composition of the
coalified wood is dependent upon environment of burial. Equivalent rank varies
from lignite to subbituminous on the British classification. Although uranium
and carbon content cannot be correlated, organic hydrogen, volatile content,
and Btu values decrease as uranium content increases. Several samples of
coalified wood, both uraniferous and nonuranif erous , have lost all vestiges of
cellular structure. Autoradiographic studies show concentrations of alpha
particles along fracture zones of the coalified wood, Even where uraninite or
cof finite is known to be present, however, the uranium is dispersed throughout
the material. It is suggested 'that uranium, as the uranyl ion, was absorbed
by the coalified wood, just as in massive uranium-bearing coals, and subse
quently reduced from IT1"6 to IT*"4 .
INTRODUCTION
The geochemical relationship of plant debris to uranium and vanadium has
long been a subject for speculation (Boutwell, 1904). Hess (1933) in discussing
mineral deposits in the Bhinarump member of the Chinle formation and the
Morrison formation of the Colorado Plateau stated, %. .uranium is nowhere found
without carbonaceous material, either fossilif erous or petroliferous." As
exploration for uranium intensified after 19^5, more and more such occurrences

described until today tnere is recognized nearly universally an association
of fossil plant debris with oxidized and unoxidized uranium and vanadium ores
that occur in sedimentary deposits. The literature is replete "with such
descriptions, and fossil wood has even been suggested as a guide to uranium ore
(Weir, 1952? McKay, 1955).
In spite of the widespread descriptions covering such associations, there
have been no specific studies of the plant debris. This report summarizes
studies carried out to date to answer two specific questions;
1) What is the nature of the coalified plant debris, uraniferous and
nonuranif erous, that occurs on the Colorado Plateau?
2) Can any relationships be recognized between uranium and other elements of
or associated with the coalified plant debris?
The work summarized in this report is of a preliminary nature and will
be augmented by additional investigations.
Among his colleagues at the U. S. Geological Survey the author is particu
larly indebted to Kenneth G» Bell who accompanied the author during the
collection of samples in 1955; his comments were both helpful and stimulating.
R. C. Robeck, D. P. Elston, and L. S. Hilpert suggested areas of particular
interest. Alice D. Weeks, L. R. Stieff, and T. W. Stern provided samples from
their collection. Standard coal analyses were obtained through the courtesy
of Roy F. Abernethy of the U. S. Bureau of Mines.
This work is part of a program conducted by the U. S. Geological Survey on
behalf of the Division of Research of the U. S. Atomic Energy Commission.

SAMPLES
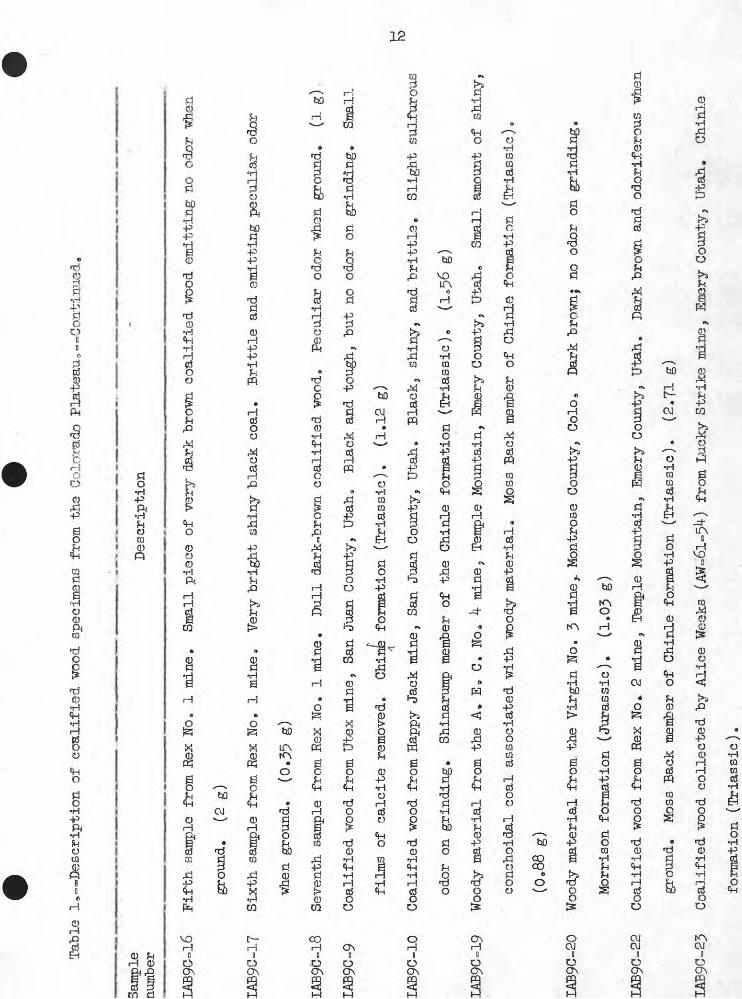
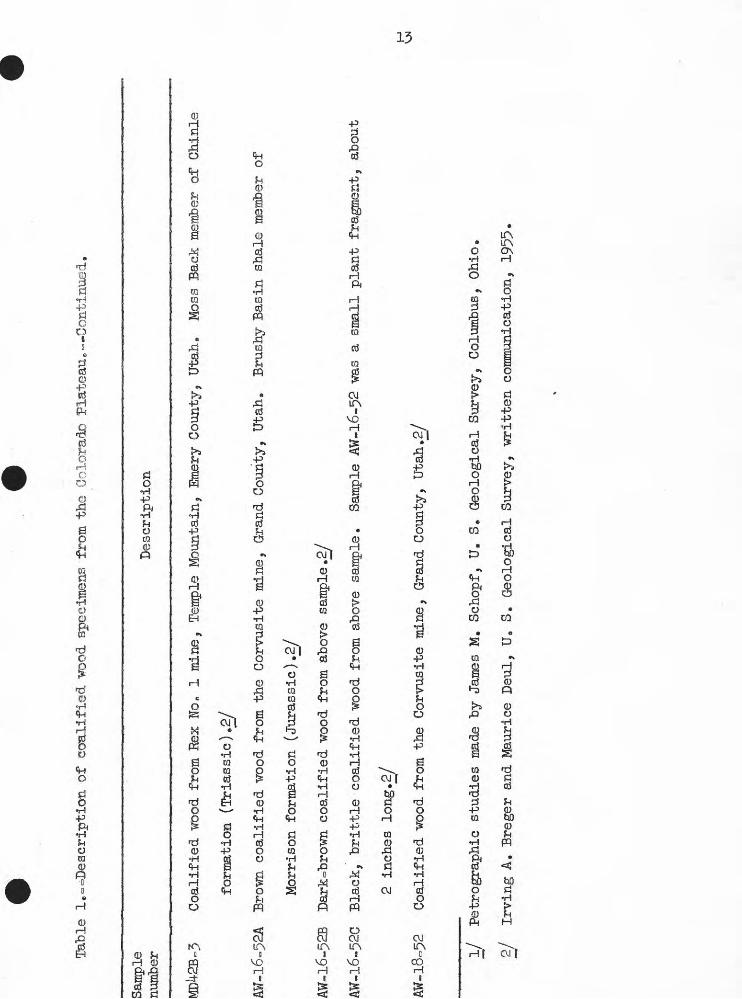
Locations and descriptions are presented in table 1 for samples collected
from Triassic and Jurassic sedimentary rocks of the Colorado Plateau. Plant
debris was recognizable by its morphology at each collection site.
With the exception of sample T3T-1, the first 9 samples shown in table 1
-were relatively large--several pounds. To obtain additional data, pieces of
eoalified plant debris, although too small for coal analyses or for petrographic
work, were also studied. These samples are also listed in table 1.
U. S. Bureau of Mines standard coal analyses (Fieldner and Selvig, 1951)
for samples KF-1, DD-2, DD-3, P-l, AG-1, JJ-2, SF-1, NA-1, V-l, and MD^2B-3 are
shown in tables 2 through 11. Uranium analyses together with carbon, hydrogen,
and ash values are summarized in table 12.

Table
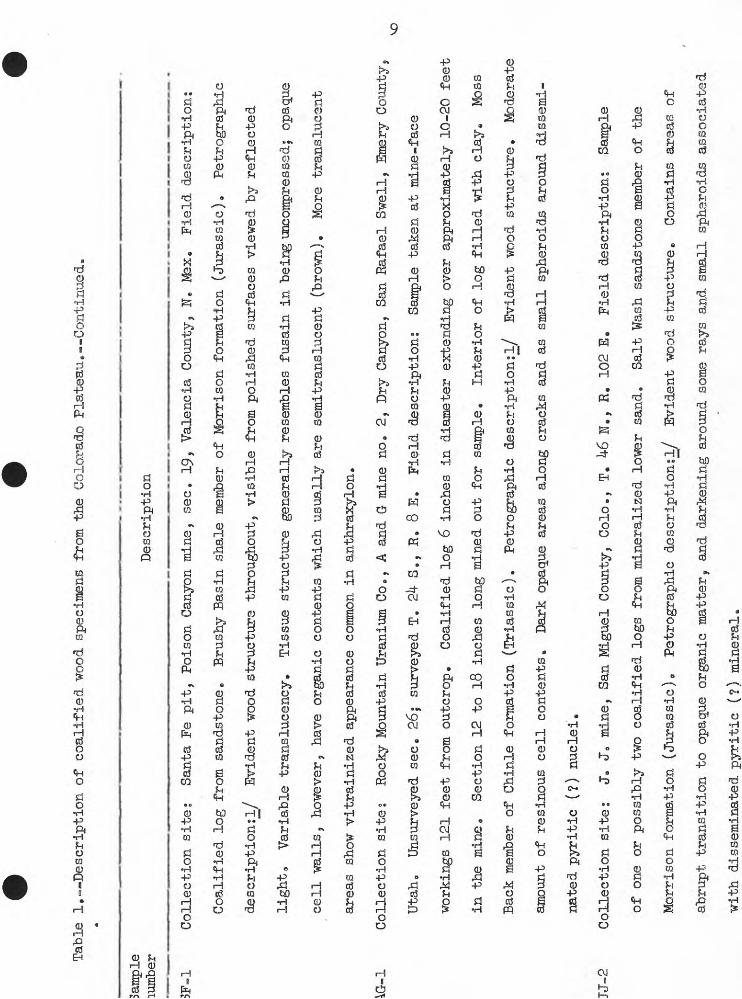
1.--
Desc
ript
ion
of coa
lifi
ed woo
d sp
ecim
ens
from t
he Co
lora
do P
lateau,
Desc
ript
ion
Coll
ecti
on si
te;
Robb
y Fo
rd,
Chim
ney
Canyon,
San Raf&el S
well
, Emery
County,
Utah
* Unsurveyed s
ec,
25f
surv
eyed
T.
25 S.,
R. 8
E.,
SLM.
Field
description;
Coal
ifie
d wo
od i
n whit
e sandstone.
Moss B
ack
member of
Chi
nle
form
atio
n (T
riassie)
0 Sa
mple
ab
out
6 in
ches
above bottom o
f channel.
Petr
ogra
phic
description;I/
No h
isto
logi
c structure=-a r
ed translucent li
mpid
gel
a No v
isib
le m
iner
als
or op
aque
orga
nic
matter.
Coll
ecti
on si
te:
Dirty Devil
No.
k mine,
Scho
ol se
ctio
n, Sa
n Hafael S
well
, Emery
Coun
ty,
Utah
. Field
desc
ript
ion:
Coal
ifie
d log from
roo
f in
corridor
about
100
yards
from
adi
t»
Highly vitrainized.
Smells
Co
asphaltic
when
bro
ken.
Mo
ss Back
memb
er of
Ch
inle
fo
rmat
ion
(Tri
assi
c).
Petr
ogra
phic
description:!/
Questionab
le hi
stol
ogic
st
ruct
ure.
Matrix v
ery
dense, mostly o
paqu
e or b
rown i
ncluding so
me tr
ansl
ucen
t
ovoi
d organi
c bodies.
Some of t
he ov
oid bo
dies
ar
e grouped
in f
iles
remini
scen
t of
ray-resin g
roup
ings
in w
ood.
However, no cell-wall
diff
eren
tiat
ion
is vi
sibl
e0
Pyritic
(?)
and
tran
spar
ent
mine
ral
matt
er
show
equ
ivoc
al r
elation
to p
ossible
histologic fe
atur
es.
Coll
ecti
on si
te?
Same as
DD-2,
Field
description:
Seve
ral
small
coalified
logs
, ea
ch several
inch
es wide
and
about
18 inches lo
ng.
Samp
le about
2 feet bel
ow DD-
2 an
d 8
feet fr
om i
t laterally.
Samp
le ab
out
2 fe
et a
bove or
e-be
arin
g sandstone.
Moss
Back
memb
er of Ch
inle
formation
(Triassic).
Petrographic
description:!/
Evident wood s
tructure,
resi
nous
cell c
onte
nts
scarce.
Opaq
ue spheroids with pyr
itic
nuclei.
Table
1,=-De scrip
t io
n of
coa
lifi
ed woo
d specimens
from
the
Colorado Pl
atea
u.—C
onti
nued
.
Desc
ript
ion
Collection s
ite;
Sa
nta Fe
pi
t, Po
ison C
anyo
n mine,
sec. 19,
Valencia County,
N. Me
x.
Fiel
d de
scri
ptio
n:
Coalified
log
from s
andstone.
Brushy Basin shale
memb
er of
Morrison
form
ation
(Jurassic).
Petr
ogra
phic
desc
ript
ion:
!./
Evident wo
od s
tructure th
roug
hout
, vi
sibl
e from pol
ishe
d su
rfac
es viewed by
reflected
ligh
t.
Vari
able
tra
nslu
cenc
y.
Tiss
ue st
ruct
ure
gene
rall
y resembles
fusa
in i
n being un
comp
ress
ed 5
opaque
cell
wal
ls,
however, have or
gani
c co
nten
ts wh
ich us
uall
y ar
e se
mitr
ansl
ucent
(brown).
More tr
ansl
ucen
t
area
s sh
ow vit
rain
ized
app
eara
nce
comm
on i
n anthraxylon.
Collection s
ites
Ro
cky Mo
unta
in Ura
nium
Co.
, A and
G- mi
ne no.
2, Dry
Canyon,
San Rafael S
well,
Emer
y Co
unty
,vo
Utah
o Unsu
rveyed s
ec.
26;
surveyed T
. 2^
S., R, 8
E.
Fiel
d description;
Samp
le taken
at m
ine-
face
work
ings
12
1 feet f
rom
outc
rop.
Coalified lo
g 6
inch
es in diameter ex
tend
ing
over approximately
10-20
feet
in t
he mi
ne.
Section
12 to
18 in
ches
long mined o
ut fo
r sample.
Interior of lo
g fi
lled
wit
h cl
ay.
Moss
Back mem
ber
of C
hinl
e formation
(Tri
assi
c).
Petrographic description:!/
Evid
ent
wood s
tructure.
Moderate
amou
nt of
res
inou
s ce
ll c
onte
nts.
Dark o
paqu
e areas
alon
g cr
acks
and
as smal
l sp
hero
ids
arou
nd d
issemi
nate
d py
riti
c (?)
nucl
ei.
Collection s
ite:
J. J
8 mi
ne,
San
Mlguel C
ounty, Colo., T.
^6
N., R. 10
2 E.
Field
desc
ript
ions
Sample
of o
ne or p
ossibly
two
coalified
logs
fr
om min
eral
ized
lower sand.
Salt
Was
h sa
ndst
one
member of
th
e
Morr
ison
formation (Jurassic).
Petr
ogra
phie
de
scri
ptio
nsi/
Ev
iden
t wo
od s
tructure*
Cont
ains
areas
of
abrupt t
rans
ition
to op
aque
or
ganic
matt
er,
and
dark
enin
g around s
ome
rays
and
smal
l sp
hero
ids
asso
ciat
ed
with di
ssem
inat
ed pyritic (?
) mineral,,
-

Tabl
e 1
0—-D
escr
ipti
on o
f co
alif
ied
-woo
d specimens from the
Col
orad
o*Pl
atea
ue--C
onti
nued
,
Description
Collection s
ite:
Vana
dium
Kin
g No.
7 mine,
north
adit,
midd
le w
orki
ngs,
Te
mple
Mountain, Sa
n Ra
fael
Swell,
Emer
y County,
Utah,
Field
description:
Coal
ifie
d log
cont
aini
ng much py
rite
and
other m
iner
als
and
surrounded by ha
lo o
f bl
ack
impregnation i
n sa
nd hav
ing
a faint
appe
aran
ce of banding
0 Sample 2
to 3
feet
abov
e base of mem
ber an
d 15
0 feet in
from adit o
n we
st f
ace
just southwest
of t
he airhole.
Moss
Back
memb
er o
f Ch
inle
for
mati
on (Triassic),
Petrographic description:!/
No h
isto
logi
c structure.
Consists
principally
of o
paqu
e orga
nic matter w
ith
smal
ler
areas
of h
omog
eneo
us red-translucent
orga
nic
matter*
A
few
isolated,
tran
sluc
ent
ovoid bo
dies
, similar
to t
hose in
sample
DD=2
, bu
t la
ckin
g any or
gani
zed
grou
ping
,s
are
present
in t
he dense
matr
ix.
The
transition between o
paqu
e and
tran
sluc
ent
area
s is
fa
irly
abrupt and
the
contact
has
a colloidal, di
ffus
ion-
type
(b
otry
oida
l ?) outline.
Needle-shaped
crystals of
an
opaque
mineral
are preferentially concentrated
in red
tra
nslu
cent
areas.
Collection s
ite;
Pean
ut m
ine,
Mo
ntro
se C
ount
y, Colo., T. 46
N., R.
10
2 E.
Field
description:
Large
samp
le
of c
oali
fied
woo
d.
Low-
grad
e ore
just a
bove a
nd below s
ample.
Clay
above a
nd bel
ow coa
lifi
ed wood.
Sample 6
inches b
elow top l
ayer of o
re a
nd 26
inch
es ab
ove bottom l
ayer
* Mo
rris
on f
orma
tion
(Jurassic).
Petr
ogra
phic de
scri
ptio
n:I/
Evid
ent wood s
tructure,
mode
rate
amo
unt
of r
esinous
cell c
onte
nts.
Sh
ows
a
little disseminated pyr
itic
mineral and
ver
y little darkening
of o
rganic m
aterial.
Collection s
ites
Virg
in No.
5
mine
, Mo
ntro
se C
ount
y, Co
lo.,
sec. 21
, T, 29 S
., R.
10
1 W.
Field
desc
ript
ions
Coal
ifie
d lo
g from roof
of mine
0 Morrison for
mati
on (J
uras
sic)
, Pe
trog
raphic de
scri
ptio
n:!/
Evident wo
od
structure,,
No min
eral
s noted.

Table
1.--
Desc
ription
of c
oalified wood-
spec
imen
s from the
Colorado Pla
teau
»=-C
onti
nued
.*
Sample
_
...
numb
er
Description
EAB9C-1
Sample A
W-8-5^
collected by
Ali
ce W
eeks
in
the Corvusite
mine
, Gr
and
County,
Utahc
Samp
le is a
large
tree,
Brus
hy Bas
in s
hale
member
of Morri
son
formation
(Jurassic)*
(0.9^
g)
LAB9C-
2 Se
cond s
peci
men
from
AW-
8-5^
. (3
.04
g)
LAB9
C-J*-
Third sp
ecim
en fro
m AW=8-5&
0 This sa
mple
(separately-numbered AW-
10-5
^) is
a very bla
ck s
hiny
portion o
f
the
tree.
(k.k
Q g)
LAB9C-5
Fourth sp
ecim
en f
rom A¥=8=5^»
This
sa
mple
of
the co
alif
ied
-wood
-was
very har
d and
light br
own
when g
roun
d8
(Approximately 3
g)
LAB9C-6
Fift
h sp
ecim
en from
A1fi~Q-5k»
Coalif
ied wo
od was
dark bro
wn when
ground.
(1.6
3 g)
EAB9C-3
Samp
le of c
oali
fied
woo
d co
llec
ted by Ali
ce W
eeks (AW=T3=5^) in
the
Camp Bi
rd No
e 7 mine,
Emery
Coun
ty,
Utah,
Mate
rial
was
black, de
nse,
had
a co
ncho
idal
fra
ctur
e, and em
itte
d a very sulfurous od
or whe
n gr
ound
c This
sample was
similar
to KF
-1.
Chinle
formation
(Tri
assi
c),
(2.1
3 g)
EAB9C-8
Sample of pyr
ite-
bear
ing
coal
ifie
d wo
od fro
m Rex
NO.
1 mine,
Temp
le M
ountain,
Emery
County,
UtaJi.
Sulfurous
odor (no
t Hs
S) emitted
on g
rind
ing.
Moss B
ack me
mber
of
Chi
nle
form
atio
n (T
riassic)
B (Approximately 3
g)
L&B9C-12
Second
samp
le fro
m Rex
No.
1 mi
ne,
Mate
rial
da
rk bro
wn,
wood
y, and
soft.
(2.03
g)
EAB9
C-13
Th
ird
samp
le from Rex N
o0 1
mine
. Black
to dark bro
wn,
brit
tle,
coalifiad
wood
. (Q
eQk
g)
EAB9€=
15 Fourth
samp
le from Rex N
o. 1 mine*
Sing
le piece
of c
oalified wood
grading
from s
oft brown
to n
early brittle
black ma
terial.
No odor on
gri
ndin
g,
(le^-1 g
)
Table
1 ̂-D
escr
iption o
f eo
alif
ied wo
od spe
cime
ns f
rom
the
Colorado P
late"au
0=«Conti
niie
de
SamP
le
Description
number
IAB9C~l6
Fift
h sa
mple fr
om Rex N
o. 1 mi
ne.
Small pi
ece
of ver
y ds,rk brown
coalified wood emi
ttin
g no
od
or w
hen
grou
nd.
(2 g)
IAB9C-
17
Sixth
samp
le from Rex N
o, 1 mi
ne.
Very bright
shin
y bl
ack
coal.
Brittle
and
emit
ting
pec
ulia
r od
or
when g
round.
(0*35
g)
IAB9
C-18
Se
vent
h sa
mple fr
om Rex N
o. 1 mi
ne.
Dull dark-brown c
oalified woo
d.
Pecu
liar
odor whe
n gr
ound
, (l g
):
IAB9C-9
Coalified wo
od from Ut
ex m
ine, Sa
n Juan C
ounty, Utah*
Blac
k and
toug
h, but
no od
or on
gri
ndin
g.
Small
films
of ca
lcit
e removed.
Chin
e fo
rmat
ion
(Tri
assi
c).
(1,12
g)
IAB9
C-10
Coalified wo
od f
rom Ha
ppy Ja
ck m
ine, San
Juan
County, Utah.
Blac
k, sh
iny, and br
ittl
e*
Slight sulfurous
odor
on
gri
ndin
g.
Shin
arum
p me
mber
of
the
Ch
inle
fo
rmat
ion
(Triassic),
(1*56
g)
LAB9
C-19
Woody ma
terial from t
he A
» E»
C.
No
. k
mine
, Te
mple
Mo
untain,
Emery
County,
Utah,
Smal
l am
ount
of
shiny,
conc
hoid
al coal a
ssociated with
woody material.
Moss
Back
memb
er of
Chi
nle
form
atio
n (T
rias
sic)
.
(0,8
8 g)
IAB9C-
20
Woody ma
terial
fro
m, the
Virgin N
o. 3
mine
,. Mon
tros
e County,
Colo,
Dark brown
5 no od
or on
gri
ndin
g.
Morrison f
ormation (Jurassic).
(1,03
g)
IAB9C=22
Coalified wood f
rom Rex No
» 2 mi
ne,
Temp
le M
ountain, Emery
County,
Utah,
Dark
bro
wn and odoriferous when
grou
nd.
Moss B
ack
member of
Chi
nle
formation
(Tri
assi
c).
(2.71
g)
I&B9C=25
Coalified wood c
ollected by Al
ice
Week
s (A
W=6l
=5^)
from Lucky Str
ike
mine
, Emary County,
Utah
. Ch
inle
form
atio
n (Triassic).
Tabl
e 1.
-^D
escr
ipti
on o
f coalified wo
od specimens from the
Go
lora
do '
Plateau »- -Co
ntinued,
? De
scri
ptio
nnu
mber
*
Coalified wood from Rex
NOe
1 mi
ne,
Temp
le Mo
unta
in,
Emer
y Co
unty
, Utah.
Moss B
ack me
mber
of
Chinle
formation
(Triassic)*2/
AW-1
6-52A
Brown
coalif
ied wood from
the
Corv
usit
e mine,
Grand
Coun
ty,
Utah
. Brushy Basin s
hale m
ember
of
Morrison f
orma
tion
( Jur
assi
c ).
2/
AW-1
6-52
B Da
rk-b
rown c
oalified woo
d from abo
ve sa
mple
.£/
A¥-l
6~52
G Bl
ack,
br
ittl
e co
alif
ied wo
od from
above
sample.
Samp
le A
W-16-52
was
a sm
all plant
fragment,
.abo
ut
2 in
ches
long.2/
AW-l
8~52
Coalified wood from
the
Corvusit
e mi
ne,
Grand
County,
Utah.£/
I/
Petr
ogra
phic
st
udie
s ma
de b
y James
M. Schopf,
U. S^ Geological S
urve
y, Co
lumb
us,
Ohio
*
2/
Irving A,
Breger a
nd Mau
rice
De
ul,
U, S.
Geological S
urve
y, wr
itte
n communicat
ion, 19
55'

14
OJable 2.— Analysis of coalified wood sample RF-1 from the Colorado Plateau.!/
Proximate analysisMoistureVolatile matterFixed carbonAsh
Ultimate analysisHydrogenCarbonMtrogenOxygenSulfurAsh
Forms of sulfurSulfatePyriticOrganic
As received (percent )
1*554.643.40.5
7.679*40.47.64.50.5
0.020,054,46
Moisture-free (percent)
_«55.544.00.5
7*580.60.46.44.60.5
0.020.054 0 52
Moisture- and ash-free (percent)
—55-744.3
C3»M
7.581.00.46.54.6--
0.020.054.55
British thermal units 15,550 15,780
I/ Analysis by U. S. Bureau of Mines, Lab. no. E-93074, December 13, 1955•
15
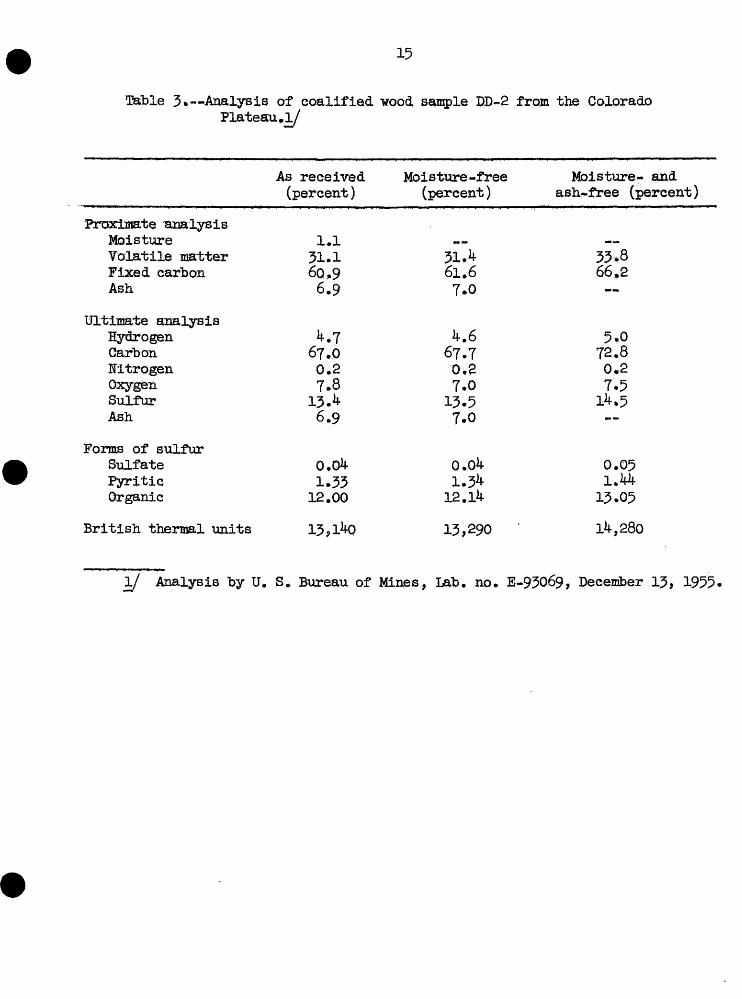
Table 3.—Analysis of coalified nood, sample DD-2 from the Colorado Plateau,!/
PrEsdasate analysisMoistureVolatile matterFixed carbonAsh
Ultimate analysisHydrogenCarbonNitrogenOxygenSulfurAsh
Forms of sulfurSulfatePyriticOrganic
British thermal units
AS received (percent )
1.131.16o,96.9
*.767.00.27.8
13.*6.9
0,0^1.3312.00
13,1^0
Moisture -free (percent )
— »3lA61.67.0
k.667.70.27.0
13.57.0
O.C&1.3^
12. ill-
13,290 "
Moisture- and ash-free (percent)
.»33*866,2—
5.072.80*27.5
1^.5—
0.05l.Mf
13.05
1^,280
I/ Analysis by U. S. Bureau of Mines, Lab. no. 5-93069, December 13, 1955-

16
Table 4,—Analysis of coalified wood sample DD~3 from the Colorado Flateau.l/
As received Moisture-free Moisture- and (percent) (percent) ash-free (percent)
1.360.2 6l*0 61.7 3T.4 37-9 38.31.1 1.1
6,9 6.8*U1 82.1p.4 0.^ 0.48.4 7.5 7-62,1 2,1 2.11.1 1.1
0.03 0.030.11 0,111.96 1.98
British thermal units 15,330 15,530 15,700
Proximate analysis
Ultimate analysis
I/ Analysis by U. S. Bureau of Mines, Lab, no. E-93070, December 13, 1955

17
Table 5.— Analysis of coalified wood sample P-l from the Colorado Plateau,!/
Proximate analysisMoistureVolatile matterFixed carbonAsh
Ultimate analysisHydrogenCarbonNitrogenOxygenSulfurAsh
Forms of sulfurSulfatePyriticOrganic
As received (percent)
1.854.742.01.5
6,580.10.510.80.81.5
0.40.150.65
Moisture -free (percent )
«...55.742.71.6
6.48l 0 60.59.50.81.6
0.40.160.64
Moisture « and ash-free (percent)
=,«.56.645.4.»
6.582.90.49.40.8—
0.40.160.65
British thermal units 14,820 15,090 15,550
I/ Analysis by U, S. Bureau of Mines, Lab. no. E-95075, December 15, 1955-

18
Table 6.--Analysis of coalified wood sample AG-1 from the Colorado Plateau.!/
Proximate analysisMoistureVolatile matterFixed carbonAsh
Ultimate analysisHydrogenCarbonNitrogenOxygenSulfurAsh
Forms of sulfurSulfatePyritieOrganic
As received (percent )
4.248.144.73.0
6.069.60.219.81.43oO
0.510.1?0.69
Moisture -free (percent )
=,_50.246.73.1
5.872.70.316.71.43.1
0.540.180.72
Moisture- and ash-free (percent)
— ~51.848.2—
6.075.00.317.21.5—
0.550.180.74
British thermal units 12,690 13,250 13,680
I/ Analysis by U. S. Bureau of Mines, Lab. no. E-93068, December 13, 1955.

19
Table 7.—Analysis of coalified wood sample JJ-2 from the Colorado Plateau.I/
Proximate analysisMoistureVolatile matterFixed carbonAsh
Ultimate analysisHydrogenCarbonHitrogenOxygenSulfurAsh
Forms of sulfurSulfatePyriticOrganic
As received (percent )
1.738.853.26.3
5.776.90.38.91.96.3
0.060.711.10
Moisture -free (percent )
__39.554.16.4
5.678.3-0.37.51.96.4
0.060.721.11
Moisture- and ash-free (percent)
__42.257.8—
6,083.60,48.02.0—
0.070.771.19
British thermal units 14,150 14,440 15,380
I/ Analysis by U, S. Bureau of Mines, Lab. no. E-93072, December 13, 1955.

20
Table 8,—Analysis of coalified wood sample SF-1 from the Colorado Tlateau.O/
Proximate analysisMoistureVolatile matterFixed carbonAsh
Ultimate analysisHydrogenCarbonNitrogenOxygenSulfurAsh
Forms of sulfurSulfatePyriticOrganic
As received (percent )
9.920.953.515-7
3.555.50.418.56.4
15*7
0.735.190.46
Moisture-free (percent )
~_23.259.417.4
2.761.60.4
10.87.1
17.4
0.8l5.760.51
Moisture- and ash-free (percent)
—28.072.0—
3.274,60.513.18*6—
0.986.970.62
British thermal units 9,520 10,560 12,790
I/ Analysis by U. S. Bureau of Mines, Lab, no. E-93075, December l4, 1955,

21
Table 9»—Analysis of coalified wood sample NA°1 from the Colorado Plateau.I/
Proximate analysisMoistureVolatile matterFixed carbonAsh
Ultimate analysisHydrogenCarbonlitrogenOxygenSulfurAsh
Forms of sulfurSulfatePyriticOrganic
British thermal units
As received (percent )
2.223.155-319.4
3.561.30.27.38.319.4
0.061.446.77
11,060
Moisture -free (percent )
__23.656.619.8
3.362.60.25.78.419.8
0.061.476.92
11,310
Moisture- and ash-free (pereent)
•
-„29.570*5—
4.278.10.36.9
10.5—
0.071.838.63
14,100
I./ Analysis by U. S. Bureau of Mines, Lab. no. B-93071, December 13, 1955*

22
Table 10.-*-Analysis of coalified wood, sample V-l from the Colorado Plateau.
Proximate analysisMoistureVolatile matterFixed carbonAsh
Ultimate analysisHydrogenCarbonHitrogenOxygenSulfurAsh
Forms of sulfurSulfsrbePyriticOrganic
As received (percent )
2.45^.54i.j1.8
6.578.30,412.20.81.8
0.50.140.65
Moisture -free (percent )
£._•
55.842.4:U8
6.480.20.410.30.91.8
0.60.140.66
Moisture- and ash- free ( percent )
_..56.943.1—
6.581.70.410.50.9—
0,60.150.67
British thermal units 14,250 14,600 14,860
I/ Analysis by U. S. Bureau of Mines, Lab. no. E-93076, December l4, 1955.

Table 11.—Analysis of coalified wood sample MD42B-3 from the Colorado Plateau*!/
Proximate analysisMoistureVolatile matterFixed carbonAsh
Ultimate analysisHydrogenCarbonlitrogenOxygenSulfurAsh
Forms of sulfurSulfatePyriticOrganic
As received (percent )
2.624.250.922.3
3.356.80.18.98.6
22.3
0.0?1.Q47.45
Moisture -free (percent )
•»••24.852.322.9
3*158,30*16.88.822.9
0.071.077.65
Moisture- and asjx~free (percent)
_..32,267.8=•-
4.075-60.28.811.4=,-
0.091.399.92
British thermal units 10,480
I/ Analysis by U..S, Bureau of Mines, Lab. no. £-61765,, January 26, 1955

24
Table 12«,--Analyses for plant debris from the Colorado Plateau (in percent)„
Sample
RP-1DD~2DB-3SP-1AG-1JJ-2NA-1P-lV-lIAB9C-1IAB9C-2IAB9G~4IAB9C-5IAB9O--6.IAB9C=5iAB9G»8IAB9C-12IAB9C-15IAB9C=>15IAB9C=l6IAB9C=17IAB9C-18IAB9C-9IABQC=10IAB9C-19IAB9C^20IAB9C-22IAB9C-25MD42B=5AW=l6-52AAW-l6=52BAW-16-52CAW-18-52
Ash 1,5/
0.57oOlol
I7o45.16.4
19 081.61.82.7^«59o5loO
5.112,64o.95-3Io44.29.1
I2o51.32 0 2^.55.60.84 0 4
20 0822,93oOOo6422.513.1
Carbon 2,J/
8l 0 072 0 885.074o675oO85o678 0 182.981.779o579d83.282.685.880.279»572.776 0 47^»782.674.578 0882 0 781,58i e482.68l.O7^575 0682.78lo583.080.1
Hydrogen 2,3/
7»55eO
6 095o26.06.04.26.56.55.96.55^6.86.94.65-76.05-95.96.55.86.15.74.86.66.26,74.44 007o76.74 e 25.8
Uranium in dry sample 4/
0,001 A2*020.018 /5.080.0561.517*51 <Q 0 056 • <0*016 •(-0.500.755.*-0.0450.0517.71.70.001OoOOl0.00520.0145.50,190.191.00.0120.0050.116.91.5k 7,w0,0570.00181 0642 0 28
I/ Dry basis.
£/ Moisture- and ash-free basis.
3/ Analyses by U. S. Bureau of Mines and by E. B. Brittin and R. Meyrowitz, U. S. Geological Survey.
bj Analyses by Roberta Smith, Carmen Johnson, and Jesse Warr, Jr., U 0 S. Geological Survey e
25
DISCUSSION
Nature of the plant debris
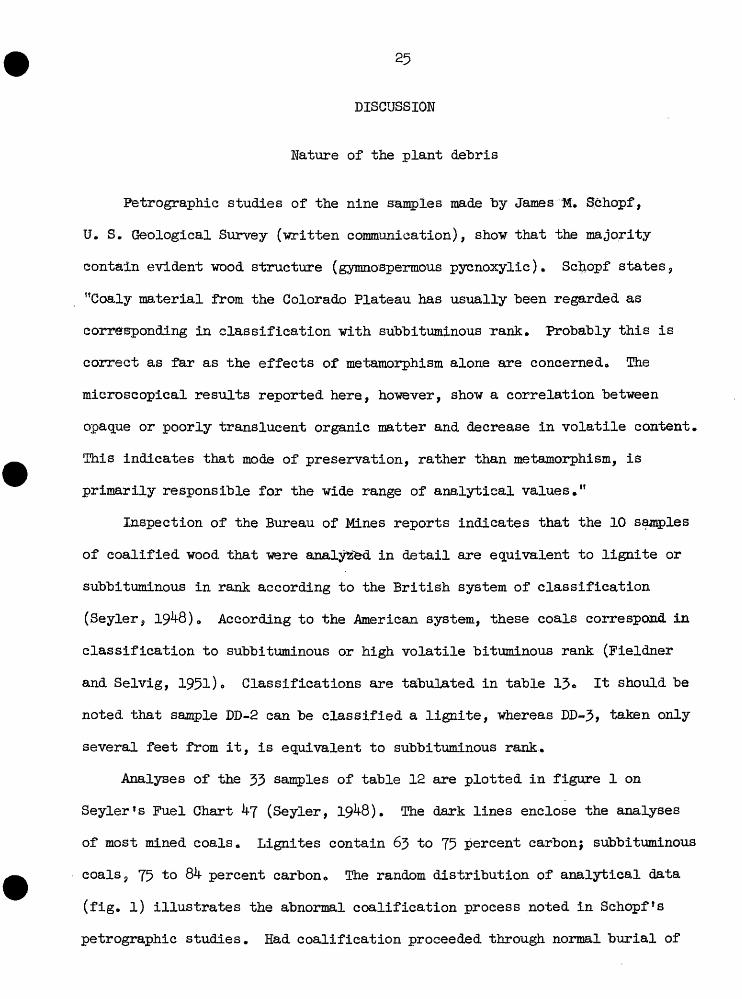
Petrographic studies of the nine samples made by James M. Sehopf,
U. S. Geological Survey (written communication), show that the majority
contain evident wood structure (gymnospermous pycnoxylie), Scfeopf states,
"Coaly material from the Colorado Plateau has usually been regarded as
corresponding in classification with subbituminous rank. T»robably this is
correct as far as the effects of metamorphism alone are concerned. The
microscopical results reported here, however, show a correlation between
opaque or poorly translucent organic matter and decrease in volatile content.
This indicates that mode of preservation, rather than metamorphism, is
primarily responsible for the wide range of analytical values."
Inspection of the Bureau of Mines reports indicates that the 10 samples
of coalified wood that were analysse-d in detail are equivalent to lignite or
subbituminous in rank according to the British system of classification
(Seyler, 19^8). According to the American system, these coals correspond in
classification to subbituminous or high volatile bituminous rank (Fieldner
and Selvig, 1951)« Classifications are tabulated in table 1% It should be
noted that sample DD-2 can be classified a lignite, whereas DD-3» taken only
several feet from it, is equivalent to subbituminous rank.
Analyses of the 33 samples of table 12 are plotted in figure 1 on
Seyler ! s Fuel Chart 4j (Seyler, 19^8). The dark lines enclose the analyses
of most mined coals. Lignites contain 63 to 75 percent carbon; subbituminous
coals, 75 to 84 percent carbon* The random distribution of analytical <3ata
(fig. l) illustrates the abnormal coalification process noted in Sehopf's
petrographic studies. Had coalification proceeded through normal burial of

26
Table 13.--Equivalent classification of samples of coalified wood,
Rank correspondenceSample . . ,
British I/ American .2/
KF«1 Subbituminous High volatile A bituminous
BD-2 Lignite High volatile B bituminous
DD-3 Subbituminous High volatile A bituminous
SF-1 Lignite Subbituminous B
AG-1 Subbituminous High volatile C bituminous
JJ-2 Subbituminous Hijgh volatile A bituminous
NA-1 Subbituminous Medium volatile bituminous
P=l Subbituminous High volatile A bituminous
V-l Subbituminous High volatile A bituminous
5 Subbituminous Subbituminous B
],/ Based on Seyler
2/ Values for bed moisture not known. Equivalent rank^ therefore , is based on "as received" value,
wood in a swamp environment, most analytical points would be expected to fall
within or close to the normal coal curve. Low hydrogen values for a number of
samples plotted in figures 1 and 2 may be related to uranium content of the
coalified wood. This point is discussed in another section of this paper.
Variations in coalification for the same specimen and within the same mine
are shown in figure 2, Three samples from the Corvusite mine range in carbon
content from about 79 to 83 percent. One of these three samples was divided
into three segments, individual analyses for which are shown. Samples from

to9.
01-
•d
7.0 -
S 6.0
-•p CQ
•H ft
V to
5.0
-
1
3.01
-o Q
)
<b
o o
o
o o
2.0-
1.0
-
0
^ i
i i
I i
i i
i I
i i
i f
o o
I i
i i
i t
i i
i i
I i
t i
i I
i ii
i
100
95
90
85
80
75
70
65
60
Percent
carbon (m
oist
ure-
and ash
-fre
e basis)
7.0-
**s £ 6.0
5.0
•p CO o
5.0 0
O O
*
ro
"o C
orvu
site
mine
(sin
gle
spec
imen
) cf
Cor
vusi
te m
ine
o Co
rvus
ite
mine (s
ingl
e specimen)
* Eex No
> 1 mine
4 Rex No. 2 mi
ne
» i
j .
I i
i t
i t
i i
i i
I i
i i
i I
i \
i i
I i
t i
i I
i i
i i L
100
95
90
85
80
75
70
65
Perc
ent
carbon (moisture- and ash-free
basis)
Figure l»
T-Analyses of
coa
lifi
ed woo
d sa
mple
s fr
om t
he
Colo
rado
Plate
au plo
tted
on
Seyl
er co
al c
hart
0Fi
gure
2.—Variations
in c
oali
fica
tion
wit
h the
same
spec
imen
and wit
hin
the
same
min
e*
28
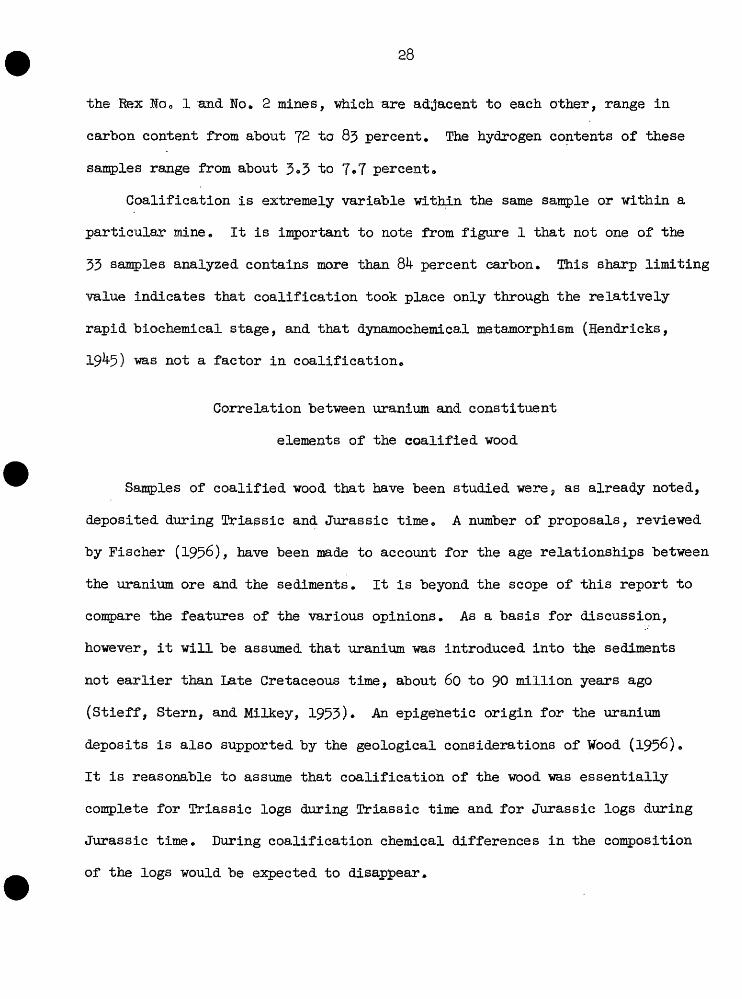
the Rex No» 1 Bud No. 2 mines, -which are adjacent to each other, range in
carbon content from about 72 to 83 percent. The hydrogen contents of these
samples range from about 3«3 to 7«T percent.
Coalification is extremely variable within the same sample or within a
particular mine. It is important to note from figure 1 that not one of the
33 samples analyzed contains more than 84 percent carbon. This sharp limiting
value indicates that coalification took place only through the relatively
rapid biochemical stage, and that dynamochemical metamorphism (Hendricks,
19^5) was not a factor in coalification.
Correlation between uranium and constituent
elements of the coalified wood
Samples of coalified wood that have been studied were, as already noted,
deposited during Triassic and Jurassic time, A number of proposals, reviewed
by Fischer (1956), have been made to account for the age relationships between
the uranium ore and the sediments. It is beyond the scope of this report to
compare the features of the various opinions. As a basis for discussion,
however, it will be assumed that uranium was introduced into the sediments
not earlier than Late Cretaceous time, about 60 to 90 million years ago
(Stieff, Stern, and Milkey, 1953)* An epigehetic origin for the uranium
deposits is also supported by the geological considerations of Wood (195^),
It is reasonable to assume that coalification of the wood was essentially
complete for Triassic logs during Triassic time and for Jurassic logs during
Jurassic time. During coalification chemical differences in the composition
of the logs would be expected to disappear.

29
Data plotted in figure 5 show the relationship between organic carbon and
uranium in the samples of coalified wood* It is evident that, especially as
the uranium differs by nearly four orders of magnitude, there is no dependence
of uranium on carbon content e
When organic hydrogen is plotted against uranium (fig. ^), there is no
apparent relationship for samples containing less than 0.1 percent uranium* As
uranium content rises from 0«1 to 7.5 percent, however, hydrogen seems to
decrease.
The data of figure k are presented on a semilogarithmie plot for conven~
ience. Were the data plotted on a linear diagram, the change in slope at about
0.1 percent uranium would not be apparent. To illustrate this point, the ctata
of figure k have been replotted in the linear diagram of figure 5«> The line
drawn on figure 5 is based on a least-squares calculation on the assumption that
the relationship is linear. If this assumption is correct, then hydrogen
decreases by 0.25 percent for every increase of 1 percent of uranium retained
by the coal.
The relationship between hydrogen and uranium can be explained as arising
from a radiochemical dehydrogenation of the coalified wood by the alpha particles
from uranium and its daughter products. It is well known that high-energy
radiation initiates chain mechanisms that result in the crosslinking of mole
cules (Charlesby and Ross 3 1953)• Dehydrogenation is also a common phenomenon
when organic compounds are irradiated (Breger, 19^8). Aromatic compounds
generally polymerize or condense with a relatively low production of hydrogen.
Inasmuch as coal is basically aromatic in structure, a major radiochemical
product would be polymerized or condensed coal. The natural dehydrogenation of
coal by alpha particles has not been noted before but is suggested from

88
*p d Q) 0) ft o
~oo o
32^
oo
o
o o
o
L .
. .
I
oO O 0
oo
o o
o o
10.0
5.0
1.0
0.5
0.001
Figure 3.
—Rel
atio
nshi
p of
org
anic
ca
rbon
(moisture- a
nd ash-free) to
uranium
in c
oali
fied
wood*

d-
Hydrogen (moisture- and ash-free basis), percent
oo b
CDVO • «OO
B t
O
oH
\
\
\
\\
\
\ \ \
o cX
\
o

o
oo
oro
o
Uran
ium,
percent
Figure %-
~Rel
atio
nshi
p of
organic hydrogen (moisture- and as
h-fr
ee)
to uranium i
n coal
ifie
d wood,
line
ar plot.
Stra
ight
line bas
ed on
a le
ast
squares
calculation
assu
ming
str
aigh
t line r
elat
ions
hip*

33
inspection of figures k and 5* If uranium "was introduced into the sediments in
Late Cretaceous or Tertiary time, then the Trias sic and Jurassic coalified logs
have been subjected to irradiation for approximately the same time,
An inverse uranium-hydrogen relationship should appear throughout the entire
range of values for uranium (O e 001 to 7,7 percent), but it must be remembered
that small percentages of uranium will result in the elimination of minute and
undetectable quantities of hydrogen. Above uranium contents of 0«1 percent,
however, it appears that the loss of hydrogen becomes analytically significant
and the inverse relationship becomes detectable. The scatter of points about
the dashed lines of figure k can be explained in two ways; (l) If the uranium
is not homogeneously dispersed throughout the coal, radiochemical dehydrogenation
would take place only in part of the sample analyzed. Although an attempt was
made to eliminate any such error by taking extremely small samples (approximately
1 to 3 g) of 25 of the specimens analyzed, the effects of a microscopically
inhomogeneous distribution of uranium, since demonstrated by autoradiography,
are difficult to predict and indicate this to be a possible explanation.
(2) Another explanation for the scatter of points in figure k is based on the
variable coalification that the wood samples have undergone. Differences in
hydrogen content are evident in figure 1 and are undoubtedly reflected in figure
^. It is apparent, however, that the secondary effect of radiochemical
dehydrogenation is imposed upon such variations.
Although only 10 samples were large enough for the determination of volatile
content by the Bureau of Mines, the semilogarithmic plot of volatile matter and
uranium (fig. 6) is roughly similar to that for hydrogen and uranium (fig. 4).
The loss of hydrogen from a sample of coalified wood is undoubtedly related to
crosslinking of the coal and to decrease in the volatile constituents produced
when the coal is pyrolyzed during the determination of volatile matter.

s
o
H
Ul
o
O
s
Percent volatile matter (moisture- and ash-free)
S & Q ^ <3 S* £" -^ ^ ^ ^ y \ji o \ji o vn O \ji o vj» oo\ VJ1
H"
o
o

35
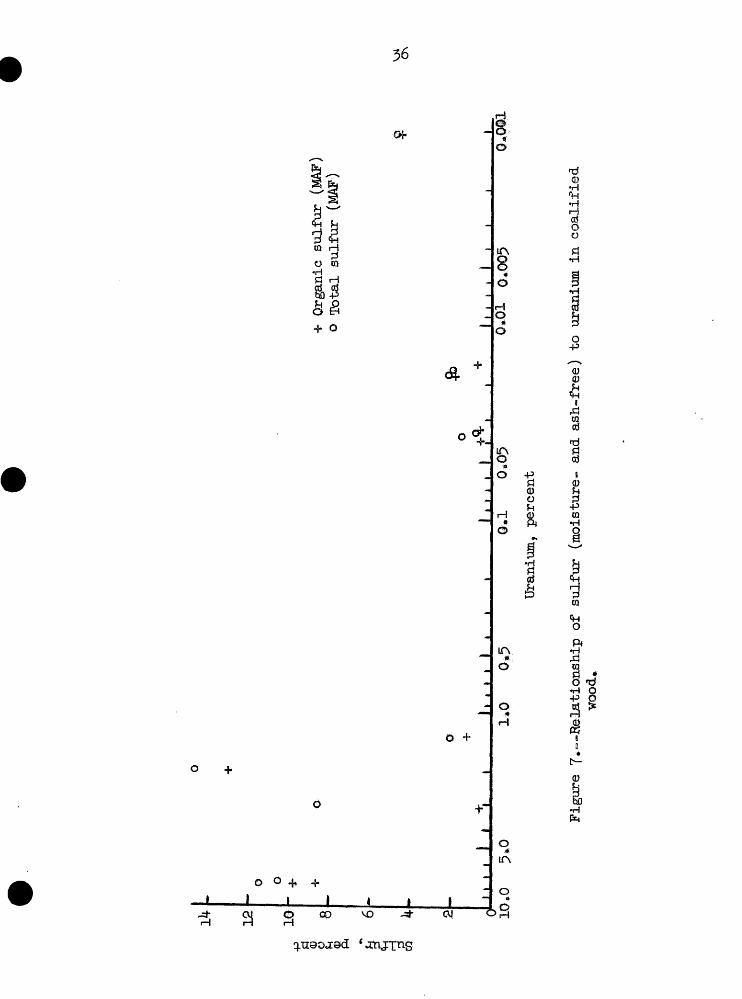
Correlation between sulfur and uranium for the 10 samples of coalified
wood for which data are available is shown in figure 7» Total sulfur rises
abruptly as the uranium content increases above about 2 percent* Organic
sulfur also increases sharply above this value for all samples except SF-1,
which was collected from the Morrison formation, Valencia County, New Mexico*
The limited number of samples provides insufficient basis for any
conclusions regarding the relationship between uranium and organic sulfur»
Sulfur may have become associated with the coalified wood before, during, or
after introduction of uranium.
The occurrence of coalified wood with high organic sulfur content is un
usual and worthy of special note. The high organic sulfur content of sample
MD42B-3 (9-92 percent) has already been observed (I. A. Breger and Maurice Deul,
•written communication, 1955); this amount has now been exceeded by that of
sample DD-2 { 13*05 percent) and nearly equalled in sample NA-1 (8*63 percent).
The Tangorin high organic sulfur seam of Australia (Marshall and Draycott 9
195*0 contains only 4*84 to 4.96 percent organic sulfur, and the Rasa coal of
Istria contains 11 percent (Kreulen, 1952). As far as can be ascertained,
sample DD-2 contains the highest percentage of organic sulfur yet reported for
coal or coalified wood. The organic sulfur of samples DD-2, NA-1, and MD42B-3
may be related to the composition of the ore-bearing fluid and may indicate
that sulfur was introduced along with uranium. Sample SF-1, on the other hand,
comes from a different part of the Colorado Plateau and, although it contains
high total sulfur, has a low organic sulfur content.
Figure 8 shows that the Btu content of the coalified wood decreases
slightly with increasing uranium content (135 Btu per percent U based on a
12o
I ij
^
•p p«
•f Organic
sulf
ur (MAF)
S 8
0)
Pi
o . o
11 j
i
j I
i i
» I
. »
i .
I 7*•
o T
ota
l su
lfur
(MA
F)
1»0
0*5
©.1
0*05
O.*0
1 0*005
0*0§
3-
Uran
ium,
pe
rcen
t
Figu
re 7---Relationship o
f su
lfur
(moisture- and
ash
-fre
e) to
uranium in coalified
wood*

17,000*
16,000
-
15,0
00
12,000
10,000
' ''
' l
o
I ,
iI
i I
> i
I i
I____I
I i
i i
. i
I____L
10.0
5.
00.
1 0.05
Uranium, percent
0*01
0,
005
vx
Figu
re 8.
—Bel
atio
nshi
p "between Btu c
ontent of
coa
lifi
ed woo
d and
its
uran
ium
cont
ent

58
least squares calculation )* !Ehis relationship, as in the ease of hydrogen or
volatile natter, is probably connected with the effects of alpha-particle
radiation on the coal*
Aside from the correlations of uranium with hydrogen, volatile matter, Btu,
and sulfur, no other relationships could be detected from available data,
Figure 9 shows that there is little, if any, correlation between oxygen of the
coalified wood and uranium. Any relationship between uranium and the sum of
oxygen, nitrogen, and total or organic sulfur hardly reflects more than the
correlations between sulfur and uranium shown graphically in figure T« Data for
figures 7 and 9 s-re summarized in table lk m
Correlation of uranium with elements in ash from coalified wood
Semiquantitative spectrographic analysis of the ash from each of the 10
samples of coalified wood was carried out to determine if any clear correlation
could be detected between uranium and any other elements present in the ashes
from the coalified wood (table 15). Because the ash content of sample RF-1 was
small and insufficient material was available for complete analysis, analysis
for this sample was carried out on a 1-mg specimen.
Attempts to correlate various elements with increasing uranium content,
with increasing ash content, or on a geographic basis have met with only partial
or minor success. More apparent relationships may be exposed with the analysis
of additional samples. Hie data of table 15 were compared on an ash- free basis
on the assumption that the elements were inherent to the coalified wood*
Although this assumption may be valid for samples with low ash content, the
assumption may or may not be sound for samples MD24B-3, HA.-1, and SF-1 contain
ing, respectively, 22.9, 19 »8, and 1J.4 percent ash.

39
H cri
ft-p d ra
p ft
rt 8)CQ O
22
20
18
16
12
10
8
>3
"a
- o
» i i i i i i i_____I.... i i i610.0 5.0
o
ii i I
1.0 0.5 0.1 0.05 Uranium, percent
0.01 0.005 0.001
Figure 9.—Relationship between oxygen, (0 + N * total S), or (0 + N + organic S) and uranium for coalified wood.

Table
l4.~
-Dat
a for
the
corr
elat
ion
of o
xygen, ni
trog
en,
and
sulf
ur "
With ura
nium
in
coalified
-wood.
All
figures
in per
cent
, ex
cept
Btu
.
Samp
le
BF-1
DB-2
DD-3
SF-1
AG-1
JJ-2
HA-1
P-l
V-l
M)42B-3
U
0.001
2.02
0,018
3.08
0.036
1*31
7-51
0,036
0.016
7.54
Total
S 4.6
14.5 2,1
8.6
1.5
2.0
10*5 0.8
0.9
11.4
Organic
S
4.55
13*0
5
2*00
0.62
0.74
1.19
8.63
0.65
0.67
9.92
Btu
15,860
14,280
15,700
12,790
13,680
15,380
14,100
15,330
l4?86o
13,6
00
Vola
tile
ma
tter
55-7
33-8
61.7
28.0
51.8
42.2
29-5
56.6
56.9
33*2
c
81.0
72.8
83.0
74.6
75.0
83.6
78.1
82.9
81.7
75^6
H 7.5
5.0
6.9
3.2
6.0
6.0
4.2
6.5
6.5
4.0
0 6.5
7.5
7.6
13.1
17.2 8.0
6.9
9.*
10.5 8.8
N 0.4
0.2
0.4
0.5
0.3
0.4
0.3
0.4
0.4
0.2
0 + N
+ or
gani
c S
11.4
20*8
10.0
14.2
18.2 9.6
15.8
10.5
11.6
18.9
0 + N
+ to
tal
S
11.5
22.2
10*1
21*2
19*0
10.4
17,7
10*6
11.8
20.4
Ash
0.5
7.0
l.l
17.4 3.1
6,4
19.8 1.6
1.8
22,9

Table 15*—Semispflmtitatire spec brographAc smalyBes of ashes from samples of coalified vood from the Colorado Plateau.
Analysts, Iforia Frank and Catherine Y. Sazel, U. S. Geological Survey,
Percent range
Over 10
5-10
1-5
0.5-1.
0,1-0.5
0.05-0.1
0.01=0.05
0.005-0.01
0.001-0.005
0.0005-0.0010.0001-0.0005
Ash, percent
KF-1
Si V
„_
Hi Mg Ca Al Fe
K U
Na B Ti Ma
Cu Jfo
0.5
DD-2
U
Fe
Si Zn Pb
Ca
Ti Al Y
Mo Hi Co
V Ma Ba B Mg Yb Sr
Zr Ga Cu Bi Sc La
Cr
—
Be
7.0
DD-3
Si
Ti
U Fe Ca 2n Al
K V MgHa
Ge Ba
Mo B Sr Cu Pb
m Hi Co Y Cr
Zr Ga
La Yb Sn
—
Be
1.1
SF-1
U Si
Fe
—
Y Ca
AllfD Pb
-.
Sr 1% Co Yb Cu Ma V Ti B
Ga Ni
La Cr Zr Ba Sc Sn
..
— .
1?A
AG-1
Fe
. K
Na U Si Ti
Al % Ca
V Zn Mo Co
Fb
Cu Hi Sr Mn Y Ge B
Ba Cr
Ga Zr Yb Sc Sn
—
Be
3.1
JJ-2
V
U V Si 1i|
Fe K Ca
Al Ha Eg Pb
Ba
.-
Sr Ti Cu Mb B Co
Ga IB Y Ifc Ni
Cr Zr
Yb
..
6.k
NA-1
u v
Si
Fe Ca Pb
Al Zn K
—
Ti Co
Ba Jfo B Cu Sr Cr
Y Mg Ga Bi
Zr
' Yb
Be
: 19.8
P-l
Fe
Si
Ca Ha Mg U Ba
K Al
Y Ti
Pb Cu Sar Zr
Mn B Mo V Zn
Yb Hi
Co Ga Cr Ge Sn 0c
_-
Be
1.6
V~l
Fe
Si
Ca 1%
Al U K Ba
Y Ha Zr Ti
Mn B CU
Sr Pb V Ge MD Hi
Yb Co Cr
Ga Sn Sc
—
—
1.8
MD^2B-3 I/
U V
.-
Si Pb Ca
Al Fe
Zn
Ba Hd La Cu
B Ti Y Mg Mn
Sr Co Dy
Cr Ag Sc Zr
..
Be
22.9
<#*!•
m
I/ In the spectrographic analyses: Na obscured by high Sn; K obscured by high U| and Yb obscured by high V,

It]

Comparison of data for ash from relatively uraniferous and nozruraniferous
samples from the same mine was carried out in a further attempt to determine if
introduction of uranium was accompanied "by the absorption of particular elements
from the ore-bearing fluid by the coal substance * !Hie following observations
were made for samples DD-2 and DD-3"
(1) The uraniferous coalified wood contains appreciable concentrations
over the relatively nonuraniferous coal of U, Fb, Y, Xb, Fe, Hi, La, and Co«
(2) The coalified wood with the higher percentage of uranium may contain a
concentration of Mn, Zn, Zr, Ga, and Mo.
(3) Uraniferous coalified wood is not enriched in Si, Ca, Ti, Al, ¥, Ba,
B, Mg? Sr, Cu, or Cr.
These observations may not be the same as those noted for organic-free
sandstone deposits (E. M* Shoemaker, A. T. Miesch, W. L» Newman, and L* B» Riley,
written communication), inasmuch as the coalified wood presents an unusual
environment conducive to the absorption of only certain elements from the ore-
bearing fluid* Although no conclusions can be drawn from this single set of
analyses, the data provide a guide for further studies,
Autoradiographic studies
Polished sections of three uranium~bearing coalified logs (JJ-2, DD-2, and
KA-l) have been studied to determine the distribution of radioactivity. The
technique used was that developed by Stieff and Stern (I952)o
Sample JJ-2; Although alpha-particle tracks are well distributed through
out the specimen, there are zones of both high and relatively low concentrations
of alpha-particle tracks. High track concentrations seem to follow straight
or curved paths and may indicate that uranium in solution penetrated the

eoalif ied wood preferentially along microscopic fractures. There is no evidence
of specific mineral masses from which the alpha-particle tracks selectively
emanate* This point is of particular interest indicating that eoffinite, which
occurs in the sample (table l6), must be eolloidsally dispersed.
Sample HA-ls !Ehis sample (7.5 percent uranium) has been shown to contain
uraninite (table 16). The alpha-particle track density in the stripping film is
very high but, as in the case of sample JJ-2, the distribution of tracks
indicates colloidal dispersion of the mineral.
Sample DD-2s This sample (2.0 percent uranium) has been shown to contain
pyrite and a mineral having a cubic lattice with ao = 5.^1 A. There is little
doubt that this mineral is uraninite. On examination, the polished section was
found to have a narrow mineralized zone containing, as identified by R. G.
Goleman of the U. S. Geological Survey (personal communication), pyrite and
galena as the most abundant minerals along with sphalerite and native arsenic (?).
Although the organic material on either side of and in immediate contact with
this mineralized zone apparently contains relatively little uranium as evidenced
by a lack of alpha-particle tracks, the density of tracks rapidly rises to a
maximum and then gradually decreases as shown in figure 10. As in the previous
two samples, the tracks in this sample indicate colloidal dispersion of any
uranium mineral present, assuming emanation of the tracks from such a mineral.
The observations that concentrations of alpha-particle tracks occur along
straight or curved paths suggest that a uranium-bearing fluid entered the
eoalif ied wood along zones (possibly fracture zones) on either side of which
maximum absorption of uranium occurred (fig. 10). These fractures may be too
small to be seen or may have been healed during or after introduction of uranium
as a result of plastic flow of the coal, Such plastic flow has been observed

by E. A. Scott of the U. S. Geological Survey (personal communication) in his
studies of coalified and silicified logs from the Colorado Plateau.
It cannot be determined whether the arsenic and mineral~forming elements
of the pyrite, galena, and sphalerite entered sample DD-2 prior to or after
introduction of uranium* Scarcity of alpha-particle tracks along the fracture
zone in "which these minerals occur, however, suggests that they were formed
subsequent to the introduction of uranium* If uranium entered the coalified
wood by way of such fractures, then it would be reasonable to expect the highest
concentration of alpha-particle tracks at the boundaries of a fracture zone, and
diffusion of uranium to lower concentrations within the coal substance where
permeability to the uranium-bearing solution was lower.
Table 16.—X-ray diffraction analyses of several samples of coalified wood.
Uranium in coalified wood Sample __ (percent)
DD-2 2*0 Pyrite plus a cubic pattern witha0 * 5.^1 A
SF-1 3*1
JJ-2 1,3
NA-1 7.5
2./ Analyst, Evelyn Cisney, U. S. Geological Survey.

Figure 10.—Concentration of alpha-particle tracks about fracture zone in autoradiographic study of sample DD-2 (diagrammatic).

OF URAHIUM
Distribution of uraniiim in the several sections of eoalified -wood that have
been studied suggests that the element was initially introduced in a solution
•that followed paths of least resistance, namely, fracture zones. Previously
reported studies of uranium-bearing coals from Ssmrfcli Dakota (Breger, Deul and
Rubinstein, 1955) and Wyoming (Breger, Deul, and Msyrowitz, 1955) showed that
the uranium was probably retained in a complex of organo-uranium compounds soluble
below a pH of about 2.2. It is reasonable to expect absorption of uranium from
the mineralizing fluid in the form of similar compounds in the cotslified wood
of the Plateau. Furthermore, it has been suggested in the case of the coal from
Wyoming (Breger, Deul, and Meyrowitz, 1955) "that uranium traveled in the form
of alkaline or alkaline earth uranyl carbonate complexes. Studies of impregnated
sandstones ("uraniferous asphaltites") and other sandstones from the Plateau by
Waters and Granger (1953) and by Fischer, Gruner, Stieff, and Stern, the author,
and others (personal communication) have invariably led to the conclusion that
mineralization was accompanied by solution of quartz grains as evidenced by the
occurrence of re-entrant and filamentous structure, an observation that provides
evidence for an alkaline mineralizing solution. The similarity between absorp
tion of uranium from mineralizing fluid by massive coal beds in Wyoming or by
coalified wood in the Colorado Plateau area is striking*
The occurrence of uraninite or coffinite in coalified wood from the Plateau
indicates that, after absorption, conditions in the plateau area were conducive
to reduction of the uranyl ion* If uranium were initially introduced into the
coalified wood of the Colorado Plateau in the form of the uranyl ion, the
presence of uraninite or coffinite indicates that, following absorption, the

uranyl ion "was reduced. The rapid reduction of the uranyl ion "by lignite in
the laboratory at elevated temperature (150° C) has been demonstrated
(I. A. Breger and R* T. Moore, -written communication, 1955)«
The general distribution of alpha-particle tracks in specimens of coalified
wood known to contain uraninite or coffinite indicates that these minerals are
probably colloidally dispersed and present at sites where uranyl ions were
originally absorbed. Had reduction of the uranyl ion to insoluble uranium
minerals occurred simultaneously with its introduction, dispersion of uranium
throughout the coal would probably have been prevented.
The studies outlined in this preliminary report are not yet complete 5
sufficient data have been accumulated, however, to indicate trends. The
importance of coalified wood as a precipitant for uranium on the Colorado
Plateau makes it desirable to present available data and suggestions prior
to completion of the work.
The conclusions that have been reached on the basis of these studies are
outlined be low;
(1) Composition of coalified wood is dependent upon environment of burial*
Both mineralized and unmineralized specimens have been found in which all traces
of cellular structure are absent.
(2) Distribution of radioactivity is dispersed throughout the coalified
wood, but concentrations of alpha-particle tracks along zones suggest that the
uranium-bearing fluid entered the coalified wood through paths of least
resistance—probably fracture zones,
(3) Conditions for the introduction of uranium and its retention by
coalified wood seem to be geochemically similar to those that resulted in the

formation of uraniferous coals of the Bakotas and Wyoming. Uranium is thought
to have first been absorbed and then to have been reduced,
(4) Samples of coalified wood containing more than one percent of ura
nium also contain Inordinately high percentages of organic sulfur*
(5) High uranium contents are accompanied by decreases in organic hydro
gen, volatile content, and Btu values for the coalified wood. Dehydrogenation
"by alpha-particle bombardment is thought to lead to these changes,
(6) There is no correlation of uranium with organic carbon.
Insufficient data have been accumulated with which to relate uranium to
minor elements in coalified wood* *
LITERATURE CITED
Boutwell, J. M,, 1904, Vanadium and uranium in southeastern Utahs U. S» Geol. Survey Bull. 260, p, 200-210.
Breger, !„ A., 1948, Transformation of organic substances by alpha particles and deuteronss Jour* Physical Colloid Chemistry, v, 52, p« 551-563»
Breger, I. A», Deul, M., and Meyrowitz, R., 1955, Geochemistry and mineralogy of a uraniferous subbituminous coal: ECon* Geology, v. 50, p. 610-624,
Breger, I. A,, Deul, M.*, and Rubinstein, S,, 1955, Geochemistry and mineralogy of a uraniferous lignites Econ, Geology, v. 50, p. 206-226,
Charlesby, A*, and Ross, M., 1953, The effect of cross-linking on the density and melting of Polythenes Proc. Royal Soc», (London) Ser* A, v. 217, p. 122-135o
Fieldner, A. C., and Selvig, ¥. A., 1951, Methods of analyzing coal and cokes U. S. Bur. Mines Bull* ^92, p. 31*
Fischer, R. P,, 1956, Uranium-vanadium-copper deposits on the ColoradoPlateaus Proc. Internat* Conf, on the Peaceful Uses of Atomic Energy, Geneva, 1955, v. 6, p. 605-6l4; U. S. Geol. Survey Prof* Paper 300, p. 143=151.
Hendricks, T, A*, 19^5, The origin of coalj in Chemistry of coal utilization, H. H. Lowry, ed», v* Is Hew York, John Wiley & Sons, Inc., p. l4.

Hess, F. L., 1933 > Uranium, •vanadium, radium, gold, silver, and molybdenum sedimentary deposits, in Ore deposits of the western states (14-ndgren Volume): New York, Am. Inst. Min. Ms tall* Eng,, p. 455,
Kreulen, D. J. W., 1952, Sulphur coal of Istria: Fuel, v. 31, p. 462-467.
McKay, E. J«, 1955> Criteria for outlining areas favorable for uraniumdeposits in parts of Colorado and Utah: U, S. Geol. Survey Bull. 1009-J» p, 265-282.
Marshall, C. E., and Draycott, A,, 1954, Petrographic, chemical, andutilization studies of the Tangorin high organic sulfur seam, Greta Coal Measures, New South Wales; Memoir 1954/1, Univ. of Sydaey, Dept. of Geology and Geophysics, p» 1-66.
Seyler, C. A., 1948, The past and future of coal--the contribution ofpetrology: South Wales Inst. Eng. Proc., v. 63, no* 3, P« 213-243.
Stieff, L. R., and Stern, T. W*, 1952, Preparation of nuclear-track plates and stripping films for the study of radioactive minerals: Am* Mineralogist, v. 37, P. 184-196,
Stieff, L. R., Stern, T. W,, and Milkey, R. G., 1953, A preliminary determi nation of the age of some uranium ores of the Colorado Plateau by the lead"Uranium method; U. S» Geol* Survey Circ. 271, 19 P*
Waters, A. C», and Granger, H. C., 1953, Volcanic debris in uraniferoussandstones and its possible bearing on the origin and precipitation of uranium; U. S* Geol. Survey Circ. 224, 26 p.
Weir, D. B«, 1952, Geologic guides to prospecting for carnotite deposits on Colorado Plateau: U» S. Geol. Survey Bull. 988-B, p. 15-27.
Wood, H» B., 1956, Relations of the origin of host rocks to uranium deposits and ore production in western United States: Proc* Internat. Conf, on the Peaceful Uses of Atomic Energy, Geneva, 1955, "v,. 6, p. 307^316j Ue S, Geol. Survey Prof, Paper 300, p. 533-5^1.