Embed Size (px)
Citation preview

Epidemiologic, clinical and laboratory features of pediatric dengue in Nicaragua
By
Hope Hamrick Biswas
A dissertation submitted in partial satisfaction of the
requirements for the degree of Doctor of Philosophy
in Epidemiology
in the Graduate Division
of the University of California, Berkeley
Committee in charge:
Professor Arthur Reingold, Chair Professor Eva Harris
Professor Aubree Gordon Professor Maya Petersen
Fall 2014

Epidemiologic, clinical and laboratory features of pediatric dengue in Nicaragua
© 2014
Hope Hamrick Biswas

1
Abstract
Epidemiologic, clinical and laboratory features of pediatric dengue in Nicaragua
By
Hope Hamrick Biswas
Doctor of Philosophy in Epidemiology
University of California, Berkeley
Professor Arthur Reingold, Chair
Dengue virus is a flavivirus of worldwide importance, with approximately 4 billion people across 128 countries at risk of dengue virus infection. Most cases present as classic dengue fever, a debilitating, but self-limited illness that manifests with high fever, retro-orbital pain, severe myalgia or arthralgia, and rash. However, in some cases, illness progresses to life-threatening dengue hemorrhagic fever or dengue shock syndrome. The identification of distinguishing clinical and laboratory features that occur during the early febrile phase of illness is important for developing a clinical prediction algorithm to differentiate dengue from other febrile illnesses, and severe dengue from mild dengue. In addition, the success of community-based programs for preventing dengue indicates that identifying environments that could benefit from intervention at a community level is critical in order to have the greatest impact and to target limited resources.
This dissertation focuses on data from two ongoing studies in order to investigate the epidemiologic, clinical and laboratory features of pediatric dengue in Nicaragua. Chapter 1 reports on the clinical and laboratory features of dengue virus infection in Nicaraguan children. The aims of the study were to examine the frequency of clinical signs and symptoms by day of dengue illness and to analyze the association of signs and symptoms with dengue virus infection during the early febrile phase of illness and over the course of illness.
Chapter 2 reports on the association of lower low-density lipoprotein cholesterol levels with severe dengue outcome. The aim of the study was to delineate the trajectories of cholesterol levels over time by dengue virus infection status in order to understand the effect of dengue virus infection on cholesterol metabolism. We also sought to delineate their trajectories by dengue severity and to assess the effect of cholesterol level at presentation on development of severe dengue.
Chapter 3 reports on individual-, household- and neighborhood-level determinants of dengue virus seropositivity in a community-based cohort. The aim of the study was to identify risk factors for DENV infection among children living in urban neighborhoods in Managua, Nicaragua. We also sought to determine the seroprevalence of dengue virus infection and identify individual- and household-level risk factors for dengue virus infection in neighborhood groups categorized by similar socioeconomic, infrastructural and ecological characteristics.

2
Together, these studies present important findings on the natural history of pediatric dengue in Nicaragua and provide the basis for future research to develop clinical prediction algorithms to discriminate dengue from other febrile illnesses, and severe dengue from mild dengue. They also reveal the importance of understanding neighborhood-level factors in targeting community-based programs to prevent dengue.

i
Dedication
This dissertation is dedicated to my husband, for his technical support, continuous encouragement, and love.
ii
Table of contents
List of figures ................................................................................................................................. iv List of tables .................................................................................................................................... v List of abbreviations ...................................................................................................................... vi Acknowledgements ....................................................................................................................... vii Introduction ..................................................................................................................................... 1
References ................................................................................................................................3 Chapter 1: Early Clinical Features of Dengue Virus Infection in Nicaraguan Children: A Longitudinal Analysis ..................................................................................................................... 5
1. Introduction ..........................................................................................................................5 2. Methods................................................................................................................................6
Study site and participants .................................................................................................. 6 Ethics statement .................................................................................................................. 6 Data collection .................................................................................................................... 6 Dengue classification .......................................................................................................... 7 Data.. ................................................................................................................................... 7 Statistical analysis ............................................................................................................... 7
3. Results ..................................................................................................................................8 4. Discussion ............................................................................................................................9 5. Tables and figures ..............................................................................................................11 6. References ..........................................................................................................................17
Chapter 2: Lower Low-density Lipoprotein Cholesterol Levels are Associated with Severe Dengue Outcome .......................................................................................................................... 20
1. Introduction ........................................................................................................................20 2. Materials and methods .......................................................................................................21
Study site and population .................................................................................................. 21 Data collection .................................................................................................................. 21 Dengue diagnosis .............................................................................................................. 22 Dengue disease outcome ................................................................................................... 22 Statistical analysis ............................................................................................................. 22
3. Results ................................................................................................................................23 4. Discussion ..........................................................................................................................24 5. Tables and figures ..............................................................................................................28 6. Supporting information ......................................................................................................34 7. References ..........................................................................................................................36
Chapter 3: Individual-, Household- and Neighborhood-level Determinants of Dengue Virus Seropositivity in a Community-based Cohort in Managua, Nicaragua ........................................ 40
1. Introduction ........................................................................................................................40 2. Methods..............................................................................................................................41
Study site and participants ................................................................................................ 41 Ethics statement ................................................................................................................ 41 Data collection .................................................................................................................. 41
iii
Dengue seroprevalence testing ......................................................................................... 42 Individual- and household-level factors ............................................................................ 42 Neighborhood-level factors .............................................................................................. 42 Statistical analysis ............................................................................................................. 43
3. Results ................................................................................................................................43 4. Discussion ..........................................................................................................................45 5. Tables and figures ..............................................................................................................49 6. References ..........................................................................................................................58
Conclusions ................................................................................................................................... 62 References ..............................................................................................................................64

iv
List of figures
Chapter 1: Early Clinical Features of Dengue Virus Infection in Nicaraguan Children: A Longitudinal Analysis ..................................................................................................................... 5
Figure 1. Flowchart of clinical and laboratory protocols for study participants in the Pediatric Dengue Cohort Study. .............................................................................................14 Figure 2. Frequency of dengue-positive episodes that met the WHO classification criteria for suspected dengue by age (n = 181). .......................................................................................15 Figure 3. Frequency of signs and symptoms by day in patients with OFI, DF and severe dengue. ....................................................................................................................................16
Chapter 2: Lower Low-density Lipoprotein Cholesterol Levels are Associated with Severe Dengue Outcome .......................................................................................................................... 20
Figure 1. Eligibility flow chart. ..............................................................................................28 Figure 2. Age- and gender-adjusted marginal mean cholesterol levels (mg/dl) by DENV infection status and day of illness. ..........................................................................................29 Figure 3. Age- and gender-adjusted marginal mean cholesterol levels (mg/dl) by dengue severity classification and day of illness. ...............................................................................30 Figure S1. Directed acyclic graph of the causal association between cholesterol at presentation and severe dengue outcome >12 hours after presentation. ................................34
Chapter 3: Individual-, Household- and Neighborhood-level Determinants of Dengue Virus Seropositivity in a Community-based Cohort in Managua, Nicaragua ........................................ 40
Figure 1. Map of survey neighborhoods. ................................................................................49 Figure 2. Dengue seroprevalence over time by neighborhood group. ...................................50 Figure 3. Dengue seroprevalence over time by neighborhood population density. ...............51

v
List of tables
Chapter 1: Early Clinical Features of Dengue Virus Infection in Nicaraguan Children: A Longitudinal Analysis ..................................................................................................................... 5
Table 1. Definitions of clinical terminology, variables and disease classifications. ..............11 Table 2. Characteristics of study participants by dengue testing results and disease severity (n = 1,974). .............................................................................................................................12 Table 3. Signs and symptoms associated with testing DENV-positive among patients using generalized estimating equation models. ................................................................................13
Chapter 2: Lower Low-density Lipoprotein Cholesterol Levels are Associated with Severe Dengue Outcome .......................................................................................................................... 20
Table 1. Characteristics of study participants by DENV infection status and WHO classification criteria. ..............................................................................................................31 Table 2. Effect of cholesterol level at presentation on development of severe dengue outcome using the WHO 1997 disease severity classification. ..............................................32 Table 3. Effect of cholesterol level at presentation on development of severe dengue outcome using the WHO 2009 disease severity classification. ..............................................33 Table S1. Classifications of dengue disease severity. ............................................................35
Chapter 3: Individual-, Household- and Neighborhood-level Determinants of Dengue Virus Seropositivity in a Community-based Cohort in Managua, Nicaragua ........................................ 40
Table 1. Descriptions of neighborhood groups. .....................................................................52 Table 2. Characteristics of the study population (n=5,026) by survey year. ..........................53 Table 3. Individual, household, and neighborhood characteristics associated with DENV seropositivity. .........................................................................................................................55 Table 4. Individual and household characteristics associated with DENV seropositivity by neighborhood group. ...............................................................................................................56

vi
List of abbreviations CBC: Complete Blood Counts DENV: Dengue Virus
DF: Dengue Fever DFCS: Dengue Fever with Compensated Shock
DHF: Dengue Hemorrhagic Fever DSAS: Dengue with Signs Associated with Shock
DSS: Dengue Shock Syndrome DWS: Dengue with or without Warning Signs
LDL-C: Low-Density Lipoprotein Cholesterol GEE: Generalized Estimating Equations
HCSFV: Health Center Sócrates Flores Vivas HDL-C: High-Density Lipoprotein Cholesterol
OFI: Other Febrile Illness SD: Severe Dengue
WHO: World Health Organization

vii
Acknowledgements
This dissertation has benefited greatly from the help of many people. First, I would like to thank my research advisor, Eva Harris, for the opportunity to be a part of her amazing research group. She showed me how to be an effective and productive global health researcher, particularly in the area of neglected tropical diseases, and how to translate that research into helping people in need. I am grateful to my academic advisor, Arthur Reingold, for his valuable advice and support of my educational and career goals. Aubree Gordon has been both a committee member and a friend, and I appreciate her mentorship over the years. I would like to thank Maya Petersen for her excellent teaching skills and statistical insights on my research ideas and dissertation. In addition, I would like to thank my fellow epidemiology doctoral students, especially Aracely Tamayo and Christine Dobson, for their support and helpful feedback. I would also like to acknowledge Benjamin Arnold for his timely and thoughtful feedback on my statistical analyses, as well as Alexandros Hadjilaou for his insights regarding cholesterol metabolism.
I would like to recognize the work of the study team in Nicaragua, who provided
exceptional database management and support, as well as top-notch laboratory work. In particular, I would like to thank Douglas Elizondo, Gamaliel Gutiérrez, Lionel Gresh, William Avilés, Brenda López, Andrea Nuñez, Ángel Balmaseda, and Guillermina Kuan. I would also like to thank all of the study participants and their families, without whom this research would not have been possible.
Most importantly, I would like to thank my family, who have been supportive of my
dream of becoming an epidemiologist for many years. My husband, Sanjit, contributed immensely to my progress during my doctoral program from helping me to write code to formatting tables, figures and manuscripts. His continuous encouragement allowed me to maintain perspective during this wonderful journey.
1
Introduction
Dengue virus is a flavivirus of worldwide importance, with approximately 4 billion people across 128 countries at risk of dengue virus infection [1]. The four dengue virus serotypes are transmitted to humans by the domestic, daytime-biting mosquitoes Aedes aegypti and Ae. albopictus in urban and peri-urban areas in tropical and subtropical countries worldwide. Of the estimated 390 million annual dengue virus infections, 96 million are symptomatic [2,3]. Most cases present as classic dengue fever, a debilitating, but self-limited illness that manifests with high fever, retro-orbital pain, severe myalgia/arthralgia, and rash. However, in some cases, mainly children, illness progresses to life-threatening dengue hemorrhagic fever/dengue shock syndrome, characterized by vascular leakage leading to hypovolemic shock and a case fatality proportion up to 5% [4–6]. Currently, no licensed vaccine or antiviral therapy exists for dengue.
Distinguishing dengue from other febrile illnesses early in illness is challenging because symptoms are non-specific and common to other febrile illnesses such as malaria, leptospirosis, rickettsiosis, and typhoid fever [7–9] in dengue-endemic countries. In many endemic countries, laboratory diagnosis of dengue is problematic due to lack of reagents, expense, or delay in obtaining results. Therefore, the identification of distinguishing clinical and laboratory features that occur during the early febrile phase of illness is important for developing a clinical prediction algorithm to differentiate dengue cases from other febrile illnesses. In addition, the identification of patients at risk of developing severe dengue is critical for providing timely supportive care, which can reduce the risk of mortality to <1% [4,10]. Patients with suspected dengue are often hospitalized for close monitoring to ensure proper treatment if they begin to develop severe dengue; however, up to 50% are later diagnosed with other febrile illnesses [11,12] and thus were hospitalized unnecessarily at great financial cost to their family and society [13]. New tools, such as the identification of predictive biomarkers, are needed to distinguish severe dengue from mild dengue to prevent deaths from severe dengue, and to mitigate the economic burden of excess hospitalization.
The prevention of dengue ideally starts in the community. Several studies have shown that community mobilization to reduce Ae. aegypti breeding sites has been effective in decreasing entomological indices [14], and a recent cluster-randomized controlled trial in Nicaragua and Mexico found that it also reduced risk of dengue virus infection in children [15]. However, the spatial distribution of dengue cases in dengue-endemic countries can be very heterogeneous in the urban areas where Ae. aegypti lives and breeds [16–23]. In Nicaragua, there have been no published studies analyzing differences in dengue seroprevalence and determinants of these differences in urban neighborhoods. Given the demonstrated effectiveness of community-based programs, it is important to identify environments that could benefit from intervention at a community level in order to have the greatest impact on preventing dengue and to target limited resources.
This dissertation focuses on data from two ongoing studies in order to investigate the epidemiologic, clinical and laboratory features of pediatric dengue in Nicaragua. Chapter 1 reports on the clinical and laboratory features of dengue virus infection in Nicaraguan children. This study utilized data from the Pediatric Dengue Cohort Study, a prospective ongoing cohort study of approximately 3,800 children aged 2-14 years established in August 2004. The aims of the study were to examine the frequency of clinical signs and symptoms by day of dengue illness

2
and to analyze the association of signs and symptoms with dengue virus infection during the early febrile phase of illness and over the course of illness.
Chapter 2 reports on the association of lower low-density lipoprotein cholesterol levels with severe dengue outcome. This study utilized data from a prospective hospital-based study at the National Pediatric Reference Hospital in Managua, Nicaragua, in which infants and children between six months and 14 years of age with fever and one or more signs or symptoms of dengue virus infection were followed over the course of their illness. The aim of the study was to delineate the trajectories of cholesterol levels over time by dengue virus infection status in order to understand the effect of dengue virus infection on cholesterol metabolism. We also sought to delineate their trajectories by dengue severity in order to understand how cholesterol levels change among patients who develop severe dengue. Last, we sought to assess the effect of cholesterol level at presentation on development of severe dengue.
Chapter 3 reports on individual-, household- and neighborhood-level determinants of dengue virus seropositivity in a community-based cohort. This study utilized five years of seroprevalence and socioeconomic and risk factor survey data from the Pediatric Dengue Cohort Study. The aim of the study was to identify individual-, household- and neighborhood-level risk factors for dengue virus infection among children living in urban neighborhoods in Managua, Nicaragua, using five years of seroprevalence and socioeconomic and risk factor survey data from a community-based cohort. We also sought to determine the seroprevalence of dengue virus infection and identify individual- and household-level risk factors for dengue virus infection in neighborhood groups categorized by similar socioeconomic, infrastructural and ecological characteristics. Last, we describe the ecological and social characteristics of these neighborhood groups in order to explore intra-urban differences in dengue virus infection that could be valuable in targeting vector control efforts.
Together, these studies, using data derived from prospective studies in a rarely studied population, present important findings on the natural history of pediatric dengue in Nicaragua and provide the basis for future research to develop clinical prediction algorithms to discriminate dengue from other febrile illnesses, and severe dengue from mild dengue. They also reveal the importance of understanding neighborhood-level factors in targeting community-based programs to prevent dengue.

3
References 1. Brady OJ, Gething PW, Bhatt S, Messina JP, Brownstein JS, et al. (2012) Refining the global spatial limits of dengue virus transmission by evidence-based consensus. PLoS Negl Trop Dis 6: e1760.
2. Bhatt S, Gething PW, Brady OJ, Messina JP, Farlow AW, et al. (2013) The global distribution and burden of dengue. Nature 496: 504–507.
3. Kyle JL, Harris E (2008) Global spread and persistence of dengue. Annu Rev Microbiol 62: 71–92.
4. World Health Organization (2009) Dengue: guidelines for diagnosis, treatment, prevention and control. New ed. Geneva: World Health Organization.
5. World Health Organization (2000) Strengthening Implementation of the Global Strategy for Dengue Fever/Dengue Haemorrhagic Fever Prevention and Control. Geneva: World Health Organization. 6. Guzman MG, Halstead SB, Artsob H, Buchy P, Farrar J, et al. (2010) Dengue: a continuing global threat. Nat Rev Microbiol 8: S7–16. 7. Zavala-Velazquez J, Yu X-J, Walker DH (1996) Unrecognized spotted fever group rickettsiosis masquerading as dengue fever in Mexico. Am J Trop Med Hyg 55: 157–159. 8. Watt G, Jongsakul K, Chouriyagune C, Paris R (2003) Differentiating dengue virus infection from scrub typhus in Thai adults with fever. Am J Trop Med Hyg 68: 536–538. 9. Ellis RD, Fukuda MM, McDaniel P, Welch K, Nisalak A, et al. (2006) Causes of fever in adults on the Thai-Myanmar border. Am J Trop Med Hyg 74: 108–113. 10. Gibbons R, Vaughn D (2002) Dengue: an escalating problem. BMJ Br Med J 324: 1563–1566. 11. Balmaseda A, Hammond SN, Pérez L, Tellez Y, Saborío SI, et al. (2006) Serotype-specific differences in clinical manifestations of dengue. Am J Trop Med Hyg 74: 449–456. 12. Potts JA, Gibbons R V, Rothman AL, Srikiatkhachorn A, Thomas SJ, et al. (2010) Prediction of dengue disease severity among pediatric Thai patients using early clinical laboratory indicators. PLoS Negl Trop Dis 4: e769.
13. Clark D V, Mammen MP, Nisalak A, Puthimethee V, Endy TP (2005) Economic impact of dengue fever/dengue hemorrhagic fever in Thailand at the family and population levels. Am J Trop Med Hyg 72: 786–791. 14. Al-Muhandis N, Hunter PR (2011) The value of educational messages embedded in a community-based approach to combat dengue Fever: a systematic review and meta regression analysis. PLoS Negl Trop Dis 5: e1278.
15. Andersson N, Nava-Aguilera E, Arostegui J, Morales-Perez A, Suazo-Laguna H, et al. (2014) Camino Verde (Green Way) to Dengue Prevention: a cluster-randomized controlled trial of evidence-based community mobilisation in Nicaragua and Mexico. Br Med J (in press). 16. Stoddard ST, Forshey BM, Morrison AC, Paz-Soldan VA, Vazquez-Prokopec GM, et al. (2013) House-to-house human movement drives dengue virus transmission. Proc Natl Acad Sci U S A 110: 994–999.

4
17. Salje H, Lessler J, Endy TP, Curriero FC, Gibbons R V, et al. (2012) Revealing the microscale spatial signature of dengue transmission and immunity in an urban population. Proc Natl Acad Sci U S A 109: 9535–9538. 18. Siqueira JB, Martelli CM, Maciel IJ, Oliveira RM, Ribeiro MG, et al. (2004) Household survey of dengue infection in central Brazil: spatial point pattern analysis and risk factors assessment. Am J Trop Med Hyg 71: 646–651.
19. Siqueira-Junior JB, Maciel IJ, Barcellos C, Souza W V., Carvalho MS, et al. (2008) Spatial point analysis based on dengue surveys at household level in central Brazil. BMC Public Health 8: 361. 20. Honório NA, Nogueira RMR, Codeço CT, Carvalho MS, Cruz OG, et al. (2009) Spatial evaluation and modeling of dengue seroprevalence and vector density in Rio de Janeiro, Brazil. PLoS Negl Trop Dis 3: e545.
21. Lover AA, Buchy P, Rachline A, Moniboth D, Huy R, et al. (2014) Spatial epidemiology and climatic predictors of paediatric dengue infections captured via sentinel site surveillance, Phnom Penh Cambodia 2011-2012. BMC Public Health 14: 658. 22. Vallée J, Dubot-Pérès A, Ounaphom P, Sayavong C, Bryant JE, et al. (2009) Spatial distribution and risk factors of dengue and Japanese encephalitis virus infection in urban settings: the case of Vientiane, Lao PDR. Trop Med Int Health 14: 1134–1142.
23. De Mattos Almeida MC, Caiaffa WT, Assunção RM, Proietti FA (2007) Spatial vulnerability to dengue in a Brazilian urban area during a 7-year surveillance. J Urban Health 84: 334–345.

5
Chapter 1: Early Clinical Features of Dengue Virus Infection in Nicaraguan Children: A Longitudinal
Analysis1 1. Introduction
Dengue virus (DENV) causes the most prevalent mosquito-borne viral disease affecting humans, with 2.5-3 billion people at risk for infection and approximately 50 million cases of dengue each year [1,2]. The four DENV serotypes are transmitted to humans by Aedes aegypti and Ae. albopictus mosquitoes, primarily in urban and peri-urban areas in tropical and subtropical countries worldwide. Most cases present as classic dengue fever (DF), a debilitating, but self-limited illness that manifests with high fever, retro-orbital pain, severe myalgia/arthralgia, and rash. However, in some cases, mainly children, illness progresses to life-threatening dengue hemorrhagic fever/dengue shock syndrome (DHF/DSS), characterized by vascular leakage leading to hypovolemic shock and a case fatality rate up to 5% [1,3,4]. Currently, no licensed vaccine or antiviral therapy exists for dengue. Early identification of patients at risk of developing severe dengue is critical to provide timely supportive care, which can reduce the risk of mortality to <1% [1,2]. However, distinguishing dengue from other febrile illnesses (OFIs) early in illness is challenging, since symptoms are non-specific and common to other febrile illnesses such as malaria, leptospirosis, rickettsiosis, and typhoid fever [5-7] in dengue-endemic countries. In addition, many distinguishing clinical features of DHF/DSS generally emerge only after 4-5 days, at defervescence, when the patient is already critically ill.
Although the World Health Organization (WHO) has recently established new clinical guidelines to classify dengue severity [1], serological, virological, and molecular biological tests are required to definitively diagnose DENV infection. In many endemic countries, laboratory diagnosis of dengue is problematic due to lack of reagents, expense, or delay in obtaining results. Patients with suspected dengue are often hospitalized for close monitoring to ensure proper treatment if they begin to develop severe dengue; however, up to 50% are later diagnosed with OFIs [8,9] and thus were hospitalized unnecessarily at great financial cost to their family and society [10]. New tools are therefore needed to distinguish dengue from OFIs to prevent deaths from severe dengue and to mitigate the economic burden of excess hospitalization.
Recent approaches using multivariable logistic or linear regression models have shown that petechiae, thrombocytopenia (platelet count <100,000 cells/mm3), positive tourniquet test, rash, and other signs and symptoms can distinguish dengue from OFIs [11-17]; however, results were not consistent across studies. Only two studies considered clinical and laboratory features according to day of illness [18-20], but as these were hospital-based studies, the results likely reflect patients with more severe symptoms and not the clinical spectrum of all symptomatic cases in dengue-endemic populations. Furthermore, none of these studies analyzed data using longitudinal statistical methods, which account for correlations between repeated measures on individuals over time. The use of longitudinal statistical methods to analyze cohort data is
1 This chapter was published in the journal Public Library of Science Neglected Tropical Diseases in March 2012. Reference: Biswas HH, Ortego O, Gordon A, Standish K, Balmaseda A, Kuan G, et al. 2012. Early clinical features of dengue virus infection in Nicaraguan children: a longitudinal analysis. PloS Negl Trop Dis 6(3): e1562. Available at: http://www.plosntds.org/article/info%3Adoi%2F10.1371%2Fjournal.pntd.0001562.
6
essential to utilize all of the data available for analysis and appropriately estimate the within-person and between-person variance in measures over time.
In this study, we used five years of data from an ongoing prospective cohort study of approximately 3,800 children aged 2-14 years in Managua, Nicaragua, to examine the frequency of clinical signs and symptoms by day of illness and to generate models for the association of signs and symptoms during the early phase of illness and over the entire course of illness with testing dengue-positive. In order to account for the longitudinal structure of the data, odds ratios (ORs) and 95% confidence intervals were calculated using generalized estimating equations (GEE), adjusting for age and gender. 2. Methods
Study site and participants In August and September 2004, a community-based pediatric cohort was established in
District II of Managua, a low-to-middle income area with a population of approximately 62,500 [21]. Study activity was based in the Health Center Sócrates Flores Vivas (HCSFV), a public facility that is the primary source of health care for District II residents. Briefly, participants aged 2-9 years were recruited through house-to-house visits, and additional two year-olds were enrolled each year to maintain the age structure of the cohort [21]. Children were eligible to remain in the study until age 12 or until they moved from the study area. The parent/legal guardian of each participant signed an informed consent form, and children ≥6 years old provided verbal assent. In 2007, participants <11 years old were given the opportunity to continue for an additional 3 years, and a second informed consent was performed. Ethics statement
The study was approved by the Institutional Review Boards of the University of California, Berkeley, the Nicaraguan Ministry of Health, and the International Vaccine Institute in Seoul, Korea. Parents or legal guardians of all subjects in both studies provided written informed consent, and subjects 6 years of age and older provided assent.
Data collection Upon enrollment, parents/legal guardians of all participants were encouraged to bring their child(ren) to the HCSFV at first sign of illness or fever. Study physicians and nurses, trained in identification of possible dengue cases, provided medical care for study participants. Febrile illnesses that met the WHO criteria for suspected dengue (Table 1) and those without other apparent origin (undifferentiated febrile illnesses) were treated as possible dengue cases and followed daily while fever or symptoms persisted through visits with study medical personnel (Figure 1). Complete blood counts (CBCs) were completed every 48 hours or more frequently as necessary, as indicated by the physician. Cases were monitored closely for severe manifestations and were transferred by study personnel to the Infectious Disease Ward of the Manuel de Jesús Rivera Children’s Hospital, the national pediatric reference hospital, when they presented with any sign of alarm (Table 1). In addition, an annual healthy blood sample was collected to identify all DENV infections during the previous year and for baseline CBC values. Study physicians in both the hospital and HCSFV completed systematic data collection forms that contained approximately 80 variables (Table 1). In the hospital, additional clinical data, including fluid balance and treatment, were collected daily during hospitalization or through

7
ambulatory follow-up visits by a team of study physicians and nurses. Data were also recorded on medical tests ordered and treatments prescribed.
Dengue classification A case was considered laboratory-confirmed dengue when acute DENV infection was demonstrated by: detection of DENV RNA by RT-PCR; isolation of DENV; seroconversion of DENV-specific IgM antibodies observed by MAC-ELISA in paired acute- and convalescent-phase samples; and/or a ≥4-fold increase in anti-DENV antibody titer measured using Inhibition ELISA [22-25] in paired acute and convalescent samples. DENV serotypes were identified by RT-PCR and/or virus isolation.
Laboratory-confirmed dengue cases were further classified by severity. DHF and DSS were defined according to the traditional WHO criteria (Table 1) [26]. Additional categories of severity were included for those cases presenting with shock without thrombocytopenia and/or hemoconcentration (dengue with signs associated with shock (DSAS)) [23] or dengue fever with compensated shock (DFCS) [27] (Table 1). Laboratory-confirmed cases were defined as primary DENV infections if acute-phase antibody titer, as measured by Inhibition ELISA, was <1:10 or if convalescent phase antibody titer was <1:2560, and as secondary infections if the acute titer was ≥1:10 or convalescent titer was ≥1:2560 [22-25]. Data
Data from the first five years of the study (August 30, 2004–June 30, 2009) were used for analysis. The first three days after onset of fever were considered the early febrile phase of illness. Day of illness at presentation was determined by the date of fever onset, which was defined as the first day of illness as reported by the parent/guardian. Variable definitions are described in Table 1. Positive tourniquet test was examined using cut-offs of ≥10 petechiae/in2 and ≥20 petechiae/in2. Platelet count was dichotomized using a cut-off of ≤150,000 cells/mm3 to enable comparisons during days 1-3. Only data from days 1-8 of illness were included for analysis.
Statistical analysis The frequency of dengue testing results (laboratory-confirmed dengue-positive versus dengue-negative) and disease severity (DF versus severe dengue) was examined by year, demographics, serotype and immune response. The frequency of the WHO case definition for suspected dengue was examined by dengue testing results and age, and a chi-square test for trend was performed. The frequency of clinical signs and symptoms by day of illness and dengue severity was also examined using chi-square tests.
To examine the association between clinical signs and symptoms and the odds of testing dengue-positive versus dengue-negative, odds ratios (ORs) and 95% confidence intervals (CIs) were calculated using GEE models assuming an exchangeable correlation structure with robust standard errors to account for the correlations between repeated measures on the same patients over time. First, ORs were calculated using bivariable models that included only dengue testing results and each of the signs or symptoms. All signs and symptoms were then examined in multivariable models that adjusted for age and gender. Data from the first three days of illness and from all days of illness only were analyzed separately. Finally, for comparison, we used traditional logistic regression models to analyze the association between signs and symptoms and testing dengue-positive with data collapsed by illness episode to disregard repeated measures on
8
the same patients, using the same model generation process as for the GEE models. All analyses were conducted using STATA 10 (StataCorp LP, College Station, TX).
3. Results From August 2004 to June 2009, 22,778 episodes of febrile illness were evaluated, of
which 1,974 episodes were suspected dengue or undifferentiated fever (Figure 1). Of the 1,974 possible dengue cases, 1,793 (91%) tested negative and 181 (9%) were laboratory-confirmed as dengue-positive, of which 161 (89%) were classified as DF, 9 (5%) as DHF, 4 (2%) as DSS, 3 (2%) as DSAS and 4 (2%) as DFCS (Table 1). Nearly all (95%) of the severe dengue cases but only 116 (72%) of the DF cases met the WHO case definition for dengue. The proportion of laboratory-confirmed DENV infections that met the WHO case definition significantly increased by age (chi-square test for trend 5.977, p=0.01), while younger children experienced significantly more undifferentiated febrile illness due to DENV infection (Figure 2). The median age for cases meeting the dengue case definition was 8 years (range 2-13) and that of undifferentiated febrile illness due to DENV infection was 6 years (range 2-10).
The number of confirmed dengue-positive cases varied by year, as expected (Table 2) [28]. Both genders were equally represented, with a slightly higher percentage of females experiencing severe dengue, though this difference was not statistically significant. The majority of DF cases were DENV-2 (58%), followed by DENV-1 (21%) and DENV-3 (9%), while 60% of severe dengue cases were DENV-2, followed by DENV-3 (25%) and DENV-1 (10%). In addition, there were nearly equal proportions of primary and secondary immune responses among DF cases, whereas the majority (70%) of severe dengue cases were secondary DENV infection (Table 2). The median day of illness at presentation was day 2 for all patients, and almost all presented on days 1-3 of illness (90%). The total follow-up time of all children in the cohort was 17,931 person-years with a median follow-up of 3.9 years per child.
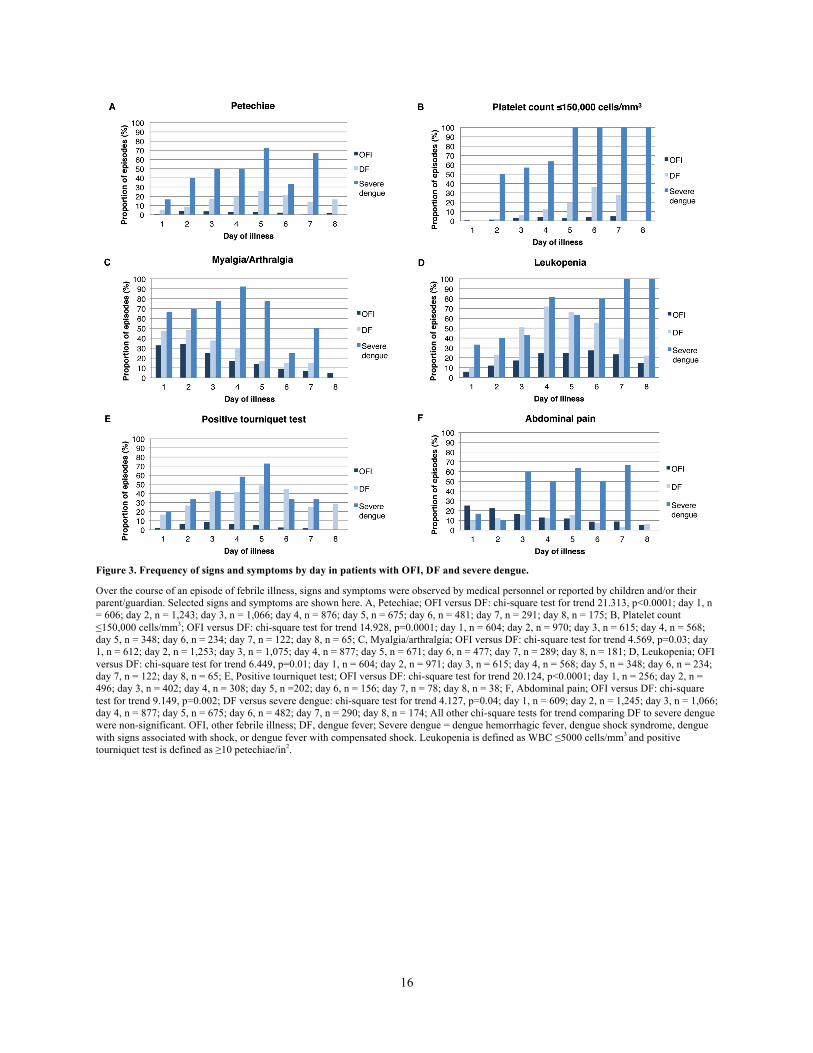
As shown in Figure 3, several signs and symptoms appeared to differentiate OFIs from DF cases, and DF cases from severe dengue cases, according to day of illness. In particular, higher proportions of DF and severe dengue cases experienced petechiae, platelets ≤150,000 cells/mm3, leukopenia, and positive tourniquet test compared to patients with OFIs. Higher proportions of severe cases experienced petechiae, platelets ≤150,000 cells/mm3, myalgia/arthralgia and abdominal pain compared to DF cases and patients with OFIs. Abdominal pain differentiated severe dengue cases from DF and OFI only beginning on day 3 of illness (for severe dengue compared to DF: chi-square 0.144, p=0.70 for days 1-2 versus chi-square 16.910, p<0.0001 for day ≥3).
Bivariable and multivariable analyses were performed using GEE models to examine signs and symptoms early in illness and over the course of illness (Table 3). On days 1-3 of illness, dengue-positive cases had up to 2-fold increased odds of fever, headache, retro-orbital pain, myalgia, arthralgia, and vomiting compared to patients with OFIs. They also had from 3-fold to 9-fold increased odds of rash, petechiae, positive tourniquet test with cut-offs of ≥10 and ≥20 petechiae/in2, leukopenia, platelets ≤150,000 cells/mm3, poor capillary refill, cold extremities and hypotension compared to patients with OFIs. In contrast, they had decreased odds of abdominal pain, likely because this feature appears later in the entire course of dengue illness. On all days of illness, dengue-positive cases had increased odds of the same signs and symptoms as on days 1-3 of illness; however, the magnitude of the point estimates tended to be higher. This difference was most pronounced for rash and platelets ≤150,000 cells/mm3, which had ORs

9
approximately double in magnitude. In addition, dengue-positive cases had increased odds of three additional signs and symptoms: poor appetite, absence of cough, and increased hematocrit. When GEE analyses on data with the longitudinal structure preserved were compared to traditional logistic regression analyses on data collapsed on febrile episode, the point estimates for the ORs were similar, although the 95% confidence intervals for the logistic regression models tended to be slightly narrower (data not shown).
4. Discussion In this study, we describe the clinical spectrum of pediatric dengue starting early in illness
in a community setting. Longitudinal statistical analysis of day-by-day clinical signs and symptoms revealed significant associations with testing dengue-positive and important differences during the early phase of illness compared to the entire course of illness. These results stress the importance of considering day of illness when developing prediction algorithms for real-time clinical management.
The early identification of dengue cases and particularly those at risk for severe dengue is critical for preventing severe illness and death. We found that 25% of laboratory-confirmed dengue cases did not meet the WHO case definition, suggesting that the WHO criteria are not sufficient to identify dengue at younger ages. Younger children may experience different signs and symptoms from adults or may be unable to communicate their symptoms to their parents, health care providers, or both. Previous studies demonstrated that children may experience significantly more cough, vomiting, abdominal pain, rash, epistaxis, oliguria, thrombocytopenia, hepatomegaly, and shock compared to adults, although the direction of these differences was not consistent across studies [13,15,29-34]. A recent study of dengue in adults showed significant differences in clinical features and outcomes across ten-year age groups, indicating that signs and symptoms associated with DENV infection may continue to evolve past childhood [12]. If these differences are confirmed, the WHO case definition may need to be adjusted to be age-specific to function effectively for younger children and older age groups.
Retro-orbital pain and low platelets were among the clinical features independently associated with DENV infection in this study. These results are supported by a study of dengue patients in Puerto Rico in which data were recorded at the time of initial consult rather than at hospitalization [15], and by a study of Thai children [11]. Moreover, our results showing increased frequency of abdominal pain in patients beginning at day 3 of illness are consistent with a prospective study of adults admitted to an emergency department in Martinique [35]. A positive tourniquet test using cut-offs of ≥10 and ≥20 petechiae/in2 was also independently associated with DENV infection. Both cut-offs were used because studies have indicated that a cut-off of ≥10 may improve discrimination of DENV infection [20,36]; however, the 1997 WHO classification scheme specified a cut-off of ≥20 [26]. Our results support using a cut-off of ≥10 petechiae/in2, and this cut-off has been specified in the 2011 WHO clinical guidelines [37].
A major strength of this study is the use of statistical models designed for analysis of longitudinal data. Few other prospective community-based cohort studies have analyzed early clinical features in pediatric dengue compared to OFI [20,38-40], and none that we are aware of were analyzed using longitudinal statistical methods that account for correlations between repeated measures on patients. Here, we preserved the longitudinal structure of the dataset by using statistical models that support repeated measurements on subjects over time and account for correlations between signs and symptoms experienced within the same individual on different
10
days of illness and in multiple episodes. Longitudinal data have long been collected in dengue research but have rarely been analyzed using appropriate statistical methods. This may introduce bias into findings, as studies may overestimate the magnitude of association or reduce the statistical power of the study as data are lost when they are collapsed for non-longitudinal analysis.
An additional strength of this study is that it is community-based [21], enabling day-by-day capture of information on the early course of illness and on the full clinical spectrum of symptomatic dengue. In contrast, nearly all previous studies enrolled patients upon presentation to a hospital [18], where patients present later; thus, these studies were unable to capture information on the early days of illness or on mild disease. By examining the clinical spectrum of dengue by day of illness, we were able to detect differences in the prevalence of signs and symptoms that could not be revealed by simply analyzing whether they ever occurred over the course of illness. In addition, through multivariable longitudinal models, we were able to identify distinguishing features of dengue during the early phase of illness compared to the entire course of illness. These findings are important for clinical practice since outside of the hospital setting, clinicians may see dengue patients toward the beginning of their illness and utilize that information to decide whether their patient has dengue or another febrile illness. The results of these models should be extended for the development of prediction algorithms to aid clinicians in diagnosing suspected dengue.
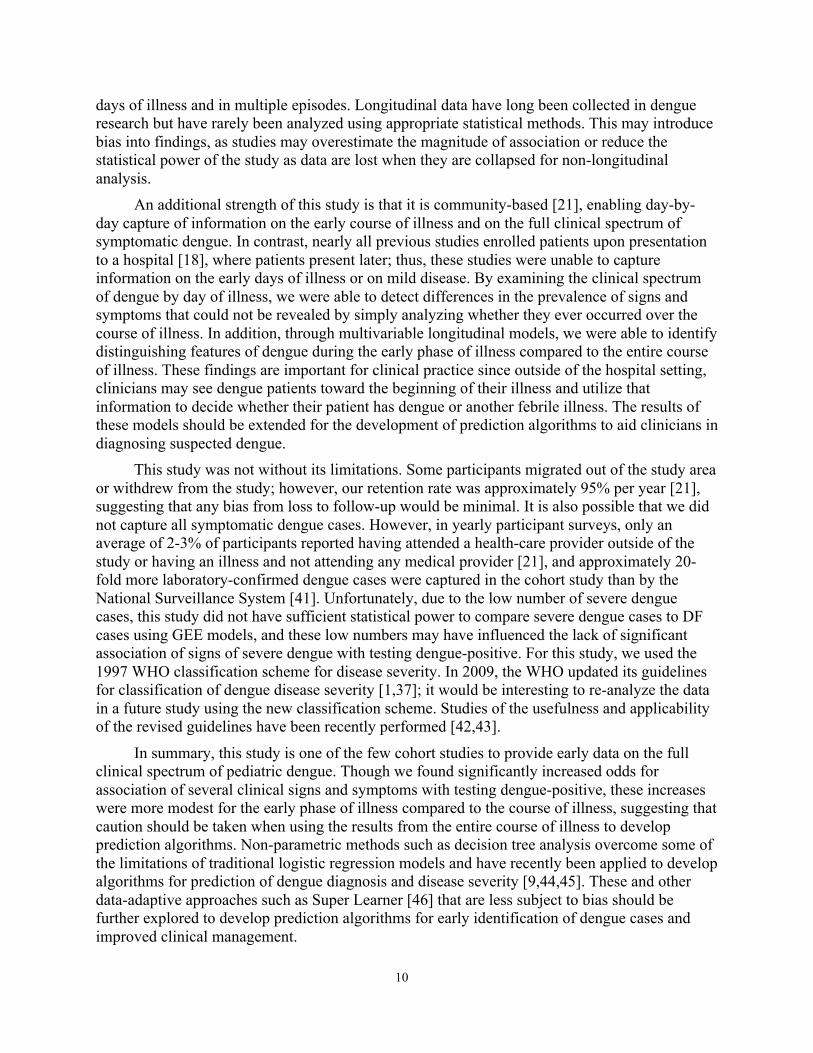
This study was not without its limitations. Some participants migrated out of the study area or withdrew from the study; however, our retention rate was approximately 95% per year [21], suggesting that any bias from loss to follow-up would be minimal. It is also possible that we did not capture all symptomatic dengue cases. However, in yearly participant surveys, only an average of 2-3% of participants reported having attended a health-care provider outside of the study or having an illness and not attending any medical provider [21], and approximately 20-fold more laboratory-confirmed dengue cases were captured in the cohort study than by the National Surveillance System [41]. Unfortunately, due to the low number of severe dengue cases, this study did not have sufficient statistical power to compare severe dengue cases to DF cases using GEE models, and these low numbers may have influenced the lack of significant association of signs of severe dengue with testing dengue-positive. For this study, we used the 1997 WHO classification scheme for disease severity. In 2009, the WHO updated its guidelines for classification of dengue disease severity [1,37]; it would be interesting to re-analyze the data in a future study using the new classification scheme. Studies of the usefulness and applicability of the revised guidelines have been recently performed [42,43].
In summary, this study is one of the few cohort studies to provide early data on the full clinical spectrum of pediatric dengue. Though we found significantly increased odds for association of several clinical signs and symptoms with testing dengue-positive, these increases were more modest for the early phase of illness compared to the course of illness, suggesting that caution should be taken when using the results from the entire course of illness to develop prediction algorithms. Non-parametric methods such as decision tree analysis overcome some of the limitations of traditional logistic regression models and have recently been applied to develop algorithms for prediction of dengue diagnosis and disease severity [9,44,45]. These and other data-adaptive approaches such as Super Learner [46] that are less subject to bias should be further explored to develop prediction algorithms for early identification of dengue cases and improved clinical management.
11
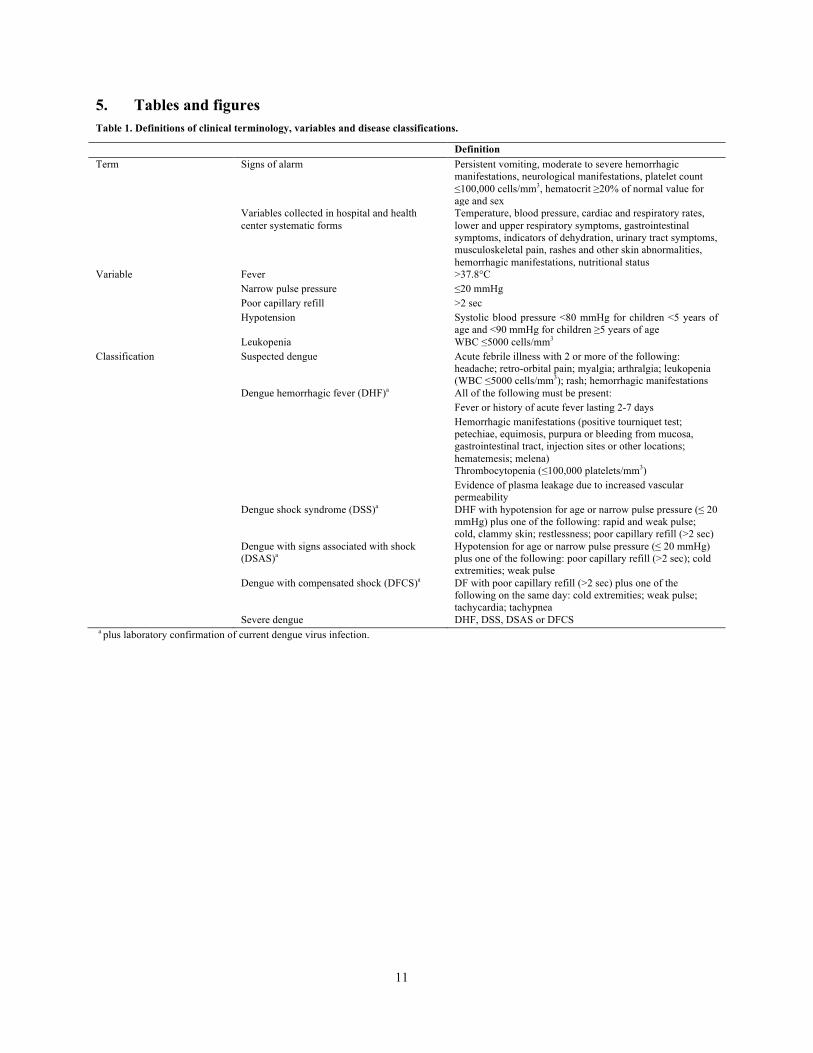
5. Tables and figures Table 1. Definitions of clinical terminology, variables and disease classifications.
Definition Term Signs of alarm Persistent vomiting, moderate to severe hemorrhagic
manifestations, neurological manifestations, platelet count ≤100,000 cells/mm3, hematocrit ≥20% of normal value for age and sex
Variables collected in hospital and health center systematic forms
Temperature, blood pressure, cardiac and respiratory rates, lower and upper respiratory symptoms, gastrointestinal symptoms, indicators of dehydration, urinary tract symptoms, musculoskeletal pain, rashes and other skin abnormalities, hemorrhagic manifestations, nutritional status
Variable Fever >37.8°C Narrow pulse pressure ≤20 mmHg Poor capillary refill >2 sec Hypotension Systolic blood pressure <80 mmHg for children <5 years of
age and <90 mmHg for children ≥5 years of age Leukopenia WBC ≤5000 cells/mm3 Classification Suspected dengue Acute febrile illness with 2 or more of the following:
headache; retro-orbital pain; myalgia; arthralgia; leukopenia (WBC ≤5000 cells/mm3); rash; hemorrhagic manifestations
Dengue hemorrhagic fever (DHF)a All of the following must be present: Fever or history of acute fever lasting 2-7 days Hemorrhagic manifestations (positive tourniquet test;
petechiae, equimosis, purpura or bleeding from mucosa, gastrointestinal tract, injection sites or other locations; hematemesis; melena)
Thrombocytopenia (≤100,000 platelets/mm3) Evidence of plasma leakage due to increased vascular
permeability Dengue shock syndrome (DSS)a DHF with hypotension for age or narrow pulse pressure (≤ 20
mmHg) plus one of the following: rapid and weak pulse; cold, clammy skin; restlessness; poor capillary refill (>2 sec)
Dengue with signs associated with shock (DSAS)a
Hypotension for age or narrow pulse pressure (≤ 20 mmHg) plus one of the following: poor capillary refill (>2 sec); cold extremities; weak pulse
Dengue with compensated shock (DFCS)a DF with poor capillary refill (>2 sec) plus one of the following on the same day: cold extremities; weak pulse; tachycardia; tachypnea
Severe dengue DHF, DSS, DSAS or DFCS a plus laboratory confirmation of current dengue virus infection.

12
Table 2. Characteristics of study participants by dengue testing results and disease severity (n = 1,974).
OFI (n = 1,793)
DF (n = 161)
Severe dengue (n = 20a)
n (%) n (%) n (%) Dengue seasonb 2004-05 312 (95) 16 (5) 1 (0) 2005-06 516 (89) 63 (11) 2 (0) 2006-07 397 (97) 12 (3) 1 (0) 2007-08 328 (84) 53 (13) 11 (3) 2008-09 240 (92) 17 (6) 5 (2) Demographics Female 864 (48) 75 (47) 11 (55) Male 929 (52) 86 (53) 9 (45) Median age in years (range) 6 (2-13) 7 (2-13) 9 (4-12) Median day of illness at presentation
(range) 2 (1-8) 2 (1-8) 3.5 (1-6)
Serotype DENV-1 N/A 33 (21) 2 (10) DENV-2 N/A 94 (58) 12 (60) DENV-3 N/A 14 (9) 5 (25) DENV-4 N/A 0 (0) 1 (5) Multiple N/A 2 (1)c 0 (0) Indeterminate N/A 18 (11) 0 (0) Immune response Primary N/A 71 (44) 6 (30) Secondary N/A 87 (54) 14 (70) Indeterminate N/A 3 (2) 0 (0) Numbers represent episodes of febrile illness. a Includes 9 DHF, 4 DSS, 3 DSAS, and 4 DFCS cases.
b Percentages are calculated horizontally for dengue season.
c Includes 1 case each of DENV-1/DENV-2 and DENV-1/DENV-4. Abbreviations: DENV, dengue virus; OFI, other febrile illness; DF, dengue fever; Severe dengue = dengue hemorrhagic fever (DHF), dengue shock syndrome (DSS), dengue with signs associated with shock (DSAS), or dengue fever with compensated shock (DFCS).

13
Table 3. Signs and symptoms associated with testing DENV-positive among patients using generalized estimating equation models.
Days 1-3 All days OR (95% CI) aOR (95% CI)a OR (95% CI) aOR (95% CI)a Fever (>37.8°C) 1.7 (1.2-2.4)** 1.9 (1.3-2.7)*** 1.8 (1.3-2.5)*** 2.0 (1.4-2.7)*** Headache 2.0 (1.3-3.0)** 1.7 (1.1-2.7)* 2.0 (1.3-3.0)** 1.7 (1.1-2.6)* Retro-orbital pain 1.8 (1.3-2.5)** 1.6 (1.2-2.3)** 2.2 (1.6-2.9)*** 2.0 (1.4-2.7)*** Myalgia 2.0 (1.4-2.8)*** 1.8 (1.3-2.6)*** 2.4 (1.8-3.3)*** 2.2 (1.7-3.1)*** Arthralgia 2.2 (1.6-3.0)*** 2.0 (1.5-2.8)*** 2.5 (1.9-3.5)*** 2.4 (1.7-3.2)*** Rash 6.4 (4.0-10.2)*** 6.6 (4.1-10.6)*** 12.3 (8.4-18.0)*** 12.5 (8.5-18.5)*** Petechiae 5.1 (3.2-8.3)*** 5.1 (3.2-8.1)*** 7.9 (5.3-11.8)*** 7.8 (5.3-11.6)*** Positive tourniquet test (≥10 petechiae/in2)
9.3 (5.6-15.6)*** 9.1 (5.4-15.3)*** 13.5 (8.2-22.1)*** 13.3 (8.1-21.8)***
Positive tourniquet test (≥20 petechiae/in2)
3.4 (2.4-4.9)*** 3.3 (2.3-4.7)*** 5.0 (3.7-6.9)*** 4.9 (3.6-6.7)***
Abdominal pain 0.6 (0.4-0.9)** 0.6 (0.4-0.9)** 0.9 (0.6-1.3) 0.9 (0.6-1.2) Poor appetite 1.4 (0.9-2.1) 1.5 (1.0-2.3) 2.0 (1.3-3.1)** 2.1 (1.4-3.3)** Nausea 1.1 (0.6-1.9) 1.0 (0.6-1.8) 1.3 (0.8-2.1) 1.2 (0.7-2.0) Vomiting 2.4 (1.6-3.6)*** 2.4 (1.6-3.6)*** 1.2 (1.1-1.3)** 1.2 (1.1-1.4)** Sore throat erythema 1.2 (0.8-1.6) 1.1 (0.8-1.6) 1.2 (0.9-1.6) 1.2 (0.8-1.6) Absence of cough 1.4 (0.8-2.6) 1.4 (0.8-2.5) 2.2 (1.0-4.6)* 2.2 (1.0-4.6)* Leukopenia 4.7 (3.3-6.6)*** 4.4 (3.1-6.4)*** 7.6 (5.5-10.6)*** 7.3 (5.3-10.1)*** Platelet count ≤150,000 cells/mm3 5.3 (2.6-10.7)*** 5.2 (2.5-10.6)*** 12.6 (7.9-20.1)*** 11.9 (7.4-19.0)*** Increased hematocrit 1.4 (0.6-3.4) 1.2 (0.5-2.9) 2.7 (1.5-4.7)*** 2.2 (1.2-3.9)** Poor capillary refill 4.1 (1.3-13.3)* 4.7 (1.5-14.6)** 4.6 (1.6-13.3)** 5.1 (1.8-14.1)** Cold extremities 6.2 (1.4-26.3)* 5.5 (1.4-21.8)* 4.8 (1.9-11.9)** 4.2 (1.8-10.0)** Hypotension 2.8 (1.4-5.4)** 3.1 (1.6-6.0)** 2.6 (1.5-4.4)*** 2.7 (1.6-4.6)*** Narrow pulse pressure 0.9 (0.5-1.5) 0.9 (0.5-1.5) 1.2 (0.8-1.7) 1.2 (0.8-1.7)
Generalized estimating equation models assume an exchangeable correlation structure with robust standard errors. a ORs are adjusted for age and gender. *p<0.05; **p<0.01; ***p<0.001 Abbreviations: DENV, dengue virus; OR, odds ratio; CI, confidence interval; aOR, adjusted odds ratio.

14
Figure 1. Flowchart of clinical and laboratory protocols for study participants in the Pediatric Dengue Cohort Study.
Of the 1,974 episodes of febrile illness in the Pediatric Dengue Cohort Study from August 2004 to June 2009 that met the WHO classification criteria for suspected dengue or were diagnosed with undifferentiated fever, 405 patients presented with febrile illness on 2 occasions, 105 presented on 3 occasions, 21 presented on 4 occasions, and 5 presented on 5 occasions. One patient presented after day 8 of illness and was excluded from analysis. Twenty-nine patients had cause of fever identified later in the course of illness. CBC, complete blood count; WHO, World Health Organization; UTI, urinary tract infection.

15
Figure 2. Frequency of dengue-positive episodes that met the WHO classification criteria for suspected dengue by age (n = 181).
Upon presentation to the health center or hospital, children with a febrile illness were classified according to whether or not they met the WHO classification criteria for suspected dengue. One patient had two dengue virus infections over the course of the study and is represented twice. n = 6 for age 2, n = 10 for age 3, n = 18 for age 4, n = 23 for age 5, n = 21 for age 6, n = 16 for age 7, n = 21 for age 8, n = 23 for age 9, n = 24 for age 10, n = 19 for age 11+. Chi-square test for trend 5.977, p=0.01. WHO, World Health Organization.
16
Figure 3. Frequency of signs and symptoms by day in patients with OFI, DF and severe dengue.
Over the course of an episode of febrile illness, signs and symptoms were observed by medical personnel or reported by children and/or their parent/guardian. Selected signs and symptoms are shown here. A, Petechiae; OFI versus DF: chi-square test for trend 21.313, p<0.0001; day 1, n = 606; day 2, n = 1,243; day 3, n = 1,066; day 4, n = 876; day 5, n = 675; day 6, n = 481; day 7, n = 291; day 8, n = 175; B, Platelet count ≤150,000 cells/mm3; OFI versus DF: chi-square test for trend 14.928, p=0.0001; day 1, n = 604; day 2, n = 970; day 3, n = 615; day 4, n = 568; day 5, n = 348; day 6, n = 234; day 7, n = 122; day 8, n = 65; C, Myalgia/arthralgia; OFI versus DF: chi-square test for trend 4.569, p=0.03; day 1, n = 612; day 2, n = 1,253; day 3, n = 1,075; day 4, n = 877; day 5, n = 671; day 6, n = 477; day 7, n = 289; day 8, n = 181; D, Leukopenia; OFI versus DF: chi-square test for trend 6.449, p=0.01; day 1, n = 604; day 2, n = 971; day 3, n = 615; day 4, n = 568; day 5, n = 348; day 6, n = 234; day 7, n = 122; day 8, n = 65; E, Positive tourniquet test; OFI versus DF: chi-square test for trend 20.124, p<0.0001; day 1, n = 256; day 2, n = 496; day 3, n = 402; day 4, n = 308; day 5, n =202; day 6, n = 156; day 7, n = 78; day 8, n = 38; F, Abdominal pain; OFI versus DF: chi-square test for trend 9.149, p=0.002; DF versus severe dengue: chi-square test for trend 4.127, p=0.04; day 1, n = 609; day 2, n = 1,245; day 3, n = 1,066; day 4, n = 877; day 5, n = 675; day 6, n = 482; day 7, n = 290; day 8, n = 174; All other chi-square tests for trend comparing DF to severe dengue were non-significant. OFI, other febrile illness; DF, dengue fever; Severe dengue = dengue hemorrhagic fever, dengue shock syndrome, dengue with signs associated with shock, or dengue fever with compensated shock. Leukopenia is defined as WBC ≤5000 cells/mm3 and positive tourniquet test is defined as ≥10 petechiae/in2.

17
6. References 1. World Health Organization. (2009) Dengue: Guidelines for diagnosis, treatment, prevention and control. Geneva: WHO Press. 2. Gibbons RV, Vaughn DW. (2002) Dengue: An escalating problem. BMJ 324: 1563-1566.
3. Guzman MG, Halstead SB, Artsob H, Buchy P, Farrar J, et al. (2010) Dengue: A continuing global threat. Nat Rev Microbiol 8: S7-16.
4. World Health Organization. (2000) Strengthening implementation of the global strategy for dengue fever/dengue haemorrhagic fever prevention and control. Geneva: WHO Press.
5. Zavala-Velazquez JE, Yu XJ, Walker DH. (1996) Unrecognized spotted fever group rickettsiosis masquerading as dengue fever in Mexico. Am J Trop Med Hyg 55: 157-159.
6. Watt G, Jongsakul K, Chouriyagune C, Paris R. (2003) Differentiating dengue virus infection from scrub typhus in Thai adults with fever. Am J Trop Med Hyg 68: 536-538.
7. Ellis RD, Fukuda MM, McDaniel P, Welch K, Nisalak A, et al. (2006) Causes of fever in adults on the Thai-Myanmar border. Am J Trop Med Hyg 74: 108-113.
8. Balmaseda A, Hammond SN, Perez L, Tellez Y, Saborio SI, et al. (2006) Serotype-specific differences in clinical manifestations of dengue. Am J Trop Med Hyg 74: 449-456.
9. Potts JA, Gibbons RV, Rothman AL, Srikiatkhachorn A, Thomas SJ, et al. (2010) Prediction of dengue disease severity among pediatric Thai patients using early clinical laboratory indicators. PLoS Negl Trop Dis 4: e769. 10. Clark DV, Mammen MP,Jr, Nisalak A, Puthimethee V, Endy TP. (2005) Economic impact of dengue fever/dengue hemorrhagic fever in Thailand at the family and population levels. Am J Trop Med Hyg 72: 786-791.
11. Potts JA, Thomas SJ, Srikiatkhachorn A, Supradish PO, Li W, et al. (2010) Classification of dengue illness based on readily available laboratory data. Am J Trop Med Hyg 83: 781-788.
12. Low JG, Ong A, Tan LK, Chaterji S, Chow A, et al. (2011) The early clinical features of dengue in adults: Challenges for early clinical diagnosis. PLoS Negl Trop Dis 5: e1191.
13. Ramos MM, Tomashek KM, Arguello DF, Luxemburger C, Quinones L, et al. (2009) Early clinical features of dengue infection in Puerto Rico. Trans R Soc Trop Med Hyg 103: 878-884.
14. Binh PT, Matheus S, Huong VT, Deparis X, Marechal V. (2009) Early clinical and biological features of severe clinical manifestations of dengue in Vietnamese adults. J Clin Virol 45: 276-280. 15. Gregory CJ, Santiago LM, Arguello DF, Hunsperger E, Tomashek KM. (2010) Clinical and laboratory features that differentiate dengue from other febrile illnesses in an endemic area--Puerto Rico, 2007-2008. Am J Trop Med Hyg 82: 922-929.
16. Chadwick D, Arch B, Wilder-Smith A, Paton N. (2006) Distinguishing dengue fever from other infections on the basis of simple clinical and laboratory features: Application of logistic regression analysis. J Clin Virol 35: 147-153. 17. Wilder-Smith A, Earnest A, Paton NI. (2004) Use of simple laboratory features to distinguish the early stage of severe acute respiratory syndrome from dengue fever. Clin Infect Dis 39: 1818-

18
1823. 18. Potts JA, Rothman AL. (2008) Clinical and laboratory features that distinguish dengue from other febrile illnesses in endemic populations. Trop Med Int Health 13: 1328-1340. 19. Deparis X, Murgue B, Roche C, Cassar O, Chungue E. (1998) Changing clinical and biological manifestations of dengue during the dengue-2 epidemic in French Polynesia in 1996/97--description and analysis in a prospective study. Trop Med Int Health 3: 859-865.
20. Kalayanarooj S, Vaughn DW, Nimmannitya S, Green S, Suntayakorn S, et al. (1997) Early clinical and laboratory indicators of acute dengue illness. J Infect Dis 176: 313-321.
21. Kuan G, Gordon A, Aviles W, Ortega O, Hammond SN, et al. (2009) The Nicaraguan pediatric dengue cohort study: Study design, methods, use of information technology, and extension to other infectious diseases. Am J Epidemiol 170: 120-129. 22. Balmaseda A, Hammond SN, Tellez Y, Imhoff L, Rodriguez Y, et al. (2006) High seroprevalence of antibodies against dengue virus in a prospective study of schoolchildren in Managua, Nicaragua. Trop Med Int Health 11: 935-942.
23. Harris E, Videa E, Perez L, Sandoval E, Tellez Y, et al. (2000) Clinical, epidemiologic, and virologic features of dengue in the 1998 epidemic in Nicaragua. Am J Trop Med Hyg 63: 5-11.
24. Fernández RJ, Vázquez S. (1990) Serological diagnosis of dengue by an ELISA inhibition method (EIM). Mem Inst Oswaldo Cruz 85: 347-351.
25. Reed LJ, Muench H. (1938) A simple method of estimating fifty percent endpoints. Am J Hyg 27: 493-497.
26. World Health Organization. (1997) Dengue haemorrhagic fever: Diagnosis, treatment, prevention and control. Geneva: World Health Organization.
27. Gutierrez G, Standish K, Narvaez F, Perez MA, Saborio S, et al. (2011) Unusual dengue virus 3 epidemic in Nicaragua, 2009. PLoS Negl Trop Dis 5: e1394.
28. Balmaseda A, Standish K, Mercado JC, Matute JC, Tellez Y, et al. (2010) Trends in patterns of dengue transmission over 4 years in a pediatric cohort study in Nicaragua. J Infect Dis 201: 5-14. 29. Wang CC, Lee IK, Su MC, Lin HI, Huang YC, et al. (2009) Differences in clinical and laboratory characteristics and disease severity between children and adults with dengue virus infection in Taiwan, 2002. Trans R Soc Trop Med Hyg 103: 871-877.
30. Hanafusa S, Chanyasanha C, Sujirarat D, Khuankhunsathid I, Yaguchi A, et al. (2008) Clinical features and differences between child and adult dengue infections in Rayong province, southeast Thailand. Southeast Asian J Trop Med Public Health 39: 252-259. 31. Kittigul L, Pitakarnjanakul P, Sujirarat D, Siripanichgon K. (2007) The differences of clinical manifestations and laboratory findings in children and adults with dengue virus infection. J Clin Virol 39: 76-81.
32. Hammond SN, Balmaseda A, Perez L, Tellez Y, Saborio SI, et al. (2005) Differences in dengue severity in infants, children, and adults in a 3-year hospital-based study in Nicaragua. Am J Trop Med Hyg 73: 1063-1070. 33. Wichmann O, Hongsiriwon S, Bowonwatanuwong C, Chotivanich K, Sukthana Y, et al.

19
(2004) Risk factors and clinical features associated with severe dengue infection in adults and children during the 2001 epidemic in Chonburi, Thailand. Trop Med Int Health 9: 1022-1029.
34. Suwandono A, Kosasih H, Nurhayati, Kusriastuti R, Harun S, et al. (2006) Four dengue virus serotypes found circulating during an outbreak of dengue fever and dengue haemorrhagic fever in Jakarta, Indonesia, during 2004. Trans R Soc Trop Med Hyg 100: 855-862. 35. Thomas L, Brouste Y, Najioullah F, Hochedez P, Hatchuel Y, et al. (2010) Predictors of severe manifestations in a cohort of adult dengue patients. J Clin Virol 48: 96-99. 36. Cao XT, Ngo TN, Wills B, Kneen R, Nguyen TT, et al. (2002) Evaluation of the world health organization standard tourniquet test and a modified tourniquet test in the diagnosis of dengue infection in Viet Nam. Trop Med Int Health 7: 125-132.
37. World Health Organization. (2011) Comprehensive guidelines for prevention and control of dengue and dengue hemorrhagic fever. India: WHO Regional Office for South-East Asia.
38. Phuong CX, Nhan NT, Kneen R, Thuy PT, van Thien C, et al. (2004) Clinical diagnosis and assessment of severity of confirmed dengue infections in Vietnamese children: Is the world health organization classification system helpful? Am J Trop Med Hyg 70: 172-179. 39. Phuong HL, de Vries PJ, Nga TT, Giao PT, Hung le Q, et al. (2006) Dengue as a cause of acute undifferentiated fever in Vietnam. BMC Infect Dis 6: 123. 40. Karande S, Gandhi D, Kulkarni M, Bharadwaj R, Pol S, et al. (2005) Concurrent outbreak of leptospirosis and dengue in Mumbai, India, 2002. J Trop Pediatr 51: 174-181. 41. Standish K, Kuan G, Aviles W, Balmaseda A, Harris E. (2010) High dengue case capture rate in four years of a cohort study in Nicaragua compared to national surveillance data. PLoS Negl Trop Dis 4: e633.
42. Barniol J, Gaczkowski R, Barbato EV, da Cunha RV, Salgado D, et al. (2011) Usefulness and applicability of the revised dengue case classification by disease: Multi-centre study in 18 countries. BMC Infect Dis 11: 106. 43. Narvaez F, Gutierrez G, Perez MA, Elizondo D, Nunez A, et al. (2011) Evaluation of the traditional and revised WHO classifications of dengue disease severity. PLoS Negl Trop Dis 5: e1397.
44. Tanner L, Schreiber M, Low JG, Ong A, Tolfvenstam T, et al. (2008) Decision tree algorithms predict the diagnosis and outcome of dengue fever in the early phase of illness. PLoS Negl Trop Dis 2: e196. 45. Lee VJ, Lye DC, Sun Y, Leo YS. (2009) Decision tree algorithm in deciding hospitalization for adult patients with dengue haemorrhagic fever in Singapore. Trop Med Int Health 14: 1154-1159.
46. van der Laan MJ, Polley EC, Hubbard AE. (2007) Super learner. Statistical Applications in Genetics and Molecular Biology 6: Article 25.

20
Chapter 2: Lower Low-density Lipoprotein Cholesterol Levels are Associated with Severe Dengue
Outcome 1. Introduction
Dengue virus (DENV) is a flavivirus of worldwide importance, with approximately 3.97 billion people across 128 countries at risk of DENV infection [1]. Of the estimated 390 million annual DENV infections, 96 million are symptomatic, and a subset of individuals develop severe forms of the disease, which consist of hemorrhagic manifestations and vascular leakage, leading to hypovolemic shock [2,3]. Studies of the pathogenesis of DENV and other flavivirus infections suggest that lipids and lipoproteins may play a role in modifying virus infectivity. Cholesterol-rich lipid rafts have been shown to be required for flavivirus entry [4–6], and the related hepatitis C virus enters host cells via low-density lipoprotein (LDL) receptors [7]. The addition of cholesterol during viral adsorption blocks Japanese encephalitis virus and DENV infectivity [4]. Further, lovastatin, an inhibitor of cholesterol synthesis, also inhibits DENV replication [8,9] and is currently in clinical trials as a potential dengue antiviral [10]. After infection, DENV, West Nile virus and Japanese encephalitis virus mimic or hijack lipid metabolic pathways [9,11–15] by increasing lipid raft formation, intracellular levels of total cholesterol, and LDL receptors on the surface of infected cells [15]. Together, these studies suggest that cholesterol is beneficial for DENV replication and that DENV infection disrupts cholesterol metabolism.
Previous epidemiologic studies have generally shown lower levels of plasma and serum cholesterol among severe dengue cases compared to less severe dengue cases or healthy controls [16–20], possibly driven by a reduction in LDL cholesterol (LDL-C) [20]. However, the relationship between severe dengue and total cholesterol, HDL-C, and LDL-C, respectively, is unclear. In the two studies that used multivariable models to examine the relationship between cholesterol and severe dengue, high-density lipoprotein cholesterol (HDL-C) and LDL-C were associated with severe dengue outcome in one of these studies [18], but not the other [19]. Total serum cholesterol was not associated with severe dengue outcome [19] or was not separately analyzed [18]. However, neither of these studies fully accounted for the time ordering of cholesterol level in relation to development of severe dengue outcome. Without time ordering, it is impossible to determine whether cholesterol level affects development of severe dengue or is a result of developing severe dengue.
In this study, we sought to delineate the trajectories of cholesterol levels over time by DENV infection status in order to understand the effect of DENV infection on cholesterol metabolism. We also sought to delineate their trajectories by dengue severity in order to understand how cholesterol levels change among patients who develop severe dengue. Lastly, we aimed to assess the effect of cholesterol level at presentation on development of severe dengue. To address these questions, we analyzed data from a prospective hospital-based study of pediatric dengue cases in Managua, Nicaragua, between August 2005 and January 2013. Because different classifications of dengue severity are used in the literature, we performed analyses using three different classifications of severity: the WHO 1997 classification criteria [21], the WHO 2009 classification criteria [22] and standardized intervention categories [23].

21
2. Materials and methods Study site and population
A prospective study was conducted from 2005 to the present in the Infectious Disease Ward of the Hospital Infantil Manuel de Jesús Rivera in Managua, Nicaragua, to study clinical, immunological and viral risk factors for severe dengue. This hospital is the National Pediatric Reference Hospital and treats the vast majority of children seeking tertiary care in Managua and referred from around the country [24]. Infants and children between six months and 14 years of age with fever or history of fever <7 days and one or more of the following signs and symptoms: headache, arthralgias, myalgias, retro-orbital pain, positive tourniquet test, petechiae, or signs of bleeding were eligible to participate in the study. Patients with a defined focus of infection other than dengue or who were actively enrolled in the concurrent Pediatric Dengue Cohort Study [25] were excluded. Children weighing <8 kg, children <6 months of age, and children ≥6 years of age displaying signs of altered consciousness at the time of recruitment were also excluded. For the current analysis, we also excluded children <1 year of age, due to the possible presence of maternal antibodies, as well as children with nephrotic syndrome or obesity (body mass index (BMI) ≥32), due to abnormally high cholesterol levels. Both inpatients and outpatients were enrolled each year during the peak of the dengue season (August 1 to January 31) and followed clinically through the acute phase of illness.
Upon enrollment, a medical history was taken and a complete physical exam was performed. Clinical data, including vital signs, signs and symptoms, and fluid balance and treatment, were recorded twice daily on standardized data collection forms during hospitalization or through daily ambulatory visits by the same team of study physicians and nurses responsible for care of hospitalized study participants. A blood sample was also collected daily for three days for complete blood counts with platelets, blood chemistry, and serological, virological and molecular biological tests for DENV infection. A convalescent serum sample (14-21 days post-onset of illness) was also collected for paired serological testing. Participants were hospitalized if they presented any of the following warning signs: persistent vomiting; moderate-to-severe dehydration; signs or symptoms of shock; abdominal pain; breathing difficulties; moderate-to-severe hemorrhagic manifestations; neurological manifestations; thrombocytopenia (platelet count ≤100,000 cells/mm3); or hematocrit ≥20% of normal value for age and sex.
Data collection All information was collected every 12 hours for inpatients and every 24 hours for
outpatients on Case Report Forms (CRFs) designed to follow patients’ progress, with vital signs and fluid intake/output recorded more often as appropriate. Each CRF was completed by an infectious disease pediatrician and reviewed by a second physician. Following this review, the CRF information was entered into an Access 2003 database by double-data entry and was systematically monitored by weekly quality control checks. Cholesterol measurements
For inpatients, a non-fasting blood sample was obtained each morning to measure serum lipids. For outpatients, a non-fasting blood sample was obtained at each follow-up visit. Total serum cholesterol, HDL-C (direct) and LDL-C (direct) were measured using the CHOD-PAP method (CHOD: cholesterol oxidase; PAP: phenol plus aminophenazone). Total serum cholesterol and HDL-C were measured throughout the study; LDL-C was measured from August
22
2007 until present. From August 2005 to July 2007, the BioCon kit was used and reactions were read in a spectrophotometer. From August 2007 to present, cholesterol was measured using the same CHOD-PAP method, but using the Cobas Integra 400 platform and the corresponding cholesterol kit (Roche Diagnostics).
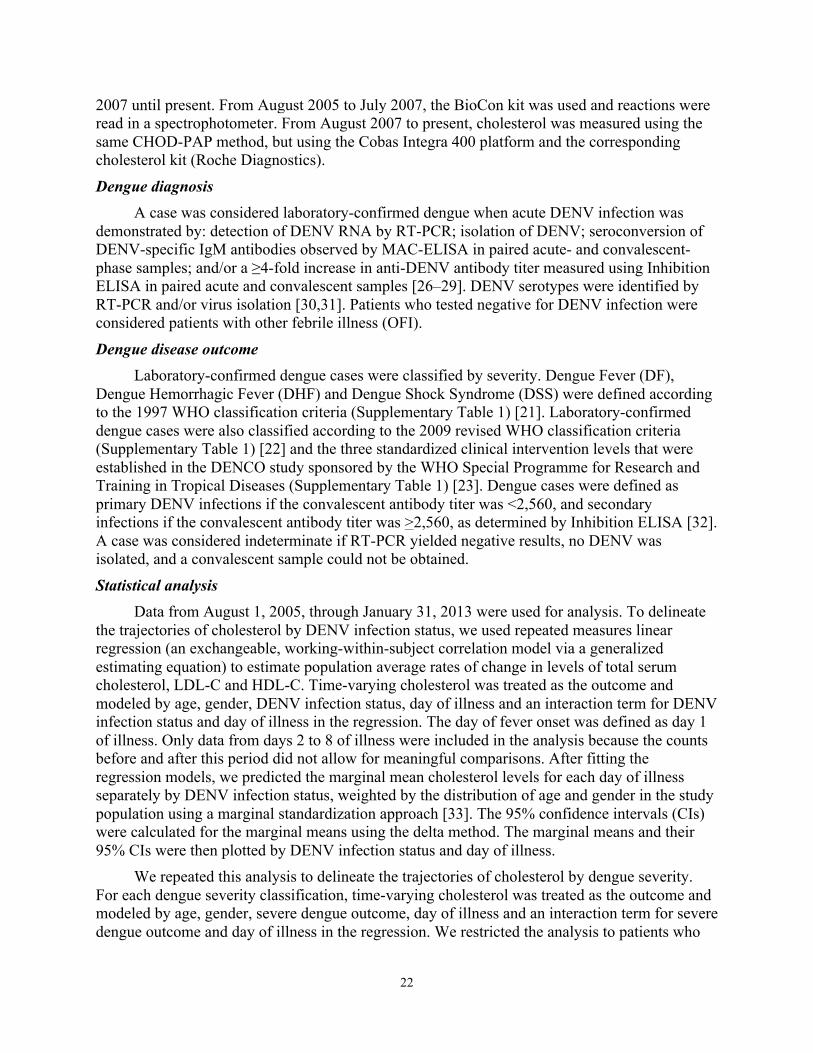
Dengue diagnosis A case was considered laboratory-confirmed dengue when acute DENV infection was
demonstrated by: detection of DENV RNA by RT-PCR; isolation of DENV; seroconversion of DENV-specific IgM antibodies observed by MAC-ELISA in paired acute- and convalescent-phase samples; and/or a ≥4-fold increase in anti-DENV antibody titer measured using Inhibition ELISA in paired acute and convalescent samples [26–29]. DENV serotypes were identified by RT-PCR and/or virus isolation [30,31]. Patients who tested negative for DENV infection were considered patients with other febrile illness (OFI).
Dengue disease outcome Laboratory-confirmed dengue cases were classified by severity. Dengue Fever (DF),
Dengue Hemorrhagic Fever (DHF) and Dengue Shock Syndrome (DSS) were defined according to the 1997 WHO classification criteria (Supplementary Table 1) [21]. Laboratory-confirmed dengue cases were also classified according to the 2009 revised WHO classification criteria (Supplementary Table 1) [22] and the three standardized clinical intervention levels that were established in the DENCO study sponsored by the WHO Special Programme for Research and Training in Tropical Diseases (Supplementary Table 1) [23]. Dengue cases were defined as primary DENV infections if the convalescent antibody titer was <2,560, and secondary infections if the convalescent antibody titer was >2,560, as determined by Inhibition ELISA [32]. A case was considered indeterminate if RT-PCR yielded negative results, no DENV was isolated, and a convalescent sample could not be obtained.
Statistical analysis Data from August 1, 2005, through January 31, 2013 were used for analysis. To delineate
the trajectories of cholesterol by DENV infection status, we used repeated measures linear regression (an exchangeable, working-within-subject correlation model via a generalized estimating equation) to estimate population average rates of change in levels of total serum cholesterol, LDL-C and HDL-C. Time-varying cholesterol was treated as the outcome and modeled by age, gender, DENV infection status, day of illness and an interaction term for DENV infection status and day of illness in the regression. The day of fever onset was defined as day 1 of illness. Only data from days 2 to 8 of illness were included in the analysis because the counts before and after this period did not allow for meaningful comparisons. After fitting the regression models, we predicted the marginal mean cholesterol levels for each day of illness separately by DENV infection status, weighted by the distribution of age and gender in the study population using a marginal standardization approach [33]. The 95% confidence intervals (CIs) were calculated for the marginal means using the delta method. The marginal means and their 95% CIs were then plotted by DENV infection status and day of illness.
We repeated this analysis to delineate the trajectories of cholesterol by dengue severity. For each dengue severity classification, time-varying cholesterol was treated as the outcome and modeled by age, gender, severe dengue outcome, day of illness and an interaction term for severe dengue outcome and day of illness in the regression. We restricted the analysis to patients who

23
were classified as mild dengue at presentation and, if they developed severe dengue, developed severe dengue >12 hours after presentation. For the WHO 1997 classification, mild dengue was defined as dengue fever (DF) and severe dengue was defined as dengue hemorrhagic fever or dengue shock syndrome (DHF/DSS). For the WHO 2009 classification, mild dengue was defined as dengue with or without warning signs (DWS) and severe dengue was defined verbatim (SD). For the standardized intervention categories, mild dengue was defined as IC 1/IC 2 care and severe dengue was defined as IC 3 care.
To examine the effect of cholesterol level at presentation on subsequent risk of development of severe dengue, relative risks (RRs) and 95% CIs were calculated using modified Poisson models with robust standard errors [34]. We again restricted the analysis to patients who were classified as mild dengue at presentation and, if they developed severe dengue, developed severe dengue >12 hours after presentation to ensure that we had appropriate time ordering of our exposure (cholesterol) before our outcome (severe dengue). We constructed a directed acyclic graph [35] to characterize the pathways through which cholesterol at presentation could be causally associated with development of severe dengue (see Supplementary Figure 1) and adjusted models for the following confounders based on this working diagram: age (years), gender, immune response (secondary vs. primary) and malnutrition. For children ≥2 years of age, malnutrition was defined as less than the third BMI-for-age percentile according to growth charts by the Centers for Disease Control and Prevention [36]; for children <2 years of age, malnutrition was defined as a deficit of ≥10% of the ideal weight based on the Gómez classification [37]. We repeated this analysis for each dengue severity classification. All analyses were performed using STATA 13/SE (StataCorp LP, College Station, TX).
3. Results
Of the 1,440 patients in the dengue hospital study, 69 patients <1 year of age, 11 patients with nephrotic syndrome, and 9 patients with obesity (BMI ≥32) were excluded from the analysis (see Figure 1). An additional 69 patients missing all cholesterol measurements, 2 patients with inadequate samples for laboratory testing and 44 patients with an indeterminate result of dengue testing were excluded, leaving 1,236 patients available for analysis. Of the 1,236 patients, 789 (64%) were laboratory-confirmed as DENV-positive. The remaining 447 patients (36%) tested negative for DENV and were classified as OFI.
The characteristics of the 1,236 study participants included in the analysis are summarized in Table 1. Overall, similar proportions of males and females were classified as different disease severity categories in both WHO 1997 and 2009 classification schemes. Compared to other age groups, children aged 9 to 12 years were more likely to be classified as DHF, DSS and SD. Dengue cases were more likely to have a secondary immune response and approximately half were DENV-3 serotype. Patients generally presented on day 4 or 5 of illness and were hospitalized for a median of 3 days.
We delineated the trajectories of cholesterol levels by DENV infection status (Figure 2) and found that total serum cholesterol levels were significantly lower in dengue-positive patients compared to dengue-negative patients on days 3-8 of illness (p<0.05). Among dengue-positive patients, total serum cholesterol levels decreased from day 2-6 of illness, and then increased from day 6-8 of illness. However, among dengue-negative patients, total serum cholesterol levels gradually increased from day 2-8 of illness.

24
Trajectories of LDL-C levels were similar to those of total serum cholesterol levels. LDL-C levels were significantly lower in dengue-positive patients compared to dengue-negative patients on days 4-8 of illness (p<0.0001). In contrast to LDL-C, HDL-C levels were significantly lower only on days 5-7 of illness (p<0.001). HDL-C levels followed a similar trajectory among both dengue-positive and dengue-negative patients, decreasing from day 2 to day 6-7 of illness before stabilizing on day 7-8 of illness.
We also examined the trajectories of cholesterol by dengue severity (Figure 3). Total serum cholesterol levels were significantly lower in patients who developed severe dengue compared to patients with mild dengue on days 4-7 of illness using the WHO 2009 classification and standardized intervention categories (p<0.001), and on days 5-7 of illness using the WHO 1997 classification (p<0.001). LDL-C levels were significantly lower in patients who developed severe dengue compared to patients with mild dengue on days 5-7 of illness using the WHO 1997 classification (p<0.01), days 2-7 of illness using the WHO 2009 classification (p<0.01), and day 2 and days 5-7 of illness using standardized intervention categories (p≤0.01). Regardless of dengue outcome, both total serum cholesterol and LDL-C levels decreased from day 2-6 and increased from day 6-8 of illness. Similarly, HDL-C levels decreased from day 2-7 of illness before increasing slightly on day 8 of illness. HDL-C levels were significantly lower in patients who developed severe dengue compared to patients with mild dengue on days 5-8 of illness using the WHO 1997 classification (p≤0.001), days 3-8 of illness using the WHO 2009 classification (p≤0.01), and days 4-7 of illness using standardized intervention categories (p<0.01).
We next constructed multivariable models to examine the effect of cholesterol level at presentation on subsequent risk of development of severe dengue as defined by the three classification schemes. Using the WHO 1997 disease severity classification, we found that for each 10 mg/dl decrease in total serum cholesterol and LDL-C at presentation, risk of development of severe dengue increased by 9% (95% CI: 0-19%) and 12% (95% CI: 0-26%), respectively, but these increases were only borderline significant (Table 2). A 10 mg/dl decrease in HDL-C at presentation was not significantly associated with risk of development of severe dengue using the WHO 1997 classification. However, using the WHO 2009 classification, we found that for each 10 mg/dl decrease in total serum cholesterol, LDL-C and HDL-C at presentation, risk of development of severe dengue increased by 17% (95% CI: 6-29%), 23% (95% CI: 8-41%) and 25% (95% CI: 3-51%), and that these increases were statistically significant (Table 3). We also examined the effect of total serum cholesterol, LDL-C and HDL-C at presentation on risk of development of severe dengue as defined by standardized intervention categories, but none of the findings were statistically significant (data not shown). 4. Discussion
While other studies have examined cholesterol levels during a particular phase of dengue illness (acute, critical or convalescent) [19,20] or on day of admission to the hospital [17,18], ours is the first study of which we are aware to analyze changes in cholesterol levels by day of illness in dengue patients. We found that total serum cholesterol levels were significantly lower in dengue-positive patients compared to dengue-negative patients on days 3-8 of illness. LDL-C levels were significantly lower in dengue-positive patients compared to dengue-negative patients on days 4-8 of illness, and HDL-C levels were significantly lower on days 5-7 of illness.

25
Liver dysfunction caused by DENV infection could be contributing to the lower cholesterol levels we observed in dengue patients. Liver dysfunction is a well-established characteristic of dengue patients [21], particularly severe cases, and higher liver enzyme levels (aspartate aminotransferase and alanine aminotransferase) have been shown with increasing dengue severity across different classification schemes [38]. The liver is a major site of cholesterol synthesis in humans and the rate of cholesterol production depends on the cellular level of cholesterol, for which LDL and HDL, among other lipoproteins, are responsible through their roles in cholesterol transport [39]. In addition, multiple in vitro studies have shown that the cholesterol biosynthesis inhibitor lovastatin reduces DENV replication [8,9,40] and also increases the survival rate of DENV-infected mice by delaying the progression of disease [41].
We found that although HDL-C and LDL-C both decreased over the course of dengue illness, there were greater decreases in LDL-C among dengue-positive patients compared to patients with OFI, suggesting that the reduction in LDL-C is likely driving the decrease in total serum cholesterol. This finding is supported by that of Seet and colleagues, who found greater decreases in LDL-C compared to HDL-C among DF cases during the acute and critical phases of dengue compared to levels during convalescence [20]. In vitro studies have shown that the related hepatitis C virus can enter cells via LDL receptors [7], and increased expression of LDL receptors in Huh-7 cells has been reported after DENV infection, triggering an increased uptake of LDL particles in infected compared to non-infected cells [15]. Our finding of lower HDL-C levels in severe dengue cases compared to mild dengue cases is intriguing. An in vitro study by Li and colleagues has shown that ApoAI, a major HDL apolipoprotein, binds to DENV and is associated with enhanced virus infection [42]. Therefore, the decrease in HDL-C observed among severe cases may be due to lack of available ApoAI, possibly in addition to reduced ApoAI production due to liver dysfunction.
We also found that lower total serum cholesterol and LDL-C levels at presentation were associated with subsequent risk of developing severe dengue using both the WHO 1997 and WHO 2009 dengue severity classifications. In addition, HDL-C level at presentation was associated with subsequent risk of developing severe dengue using the WHO 2009 classification. Suvarna and colleagues similarly showed that LDL-C and HDL-C levels were associated with higher odds of DHF [18]. However, while previous studies have shown differences in total serum cholesterol levels by dengue severity using basic statistical tests, they did not find statistically significant associations between lower total cholesterol and severe dengue using multivariable models [19]. A major strength of our study is that we had prospective follow-up of dengue patients over the course of their illness, which allowed us to account for time ordering of our exposure (cholesterol) before our outcome (severe dengue). By restricting our analyses to patients who were classified as mild dengue at presentation and, if they developed severe dengue, developed severe dengue >12 hours after presentation, we were able to assess the effect of cholesterol at presentation on development of severe dengue without confounding it with the effect of severe dengue on cholesterol. The ability to account for time ordering is likely the reason for the differences in our results compared to those of other studies.
In our study, we analyzed severe dengue using three different dengue severity classifications. Although the WHO released a revised classification scheme in 2009 [22], it has been somewhat controversial with some arguing that it may result in the misclassification of mild dengue cases as severe or be better suited as a screening test in older children and adults [32,43,44]. In one study, Narvaez and colleagues show that while the revised scheme had higher

26
sensitivity and specificity to identify cases in need of intensive clinical intervention, it was less specific to a particular pathophysiology (e.g., vascular leakage leading to shock) than the traditional 1997 classification scheme [45]. In our study, total serum cholesterol, LDL-C and HDL-C levels at presentation were all associated with increased risk of development of severe dengue using the WHO 2009 classification. Using the WHO 1997 classification, total serum cholesterol and LDL-C had only borderline associations and HDL-C was not associated with risk of development of severe dengue. The reason for the statistical differences between the WHO classifications is unclear. However, the statistically significant association of LDL-C with development of severe dengue in both classifications may suggest its greater role compared to HDL-C as the cholesterol type affecting development of severe dengue. Interestingly, using standardized intervention categories, none of the cholesterol types were associated with risk of development of severe dengue. These results suggest that the association of cholesterol with severe dengue outcome is specific to the pathogenesis of severe dengue and not just the pathogenesis of severe illness. Although previous studies have associated low cholesterol with critical illness [46] and more hospital admissions for infectious disease [47], it is possible that not accounting for time ordering or confounders may explain these associations or that other infectious diseases may share similar pathogenic pathways.
Our study had several methodological strengths. We used a directed acyclic graph to guide the construction of our statistical models to ensure that we only adjusted for plausible confounders, thereby avoiding bias. Although our directed acyclic graph is considered a working diagram and therefore could be modified in the future, it is a transparent approach to model-building that relies on our current knowledge rather than the statistical significance of covariates, which may, in fact, reflect relationships with parameters other than the outcome. We also used statistical methods that enabled calculation of the cumulative incidence ratio (relative risk) rather than the odds ratio, which may overestimate the relationship between cholesterol and dengue outcome when disease is common [48]. In addition, our study design compared the trajectories of cholesterol levels in dengue cases to those in patients with OFI rather than to those in healthy controls. Patients with OFI, not healthy individuals, are the individuals who present as suspected dengue cases to clinics and hospitals and therefore are the more relevant comparison group for dengue cases.
Our study did have some limitations. It would have been interesting to examine changes in cholesterol levels from baseline values in individuals with dengue over the course of illness. While pre-infection levels would be very difficult to obtain, convalescent samples could have provided a reasonable estimate of baseline values. Unfortunately, cholesterol measurements were not routinely performed on these samples. LDL-C was not measured in the first two of the nine years of the hospital study, so we had somewhat fewer measurements available for analysis, and we did not measure triglycerides. As the third component of total serum cholesterol in addition to HDL-C and LDL-C, triglyceride levels would have helped us to understand whether LDL-C alone was driving the reduction in total cholesterol levels or whether triglycerides also contributed. In one study, triglycerides <150 mg/dl were estimated to increase the odds of DSS by 41%, although this association was not significant [18]. Finally, the MAC-ELISA test used in our study for detecting DENV-specific IgM antibodies is known to be cross-reactive with other circulating flaviviruses. However, West Nile virus infection is unlikely as it has rarely been detected in humans in Nicaragua [26,49], and yellow fever virus does not circulate in Nicaragua nor does the population receive the yellow fever vaccine.

27
Although of potential concern, the fact that we obtained non-fasting cholesterol measurements should not have affected our findings. Recent studies have found the impact of eating on cholesterol measurements to be very limited [50,51]. According to Langsted and colleagues, “Lipid profiles at most change minimally in response to normal food intake in individuals in the general population” [51]. In their study, the maximum changes in lipid profiles after normal food and fluid intake from fasting levels were 0.2 mmol/L for total cholesterol, 0.2 mmol/L for low-density lipoprotein cholesterol, and 0.1 mmol/L for HDL cholesterol [51]. In addition, eating should not influence the relationship between cholesterol and severe dengue outcome because eating was not a confounder in our directed acyclic graph (see Supplementary Figure 1).
In summary, our results show that lower total serum cholesterol and LDL-C levels at presentation were associated with subsequent risk of developing severe dengue using WHO dengue severity classifications and suggest that the reduction in LDL-C is likely driving the decreases observed in total serum cholesterol levels among dengue-positive patients. In addition, they indicate that cholesterol level at presentation may serve as a potential predictor of severe dengue. The burden of dengue is expected to continue to increase in the future due to climate change, globalization, travel, trade, urbanization, socioeconomics, viral evolution and other factors [52]. Therefore, time is of the essence for developing better diagnostic and prognostic tools to identify severe dengue cases for the provision of appropriate supportive care and hopefully, one day, treatment. Cholesterol and other routine laboratory markers should be explored as a lower cost and more sustainable approach to developing a biomarker panel to discriminate severe dengue from mild dengue cases.

28
5. Tables and figures
Figure 1. Eligibility flow chart.
Of the 1,440 patients who presented to the hospital with suspected dengue, 1,236 met the eligibility criteria and were included in the analysis. Abbreviations: BMI, body mass index; HDL-C, high-density lipoprotein cholesterol; LDL-C, low-density lipoprotein cholesterol.
1,440 patients with suspected dengue
Exclusion criteria n = 69 patients <1 year-old n = 11 patients with nephrotic syndrome n = 9 obese patients (BMI ≥32)
Missing data n = 69 patients missing all cholesterol measurements n = 2 patients with inadequate samples n = 44 patients with indeterminate result of dengue testing
1,236 patients included in analysis
Confirmed dengue n = 789
Other febrile illness n = 447
Measurements n = 2,232 Total serum cholesterol n = 2,149 HDL-C n = 1,854 LDL-C
Measurements n = 1,243 Total serum cholesterol n = 1,191 HDL-C n = 946 LDL-C

29
Figure 2. Age- and gender-adjusted marginal mean cholesterol levels (mg/dl) by DENV infection status and day of illness.
The day of fever onset was defined as day 1 of illness. A, Total serum cholesterol levels were significantly lower in dengue-positive patients compared to dengue-negative patients on days 3-8 of illness (p<0.05). Among dengue-positive patients, LDL-C levels decreased from day 2-6 of illness, and then increased from day 6-8 of illness. However, among dengue-negative patients, total serum cholesterol levels gradually increased from day 2-8 of illness. B, Trajectories of LDL-C levels were similar to those of total serum cholesterol levels. Among dengue-positive patients, LDL-C levels decreased from day 2-6 of illness, and then increased from day 6-8 of illness. Among dengue-negative patients, LDL-C levels gradually increased from day 2-8 of illness. LDL-C levels were significantly lower in dengue-positive patients compared to dengue-negative patients on days 4-8 of illness (p<0.0001). In contrast to LDL-C, HDL-C levels were significantly lower only on days 5-7 of illness (p<0.001). HDL-C levels followed a similar trajectory among both dengue-positive and dengue-negative patients, decreasing from day 2 to day 6-7 of illness before stabilizing on day 7-8 of illness. Abbreviations: DENV, dengue virus; LDL-C, low-density lipoprotein cholesterol; HDL-C, high-density lipoprotein cholesterol.

30
Figure 3. Age- and gender-adjusted marginal mean cholesterol levels (mg/dl) by dengue severity classification and day of illness.
For the WHO 1997 classification, mild dengue was defined as DF and severe dengue was defined as DHF/DSS. For the WHO 2009 classification, mild dengue was defined as DWS and severe dengue was defined as SD. For the standardized intervention categories, mild dengue was defined as IC 1/IC 2 care and severe dengue was defined as IC 3 care. The day of fever onset was defined as day 1 of illness. A, B, C, Total serum cholesterol levels were significantly lower in patients who developed severe dengue compared to patients with mild dengue on days 4-7 of illness using the WHO 2009 classification and standardized intervention categories (p<0.001), and on days 5-7 of illness using the WHO 1997 classification (p<0.001). Regardless of dengue outcome, total serum cholesterol levels decreased from day 2-6 and increased from day 6-8 of illness. D, E, F, LDL-C levels were significantly lower in patients who developed severe dengue compared to patients with mild dengue on days 5-7 of illness using the WHO 1997 classification (p<0.01), days 2-7 of illness using the WHO 2009 classification (p<0.01), and day 2 and days 5-7 of illness using standardized intervention categories (p≤0.01). Regardless of dengue outcome, LDL-C levels decreased from day 2-6 and increased from day 6-8 of illness. HDL-C levels were significantly lower in patients who developed severe dengue compared to patients with mild dengue on days 5-8 of illness using the WHO 1997 classification (p≤0.001), days 3-8 of illness using the WHO 2009 classification (p≤0.01), and days 4-7 of illness using standardized intervention categories (p<0.01). Regardless of dengue outcome, HDL-C levels decreased from day 2-7 of illness before stabilizing on day 8 of illness. Abbreviations: WHO, World Health Organization; LDL-C, low-density lipoprotein cholesterol; HDL-C, high-density lipoprotein cholesterol; DF, dengue fever; DHF/DSS, dengue hemorrhagic fever/dengue shock syndrome; DWS, dengue with or without warning signs; SD, severe dengue; IC, intervention category.
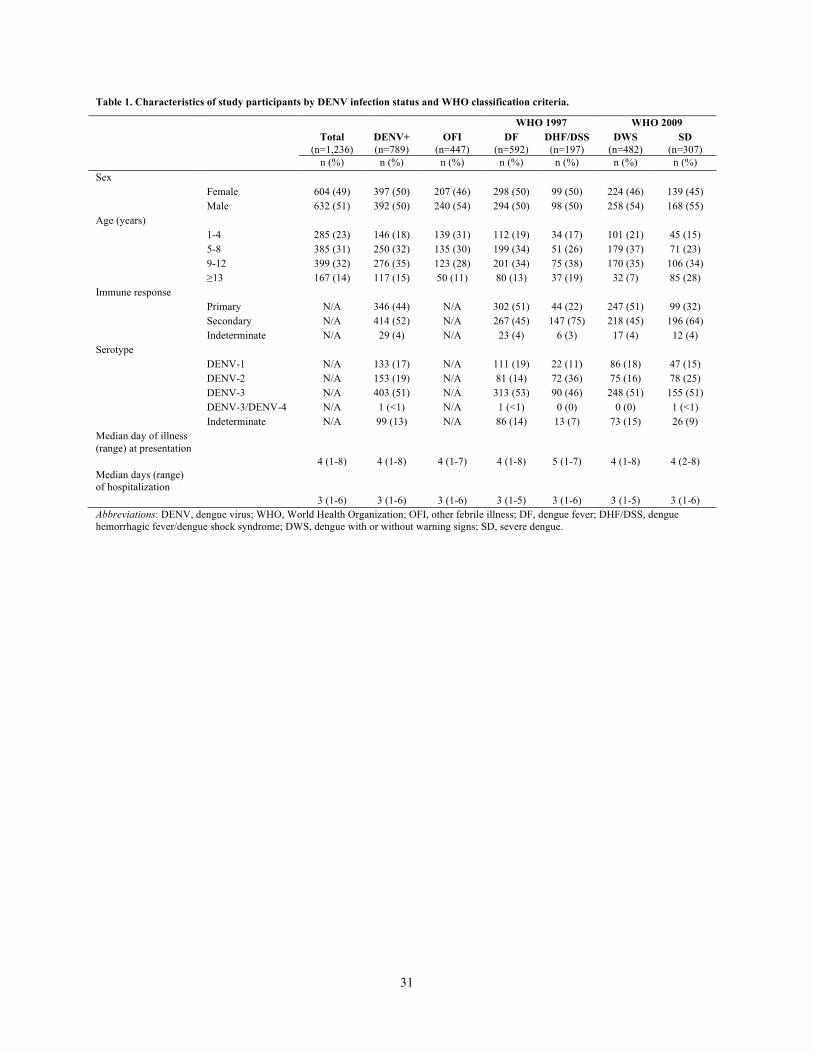
31
Table 1. Characteristics of study participants by DENV infection status and WHO classification criteria.
WHO 1997 WHO 2009 Total
(n=1,236) DENV+ (n=789)
OFI (n=447)
DF (n=592)
DHF/DSS (n=197)
DWS (n=482)
SD (n=307)
n (%) n (%) n (%) n (%) n (%) n (%) n (%) Sex Female 604 (49) 397 (50) 207 (46) 298 (50) 99 (50) 224 (46) 139 (45) Male 632 (51) 392 (50) 240 (54) 294 (50) 98 (50) 258 (54) 168 (55) Age (years) 1-4 285 (23) 146 (18) 139 (31) 112 (19) 34 (17) 101 (21) 45 (15) 5-8 385 (31) 250 (32) 135 (30) 199 (34) 51 (26) 179 (37) 71 (23) 9-12 399 (32) 276 (35) 123 (28) 201 (34) 75 (38) 170 (35) 106 (34) ≥13 167 (14) 117 (15) 50 (11) 80 (13) 37 (19) 32 (7) 85 (28) Immune response Primary N/A 346 (44) N/A 302 (51) 44 (22) 247 (51) 99 (32) Secondary N/A 414 (52) N/A 267 (45) 147 (75) 218 (45) 196 (64) Indeterminate N/A 29 (4) N/A 23 (4) 6 (3) 17 (4) 12 (4) Serotype DENV-1 N/A 133 (17) N/A 111 (19) 22 (11) 86 (18) 47 (15) DENV-2 N/A 153 (19) N/A 81 (14) 72 (36) 75 (16) 78 (25) DENV-3 N/A 403 (51) N/A 313 (53) 90 (46) 248 (51) 155 (51) DENV-3/DENV-4 N/A 1 (<1) N/A 1 (<1) 0 (0) 0 (0) 1 (<1) Indeterminate N/A 99 (13) N/A 86 (14) 13 (7) 73 (15) 26 (9) Median day of illness (range) at presentation
4 (1-8) 4 (1-8) 4 (1-7) 4 (1-8) 5 (1-7) 4 (1-8) 4 (2-8) Median days (range) of hospitalization
3 (1-6) 3 (1-6) 3 (1-6) 3 (1-5) 3 (1-6) 3 (1-5) 3 (1-6) Abbreviations: DENV, dengue virus; WHO, World Health Organization; OFI, other febrile illness; DF, dengue fever; DHF/DSS, dengue hemorrhagic fever/dengue shock syndrome; DWS, dengue with or without warning signs; SD, severe dengue.

32
Table 2. Effect of cholesterol level at presentation on development of severe dengue outcome using the WHO 1997 disease severity classification.
Cholesterol type Total serum cholesterol LDL-C HDL-C RR (95% CI) RR (95% CI) RR (95% CI) Cholesterol per -10 mg/dl 1.09 (1.00-1.19) 1.12 (1.00-1.26) 1.18 (0.98-1.42) Age (years) 1.06 (1.00-1.14) 1.06 (0.99-1.14) 1.06 (0.99-1.13) Female 1.04 (0.69-1.56) 0.99 (0.64-1.51) 0.96 (0.63-1.45) Malnutrition 0.76 (0.33-1.75) 0.73 (0.29-1.80) 0.78 (0.34-1.78) Secondary immune response 1.98 (1.22-3.19) 1.91 (1.17-3.14) 1.85 (1.15-2.98)
Severe dengue outcome was modeled by cholesterol at presentation, age, gender, malnutrition and immune response using modified Poisson models with robust standard errors. For the WHO 1997 disease severity classification, severe dengue outcome was defined as DHF/DSS and mild dengue outcome, the reference group, was defined as DF. Abbreviations: WHO, World Health Organization; LDL-C, low-density lipoprotein cholesterol; HDL-C, high-density lipoprotein cholesterol; DHF/DSS, dengue hemorrhagic fever/dengue shock syndrome; DF, dengue fever.

33
Table 3. Effect of cholesterol level at presentation on development of severe dengue outcome using the WHO 2009 disease severity classification.
Cholesterol type Total serum cholesterol LDL-C HDL-C RR (95% CI) RR (95% CI) RR (95% CI) Cholesterol per -10 mg/dl 1.17 (1.06-1.29) 1.23 (1.08-1.41) 1.25 (1.03-1.51) Age (years) 1.12 (1.05-1.21) 1.14 (1.06-1.22) 1.15 (1.07-1.24) Female 0.98 (0.64-1.51) 1.02 (0.65-1.58) 0.90 (0.58-1.39) Malnutrition 1.31 (0.68-2.56) 1.35 (0.67-2.72) 1.22 (0.61-2.45) Secondary immune response 1.77 (1.06-2.98) 1.82 (1.08-3.09) 1.90 (1.12-3.21) Severe dengue outcome was modeled by cholesterol at presentation, age, gender, malnutrition and immune response using modified Poisson models with robust standard errors. For the WHO 2009 disease severity classification, severe dengue outcome was defined as SD and mild dengue outcome, the reference group, was defined as DWS. Abbreviations: WHO, World Health Organization; LDL-C, low-density lipoprotein cholesterol; HDL-C, high-density lipoprotein cholesterol; SD, severe dengue; DWS, dengue with or without warning signs.
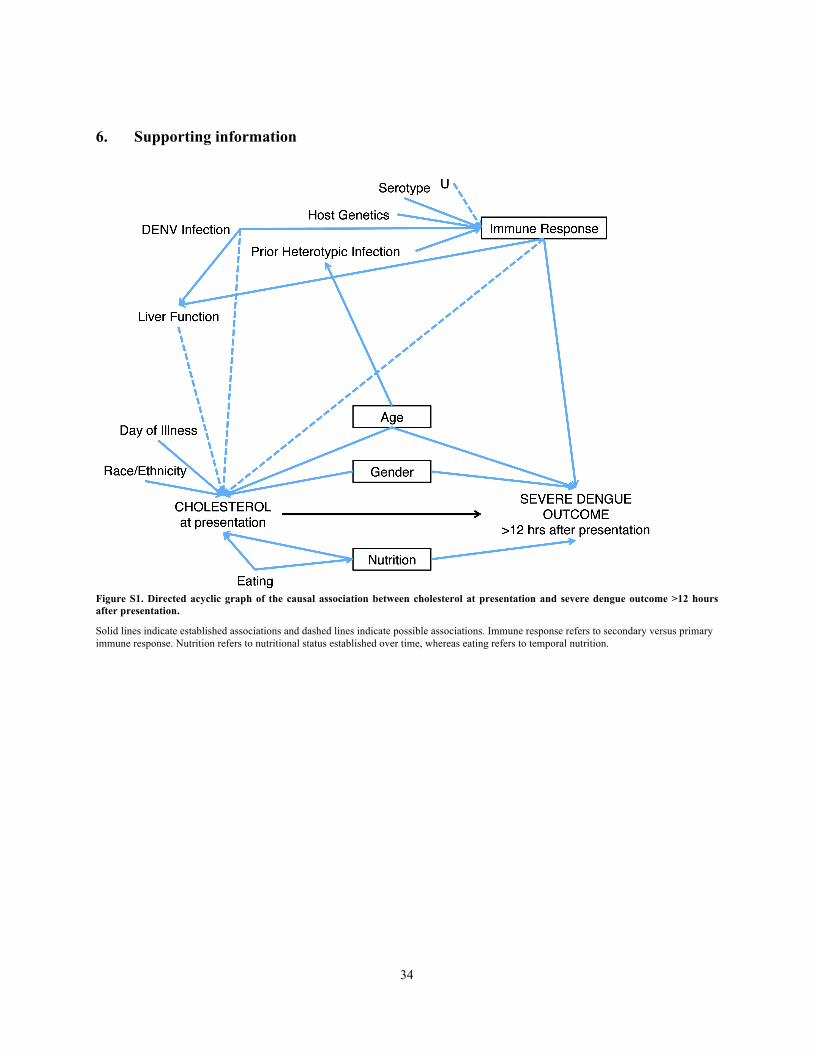
34
34
6. Supporting information
Figure S1. Directed acyclic graph of the causal association between cholesterol at presentation and severe dengue outcome >12 hours after presentation.
Solid lines indicate established associations and dashed lines indicate possible associations. Immune response refers to secondary versus primary immune response. Nutrition refers to nutritional status established over time, whereas eating refers to temporal nutrition.
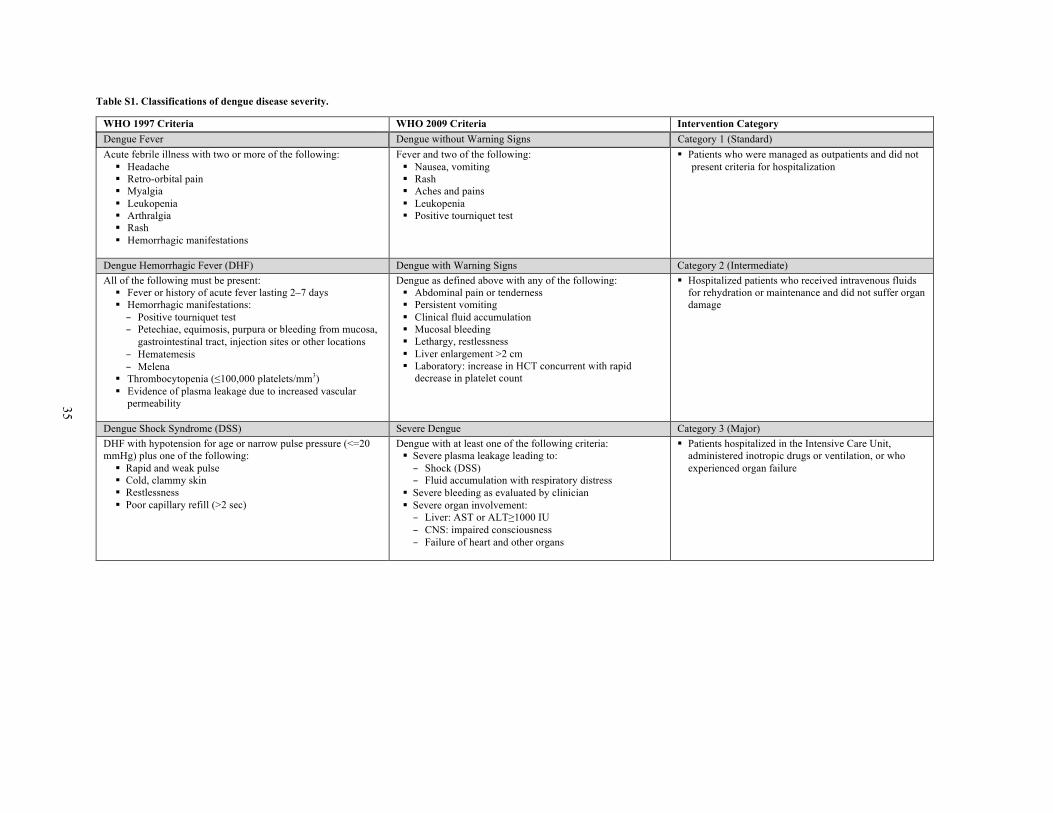
35
Table S1. Classifications of dengue disease severity.
WHO 1997 Criteria WHO 2009 Criteria Intervention Category Dengue Fever Dengue without Warning Signs Category 1 (Standard) Acute febrile illness with two or more of the following:
§ Headache § Retro-orbital pain § Myalgia § Leukopenia § Arthralgia § Rash § Hemorrhagic manifestations
Fever and two of the following: § Nausea, vomiting § Rash § Aches and pains § Leukopenia § Positive tourniquet test
§ Patients who were managed as outpatients and did not present criteria for hospitalization
Dengue Hemorrhagic Fever (DHF) Dengue with Warning Signs Category 2 (Intermediate) All of the following must be present:
§ Fever or history of acute fever lasting 2–7 days § Hemorrhagic manifestations: – Positive tourniquet test – Petechiae, equimosis, purpura or bleeding from mucosa,
gastrointestinal tract, injection sites or other locations – Hematemesis – Melena
§ Thrombocytopenia (≤100,000 platelets/mm3) § Evidence of plasma leakage due to increased vascular
permeability
Dengue as defined above with any of the following: § Abdominal pain or tenderness § Persistent vomiting § Clinical fluid accumulation § Mucosal bleeding § Lethargy, restlessness § Liver enlargement >2 cm § Laboratory: increase in HCT concurrent with rapid
decrease in platelet count
§ Hospitalized patients who received intravenous fluids for rehydration or maintenance and did not suffer organ damage
Dengue Shock Syndrome (DSS) Severe Dengue Category 3 (Major) DHF with hypotension for age or narrow pulse pressure (<=20 mmHg) plus one of the following:
§ Rapid and weak pulse § Cold, clammy skin § Restlessness § Poor capillary refill (>2 sec)
Dengue with at least one of the following criteria: § Severe plasma leakage leading to: – Shock (DSS) – Fluid accumulation with respiratory distress
§ Severe bleeding as evaluated by clinician § Severe organ involvement: – Liver: AST or ALT≥1000 IU – CNS: impaired consciousness – Failure of heart and other organs
§ Patients hospitalized in the Intensive Care Unit, administered inotropic drugs or ventilation, or who experienced organ failure

36
7. References 1. Brady OJ, Gething PW, Bhatt S, Messina JP, Brownstein JS, et al. (2012) Refining the global spatial limits of dengue virus transmission by evidence-based consensus. PLoS Negl Trop Dis 6: e1760.
2. Bhatt S, Gething PW, Brady OJ, Messina JP, Farlow AW, et al. (2013) The global distribution and burden of dengue. Nature 496: 504–507.
3. Kyle JL, Harris E (2008) Global spread and persistence of dengue. Annu Rev Microbiol 62: 71–92.
4. Lee C-J, Lin H-R, Liao C-L, Lin Y-L (2008) Cholesterol effectively blocks entry of flavivirus. J Virol 82: 6470–6480.
5. Das S, Chakraborty S, Basu A (2010) Critical role of lipid rafts in virus entry and activation of phosphoinositide 3’ kinase/Akt signaling during early stages of Japanese encephalitis virus infection in neural stem/progenitor cells. J Neurochem 115: 537–549. 6. Medigeshi GR, Hirsch AJ, Streblow DN, Nikolich-Zugich J, Nelson J a (2008) West Nile virus entry requires cholesterol-rich membrane microdomains and is independent of alphavbeta3 integrin. J Virol 82: 5212–5219.
7. Agnello V, Abel G, Elfahal M, Knight GB, Zhang QX (1999) Hepatitis C virus and other flaviviridae viruses enter cells via low density lipoprotein receptor. Proc Natl Acad Sci U S A 96: 12766–12771. 8. Peña J, Harris E (2012) Early dengue virus protein synthesis induces extensive rearrangement of the endoplasmic reticulum independent of the UPR and SREBP-2 pathway. PLoS One 7: e38202.
9. Rothwell C, Lebreton A, Young Ng C, Lim JYH, Liu W, et al. (2009) Cholesterol biosynthesis modulation regulates dengue viral replication. Clin Infect Dis 389: 8–19.
10. Whitehorn J, Van Vinh Chau N, Truong NT, Tai LTH, Van Hao N, et al. (2012) Lovastatin for adult patients with dengue: protocol for a randomised controlled trial. Trials 13: 203. 11. Gutsche I, Coulibaly F, Voss JE, Salmon J, d’Alayer J, et al. (2011) Secreted dengue virus nonstructural protein NS1 is an atypical barrel-shaped high-density lipoprotein. Proc Natl Acad Sci U S A 108: 8003–8008.
12. Cui L, Lee YH, Kumar Y, Xu F, Lu K, et al. (2013) Serum metabolome and lipidome changes in adult patients with primary dengue infection. PLoS Negl Trop Dis 7: e2373.
13. Heaton NS, Perera R, Berger KL, Khadka S, Lacount DJ, et al. (2010) Dengue virus nonstructural protein 3 redistributes fatty acid synthase to sites of viral replication and increases cellular fatty acid synthesis. Proc Natl Acad Sci U S A 107: 17345–17350. 14. Mackenzie JM, Khromykh A a, Parton RG (2007) Cholesterol manipulation by West Nile virus perturbs the cellular immune response. Cell Host Microbe 2: 229–239. 15. Soto-Acosta R, Mosso C, Cervantes-Salazar M, Puerta-Guardo H, Medina F, et al. (2013) The increase in cholesterol levels at early stages after dengue virus infection correlates with an augment in LDL particle uptake and HMG-CoA reductase activity.
37
Virology 3: 1–16. 16. Ray G, Kumar V, Kapoor a K, Dutta a K, Batra S (1999) Status of antioxidants and other biochemical abnormalities in children with dengue fever. J Trop Pediatr 45: 4–7. 17. Van Gorp ECM, Suharti C, Mairuhu AT a, Dolmans WM V, van Der Ven J, et al. (2002) Changes in the plasma lipid profile as a potential predictor of clinical outcome in dengue hemorrhagic fever. Clin Infect Dis 34: 1150–1153.
18. Suvarna JC, Rane PP (2009) Serum lipid profile: a predictor of clinical outcome in dengue infection. Trop Med Int Health 14: 576–585.
19. Villar-Centeno LA, Díaz-Quijano FA, Martínez-Vega RA (2008) Biochemical alterations as markers of dengue hemorrhagic fever. Am J Trop Med Hyg 78: 370–374.
20. Seet RCS, Lee C-YJ, Lim ECH, Quek AML, Yeo LLL, et al. (2009) Oxidative damage in dengue fever. Free Radic Biol Med 47: 375–380.
21. World Health Organization (1997) Dengue haemorrhagic fever: diagnosis, treatment, prevention and control. 2nd ed. Geneva: World Health Organization.
22. World Health Organization (2009) Dengue: guidelines for diagnosis, treatment, prevention and control. New ed. Geneva: World Health Organization.
23. Alexander N, Balmaseda A, Coelho ICB, Dimaano E, Hien TT, et al. (2011) Multicentre prospective study on dengue classification in four South-east Asian and three Latin American countries. Trop Med Int Health 16: 936–948. 24. Hammond SN, Balmaseda A, Pérez L, Tellez Y, Saborío SI, et al. (2005) Differences in dengue severity in infants, children, and adults in a 3-year hospital-based study in Nicaragua. Am J Trop Med Hyg 73: 1063–1070.
25. Kuan G, Gordon A, Avilés W, Ortega O, Hammond SN, et al. (2009) The Nicaraguan pediatric dengue cohort study: study design, methods, use of information technology, and extension to other infectious diseases. Am J Epidemiol 170: 120–129. 26. Balmaseda A, Hammond SN, Tellez Y, Imhoff L, Rodriguez Y, et al. (2006) High seroprevalence of antibodies against dengue virus in a prospective study of schoolchildren in Managua, Nicaragua. Trop Med Int Health 11: 935–942.
27. Harris E, Videa E, Pérez L, Sandoval E, Téllez Y, et al. (2000) Clinical, epidemiologic, and virologic features of dengue in the 1998 epidemic in Nicaragua. Am J Trop Med Hyg 63: 5–11. 28. Fernandez R, Vázquez S (1990) Serological diagnosis of dengue by an ELISA inhibition method (EIM). Mem Inst Oswaldo Cruz 85: 347–351. 29. Reed L, Muench H, American THE (1938) A simple method of estimating fifty percent endpoints. Am J Epidemiol 27: 493–497. 30. Lanciotti RS, Calisher CH, Gubler DJ, Chang GJ, Vorndam a V (1992) Rapid detection and typing of dengue viruses from clinical samples by using reverse transcriptase-polymerase chain reaction. J Clin Microbiol 30: 545–551.
31. Gutierrez G, Standish K, Narvaez F, Perez MA, Saborio S, et al. (2011) Unusual dengue virus 3 epidemic in Nicaragua, 2009. PLoS Negl Trop Dis 5: e1394.
38
32. Gutiérrez G, Gresh L, Pérez MÁ, Elizondo D, Avilés W, et al. (2013) Evaluation of the diagnostic utility of the traditional and revised WHO dengue case definitions. PLoS Negl Trop Dis 7: e2385. 33. Muller CJ, MacLehose RF (2014) Estimating predicted probabilities from logistic regression: different methods correspond to different target populations. Int J Epidemiol 43: 962–970.
34. Zou G (2004) A Modified Poisson Regression Approach to Prospective Studies with Binary Data. Am J Epidemiol 159: 702–706.
35. Greenland S, Pearl J, Robins JM (1999) Causal Diagrams for Epidemiologic Research. Epidemiology 10: 37–48.
36. Centers for Disease Control and Prevention (2001) Data table of BMI-for-age charts. Available: http://www.cdc.gov/growthcharts/html_charts/bmiagerev.htm. Accessed 16 June 2014. 37. Gómez F, Ramos Galvan R, Frenk S, Cravioto Muñoz J, Chávez R, et al. (2000) Mortality in second and third degree malnutrition. 1956. Bull World Health Organ 78: 1275–1280.
38. Lee LK, Gan VC, Lee VJ, Tan AS, Leo YS, et al. (2012) Clinical relevance and discriminatory value of elevated liver aminotransferase levels for dengue severity. PLoS Negl Trop Dis 6: e1676. 39. Berg J, Tymoczko J, Stryer L (2002) The Complex Regulation of Cholesterol Biosynthesis Takes Place at Several Levels. Biochemistry. New York: WH Freeman. 40. Martínez-Gutierrez M, Castellanos JE, Gallego-Gómez JC (2011) Statins reduce dengue virus production via decreased virion assembly. Intervirology 54: 202–216. 41. Martinez-Gutierrez M, Correa-Londoño L a, Castellanos JE, Gallego-Gómez JC, Osorio JE (2014) Lovastatin delays infection and increases survival rates in AG129 mice infected with dengue virus serotype 2. PLoS One 9: e87412.
42. Li Y, Kakinami C, Li Q, Yang B, Li H (2013) Human apolipoprotein A-I is associated with dengue virus and enhances virus infection through SR-BI. PLoS One 8: e70390. 43. Macedo G a, Gonin MLC, Pone SM, Cruz OG, Nobre FF, et al. (2014) Sensitivity and specificity of the World Health Organization dengue classification schemes for severe dengue assessment in children in Rio de Janeiro. PLoS One 9: e96314.
44. Van de Weg C a M, van Gorp ECM, Supriatna M, Soemantri A, Osterhaus ADME, et al. (2012) Evaluation of the 2009 WHO dengue case classification in an Indonesian pediatric cohort. Am J Trop Med Hyg 86: 166–170. 45. Narvaez F, Gutierrez G, Pérez MA, Elizondo D, Nuñez A, et al. (2011) Evaluation of the traditional and revised WHO classifications of Dengue disease severity. PLoS Negl Trop Dis 5: e1397.
46. Gordon BR, Parker TS, Levine DM, Saal SD, Wang JC, et al. (1996) Low lipid concentrations in critical illness: implications for preventing and treating endotoxemia.

39
Crit Care Med 24: 584–589. 47. Iribarren C, Jacobs DR, Sidney S, Claxton a J, Feingold KR (1998) Cohort study of serum total cholesterol and in-hospital incidence of infectious diseases. Epidemiol Infect 121: 335–347.
48. McNutt L-A (2003) Estimating the Relative Risk in Cohort Studies and Clinical Trials of Common Outcomes. Am J Epidemiol 157: 940–943.
49. Monge Maillo B, López-Vélez R, Norman F, de Ory F, Sanchez-Seco MP, et al. (2008) Importation of West Nile virus infection from Nicaragua to Spain. Emerg Infect Dis 14: 1171–1173. 50. Steiner MJ, Skinner AC, Perrin EM (2011) Fasting might not be necessary before lipid screening: a nationally representative cross-sectional study. Pediatrics 128: 463–470.
51. Langsted A, Freiberg JJ, Nordestgaard BG (2008) Fasting and nonfasting lipid levels: influence of normal food intake on lipids, lipoproteins, apolipoproteins, and cardiovascular risk prediction. Circulation 118: 2047–2056. 52. Murray NEA, Quam MB, Wilder-Smith A (2013) Epidemiology of dengue: past, present and future prospects. Clin Epidemiol 5: 299–309.

40
Chapter 3: Individual-, Household- and Neighborhood-level Determinants of Dengue Virus
Seropositivity in a Community-based Cohort in Managua, Nicaragua 1. Introduction
An estimated 4 billion individuals are at risk of dengue virus (DENV) infection, which causes dengue fever, an acute febrile illness that manifests with retro-orbital pain, rash, and severe myalgia and arthralgia [1]. In some cases, illness progresses to dengue hemorrhagic fever or dengue shock syndrome, which are characterized by vascular leakage leading to hypovolemic shock and a case-fatality proportion of up to 5% [2]. Dengue has become a major public health concern in the Americas over the last three decades, with a dramatic increase in number and severity of reported cases and the co-circulation of multiple DENV serotypes [3]. In Nicaragua, the first documented dengue epidemic occurred in 1985 [4], and Nicaragua has experienced cyclic dengue epidemics caused by varying predominant serotypes since then [5–7].
The four DENV serotypes are transmitted to humans by the bite of the daytime-biting mosquitos, Aedes aegypti and Ae. albopictus. Ae. aegypti, the principal vector of DENV in Nicaragua, lives and breeds in urban and peri-urban domestic environments [8]. However, the spatial distribution of dengue cases in dengue-endemic countries can be very heterogeneous within urban areas [9–16]. Vector breeding and subsequent DENV transmission are determined by a complex interplay of ecological, biological and social factors [17,18] that affect risk of DENV infection at the individual, household and neighborhood levels. At the individual level, older age and lower education levels have been associated with increased risk of DENV seropositivity [5,11,19,20]. At the household level, factors such as routine house-to-house human movement [9]; housing conditions, including the quality of housing, presence of window screens, and use of air conditioning [21–23]; and socioeconomic factors, such as household income, household crowding, and access to public water service [11,22,24–26], have all been shown to affect risk of DENV infection. At the neighborhood level, risk of DENV infection has been associated with population density [27–29], vegetation cover [30], presence of certain types of public spaces and commercial businesses [19,31,32], and presence of commercial activity areas with high human movement [13]. In addition, vector control practices, such as cleaning or disposal of water storage containers and use of insecticides [33], affect risk of DENV infection at both the household and neighborhood levels.
Several studies have shown that community mobilization to reduce Ae. aegypti breeding sites has been effective in decreasing entomological indices [34], and a recent cluster-randomized controlled trial in Nicaragua and Mexico found that it also reduced risk of DENV infection in children [35]. Given the demonstrated effectiveness of community-based programs, it is important to identify environments that could benefit from intervention at a community level in order to have the greatest impact on preventing dengue and to target limited resources. In Nicaragua, there have been no published studies analyzing differences in DENV seroprevalence and determinants of these differences in urban neighborhoods. The aim of this study was to identify individual-, household- and neighborhood-level risk factors for DENV infection among children living in urban neighborhoods in Managua, Nicaragua, using five years of seroprevalence

41
and socioeconomic and risk factor survey data from a community-based cohort. DENV infection was measured by its proxy parameter, dengue IgG seropositivity, which detects past DENV infection. We also sought to determine the seroprevalence of DENV infection and identify individual- and household-level risk factors for DENV infection in neighborhood groups categorized by similar socioeconomic, infrastructural and ecological characteristics. Last, we describe the ecological and social characteristics of these neighborhood groups in order to explore intra-urban differences in DENV infection that could be valuable in targeting vector control efforts.
2. Methods Study site and participants
In August 2004, a community-based pediatric cohort was established in District II of Managua, Nicaragua, an urban, low-to-middle income district with an area of 9.2 km2 and a population of approximately 62,000 [36]. The streets of District II are mostly paved and the neighborhoods have electricity, garbage collection three times per week, and access to public water service ranging from 0 to 24 hours per day. Study activity was based at the Health Center Sócrates Flores Vivas, a public facility that is the primary source of health care for District II residents. Briefly, participants aged 2-9 years were recruited through house-to-house visits in all neighborhoods served by the health center [36]. The parent or legal guardian of each participant signed an informed consent form, and children ≥6 years old provided verbal assent. In 2007, participants <11 years old were given the opportunity to continue for an additional three years, and informed consent was again obtained. Additional two year-olds were enrolled each year to maintain the age structure of the cohort. Ethics statement
The study was approved by the institutional review boards of the University of California, Berkeley, the Nicaraguan Ministry of Health, and the International Vaccine Institute in Seoul, Korea. Parents or legal guardians of all subjects in both studies provided written informed consent, and subjects ≥6 years old provided assent.
Data collection Upon enrollment, parents or legal guardians of all participants were encouraged to
bring their child(ren) to the health center at the first sign of illness or fever. Study physicians and nurses, trained in identification of possible dengue cases, provided medical care for study participants.
Febrile illnesses that met WHO criteria for suspected dengue and those without other apparent origin (undifferentiated febrile illnesses) were treated as possible dengue cases and followed daily while fever or symptoms persisted through visits with study medical personnel. Complete blood counts were completed every 48 hours or more frequently, as necessary. Cases were monitored closely for severe manifestations and were transferred by study personnel to the Infectious Disease Ward of the Manuel de Jesús Rivera Children’s Hospital, the national pediatric reference hospital, when they presented with any signs of alarm. In addition, an annual blood sample was collected

42
from healthy participants each March and April to identify all DENV infections during the previous year and for baseline complete blood counts.
From 2008-2013, participants were asked to participate in an annual socioeconomic and risk factor survey. Data were collected on parents’ education, indices of household crowding, access to public water service, and other factors. In 2009-2010, only one annual survey, condensed from the previous survey to contain only socioeconomic questions and administered in December 2009 and January 2010, was completed due to funding shortfalls. This survey was administered to new participants in 2009-2010 or participants who had moved to a new dwelling in 2009-2010. Otherwise, answers from continuing participants were assumed to remain constant from 2008. Neighborhood information was collected in 2008 and updated at the time of the annual blood sample collection. Current neighborhood information was also maintained throughout the study on all participants. Dengue seroprevalence testing
Samples collected from participants during the annual blood draw were screened for anti-DENV IgG antibodies using a single-dilution Inhibition ELISA, which has been previously evaluated in Nicaragua against the Hemagglutinin Inhibition Assay [20,21]. This method detects all four DENV serotypes, but does not differentiate between them. Participants with a titer of ≥10 were considered seropositive for DENV infection. Each year, paired samples from all previously seronegative participants were processed side-by-side (previous year and current year) using the single-dilution Inhibition ELISA in order to capture new primary DENV infections.
Individual- and household-level factors Individual-level factors measured were age, gender, and school attendance.
Household-level factors measured were number of persons living in the household, number of rooms used for sleeping in the house, hours of public water service per day, number of fans owned, housing material, flooring material, home ownership, vehicle ownership, mother’s education level, and father’s education level. Household crowding index was calculated from the number of persons living in the household divided by the number of rooms used for sleeping in the house. The index was then categorized as <3, 3-4 and ≥5 persons per sleeping room. Neighborhood-level factors
A map of the neighborhoods of Managua was created by the Nicaraguan Institute of Territorial Studies and then modified for the purposes of this study to focus on the 18 neighborhoods served by the Health Center Sócrates Flores Vivas (Figure 1). Population estimates were provided by the Nicaraguan Ministry of Health and were based on projections from the 2005 census data. Areas were obtained using ArcGIS 10 (Environmental Science Research Institute, Redlands, CA). Neighborhood population density was calculated by dividing the population estimate for each neighborhood by the area of the neighborhood. It was then categorized as low (1,700-11,000 persons per km2), medium (11,001-20,000 km2), medium-high (20,001-30,000 persons per km2) and high (30,001-57,000 persons per km2). Although population estimates and areas were available for all neighborhoods, population estimates for Manchester were counted with

43
those for San Sebastian, so population densities could not be calculated separately for these neighborhoods. For survey year 2009-2010, population estimates for 2009 and 2010 were averaged for each neighborhood.
Neighborhoods were visited by study staff at the Health Center Sócrates Flores Vivas and socioeconomic, infrastructural and ecological characteristics were recorded. By consensus among study staff, neighborhoods were then categorized by similar socioeconomic, infrastructural and ecological characteristics, which created six neighborhood groups for analysis (Table 1).
Statistical analysis Data from five years of the annual socioeconomic and risk factor survey (June 30,
2008–May 15, 2013) were available for analysis. Survey respondents with missing dengue testing results were excluded. We first calculated seroprevalence in the cohort by neighborhood group and survey year, and by neighborhood population density and survey year. To identify individual-, household- and neighborhood-level factors associated with DENV seropositivity, we calculated crude and adjusted odds ratios (ORs) with 95% confidence intervals (CIs) using repeated measures logistic regression (an exchangeable, working-within-subject correlation model via a generalized estimating equation [38]). We used a repeated measures approach in order to account for time-varying covariates (i.e., all individual-level, household-level, and neighborhood-level factors except for gender) on participants who were surveyed more than once. In multivariable analyses, ORs were adjusted for a subset of individual-, household- and neighborhood-level covariates, including age, gender, school attendance, household crowding, hours of public water service per day, number of fans owned, flooring material, home ownership, vehicle ownership, mother’s education level, father’s education level, neighborhood group, and neighborhood population density. We did not adjust for all covariates because some were highly collinear. We also examined individual- and household-level factors associated with DENV seropositivity by neighborhood group using multivariable models. All analyses were performed using STATA/SE 13.1.
3. Results
Table 2 shows the characteristics of the study population by survey year. After excluding an average of approximately 8% of survey respondents each year who had missing dengue testing results (n=504), a total of 5,026 participants were available for analysis. Participants were surveyed one or more times over the five years of the survey with approximately 3,400 participants surveyed each year. DENV seropositivity was relatively consistent by survey year. Most children of the parent or guardian who was surveyed were 6-13 years-old and attended school. Most of the households reported living with ≤4 persons per sleeping room, owning 1-4 fans, and having concrete housing without a dirt floor. The majority of households had no or <12 hours of public water service per day, and hours of public water service per day decreased over the years. Most survey respondents owned their homes, but the majority did not own a vehicle. In addition, most mothers and fathers had at least a secondary school education. Proportions of survey respondents from each of the six neighborhood groups were consistent from
44
2008-2013, and most neighborhoods had a medium population density (11,001-20,000 persons per km2).
As shown in Figure 2, dengue seroprevalence differed across the six neighborhood groups and monotonically decreased in all groups from 2009-2013 except for Group 6, in which the seroprevalence remained relatively stable over time. Neighborhood groups with no parks or recreation areas and low commercial activity (Groups 1 and 2) tended to have a lower seroprevalence than groups with parks and recreation areas and higher commercial activity (Groups 3-6). In addition, neighborhood groups with several public transport routes (Groups 4 and 5) had a higher seroprevalence compared to other groups except for Group 6. Dengue seroprevalence also differed by neighborhood population density (Figure 3). High and medium-high population density neighborhoods had higher seroprevalences compared to low and medium population density neighborhoods. Dengue seroprevalence decreased monotonically in neighborhoods of all population densities from 2009-2013.
Using bivariable and multivariable models, we examined individual, household, and neighborhood characteristics associated with DENV seropositivity (Table 3). In multivariable models adjusted for age, gender, school attendance, household crowding, hours of public water service per day, number of fans owned, flooring material, home ownership, vehicle ownership, mother’s education, father’s education, neighborhood group and neighborhood population density, older age and school attendance were individual characteristics found to be associated with higher odds of DENV seropositivity. Household characteristics associated with higher odds of DENV seropositivity included ≥5 persons per sleeping room and having a dirt floor, while household characteristics associated with lower odds of DENV seropositivity included no public water service and owning ≥5 fans. The child’s father having a secondary or technical or university level of education was associated with a lower odds of seropositivity, and the mother having a technical or university level of education was also associated with a lower odds of seropositivity, although it was of borderline significance. Living in a neighborhood with a medium-high or high population density was associated with a higher odds of seropositivity. In addition, living in a neighborhood group with high commercial activity (Groups 3-6) was associated with a higher odds of seropositivity compared to living in a group with low commercial activity (Group 1).
We also examined individual and household characteristics associated with DENV seropositivity by neighborhood group using multivariable models (Table 4). In all neighborhood groups, older age was associated with a higher odds of DENV seropositivity. However, the association between DENV seropositivity and other individual and household characteristics varied between neighborhood groups. School attendance was associated with a higher odds of DENV seropositivity in Group 4, but not in other neighborhood groups. Having a dirt floor was associated with a higher odds of DENV seropositivity in Groups 2, 5 and 6. However, having no public water service was associated with a lower odds of DENV seropositivity in Groups 2 and 3. Owning ≥5 fans was associated with a lower odds of seropositivity in Groups 1 and 4, owning a home was associated with a lower odds of DENV seropositivity in Group 2, and owning a vehicle was associated with a lower odds of DENV seropositivity in Group 4. The child’s mother having a secondary and/or technical or university level of education was associated with

45
a lower odds of seropositivity in Groups 1, 3 and 4, and the father having a secondary and/or technical or university level of education was associated with a lower odds of seropositivity in Groups 2 and 4.
4. Discussion In this study, we identified risk factors at the individual-, household- and
neighborhood-level associated with DENV seropositivity among children living in urban neighborhoods in Managua, Nicaragua. We found differences in seroprevalence between six neighborhood groups categorized by similar socioeconomic, infrastructural and ecological characteristics. In addition, we found that four of the neighborhood groups had a higher odds of seropositivity compared to the reference neighborhood group, and we identified individual and household characteristics associated with greater odds of seropositivity within neighborhood groups.
At the individual level, older age was consistently associated with a higher odds of seropositivity, both overall and within neighborhood groups. Several studies have shown an association between older age and IgG seropositivity [23,39,40], which is due to the cumulative risk of DENV exposure with increasing age. The trend of higher seroprevalence with increasing age is consistent with repeat exposure to DENV in this dengue-endemic area. School attendance was also associated with a higher odds of seropositivity at the individual level, even after adjusting for age and other characteristics. This finding is supported by those of other studies reporting a higher prevalence of DENV antibodies in Nicaraguan schoolchildren [40] and schoolchildren in other countries [39]. Although direct personal contact does not result in DENV transmission, children attending school with inapparent acute DENV infections or acute DENV infections prior to development of symptoms may be viremic and able to transmit DENV should a mosquito be present in the school environment. The vast majority of DENV infections are inapparent [41], so it is feasible for children to unknowingly transmit DENV infections to others via the bite of a mosquito. The mosquitoes that transmit DENV, Ae. aegypti and Ae. albopictus, bite in the daytime, when schools are normally in session. In addition, DENV infections have been shown to cluster in schools [42] and Ae. aegypti mosquitoes may be common in the school environment [43]. Therefore, it is very likely that DENV transmission is occurring in the school environment. There are several schools located throughout District II in Managua, so they could serve as possible hotspots of DENV transmission among the children in this study.
In addition to individual factors, several household factors were associated with a lower odds of DENV seropositivity, including not having access to public water service, owning ≥5 fans, and a child’s parents having higher education levels. Living in a house with a dirt floor and having ≥5 persons per sleeping room were associated with higher odds of DENV seropositivity. Living in a house with a dirt floor and having ≥5 persons per sleeping room are indicative of a lower socioeconomic status, while owning ≥5 fans and higher education levels among parents indicate higher socioeconomic status. These results are supported by those of previous studies demonstrating that lower socioeconomic status is associated with a higher risk of DENV infection, or conversely, that higher socioeconomic status is associated with a lower risk of DENV infection

46
[11,12,16,26]. Within neighborhood groups, differences in the association between household factors and DENV seropositivity may indicate imprecision in our estimates or perhaps more subtle differences in socioeconomic status than we were able to detect by observing and recording descriptions of neighborhoods. There are several reasons why socioeconomic status may be associated with risk of DENV infection. A higher level of education may be associated with greater knowledge of dengue, including risk of DENV infection and vector control, and therefore may translate to greater practice of dengue prevention measures at the household level. In studies in Thailand and Malaysia, household survey respondents’ knowledge of dengue prevention measures was independently associated with their practice of these measures, and dengue knowledge was associated with a higher education level [44,45]. Higher socioeconomic status is also likely to be associated with higher income, allowing the purchase of window screens and glazed windows that prevent mosquitos from entering the home; air-conditioning units, which have been associated with lower DENV seropositivity [23]; and access to private schools, with higher quality school facilities that are less likely to harbor mosquitoes. In Nicaragua, it is not culturally acceptable to ask about household income, which is why proxy measures of income were asked instead.
The association of not having access to public water service with a lower odds of DENV seropositivity was unexpected, as not having access to public water service is an indicator of lower socioeconomic status, which, as discussed above, has been associated with a higher odds of DENV seropositivity. Interestingly, Ibarra and colleagues found that households located in an area with greater access to piped water and garbage collection had more water storage containers and three times more Ae. aegypti pupae than households located in an area with limited access to piped water and garbage collection services [25]. They argue that infrastructure improvements do not necessarily translate to changes in sociocultural risk factors, namely human behavior. We did not collect data on the presence of water storage containers or Ae. aegypti abundance, so we cannot assess this possible explanation.
At the neighborhood level, living in a high population density neighborhood was associated with a higher odds of seropositivity compared to living in low population density neighborhood. This finding is supported by that of Cox and colleagues, who found that Ae. aegypti larvae were more abundant in high-density housing in urban regions [29]. In addition, Padmanabha and colleagues have shown that human population density interacts significantly with the natural regulatory pattern of Ae. aegypti, and that high human population density plays a substantial role in DENV transmission, both within the home and within a community of houses [27]. Therefore, high population density neighborhoods may have greater availability of vector breeding sites, resulting in higher DENV transmission.
Four of the six neighborhood groups were associated with a higher odds of seropositivity compared to the reference neighborhood group, Group 1, and there was no significant difference in odds of seropositivity between Group 2 and Group 1. While all neighborhood groups had mixed commercial and residential areas, Groups 1 and 2 had smaller, more limited local businesses with less commercial activity (e.g., bakeries and print shops) compared to the businesses in other groups, which included a telephone company branch, bus, taxi and truck terminals, restaurants, supermarkets, and other

47
businesses. Groups 1 and 2 also had no parks or recreation areas, which were present in other groups, and fewer public transport routes compared to Groups 4 and 5. Our finding of a higher odds of DENV seropositivity in neighborhood groups with higher commercial activity is supported by that of Honório and colleagues, who found dengue seroprevalence hotspots in Rio de Janeiro, Brazil located in commercial activity areas with high human movement, including an area encompassing the main bus station [13]. Their findings and those of other studies [9,10] indicate the importance of human movement in determining the spatial variation in dengue seroprevalence between neighborhoods.
It is intriguing that dengue seroprevelance in Group 6 remained relatively high and stable over time. This neighborhood group is unique in that it is located in center of the other neighborhood groups, and it also has several commercial businesses with high human movement, such as supermarkets, restaurants, and gas stations. Reiner and colleagues have shown that socially determined, overlapping human movements drive fine-scale heterogeneity in DENV transmission patterns [46]. It is, therefore, possible that Group 6, being centrally located, is the neighborhood group where members of the same social groups continuously overlap in their movements and drive the constant spread of DENV transmission in this population.
The strengths of this study include its prospective nature, which allowed us to examine trends in seroprevalence over time, and analyzing a representative sample of the District II population, which provided us with good internal validity. It would have been helpful to have information on vector abundance and vector control measures at the household and neighborhood levels, as this would have better elucidated environmental risk factors contributing to differences in dengue seroprevalence. Another limitation is that we were unable to assess how much time participants spent in different neighborhoods or outside of the district. Our study assumes that participants were most likely infected in their neighborhood group, but it is possible that they were infected in other neighborhood groups or outside of the district. Due to funding shortfalls, we assumed that answers from continuing participants in 2009-2010 remained constant from 2008. While it is unlikely that socioeconomic factors changed within a 1-2 year period, it is possible that we misclassified some participants.
In summary, the results from our study suggest that community-based interventions should be targeted to urban neighborhoods with high commercial activity areas and high human movement, particularly if the neighborhoods are centrally located. In addition, they support the results of other studies demonstrating that DENV transmission has ecological, biological and social dimensions [17,18], and highlight the importance of individual-, household-, and neighborhood-level determinants of DENV seropositivity. In recent years, community-based dengue prevention programs, such as Camino Verde and Communication for Behavioral Impact, have shown success in reducing the risk of DENV infection in Nicaragua [35,47] and other countries [48,49]. Neighborhood-level information, such as the information collected in our study, may help to guide dengue education efforts and target vector control practices. Because differences in risk of DENV infection exist at the neighborhood level, it is vital to empower neighborhoods with knowledge of dengue and vector control measures to change DENV transmission

48
patterns, reduce the number of dengue cases, and hopefully spread prevention practices to other neighborhoods and communities.

49
5. Tables and figures
Figure 1. Map of survey neighborhoods.
Participants lived in 18 neighborhoods within District II of Managua, Nicaragua, a low-to-middle income, 9.2 km2 area with a population of approximately 62,000. The different colored outlines (red, pink, blue, green, yellow and black) represent six neighborhoods groups with similar socioeconomic, infrastructural and ecologic characteristics, while the light to dark grey shading indicates increasing neighborhood population density from low (1,700-11,000 persons per km2), to medium (11,001-20,000 km2), to medium-high (20,001-30,000 persons per km2), to high (30,001-57,000 persons per km2).

50
Figure 2. Dengue seroprevalence over time by neighborhood group.
The 18 neighborhoods included in the survey were grouped into six neighborhood groups by similar socioeconomic, infrastructural and ecologic characteristics. Neighborhood groups with less commercial activity and no parks or recreation areas (Groups 1 and 2) tended to have a lower seroprevalence than groups with parks and recreation areas and higher commercial activity (Groups 3-6). Dengue seroprevalence decreased in all groups from 2009-2013 except for Group 6, in which the seroprevalence remained relatively stable over time.

51
Figure 3. Dengue seroprevalence over time by neighborhood population density.
The 18 neighborhoods included in the survey were categorized by population density. Low population density neighborhoods had 1,700-11,000 persons per km2, medium population density neighborhoods had 11,001-20,000 persons per km2, medium-high population density neighborhoods had 20,001-30,000 persons per km2 and high population density neighborhoods had 30,001-57,000 persons per km2. Dengue seroprevalence monotonically decreased in neighborhoods of all population densities from 2009-2013. High and medium-high population density neighborhoods had higher seroprevalences compared to low and medium population density neighborhoods.

52
Table 1. Descriptions of neighborhood groups.
Group Neighborhoods included Description Group 1 Cristo del Rosario,
La Cruz § Low income area § Mixed commercial (artisanal fishing, bakeries, print shops) and residential § No parks or recreation areas § Dense vegetation
Group 2 Santa Ana Norte, Santa Ana Sur, Cuba
§ Lower middle income class area § Mixed commercial (print shops, automotive shops) and residential § No parks or recreation areas § Variable vegetation density § Borders a large cemetery on the south
Group 3 Monseñor Lezcano, Manuel Olivares, Javier Cuadra
§ Lower middle income area § Mixed commercial (distributors of butane gas and cosmetics, telephone
company branch) and residential, including a private hospital and university branch
§ Two landfills and a storm drain § Some parks and recreation areas § Little vegetation § Borders a large cemetery on the north
Group 4 Manchester, San Sebastian, San José, San Antonio
§ Lower middle income area § 2% of households have latrines, while the rest are connected to the sewer
system § Mixed commercial (bakeries, restaurants, automotive shops) and residential,
including one residential zone with large vacant lots § Several parks and recreation areas § Moderately dense vegetation § Access to several public transport routes
Group 5 Bóer, El Carmen y Reforma, William Diaz, Martha Quezada
§ Low-income area § Mixed commercial (bus/taxi/truck terminals, television stations) and
residential § Several landfills § Several parks and recreation areas, including 3 playgrounds § Variable vegetation density § Access to several public transport routes
Group 6 Julio Buitrago § Low-income area § Mixed commercial (supermarkets, restaurants, gas stations, automotive
shops, heavy machinery sales) and residential, including shelters § Some parks and recreation areas § Lush green spaces and dense vegetation

53
Table 2. Characteristics of the study population (n=5,026) by survey year.
2008 (n=3,561)
2009-2010 (n=3,621)
2011 (n=3,133)
2012 (n=3,422)
2013 (n=3,078)
Characteristic n (%) n (%) n (%) n (%) n (%) DENV seropositivity Seronegative 1,668 (47) 1,593 (44) 1,545 (49) 1,850 (54) 1,738 (56) Seropositive 1,893 (53) 2,028 (56) 1,588 (51) 1,572 (46) 1,340 (44) Individual Sex Male 1,805 (51) 1,826 (50) 1,550 (49) 1,696 (50) 1,541 (50) Female 1,756 (49) 1,795 (50) 1,583 (51) 1,726 (50) 1,537 (50) Age (years) 2-5 1,111 (31) 741 (20) 838 (27) 1,015 (30) 784 (25) 6-9 1,492 (42) 1,359 (38) 1,093 (35) 1,067 (31) 1,012 (33) 10-13 958 (27) 1,279 (35) 1,149 (36) 1,084 (32) 1,068 (35) >13 N/A* 242 (7) 53 (2) 256 (7) 214 (7) School attendance No 642 (18) 618 (17) 330 (10) 395 (12) 232 (8) Yes 2,918 (82) 3,002 (83) 2,769 (89) 3,016 (88) 2,834 (92) Missing 1 (<1) 1 (<1) 34 (1) 11 (<1) 12 (<1) Household Crowding index (persons per sleeping room)
<3 1,346 (38) 1,820 (51) 1,586 (51) 1,868 (54) 1,649 (54) 3-4 1,474 (41) 1,373 (38) 1,104 (35) 1,128 (33) 1,050 (34) ≥5 602 (17) 392 (11) 361 (11) 295 (9) 325 (10) Missing 139 (4) 36 (<1) 82 (3) 131 (4) 54 (2) Public water service (hours per day)
≥12 1,490 (42) 955 (26) 462 (15) 414 (12) 190 (6) 1-11 1,063 (30) 1,435 (40) 1,040 (33) 1,288 (38) 552 (18) 0 872 (24) 1,185 (33) 1,539 (49) 1,587 (46) 2,282 (74) Missing 136 (4) 46 (1) 82 (3) 133 (4) 54 (2) Number of fans owned‡ 0 253 (7) 252 (7) 237 (7) 264 (8) 157 (5) 1-4 2,912 (82) 2,809 (77) 2,413 (77) 2,595 (76) 2,435 (79) ≥5 260 (7) 278 (8) 401 (13) 430 (12) 432 (14) Missing 136 (4) 282 (8) 82 (3) 133 (4) 54 (2) Housing material‡ Concrete 2,807 (79) 2,735 (75) 2,617 (83) 2,709 (79) 2,537 (82) No concrete 618 (17) 605 (17) 432 (14) 581 (17) 486 (16) Missing 136 (4) 281 (8) 84 (3) 132 (4) 55 (2) Flooring material‡ No dirt floor 2,710 (76) 2,678 (74) 2,563 (82) 2,856 (83) 2,666 (86) Dirt floor 715 (20) 662 (18) 488 (15) 434 (13) 358 (12) Missing 136 (4) 281 (8) 82 (3) 132 (4) 54 (2) Home ownership‡ No 242 (7) 271 (7) 299 (9) 417 (12) 369 (12) Yes 3,183 (89) 3,069 (85) 2752 (88) 2872 (84) 2655 (86) Missing 136 (4) 281 (8) 82 (3) 133 (4) 54 (2) Vehicle ownership‡ No vehicles 2,859 (80) 2,775 (77) 2,342 (75) 2,489 (73) 2,150 (70) Car or motorcycle 566 (16) 562 (15) 709 (22) 800 (23) 874 (28) Missing 136 (4) 284 (8) 82 (3) 133 (4) 52 (2) Mother’s education level‡ None or primary 1,350 (38) 1,194 (33) 1,017 (33) 863 (25) 635 (21) Secondary 1,985 (56) 1,787 (49) 1,699 (54) 2,023 (59) 1,869 (61) Technical or
university 181 (5) 166 (5) 325 (10) 399 (12) 375 (12)
Missing 45 (1) 474 (13) 92 (3) 137 (4) 199 (6) Father’s education level‡ None or primary 1,766 (50) 1,573 (43) 1,078 (34) 946 (27) 634 (21) Secondary 1,547 (43) 1,392 (38) 1,401 (45) 1,676 (49) 1,631 (53) Technical or
university 169 (5) 151 (5) 367 (12) 400 (12) 369 (12)
Missing 79 (2) 505 (14) 287 (9) 400 (12) 444 (14) Neighborhood Neighborhood population density

54
Low 591 (17) 604 (17) 513 (16) 576 (17) 533 (17) Medium 2,438 (69) 2,485 (68) 2,179 (70) 2,396 (70) 2,148 (70) Medium-high 335 (9) 321 (9) 266 (8) 272 (8) 239 (8) High 184 (5) 179 (5) 141 (5) 130 (4) 110 (4) Missing§ 13 (<1) 32 (1) 34 (1) 48 (1) 48 (1) Neighborhood group Group 1 482 (13) 494 (13) 422 (14) 463 (14) 400 (13) Group 2 1,082 (30) 1,124 (31) 974 (31) 1,065 (31) 944 (31) Group 3 488 (14) 499 (14) 439 (14) 480 (14) 446 (14) Group 4 590 (17) 585 (16) 480 (15) 517 (15) 467 (15) Group 5 417 (12) 389 (11) 345 (11) 364 (11) 325 (11) Group 6 489 (14) 498 (14) 439 (14) 485 (14) 448 (15) Missing§ 13 (<1) 32 (1) 34 (1) 48 (1) 48 (1)
Children were initially eligible to remain in the study until the age of 12 years. However, in 2007, study participants ≤11 years were offered the opportunity to continue for an additional three years and a second informed consent was performed. †Time of school attendance was not asked in the condensed survey administered in 2009-2010. ‡These questions were only asked to new participants in 2009-2010 or participants who moved to a new dwelling in 2009-2010. Otherwise, participants’ answers from 2008 were assumed to remain constant in 2009-2010. §These participants lived outside of the district at the time of the survey. Abbreviation: DENV, dengue virus.

55
Table 3. Individual, household, and neighborhood characteristics associated with DENV seropositivity.
Characteristic cOR (95% CI) aOR (95% CI) Individual Sex Male 1.0 (ref) 1.0 (ref) Female 0.98 (0.88-1.09) 0.98 (0.88-1.10) Age (years) 1.23 (1.21-1.24) 1.25 (1.23-1.26) School attendance No 1.0 (ref) 1.0 (ref) Yes 1.71 (1.60-1.82) 1.17 (1.08-1.28) Household Crowding index (persons per sleeping room)
<3 1.0 (ref) 1.0 (ref) 3-4 0.94 (0.91-0.98) 1.04 (0.99-1.08) ≥5 0.96 (0.91-1.02) 1.10 (1.03-1.18) Public water service (hours per day)
≥12 1.0 (ref) 1.0 (ref) 1-11 1.15 (1.10-2.20) 0.96 (0.91-1.02) 0 1.28 (1.22-1.34) 0.88 (0.84-0.93) Number of fans owned 0 1.0 (ref) 1.0 (ref) 1-4 0.91 (0.84-0.98) 0.93 (0.85-1.01) ≥5 0.90 (0.82-0.99) 0.85 (0.76-0.94) Housing material Concrete 1.0 (ref) N/A No concrete 1.03 (0.98-1.09) N/A Flooring material No dirt floor 1.0 (ref) 1.0 (ref) Dirt floor 1.03 (0.96-1.10) 1.17 (1.08-1.27) Home ownership No 1.0 (ref) 1.0 (ref) Yes 0.90 (0.84-0.96) 0.94 (0.87-1.02) Vehicle ownership No vehicles 1.0 (ref) 1.0 (ref) Car or motorcycle 1.09 (1.03-1.16) 0.98 (0.92-1.05) Mother’s education level None or primary 1.0 (ref) 1.0 (ref) Secondary 0.96 (0.91-1.01) 0.97 (0.91-1.03) Technical or university 1.02 (0.93-1.12) 0.90 (0.81-1.00) Father’s education level None or primary 1.0 (ref) 1.0 (ref) Secondary 1.01 (0.96-1.07) 0.94 (0.88-0.99) Technical or university 1.06 (0.98-1.15) 0.87 (0.80-0.95) Neighborhood Neighborhood population density
Low 1.0 (ref) 1.0 (ref) Medium 1.01 (0.88-1.16) 1.12 (0.88-1.43) Medium-high 1.18 (0.94-1.48) 1.25 (0.97-1.62) High 1.57 (1.19-2.08) 1.63 (1.16-2.31) Neighborhood group Group 1 1.0 (ref) 1.0 (ref) Group 2 1.11 (0.93-1.33) 1.15 (0.94-1.43) Group 3 1.24 (1.01-1.51) 1.35 (1.05-1.74) Group 4 1.34 (1.10-1.64) 1.50 (1.13-1.99) Group 5 1.62 (1.31-2.01) 1.67 (1.32-2.12) Group 6 1.27 (1.05-1.54) 1.35 (1.09-1.69)
Odds ratios were calculated using a generalized estimating equation approach and adjusted for age, gender, school attendance, household crowding, hours of public water service per day, number of fans owned, flooring material, home ownership, vehicle ownership, mother’s education, father’s education, neighborhood population density, and neighborhood group. Abbreviations: DENV, dengue virus; cOR, crude odds ratio; aOR, adjusted odds ratio; ref, reference group.
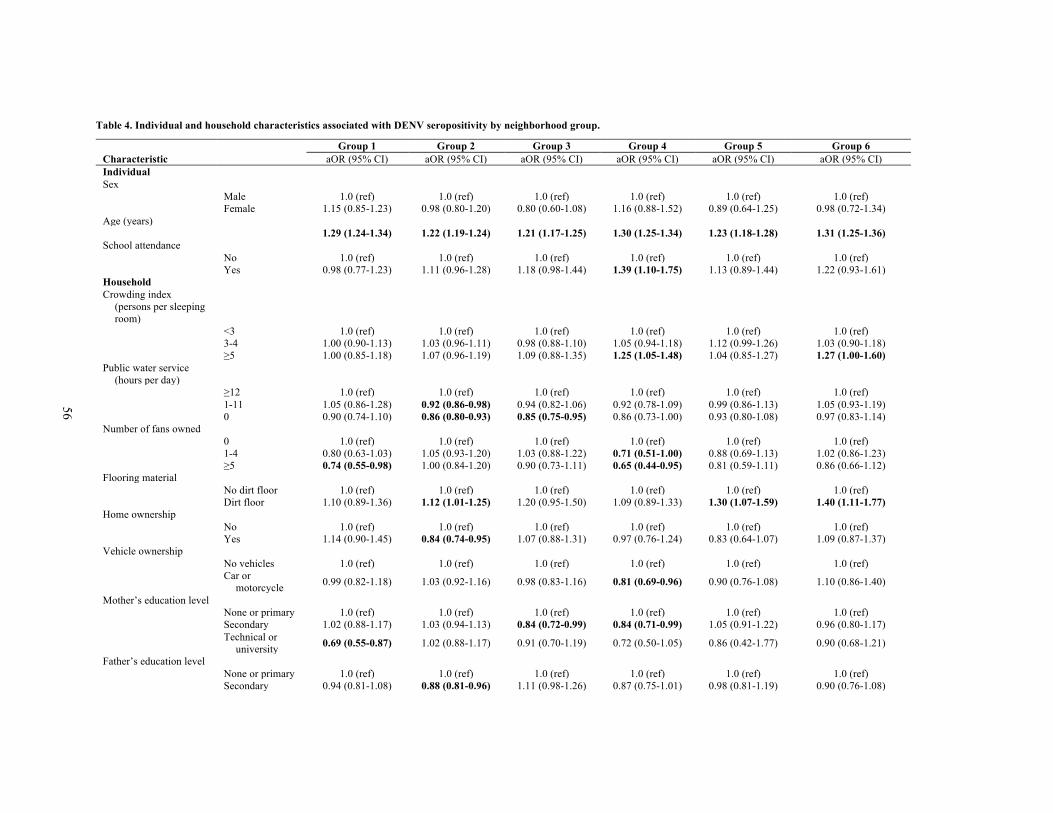
56
Table 4. Individual and household characteristics associated with DENV seropositivity by neighborhood group.
Group 1 Group 2 Group 3 Group 4 Group 5 Group 6 Characteristic aOR (95% CI) aOR (95% CI) aOR (95% CI) aOR (95% CI) aOR (95% CI) aOR (95% CI) Individual Sex Male 1.0 (ref) 1.0 (ref) 1.0 (ref) 1.0 (ref) 1.0 (ref) 1.0 (ref) Female 1.15 (0.85-1.23) 0.98 (0.80-1.20) 0.80 (0.60-1.08) 1.16 (0.88-1.52) 0.89 (0.64-1.25) 0.98 (0.72-1.34) Age (years) 1.29 (1.24-1.34) 1.22 (1.19-1.24) 1.21 (1.17-1.25) 1.30 (1.25-1.34) 1.23 (1.18-1.28) 1.31 (1.25-1.36) School attendance No 1.0 (ref) 1.0 (ref) 1.0 (ref) 1.0 (ref) 1.0 (ref) 1.0 (ref) Yes 0.98 (0.77-1.23) 1.11 (0.96-1.28) 1.18 (0.98-1.44) 1.39 (1.10-1.75) 1.13 (0.89-1.44) 1.22 (0.93-1.61) Household Crowding index
(persons per sleeping room)
<3 1.0 (ref) 1.0 (ref) 1.0 (ref) 1.0 (ref) 1.0 (ref) 1.0 (ref) 3-4 1.00 (0.90-1.13) 1.03 (0.96-1.11) 0.98 (0.88-1.10) 1.05 (0.94-1.18) 1.12 (0.99-1.26) 1.03 (0.90-1.18) ≥5 1.00 (0.85-1.18) 1.07 (0.96-1.19) 1.09 (0.88-1.35) 1.25 (1.05-1.48) 1.04 (0.85-1.27) 1.27 (1.00-1.60) Public water service
(hours per day)
≥12 1.0 (ref) 1.0 (ref) 1.0 (ref) 1.0 (ref) 1.0 (ref) 1.0 (ref) 1-11 1.05 (0.86-1.28) 0.92 (0.86-0.98) 0.94 (0.82-1.06) 0.92 (0.78-1.09) 0.99 (0.86-1.13) 1.05 (0.93-1.19) 0 0.90 (0.74-1.10) 0.86 (0.80-0.93) 0.85 (0.75-0.95) 0.86 (0.73-1.00) 0.93 (0.80-1.08) 0.97 (0.83-1.14) Number of fans owned 0 1.0 (ref) 1.0 (ref) 1.0 (ref) 1.0 (ref) 1.0 (ref) 1.0 (ref) 1-4 0.80 (0.63-1.03) 1.05 (0.93-1.20) 1.03 (0.88-1.22) 0.71 (0.51-1.00) 0.88 (0.69-1.13) 1.02 (0.86-1.23) ≥5 0.74 (0.55-0.98) 1.00 (0.84-1.20) 0.90 (0.73-1.11) 0.65 (0.44-0.95) 0.81 (0.59-1.11) 0.86 (0.66-1.12) Flooring material No dirt floor 1.0 (ref) 1.0 (ref) 1.0 (ref) 1.0 (ref) 1.0 (ref) 1.0 (ref) Dirt floor 1.10 (0.89-1.36) 1.12 (1.01-1.25) 1.20 (0.95-1.50) 1.09 (0.89-1.33) 1.30 (1.07-1.59) 1.40 (1.11-1.77) Home ownership No 1.0 (ref) 1.0 (ref) 1.0 (ref) 1.0 (ref) 1.0 (ref) 1.0 (ref) Yes 1.14 (0.90-1.45) 0.84 (0.74-0.95) 1.07 (0.88-1.31) 0.97 (0.76-1.24) 0.83 (0.64-1.07) 1.09 (0.87-1.37) Vehicle ownership No vehicles 1.0 (ref) 1.0 (ref) 1.0 (ref) 1.0 (ref) 1.0 (ref) 1.0 (ref) Car or
motorcycle 0.99 (0.82-1.18) 1.03 (0.92-1.16) 0.98 (0.83-1.16) 0.81 (0.69-0.96) 0.90 (0.76-1.08) 1.10 (0.86-1.40)
Mother’s education level None or primary 1.0 (ref) 1.0 (ref) 1.0 (ref) 1.0 (ref) 1.0 (ref) 1.0 (ref) Secondary 1.02 (0.88-1.17) 1.03 (0.94-1.13) 0.84 (0.72-0.99) 0.84 (0.71-0.99) 1.05 (0.91-1.22) 0.96 (0.80-1.17) Technical or
university 0.69 (0.55-0.87) 1.02 (0.88-1.17) 0.91 (0.70-1.19) 0.72 (0.50-1.05) 0.86 (0.42-1.77) 0.90 (0.68-1.21)
Father’s education level None or primary 1.0 (ref) 1.0 (ref) 1.0 (ref) 1.0 (ref) 1.0 (ref) 1.0 (ref) Secondary 0.94 (0.81-1.08) 0.88 (0.81-0.96) 1.11 (0.98-1.26) 0.87 (0.75-1.01) 0.98 (0.81-1.19) 0.90 (0.76-1.08)

57
Technical or university 0.87 (0.68-1.11) 0.80 (0.71-0.91) 1.14 (0.88-1.46) 0.62 (0.48-0.80) 1.07 (0.80-1.43) 0.87 (0.67-1.14)
Odds ratios were calculated using a generalized estimating equation approach and adjusted for age, gender, school attendance, household crowding, hours of public water service per day, number of fans owned, flooring material, home ownership, vehicle ownership, mother’s education, and father’s education. Abbreviations: DENV, dengue virus; cOR, crude odds ratio; aOR, adjusted odds ratio; ref, reference group
58
6. References
1. Brady OJ, Gething PW, Bhatt S, Messina JP, Brownstein JS, et al. (2012) Refining the global spatial limits of dengue virus transmission by evidence-based consensus. PLoS Negl Trop Dis 6: e1760. 2. World Health Organization (2009) Dengue: guidelines for diagnosis, treatment, prevention and control. New ed. Geneva: World Health Organization. 3. San Martín JL, Brathwaite O, Zambrano B, Solórzano JO, Bouckenooghe A, et al. (2010) The epidemiology of dengue in the Americas over the last three decades: a worrisome reality. Am J Trop Med Hyg 82: 128–135.
4. Kouri G, Valdéz M, Arguello L, Guzmán MG, Valdés L, et al. (1991) Dengue epidemic in Nicaragua, 1985. Rev Inst Med Trop Sao Paulo 33: 365–371.
5. Balmaseda A, Standish K, Mercado JC, Matute JC, Tellez Y, et al. (2010) Trends in patterns of dengue transmission over 4 years in a pediatric cohort study in Nicaragua. J Infect Dis 201: 5–14. 6. Harris E, Videa E, Pérez L, Sandoval E, Téllez Y, et al. (2000) Clinical, epidemiologic, and virologic features of dengue in the 1998 epidemic in Nicaragua. Am J Trop Med Hyg 63: 5–11. 7. Balmaseda A, Hammond SN, Pérez L, Tellez Y, Saborío SI, et al. (2006) Serotype-specific differences in clinical manifestations of dengue. Am J Trop Med Hyg 74: 449–456. 8. Hammond SN, Gordon AL, Lugo E del C, Moreno G, Kuan GM, et al. (2007) Characterization of Aedes aegypti (Diptera: Culcidae) production sites in urban Nicaragua. J Med Entomol 44: 851–860.
9. Stoddard ST, Forshey BM, Morrison AC, Paz-Soldan VA, Vazquez-Prokopec GM, et al. (2013) House-to-house human movement drives dengue virus transmission. Proc Natl Acad Sci U S A 110: 994–999. 10. Salje H, Lessler J, Endy TP, Curriero FC, Gibbons R V, et al. (2012) Revealing the microscale spatial signature of dengue transmission and immunity in an urban population. Proc Natl Acad Sci U S A 109: 9535–9538.
11. Siqueira JB, Martelli CMT, Maciel IJ, Oliveira RM, Ribeiro MG, et al. (2004) Household survey of dengue infection in central Brazil: spatial point pattern analysis and risk factors assessment. Am J Trop Med Hyg 71: 646–651. 12. Siqueira-Junior JB, Maciel IJ, Barcellos C, Souza W V., Carvalho MS, et al. (2008) Spatial point analysis based on dengue surveys at household level in central Brazil. BMC Public Health 8: 361.
13. Honório NA, Nogueira RMR, Codeço CT, Carvalho MS, Cruz OG, et al. (2009) Spatial evaluation and modeling of dengue seroprevalence and vector density in Rio de Janeiro, Brazil. PLoS Negl Trop Dis 3: e545. 14. Lover AA, Buchy P, Rachline A, Moniboth D, Huy R, et al. (2014) Spatial epidemiology and climatic predictors of paediatric dengue infections captured via sentinel site surveillance, Phnom Penh Cambodia 2011-2012. BMC Public Health 14: 658.

59
15. Vallée J, Dubot-Pérès A, Ounaphom P, Sayavong C, Bryant JE, et al. (2009) Spatial distribution and risk factors of dengue and Japanese encephalitis virus infection in urban settings: the case of Vientiane, Lao PDR. Trop Med Int Health 14: 1134–1142. 16. De Mattos Almeida MC, Caiaffa WT, Assunção RM, Proietti FA (2007) Spatial vulnerability to dengue in a Brazilian urban area during a 7-year surveillance. J Urban Health 84: 334–345. 17. Quintero J, Brochero H, Manrique-Saide P, Barrera-Pérez M, Basso C, et al. (2014) Ecological, biological and social dimensions of dengue vector breeding in five urban settings of Latin America: a multi-country study. BMC Infect Dis 14: 38.
18. Arunachalam N, Tana S, Espino F, Kittayapong P, Abeyewickreme W, et al. (2010) Eco-bio-social determinants of dengue vector breeding: a multicountry study in urban and periurban Asia. Bull World Health Organ 88: 173–184. 19. Ko YC, Chen MJ, Yeh SM (1992) The predisposing and protective factors against dengue virus transmission by mosquito vector. Am J Epidemiol 136: 214–220. 20. Teixeira MDG, Barreto ML, Costa MDCN, Ferreira LDA, Vasconcelos PFC, et al. (2002) Dynamics of dengue virus circulation: a silent epidemic in a complex urban area. Trop Med Int Health 7: 757–762.
21. Van Benthem BHB, Vanwambeke SO, Khantikul N, Burghoorn-Maas C, Panart K, et al. (2005) Spatial patterns of and risk factors for seropositivity for dengue infection. Am J Trop Med Hyg 72: 201–208. 22. Koyadun S, Butraporn P, Kittayapong P (2012) Ecologic and sociodemographic risk determinants for dengue transmission in urban areas in Thailand. Interdiscip Perspect Infect Dis 2012: 907494.
23. Demanou M, Pouillot R, Grandadam M, Boisier P, Kamgang B, et al. (2014) Evidence of dengue virus transmission and factors associated with the presence of anti-dengue virus antibodies in humans in three major towns in cameroon. PLoS Negl Trop Dis 8: e2950. 24. Schmidt W-P, Suzuki M, Thiem VD, White RG, Tsuzuki A, et al. (2011) Population density, water supply, and the risk of dengue fever in Vietnam: cohort study and spatial analysis. PLoS Med 8: e1001082.
25. Stewart Ibarra AM, Ryan SJ, Beltrán E, Mejía R, Silva M, et al. (2013) Dengue vector dynamics (Aedes aegypti) influenced by climate and social factors in Ecuador: implications for targeted control. PLoS One 8: e78263. 26. Braga C, Feitosa C, Mariaturchi C, De WV (2013) Seroprevalence and risk factors for dengue infection in socioeconomically distinct areas of Recife , Brazil. 113. 27. Padmanabha H, Durham D, Correa F, Diuk-Wasser M, Galvani A (2012) The interactive roles of Aedes aegypti super-production and human density in dengue transmission. PLoS Negl Trop Dis 6: e1799.
28. Raghwani J, Rambaut A, Holmes EC, Hang VT, Hien TT, et al. (2011) Endemic dengue associated with the co-circulation of multiple viral lineages and localized density-dependent transmission. PLoS Pathog 7: e1002064. 29. Cox J, Grillet ME, Ramos OM, Amador M, Barrera R (2007) Habitat segregation of dengue

60
vectors along an urban environmental gradient. Am J Trop Med Hyg 76: 820–826. 30. Vezzani D, Velázquez SM, Soto S, Schweigmann NJ (2001) Environmental characteristics of the cemeteries of Buenos Aires City (Argentina) and infestation levels of Aedes aegypti (Diptera: Culicidae). Mem Inst Oswaldo Cruz 96: 467–471.
31. Abe M, McCall PJ, Lenhart A, Villegas E, Kroeger A (2005) The Buen Pastor cemetery in Trujillo, Venezuela: measuring dengue vector output from a public area. Trop Med Int Health 10: 597–603. 32. Morrison AC, Sihuincha M, Stancil JD, Zamora E, Astete H, et al. (2006) Aedes aegypti (Diptera: Culicidae) production from non-residential sites in the Amazonian city of Iquitos, Peru. Ann Trop Med Parasitol 100 Suppl : S73–S86.
33. Ballenger-Browning KK, Elder JP (2009) Multi-modal Aedes aegypti mosquito reduction interventions and dengue fever prevention. Trop Med Int Health 14: 1542–1551.
34. Al-Muhandis N, Hunter PR (2011) The value of educational messages embedded in a community-based approach to combat dengue Fever: a systematic review and meta regression analysis. PLoS Negl Trop Dis 5: e1278. 35. Andersson N, Nava-Aguilera E, Arostegui J, Morales-Perez A, Suazo-Laguna H, et al. (2014) Camino Verde (Green Way) to Dengue Prevention: a cluster-randomized controlled trial of evidence-based community mobilisation in Nicaragua and Mexico. Br Med J (in revision).
36. Kuan G, Gordon A, Avilés W, Ortega O, Hammond SN, et al. (2009) The Nicaraguan pediatric dengue cohort study: study design, methods, use of information technology, and extension to other infectious diseases. Am J Epidemiol 170: 120–129. 37. Reed L, Muench H (1938) A simple method of estimating fifty percent endpoints. Am J Epidemiol 27: 493–497. 38. Zeger SL, Liang KY, Albert PS (1988) Models for longitudinal data: a generalized estimating equation approach. Biometrics 44: 1049–1060. 39. Thai KTD, Binh TQ, Giao PT, Phuong HL, Hung LQ, et al. (2005) Seroprevalence of dengue antibodies, annual incidence and risk factors among children in southern Vietnam. Trop Med Int Health 10: 379–386.
40. Balmaseda A, Hammond SN, Tellez Y, Imhoff L, Rodriguez Y, et al. (2006) High seroprevalence of antibodies against dengue virus in a prospective study of schoolchildren in Managua, Nicaragua. Trop Med Int Health 11: 935–942. 41. Gordon A, Kuan G, Mercado JC, Gresh L, Avilés W, et al. (2013) The Nicaraguan pediatric dengue cohort study: incidence of inapparent and symptomatic dengue virus infections, 2004-2010. PLoS Negl Trop Dis 7: e2462.
42. Endy TP (2002) Spatial and Temporal Circulation of Dengue Virus Serotypes: A Prospective Study of Primary School Children in Kamphaeng Phet, Thailand. Am J Epidemiol 156: 52–59.
43. García-Rejón JE, Loroño-Pino MA, Farfán-Ale JA, Flores-Flores LF, López-Uribe MP, et al. (2011) Mosquito infestation and dengue virus infection in Aedes aegypti females in schools in Merida, Mexico. Am J Trop Med Hyg 84: 489–496. 44. Naing C, Ren WY, Man CY, Fern KP, Qiqi C, et al. (2011) Awareness of dengue and

61
practice of dengue control among the semi-urban community: a cross sectional survey. J Community Health 36: 1044–1049.
45. Koenraadt CJM, Tuiten W, Sithiprasasna R, Kijchalao U, Jones JW, et al. (2006) Dengue knowledge and practices and their impact on Aedes aegypti populations in Kamphaeng Phet, Thailand. Am J Trop Med Hyg 74: 692–700. 46. Reiner RC, Stoddard ST, Scott TW (2014) Socially structured human movement shapes dengue transmission despite the diffusive effect of mosquito dispersal. Epidemics 6: 30–36. 47. Sequeira M, Espinoza H, Jj A, Domingo G, Quintanilla M, et al. (2011) Dengue in Nicaragua: A review of control status, trends, and needs. Seattle: Program for Appropriate Technology in Health.
48. Sinh Nam V, Thi Yen N, Minh Duc H, Cong Tu T, Trong Thang V, et al. (2012) Community-based control of Aedes aegypti by using Mesocyclops in southern Vietnam. Am J Trop Med Hyg 86: 850–859. 49. Arunachalam N, Tyagi BK, Samuel M, Krishnamoorthi R, Manavalan R, et al. (2012) Community-based control of Aedes aegypti by adoption of eco-health methods in Chennai City, India. Pathog Glob Health 106: 488–496.

62
Conclusions
Dengue has become a major public health concern in the Americas over the last three decades, with a dramatic increase in number and severity of reported cases and the co-circulation of multiple DENV serotypes [1]. Severe dengue continues to be a leading cause of hospitalization and death among children living in this region [1]. In Nicaragua, the first documented dengue epidemic occurred in 1985 [2], and Nicaragua has experienced cyclic dengue epidemics caused by varying predominant serotypes since then [3–5]. This dissertation presents research on the epidemiologic, clinical and laboratory features of pediatric dengue in Managua, Nicaragua.
Chapter 1 examined the frequency of clinical signs and symptoms by day of dengue illness and analyzed the association of signs and symptoms with dengue virus infection during the early febrile phase of illness and over the course of illness. We found that the frequency of signs and symptoms varied by day of illness, dengue virus infection status, and dengue severity. In addition, we showed increased odds of dengue virus infection associated with several clinical and laboratory features, including fever, headache, retro-orbital pain, myalgia, arthralgia, rash, petechiae, positive tourniquet test, vomiting, leukopenia, platelets ≤150,000 cells/mL, poor capillary refill, cold extremities, and hypotension. These findings stress the importance of considering day of illness in real-time clinical management of dengue.
Chapter 2 investigated the trajectories of cholesterol levels over time by DENV infection status and dengue severity. Total serum cholesterol and low-density lipoprotein cholesterol (LDL-C) levels decreased over the course of illness and were generally lower with increasing dengue severity, regardless of dengue severity classification. Greater decreases in LDL-C than high-density lipoprotein cholesterol (HDL-C) were observed among dengue-positive patients compared to patients with other febrile illness and among severe dengue cases compared to mild dengue cases. We found that lower total serum cholesterol and LDL-C levels at presentation were associated with subsequent risk of developing severe dengue using both the WHO 1997 and WHO 2009 dengue severity classifications. We also showed that HDL-C level at presentation was associated with subsequent risk of developing severe dengue using the WHO 2009 classification. These results suggest that the reduction in LDL-C is likely driving the decreases observed in total serum cholesterol levels among dengue-positive patients.
Chapter 3 examined individual, household, and neighborhood characteristics associated with dengue virus seropositivity. We found differences in dengue seroprevalence between six neighborhood groups categorized by similar socioeconomic, infrastructural and ecological characteristics. Living in a neighborhood group with high commercial activity was associated with higher odds of seropositivity compared to living in a group with low commercial activity. Household characteristics associated with a higher odds of dengue virus seropositivity included ≥5 persons per sleeping room and having a dirt floor, while no public water service and owning ≥5 fans was associated with a lower odds of dengue virus seropositivity. These results suggest that community-based interventions should be targeted to urban neighborhoods with high commercial activity areas and high human movement, particularly if the neighborhoods are centrally located.
In Chapters 1 and 2, our results describe the clinical spectrum of pediatric dengue on a day-by-day basis over the course of illness using data from prospective studies in Managua,

63
Nicaragua. Our results suggest that clinical and laboratory features may be used to develop prediction algorithms to aid clinicians in diagnosing suspected dengue and differentiating severe dengue from mild dengue. The utilization of clinical features and one or more routine biomarkers together with more specific, but more expensive biomarkers (e.g., cytokines) may provide a lower cost and more sustainable approach to developing a biomarker panel to discriminate severe dengue cases.
In Chapter 3, our results highlight the importance of individual-, household-, and neighborhood-level determinants of dengue virus seropositivity. In recent years, community-based dengue prevention programs, such as Camino Verde and Communication for Behavioral Impact, have shown success in reducing the risk of dengue virus infection in Nicaragua [8,9] and other countries [10,11]. Neighborhood-level information, such as the information collected in our study, may help to guide dengue education efforts and target vector control practices.
In conclusion, this dissertation describes the clinical and laboratory features of dengue virus infection in Nicaraguan children, examines the association of lower low-density lipoprotein cholesterol levels with severe dengue, and analyzes individual-, household- and neighborhood-level determinants of dengue virus seropositivity in a community-based cohort. The findings of these studies have significant implications for both clinical practice and dengue prevention programs in dengue-endemic countries.

64
References 1. San Martín JL, Brathwaite O, Zambrano B, Solórzano JO, Bouckenooghe A, et al. (2010) The epidemiology of dengue in the Americas over the last three decades: a worrisome reality. Am J Trop Med Hyg 82: 128–135.
2. Kouri G, Valdéz M, Arguello L, Guzmán MG, Valdés L, et al. (1991) Dengue epidemic in Nicaragua, 1985. Rev Inst Med Trop Sao Paulo 33: 365–371.
3. Balmaseda A, Standish K, Mercado JC, Matute JC, Tellez Y, et al. (2010) Trends in patterns of dengue transmission over 4 years in a pediatric cohort study in Nicaragua. J Infect Dis 201: 5–14. 4. Harris E, Videa E, Pérez L, Sandoval E, Téllez Y, et al. (2000) Clinical, epidemiologic, and virologic features of dengue in the 1998 epidemic in Nicaragua. Am J Trop Med Hyg 63: 5–11. 5. Balmaseda A, Hammond SN, Pérez L, Tellez Y, Saborío SI, et al. (2006) Serotype-specific differences in clinical manifestations of dengue. Am J Trop Med Hyg 74: 449–456. 6. Quintero J, Brochero H, Manrique-Saide P, Barrera-Pérez M, Basso C, et al. (2014) Ecological, biological and social dimensions of dengue vector breeding in five urban settings of Latin America: a multi-country study. BMC Infect Dis 14: 38.
7. Arunachalam N, Tana S, Espino F, Kittayapong P, Abeyewickreme W, et al. (2010) Eco-bio-social determinants of dengue vector breeding: a multicountry study in urban and periurban Asia. Bull World Health Organ 88: 173–184. 8. Andersson N, Nava-Aguilera E, Arostegui J, Morales-Perez A, Suazo-Laguna H, et al. (2014) Camino Verde (Green Way) to Dengue Prevention: a cluster-randomized controlled trial of evidence-based community mobilisation in Nicaragua and Mexico. Br Med J (in press).
9. Sequeira M, Espinoza H, Jj A, Domingo G, Quintanilla M, et al. (2011) Dengue in Nicaragua: A review of control status, trends, and needs. Seattle: Program for Appropriate Technology in Health. 10. Sinh Nam V, Thi Yen N, Minh Duc H, Cong Tu T, Trong Thang V, et al. (2012) Community-based control of Aedes aegypti by using Mesocyclops in southern Vietnam. Am J Trop Med Hyg 86: 850–859.
11. Arunachalam N, Tyagi BK, Samuel M, Krishnamoorthi R, Manavalan R, et al. (2012) Community-based control of Aedes aegypti by adoption of eco-health methods in Chennai City, India. Pathog Glob Health 106: 488–496.