Embed Size (px)
Citation preview

THE STATE-OF-THE-STATES SURVEY OF JURY IMPROVEMENT EFFORTS:
A COMPENDIUM REPORT
By Hon. Gregory E. Mize (ret.), Paula Hannaford-Agor, J.D. &
Nicole L. Waters, Ph.D.
April 2007
ACKNOWLEDGEMENTS
The State-of-the-States Survey began as the cornerstone component of the NCSC’s National Program to Increase Citizen Participation in Jury Service Through Jury Innovations (National Jury Program). We understood from the beginning that it would be a substantial undertaking, although if we had known just how substantial we might have reconsidered the scope and depth of the surveys. As it was, the study took a great deal more time and effort than we initially imagined, and we are indebted to the many people who helped make it a reality at last.
First and foremost, we are grateful to the 68 individuals, law firms, and organizations that contributed financially to the National Jury Program. This was the first major research study by the NCSC Center for Jury Studies that was financed almost entirely through private donations. These individuals, law firms, and organizations recognized the intrinsic value of the jury trial and were willing to support efforts to document and improve how it functions in the American justice system. We are particularly grateful to the Robins, Kaplan, Miller & Ciresi Foundation, which contributed funds to get the National Jury Program underway, and to the U.S. Chamber of Commerce and the State Justice Institute, which provided funding to analyze the State-of-the-States data and to write and distribute this report. We are also indebted to NCSC President Mary McQueen, who provided bridge funding so we could continue data collection for the State-of-the-States Survey at a time when financial contributions were lagging behind project expenses. The names of all of the National Jury Program contributors are listed in Appendix A.
Endeavors of this magnitude require super-human organizational skills. For that, we are forever indebted to NCSC Research Analyst Chris Connelly, who patiently and painstakingly undertook the job of mailing surveys, answering questions from respondents, and then following up to ensure the highest possible response rates. In the process, he talked with hundreds of judges, state court administrators, clerks of court, and lawyers in every state – some of them multiple times – and then oversaw the data entry and cleaning process for the datasets. It is due to his diligence in these efforts that the State-of-the-States Survey is the most comprehensive study of jury operations and practices ever yet undertaken. We are also grateful to our colleagues Monica Wait, who cleaned and analyzed the data and produced all of the state-by-state tables for the NCSC website; Tom Munsterman and Anne Skove, who provided necessary comments on the draft report to help us separate the wheat from the chaff; and to Brenda Otto, who provided administrative support for the project.
Finally, this project could not have been completed without the cooperation of the many supreme court justices, state court administrators, and trial court chief judges who served as liaisons for us to the judges and courts within their respective states and courts. They distributed the surveys to the judges, court administrators, and lawyers for completion, provided essential contacts with private bar organizations, and encouraged all to participate in the study. Of course, the study would not have been possible without the participation of all of those judges, court administrators, clerks of court, lawyers, and, most importantly, citizens who make the American jury system work every day.
Gregory E. Mize, Paula Hannaford-Agor, & Nicole L. Waters
i

TABLE OF CONTENTS
Acknowledgements.......................................................................................................................... i
I. Introduction ................................................................................................................................ 1
The State-of-the-States-Survey of Jury Improvement Efforts ........................................................ 2
II. The Volume and Frequency of Jury Trials in State Courts....................................................... 7
III. Statewide Jury Improvement Efforts ....................................................................................... 9
State and Local Infrastructure for Jury Operations ..........................................................................10
IV. Local Court Survey................................................................................................................ 17
Jury Automation in Local Courts ..........................................................................................................18 Jury Yield in Local Courts ......................................................................................................................20 Juror Privacy................................................................................................................................................25
V. Judge & Lawyer Survey.......................................................................................................... 27
Voir Dire.......................................................................................................................................................27 Trial Practices..............................................................................................................................................31
VI. Conclusions............................................................................................................................ 41
Appendices.................................................................................................................................... 45
Appendix A: Financial Contributors to the National Program to Increase Citizen Participation in Jury Service Through Jury Innovations .........................................................47
Appendix B: Statewide, Local Court, and Judge & Lawyer Surveys From the State-of-the-States-Survey of Jury Improvement Efforts................................................................................49
Appendix C: State-by-State Response Rates ....................................................................................69 Appendix D: Notes on Methodology Used to Calculate National Statistics ...........................73 Appendix E: State Tables on Key Jury Operation and Practice Measurements .....................75
ii

I. INTRODUCTION
Over the past two decades, the American jury system has become the focus of unprecedented interest by the legal community and by the broader American public. Some of the interest is in response to criticisms about the continued utility of the jury system. The rate of civil and criminal jury trials has steadily declined in recent years, eclipsed by non-trial dispositions such as settlement, plea agreements, and summary judgment.1 Proponents of the jury system, on the other hand, have maintained that trial by jury continues to play a critical role in the American justice system in protecting the rights of criminal defendants, in resolving intractable civil disputes, and in promoting public trust and confidence in the courts.
Beginning in the early 1990s, these debates prompted renewed efforts by judges, lawyers, and scholars to examine jury performance and to consider the potential effects of various proposals for reform. A popular approach adopted by many states were judicially created commissions or task forces that were instructed to examine various jury reform proposals and make recommendations about their suitability for implementation. National efforts also took place during this time including the 1992 Brookings Institution symposium on the civil jury2 and the 2001 National Jury Summit in New York City.3
Most recently, Robert J. Grey, Jr., made the American jury the focus of his tenure as the 2004-2005 President of the American Bar Association. Under his leadership, the ABA undertook a yearlong effort to update, consolidate, and harmonize the various sets of jury trial standards developed by the ABA Criminal Justice Section, the Section on Litigation, and the Judicial Division into a unified set of principles.4 In contrast to other legal reform efforts that have tended to focus strictly on legal principles, the new ABA Principles for Juries and Jury Trials rely heavily on a large body of empirical research about juror behavior.
Many of these efforts have profoundly affected court policies as evidenced by revised court rules and case law, and the development of judicial and legal education curricula. While these policy changes are fairly easy to track on a statewide level, the fact remains that they can vary from court to court. For example, in a state the size of Texas, which has over 300 different general jurisdiction courts, it is extraordinarily difficult to keep track of administrative practices, procedures, data, and local reform efforts. It becomes even more difficult to determine what actually occurs during trials themselves. In all but a handful of jurisdictions, most jury trial techniques are permitted “in the sound discretion of the trial court.” But we have little idea how often judges choose to exercise that discretion. In this report, we share the findings from the State-of-the-States Survey of Jury Improvement Efforts, a national study designed to examine precisely these questions.
1 See Marc Galanter, The Vanishing Trial: An Examination of Trials and Related Matters in Federal and State Courts, 1 J. EMPIRICAL LEG. STUD. 459 (2004). 2 ROBERT E. LITAN (ed.), VERDICT: ASSESSING THE CIVIL JURY SYSTEM (1993). 3 Robert G. Boatright & Elissa Krauss, Jury Summit 2001: A Report on the First National Meeting of the Ever-Growing Community Concerned with Improving the Jury System, 86 JUDICATURE 144 (2002). 4 AMERICAN BAR ASSOCIATION, PRINCIPLES FOR JURIES AND JURY TRIALS (2005).
1

The State-of-the-States Survey is the cornerstone of a much larger initiative by the NCSC Center for Jury Studies – the National Program to Increase Citizen Participation in Jury Service (National Jury Program).5 The National Jury Program provides information and technical assistance to state courts about best practices in jury system management and trial procedures. Its ultimate goals are to assist courts to summons and impanel more representative juries; to manage their jury systems in an effective, efficient, and informative manner; to facilitate informed decision-making by trial jurors; to increase public trust and confidence in the jury system and in courts; and to better inform citizens about the judicial branch of government. The State-of-the-States Survey was designed to document local practices and jury operations in the context of their respective state infrastructures and thus provide a baseline against which state court policymakers could assess their own systems vis-à-vis their peers and nationally recognized standards of effective practices. The State-of-the-States Survey also examines the effectiveness of various implementation strategies for affecting change. Finally, it provides direction for future research and technical assistance efforts by the NCSC Center for Jury Studies.
The State-of-the-States Survey of Jury Improvement Efforts
The State-of-the-States Survey is the product of a multiyear effort to gauge the current status of jury improvement efforts in the nation’s state courts. It derives from three separate, but related, questionnaires or “surveys.” The first was the Statewide Survey completed by all 50 states and the District of Columbia to document statewide jury improvement efforts and the state infrastructure governing jury system management and trial procedures. For example, it collected contact information for jury task forces and sample copies of forms and procedures used in jury management. This survey not only identified the programmatic priorities for state courts, but also provided a mechanism to determine the types of efforts (e.g., judicial education, technical assistance, formal rule and statutory changes) that most often lead to effective implementation of jury improvements. The survey was typically completed by the Office of the Chief Justice or the Administrative Office for each participating state.
The second State-of-the-States questionnaire was the Local Court Survey. It was distributed to the states’ general jurisdiction trial courts and focused on local jury operations related to qualification, summoning, terms and conditions of service, and supporting technology. This survey asked about jury improvement efforts initiated at the local level. As with the Statewide Survey, the NCSC Center for Jury Studies relied on the respective offices of the Chief Justice or the State Court Administrator to distribute the surveys to each of the local courts. In some instances, these offices also collected the surveys and returned them for data entry. In other instances, these central offices instructed local courts to mail the completed surveys directly to the NCSC.
5 For a full description of the National Jury Program, see the NCSC Center for Jury Studies website at http://www.ncsconline.org/D_Research/cjs.
2

The responses for 43 of the 1,396 Local Court Surveys reflected multi-county judicial circuits, districts, or divisions. Thus, the complete local court dataset represents 1,546 individual counties from 49 states and the District of Columbia.6 On average, these courts reflect 65 percent of their respective state populations and collectively they represent jurisdictions encompassing 70 percent of the total US population. Appendix C provides the response rates for each of the states. Heavily populated counties are slightly over-represented in the dataset compared to their actual representation. See Table 1. For example, courts representing communities of 500,000 or more people (urban areas) comprised 6.7 percent of the dataset although they make up only 3.6 percent of US localities. Courts representing communities of 100,000 to 500,000 people (large suburban areas) comprised 18.7 percent of the dataset compared to 13.2 percent of U.S. localities. Small suburban (25,000 to 100,000 population) jurisdictions were represented roughly in proportion to their numbers in the U.S., but rural areas (less than 25,000 population) were slightly underrepresented.7 As we see in Section IV, urban courts tend to have higher levels of jury trial activity, which has important implications for jury operations for a variety of reasons.
The final State-of-the-States component was the Judge & Lawyer Survey in which respondents were asked to describe the actual jury practices employed in their most recent jury trial. Data collection for this phase was the most challenging insofar that it required multiple distribution approaches in each state. The NCSC first requested the offices of the chief justice, the state court administrator, or the chief judge of large, metropolitan courts to distribute the surveys to trial judges through local communication networks. Occasionally this approach was supplemented with additional requests through state judicial education agencies or other trial judge organizations. In addition, NCSC staff contacted numerous state and local bar organizations, preferably electronically, to request its distribution to criminal and civil trial attorneys. The number of outreaches to mandatory and voluntary bar associations in each state ranged from a minimum of four to, in one instance, dozens. The NCSC also solicited the cooperation of several national bar organizations including sections of the American Bar Association, the American Board of Trial Advocates, and the American Trial Lawyers Association for distribution to their respective members.
Data collection for the Judge & Lawyer Survey began with requests to judge and lawyer groups in the states known to be warmly disposed toward jury trial innovations. Researchers quickly realized that, even in these states, judges, lawyers and court administrators were understandably focused upon the current tasks at hand and not readily disposed toward helping collect data, even
ore than 500,000 90 6.7 112 3.61,337 3,144
Table 1: Local Court Response Rate
Local Court Dataset United States
Population Size of Responding Courts # Surveys % # Counties %
Less than 25,000 560 41.9 1,582 50.325,000 to 100,000 437 32.7 1,035 32.9100,000 to 500,000 250 18.7 415 13.2M
6 Vermont was the only state that did not participate in this component of the State-of-the-States Survey. 7 For the duration of this Compendium Report, we will use the terms “urban,” “large suburban,” “small suburban,” and “rural” to refer to these four categories of population size.
3

for a well-respected national organization such as the NCSC Center for Jury Studies. Hence, there had to be repeated and numerous outreaches to judge associations (most states did not have an active one) and mandatory or voluntary bar associations in each state. In some states, dozens of phone calls and emails had to be sent over the course of many months. On occasion, successful results were the product of waiting a year or so until new leadership took charge of an association. In short, the State of the States survey took much longer to accomplish than originally estimated. This phenomenon suggests that future research efforts will likely be time consuming and challenging.
The final Judge & Lawyer Survey dataset consisted of 11,752 surveys describing the practices employed in state and federal jury trials in all 50 states, the District of Columbia, and Puerto Rico. The vast majority of trials reported in the surveys took place between 2002 and 2006. See Table 2 for a description of the dataset. State trial judges accounted for more than one-third of the survey respondents. Based on national statistics in 2004, this sample of state trial judges reflects more than one-third (36.0%) of the judicial officers assigned to general jurisdiction courts.8 Attorneys practicing in the state courts accounted for more than half of the surveys. A total of 255 federal judges9 and 628 attorneys practicing in federal court also participated in the study, providing an unexpected opportunity to compare jury trial practices in state and federal courts. The remaining 3% of surveys were submitted by other legal practitioners or the respondent type was unknown.
One complication associated with the Judge and Lawyer Survey was the possibility that multiple respondents could describe the same case. In designing the survey, NCSC staff considered the option of asking survey respondents to provide
identifying information such as a docket number about each case, but ultimately thought that the added complexity of asking respondents to remember that information as well as the loss of anonymity would discourage participation. We chose to err on the side of potentially “double counting” some trials rather than sacrifice the number of respondents. The relationship between
N %Respondent Type
State Trial Judge 4,081 34.7Federal Trial Judge 255 2.2Attorney 7,209 61.3Other/Unknown 207 1.8
JurisdictionState Court 10,395 92.2Federal Court 884 7.8
CasesCriminal* 5,622 47.8
Capital Felony 343 6.1Felony 3,868 68.8Misdemeanor 1,341 23.9
Civil 5,819 49.5Other 311 2.6
AttorneysCriminal Prosecution 917 15.6Criminal Defense 1,345 22.9Civil Plaintiff 1,909 32.4Civil Defense 1,714 29.1
TOTAL 11,752 100.0
Table 2: Judge & Attorney Survey Characteristics
* Includes 70 trials designated as "criminal" only
8 The NCSC reports that there were 11,349 judicial officers assigned to general jurisdiction courts in 2004. RICHARD Y. SCHAUFFLER et al. (eds.), EXAMINING THE WORK OF STATE COURTS, 2005, 17 (2006). It is possible that some of the respondents were limited jurisdiction court judges, especially in trials for misdemeanor and “other” cases. But most states restrict trial by jury to courts of general jurisdiction. See generally DAVID B. ROTTMAN & SHAUNA M. STRICKLAND, STATE COURT ORGANIZATION 2004, Part VIII (Court Structure Charts), 265-319 (2006). 9 Federal district court judge respondents comprised 39% of all US federal district court judges. 28 U.S.C. § 133(a).
4

the percentage of Judge & Lawyer Surveys submitted to the NCSC and the county population expressed as a percentage of the state population was fairly consistent for all but seven of the 1,890 counties where jury trials took place. If the dataset did double-count some trials, it appears that the duplicate trials were distributed uniformly among those localities. Thus, it is unlikely that duplicate trials biased the findings of this study by placing disproportionate weight on the trial practices from a small number of jurisdictions.
5

II. THE VOLUME AND FREQUENCY OF JURY TRIALS IN STATE COURTS
A perennial challenge for policymakers and researchers concerned with jury trial procedures and operations is the difficulty in obtaining basic statistics about the number of jury trials that take place in state courts each year.10 Some states do not publish any statistics about the number of jury trials or they may combine bench and jury trials into the same category. Other states only report jury trials that took place in their general jurisdiction courts, but not in limited jurisdiction courts. The State-of-the-States Survey provided an opportunity to estimate the number of jury trials that take place in state courts annually based on direct reports from a fairly comprehensive survey of local courts. To make these estimates, the NCSC Center for Jury Studies calculated the number of jury trials in each state, the trial rates per 100,000 population, and other basic statistics by extrapolating from the proportion of state population reflected in the Local Court
11Surveys. See Table 3.
Annually, state courts conduct an estimated 148,558 jury trials each year. Federal courts conducted an additional 5,463 jury trials in 2006.12 California has the largest volume of jury trials – approximately 16,000 per year. Vermont and Wyoming had the lowest volume (126 trials annually). These are not particularly surprising numbers given the respective populations of these
states. What is surprising is the rate of jury trials. The average was 59 trials per 100,000 population, but varied substantially from a low of 15 trials in Alabama to a high of 177 trials in Alaska. Some of this variation can be explained by state law governing the circumstances under which parties may demand a jury trial (e.g., amount in controversy in civil trials, potential sentence in criminal trials), but also depends on local litigation culture including pretrial procedure, judicial management strategies, and the number of court resources available for conducting jury trials (e.g., facilities, staffing, judicial caseloads). The majority of jury trials are criminal trials – 47 percent felony and 19 percent misdemeanor. Just under one-third of trials are civil trials, and the remaining 4 percent involve family, juvenile, traffic, municipal ordinance, and “other” trials.
# of Counties Represented 1,546% of US Population Represented 70.3
Trial Rate per 100,000 population 58.6Estimated number of jury trials annually 148,558
% Felony 46.7% Misdemeanor 18.7% Civil 30.6% Other 4.0
Estimated number of summonses mailed 31,857,797% Adult population represented (age 18+) 14.8
Estimated number of jurors impaneled 1,526,520% Adult population represented (age 18+) 0.8
Table 3: National Jury Trial Rates and Characteristics
10 The Court Statistics Project is a collaborative effort by the NCSC, the Conference of State Court Administrators, and the U.S. Department of Justice, Bureau of Justice Statistics, to collect and analyze data relating to the work of state courts, including the number of jury trials conducted annually in state courts. For reports and online tables, see http://www.ncsconline.org/D_Research/csp/CSP_Main_Page.html. 11 See Appendix E for detailed information about the methods used to calculate figures in Table 3. 12 ADMINISTRATIVE OFFICE OF THE U.S. COURTS, JUDICIAL BUSINESS OF THE UNITED STATES COURTS 2006, Table C-7.
7

To secure enough jurors to hear cases, state courts mail an estimated 31.8 million jury summonses annually to approximately 15 percent of the adult American population. This figure obviously depends on the number of jury trials conducted in each state, but also on local juror utilization practices. For example, some courts are better than others at synchronizing the number of jurors needed with the number of jury trials to be held. In addition, this figure is affected by the number of jurors to be selected for each trial, which can range from as few as six to as many as twelve jurors, plus alternates.13 Another factor is the number of peremptory challenges available to each party during jury selection, which helps determine the size of the panel to be sent to the courtroom for jury selection. The number of peremptory challenges in non-capital felony trials ranges from three per side in Hawaii and New Hampshire to twenty per side in New Jersey.14 Capital felony trials tend to allocate more peremptory challenges to the parties, while misdemeanor and civil trials tend to allocate fewer.15
A large proportion of jurors summoned for jury service ultimately will not be needed. Many of those living in jurisdictions employing telephone call-in systems or other forms of communication technology (see Section V) will be told not to report for service due to last-minute settlements and plea agreements. Others will be disqualified or exempted from service, excused for hardship, removed from consideration for a particular trial due to preexisting knowledge about the case or the parties that might affect their impartiality, or removed by peremptory challenge. Despite the large quantity of summonses, only 1.5 million Americans are impaneled for service each year, less than 1 percent of the adult American population.
Although the probability of being impaneled in any given year is quite small, more than one-third of all Americans (37.6%) are now likely to be impaneled as trial jurors sometime during their lifetime. This represents is a tremendous increase in the distribution of the burden of jury service over the past three decades. In 1977, a national public opinion survey found that just 6% of adult Americans had served as trial jurors. By 1999, this figure had increased to 24%,16 and in 2004, the American Bar Association reported that 29% of the adult American population had served as trial jurors.17 In spite of declining numbers of jury trials,18 a larger and larger proportion of American citizens have first-hand experience with jury service, due to more inclusive master jury lists, shorter terms or service, and other policies designed to make jury service more convenient and accessible for all citizens.
13 ROTTMAN &. STRICKLAND, supra note 7, at Table 42 (2006). 14 Id. at Table 41. 15 Id. 16 NATIONAL CENTER FOR STATE COURTS, HOW THE PUBLIC VIEWS THE STATE COURTS: A 1999 NATIONAL SURVEY 15 (1999). 17 Harris Interactive, Jury Service: Is Fulfilling Your Civic Duty a Trial? (ABA July 2004). 18 Galanter, supra note 1.
8

III. STATEWIDE JURY IMPROVEMENT EFFORTS
Jury trials are often perceived as local affairs, but they take place in an institutional framework established within each state. Indeed, the entire court system itself reflects statewide institutional characteristics such as the degree of local court autonomy dictated through formal statutes, rulemaking procedures, and funding mechanisms. These institutional structures and norms, in turn, affect how each state chooses to undertake comprehensive improvement efforts and the relative effectiveness of those implementation efforts. In this respect, jury improvement efforts are no exception. In this section, we examine the different approaches that states have taken to undertake jury improvement efforts, the focus and implementation strategies of those efforts, and the extent of state versus local control over jury operations.
As a preliminary matter, it is instructive to note that 20 states reported the existence of an established office or formal organization responsible for managing or overseeing jury operations for the state. In some instances, these programs have been established within the administrative office of the courts to provide automation and other forms of technical support to local courts (e.g., master jury list compilation). In other states, these offices function in an oversight capacity through permanent committees of state judicial councils. A few states delegate some of the educational and outreach functions to external organizations, such as Jury Education and Management (JEM) Forum in California; the Ohio Jury Management Association (OJMA); the New York Fund for Modern Courts, which operates the state’s Citizen Jury Project; and the Pennsylvania Association for Court Management, which has a standing committee on jury management. The relatively high number of states with permanent jury offices or organizations demonstrates a high degree of state court recognition for the visibility and prominence of jury operations in court management.
With respect to more recent jury improvement efforts, the preferred approach in most states has been a statewide commission or task force to examine issues related to jury operations and trial procedures. Three-quarters of the states (38) have appointed such an entity in the past 10 years, of which nearly one-third were still active when the State-of-the-States Survey was administered. The vast majority of these commissions were established by the chief justice or under the authority of the court of last resort and consisted of 15 to 20 individuals representing a variety of constituencies. See Table 4.
O
Representation by … % of Task Forces / Commissions
Trial judges 97.3Civil litigation lawyers 86.5Criminal defense lawyers 78.4Prosecutors 75.7Court administrators 70.3Jury managers 64.9Clerks of court 64.9Private citizens / Former jurors 62.2Appellate judges 59.5
ther individuals 45.9State legislators 43.2
Table 4: Statewide Task Force / Commission Composition
Trial judges were included as members in virtually all states, and the vast majority of task forces included representation from major constituencies within the organized bar (e.g., criminal prosecutor and defense, plaintiff and civil defense) and administrative support for the jury system (e.g., court administrators, clerks of court, jury managers). A high percentage of the task forces (62%) included private citizens and former jurors. Of course, citizens and former jurors are
9

intimately affected by courts’ jury trial policies. Because community values are represented on a jury, it is important to represent community opinions and values on a jury task force. State legislators and members representing “other” constituencies were the only groups included in less than half of the task forces.
Jury commissions and task forces generally undertook only two or three primary objectives. The most common focus involved making recommendations for legislative and rule changes related to jury operations and trial procedures. Education of judges and court staff were also reported as a frequent focus of activity. See Table 5. One-third of the states (17) reported that their commissions and task forces were engaged in program evaluations, pilot demonstrations, or survey research. Because these activities typically require substantial levels of staff expertise or other resources, these types of supplemental activities were more common in states with centralized offices or formal organizations beyond a jury task force.
State and Local Infrastructure for Jury Operations
The degree to which jury operations are directed by state law varies tremendously by jurisdiction. For example, just over half of the states (27)19 give discretion to local courts to establish maximum terms of service. Of the 24 state-mandated jurisdictions, 10 set the maximum term of service at one day or one trial (Arizona, California, Colorado, Connecticut, District of Columbia, Florida, Hawaii, Indiana, Massachusetts, and Oklahoma). Collectively, these states represent 28.6 percent of the U.S. population. See Table 6. The remaining thirteen states permit longer terms of service, some of which limit the maximum number of days that a person must serve in any given period of time. For example, Georgia law specifies that citizens cannot be required to serve more than two consecutive weeks in any given term of court or more than four weeks in any 12-month period.20 Kentucky and North Dakota statutes have similar provisions, limiting jury service to 30 days and 10 days, respectively, within any 2-year period.21 As we discuss in Section IV, the actual number of days that a citizen serves on jury service may be considerably less than term of service, which specifies the maximum amount of time that a person must serve.
echnology 14ther 14
Attorney education 12Court observations 10Juror Fees 6
Table 5: Focus of Current or Ongoing Jury Improvement or Reform Efforts
% of StatesLegislative or rule changes 65Judicial education 41Public education / outreach 31Court staff education 29Evaluations 18Survey research 18Pilot or demonstration programs 14TO
19 These states encompass nearly half (49.3%) of the total U.S. population. 20 GA. CODE ANN. § 15-12-3 (2007). 21 KY. REV. STAT. ANN. § 29A.130 (2007); N.D. CENT. CODE § 27-09.1-15 (2007).
10

Term of Service States % US Population
One Day or One Trial AZ, CA, CO, CT, DC, FL, HI, IN, MA, OK 28.6
Two to five days (one week) NY, SC 8.2
Six days to 1 month GA, KY, ME, NH, ND, OH, RI 9.9
Greater than 1 month to 6 months NM .6
Longer than 6 months MT, UT, VT, WV 2.0
49.3
Table 6: State-Established Maximimum Terms of Service
Juror Compensation
All fifty states and the District of Columbia provide compensation to jurors as reimbursement for out-of-pocket expenses as well as token monetary recognition of the value of their service. See Table 7. Traditionally, the juror fee was a flat per diem with a supplemental mileage reimbursement. Recently, states have begun to recognize the relationship between the amount of juror fees, the proportion of citizens who are excused for financial hardship, and minority representation in the jury pool.22 As a result, a number of states have increased juror fees, but in doing so, have changed the structure of the payment system from a flat daily rate to a graduated rate in which jurors receive a reduced fee, or no fee, for the first day(s) of service with an increased fee if impaneled as a trial juror or required to report for additional days. Eight states23 and the District of Columbia require employers to compensate employees for a limited period of time (e.g., 3 to 5 days) while they are serving. Other states specify a minimum daily fee but permit local jurisdictions to supplement it. See Table 8. Over half of the courts also pay mileage reimbursement with rates varying from $.02 to $.49 per mile; the median rate was $.325 per mile. Arizona has also implemented a Lengthy Trial Fund to compensate jurors for lost income up to $300 per day.24
22 Paula Hannaford-Agor, Jury News: The Laborer is Worthy of His Hire and Jurors Are Worthy of Their Jury Fees, 21 CT. MGR. 38 (2006). 23 The states are Alabama (ALA. CODE § 12-6-8(c); Colorado (COLO. REV. STAT. § 13-71-126); Connecticut (CONN. GEN. STAT. § 51-247(a); Georgia (Attorney General Unofficial Opinion # U 89-55, Attorney General Official Opinion 95-13); Massachusetts (MASS. GEN. LAWS ch. 234A § 48; Nebraska (NEB. REV. STAT. § 25-1640); New York (N.Y. JUD. LAW Art. 16 § 521); and Tennessee (TENN. CODE ANN. § 22-4-108(B)(1)). 24 G. Thomas Munsterman & Cary Silverman, Jury Reforms in Arizona: The First Year, 45 JUDGES’ J. 18 (Winter 2006).
11

State Initial Rate or Flat Daily Rate
Graduated Rate
Trigger for Graduated Rate
Alabama $ 10.00Alaska $ 5.00 $ 25.00 Beginning 2nd DayArizona * $ .00 $ 12.00 Beginning 2nd DayArkansas $ 15.00 $ 35.00 Sworn JurorCalifornia $ .00 $ 15.00 Beginning 2nd DayColorado $ .00 $ 50.00 Beginning 4th DayConnecticut $ .00 $ 50.00 Beginning 6th DayDistrict of Columbia $ 30.00Delaware $ 20.00Florida $ .00 $ 30.00 Beginning 4th DayHawaii $ 30.00Idaho $ 10.00Iowa $ 10.00Kentucky $ 12.50Louisiana $ 25.00Maine $ 10.00Massachusetts $ .00 $ 50.00 Beginning 4th DayMichigan $ 25.00 $ 40.00 Beginning 2nd DayMinnesota $ 20.00Montana $ 12.00 $ 25.00 Sworn JurorNebraska $ 35.00Nevada $ .00 $ 40.00 Sworn JurorNew Hampshire $ 20.00New Jersey $ 5.00 $ 40.00 Beginning 4th DayNew Mexico $ 41.20New York $ 40.00North Carolina $ 12.00 $ 30.00 Beginning 6th DayNorth Dakota $ 25.00 $ 50.00 Beginning 2nd DayOklahoma $ 20.00Oregon $ 10.00 $ 25.00 Beginning 3rd DayPennsylvania $ 9.00 $ 25.00 Beginning 4th DayRhode Island $ 15.00South Dakota $ 10.00 $ 50.00 Sworn JurorTennessee $ 11.00Texas $ 6.00 $ 40.00 Beginning 2nd DayUtah $ 18.50 $ 49.00 Beginning 2nd DayVermont $ 30.00Virginia $ 30.00West Virginia $ 40.00
n/an/a
Table 7: State-Mandated Juror Compensation Structure
n/a
n/an/an/an/a
* Arizona also employs a Lengthy Trial Fund to compensate jurors up to $300 per day for lost income while on jury service. The LTF is available to jurors retroactively to the 4th day of service beginning on the 6th day of trial.
n/an/a
n/a
n/a
n/a
n/an/a
n/a
n/a
n/a
n/an/an/a
12

# Courts Reporting
Average Flat Rate
# Courts Reporting
Average Initial Rate
Average Graduated
Rate
Trigger for Graduated Rate
Georgia $ 5.00 56 $ 24.27 4 $ 16.25 $ 23.75 Beginning 2nd DayIllinois $ 4.00 76 $ 13.15 7 $ 9.29 $ 16.50 Beginning 2nd DayIndiana $ 15.00 33 $ 39.09 44 $ 16.07 $ 40.68 Sworn JurorKansas $ 10.00 9 $ 10.00 1 $ 10.00 $ 20.00 Beginning 2nd DayMaryland $ 15.00 22 $ 17.50 n/aMississippi $ 25.00 30 $ 28.50 3 $ 25.00 $ 33.33 Sworn JurorMissouri $ 6.00 32 $ 15.91 32 $ 10.27 $ 20.41 Sworn JurorOhio $ 10.00 1 $ 20.00 3 $ 11.67 $ 20.00 Sworn JurorSouth Carolina $ 10.00 19 $ 16.16 n/aWashington $ 10.00 22 $ 11.59 1 $ 10.00 $ 25.00 Sworn JurorWisconsin $ 16.00 n/aWyoming $ 10.00 2 $ 30.00 4 $ 30.00 $ 50.00 Beginning 5th Day
State
Table 8: Locally Supplemented Juror Fees
Flat Daily Rate StructureState
Mandated Minimum
Rate
Graduated Rate Structure
Jury Source Lists
Another area of jury operations in which states can either retain control or delegate authority to local courts is the choice of source list(s) that can be used to compile the master jury list. The total number of unique names derived from all source lists used to compile the master jury list defines the total population from which prospective jurors may be qualified and summonsed. Thus, the choice of source lists is an important policy decision for state courts insofar that it establishes the inclusiveness and the initial demographic characteristics of the potential jury pool.25 Thirty states mandate that courts within the jurisdiction use only the designated source lists, while 15 states and the District of Columbia permit local courts to supplement the required lists with additional lists. The remaining five states do not mandate the use of any specific source list, but enumerate the permissible lists that can be employed for this purpose.
For those states that mandate which source lists to use, the ones that occur most frequently are the voter registration list (38 states) and the licensed driver list (35 states). See Table 9. Nineteen states mandate the use of a combined voter/driver list. Eleven mandate the use of three or more lists – typically, registered voters, licensed drivers, and state income or property tax lists, although other combinations are also common. Seven states restrict the number of source lists to a single list: Mississippi and Montana mandate the use of the registered voters list only; Florida, Michigan, Nevada, and Oklahoma mandate the use of the licensed drivers list only; and Massachusetts employs a unique statewide census for its master jury list. 25 A substantial body of federal and state constitutional and statutory law requires that the pool from which prospective jurors are summonsed reflect “a fair cross section of the community,” specifically, its racial, ethnic, and gender demographic characteristics. See Duren v. Missouri, 439 U.S. 357 (1979). Because a broadly inclusive list of the jury-eligible population is more likely to mirror the demographic characteristics of the community, the National Center for State Courts recommends that the master jury list include at least 85 percent of the total community population. G. THOMAS MUNSTERMAN, JURY SYSTEM MANAGEMENT 4-5 (1996).
13
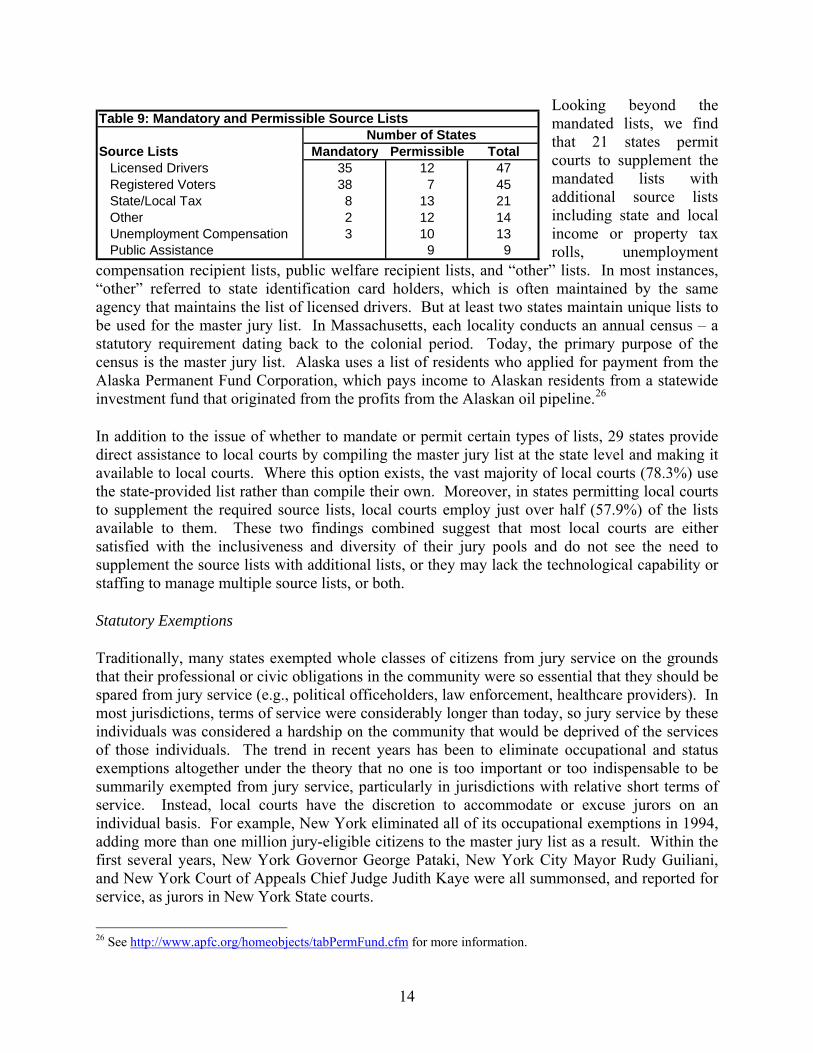
Looking beyond the mandated lists, we find that 21 states permit courts to supplement the mandated lists with additional source lists including state and local income or property tax rolls, unemployment ” lists. In most instances,
“other” referred to state identification card holders, which is often maintained by the same agency that maintains the list of licensed drivers. But at least two states maintain unique lists to be used for the master jury list. In Massachusetts, each locality conducts an annual census – a statutory requirement dating back to the colonial period. Today, the primary purpose of the census is the master jury list. Alaska uses a list of residents who applied for payment from the Alaska Permanent Fund Corporation, which pays income to Alaskan residents from a statewide investment fund that originated from the profits from the Alaskan oil pipeline.
Source Lists Mandatory Permissible TotalLicensed Drivers 35 12 47Registered Voters 38 7 45State/Local Tax 8 13 21Other 2 12 14Unemployment Compensation 3 10 13Public Assistance 9 9
Table 9: Mandatory and Permissible Source ListsNumber of States
compensation recipient lists, public welfare recipient lists, and “other
In addition to the issue of whether to mandate or permit certain types of lists, 29 states provide
Statutory Exemptions
Traditionally, many states exempted whole classes of citizens from jury service on the grounds
service, as jurors in New York State courts.
26
direct assistance to local courts by compiling the master jury list at the state level and making it available to local courts. Where this option exists, the vast majority of local courts (78.3%) use the state-provided list rather than compile their own. Moreover, in states permitting local courts to supplement the required source lists, local courts employ just over half (57.9%) of the lists available to them. These two findings combined suggest that most local courts are either satisfied with the inclusiveness and diversity of their jury pools and do not see the need to supplement the source lists with additional lists, or they may lack the technological capability or staffing to manage multiple source lists, or both.
that their professional or civic obligations in the community were so essential that they should be spared from jury service (e.g., political officeholders, law enforcement, healthcare providers). In most jurisdictions, terms of service were considerably longer than today, so jury service by these individuals was considered a hardship on the community that would be deprived of the services of those individuals. The trend in recent years has been to eliminate occupational and status exemptions altogether under the theory that no one is too important or too indispensable to be summarily exempted from jury service, particularly in jurisdictions with relative short terms of service. Instead, local courts have the discretion to accommodate or excuse jurors on an individual basis. For example, New York eliminated all of its occupational exemptions in 1994, adding more than one million jury-eligible citizens to the master jury list as a result. Within the first several years, New York Governor George Pataki, New York City Mayor Rudy Guiliani, and New York Court of Appeals Chief Judge Judith Kaye were all summonsed, and reported for
26 See http://www.apfc.org/homeobjects/tabPermFund.cfm for more information.
14

In the Statewide Survey, the NCSC identified 10 distinct categories of exemptions. See Table 10. The most common category (47 states) was “previous jury service,” a classification exempting citizens who have recently performed jury service, typically within the past 12 to 24
Nevertheless, states vary considerably in the numbedian number of exemption categories was 3 per state. Louisiana is the only state that has no
exemptions whatsoever. Twelve states and the District of Columbia provide exemptions only for
A final area of state versus local control over jury operations involves the process through which ighteen states and the District of
Columbia specify that local courts employ a one-step process in which jurors are summoned and qualified simultaneously, while five states mandate that local courts employ a two-step process
months. Another popular category (27 states) of exemption was age, typically extended to older citizens.27 Most of the categories designated various occupational or status roles for which citizens could claim an exemption from jury service (e.g., political officeholders, judicial officers, sole caregivers of young children including nursing mothers, or sole caregivers of incompetent adults). The “Other Exemptions” category included a variety of occupations including clergy or other religious designations, journalists, mariners, public accountants, and teachers. Alaska provides an exemption to teachers from schools that fail to meet adequate progress standards under the No Child Left Behind Act.28
Table 11: Number of Exemption Categories by State
er of exemptions authorized by statute. The m
previous jury service. Florida provides exemptions in the nine out of the ten categories, the most of any state. See Table 11.
One-Step versus Two-Step Jury Qualification and Summoning
local courts qualify and summon citizens for jury service. E
0
1
2
3
4
5
6
7
8
9
AZ, DE, MI, NC, OR, SC, WY
AK, MA, MN, MO, NJ, OH, TX, WV
CT, GA, ME, MS, NE
LA
AL, AR, CO, DC, ID, IA, MT, NM, NY, UT, VT, WA, WICA, IL, IN, KS, KY, MD, NV, NH, ND, PA, SD
HI, RI
OK, TN, VA
FL
Previous Jury ServiceAgePolitical OfficeholderLaw EnforcementOther ExemptionsJudicial OfficersHealthcare ProfessionalsSole CaregiverLicensed AttorneysActive Military
161212
5
9776
# States4727
Table 10: Statutory Exemption Categories
27 The most common age to qualify for an exemption was 70 (16 states). The exemption in the remaining states ranged from 65 (4 states) to 75 (3 states). 28 ALASKA STAT. § 09.20.030(b).
15

in which citizens are first surveyed to determine their eligibility for jury service, and then only qualified jurors are summoned for service. The remaining 25 states leave this decision to the discretion of the local courts.
We see from these various examples that states vary a great deal in terms of how closely jury operations are dictated at the state level or left to the discretion of local courts. Table 12 ranks all of the states and the District of Columbia according to their respective restrictiveness or permissiveness vis-à-vis local jury operations. The rankings are based on a composite index reflecting whether all source lists are required, whether the state permits localities to supplement the jury fee, whether the term of service is mandated at the state level, whether the state authorizes more than the median number of exemptions, and whether the state mandates the summoning/qualification process. The index ranges from 0 (most permissive) to 5 (most restrictive).
Most Restrictive CT, FL, ME, MA, RI
Table 12: State Control Over Jury Operations
Mostly Restrictive CO, HI, KY, MN, MT, NE, NH, NJ, NM, OK, TX, UT, WV
Somewhat Restrictive AZ, DC, DE, IA, MS, NV, ND, SD, VT
Somewhat Permissive AL, AK, CA, GA, ID, LA, MI, NY, OH, SC, TN, VA
Mostly Permissive AR, IL, IN, MO, NC, OR, PA, WA
Most Permissive KS, MD, WI, WY
Interestingly, the degree of state restrictiveness over jury operations has no significant relationship to number of jury improvement efforts underway in those states.29 Nor does it appear to be related to the volume of jury trials or the trial rate for each state.30 This suggests that jury reform has not followed either an exclusively top-down or exclusively grassroots
approach, or even one dictated by exigencies associated with the volume or frequency of jury trials. Rather, the various approaches derive from unique institutional and political cultures in each jurisdiction. Given that reality, we now take a closer look at variations in local court operations.
29 Pearson = .016, ns. The only restrictiveness factor that had a significant relationship to the number of jury improvement efforts was whether the term of service is determined at the state or local level. When the term of service is determined at the state level, the number of jury improvement efforts was 3.33 compared to 2.00 when the term of service is determined at the local level. F (1, 49) = 4.404, p = .041. 30 Pearson (Number of jury trials) = .219, ns; Pearson (Trial rate) = -.064, ns.
16

IV. LOCAL COURT SURVEY
As discussed in the previous section, some jury operations may be dictated at the state level while others are left to the discretion of the local courts. While state statutes and court rules can define the institutional structure in which jury operations take place, they do not always provide an accurate picture of how local jury systems actually operate. Nor does the existence of statewide jury improvement efforts, or lack thereof, necessarily indicate the extent of locally initiated improvement efforts. The Local Courts Survey was designed to provide a more complete picture of jury operations nationally by highlighting local jury operations and improvement priorities in greater detail and examining the impact of state infrastructures and statewide initiatives on local operations and initiatives.
Nationally, we find that approximately half (51.8%) of courts report some type of jury improvement activities in the past five years. Over one-third (34.4%) reported some type of formal jury office or jury management committee responsible for oversight of local jury operations. Not surprisingly, these efforts tend to be concentrated in urban and large suburban courts with higher volumes of jury trials. Yet even in rural jurisdictions (e.g., population less than 25,000), more than one in three courts (36.7%) reported some type of jury improvement activity.
The single most popular focus of local jury improvements was upgrading jury automation, but other, more substantive efforts captured the attention of a substantial portion of courts. See Table 13. The majority of courts (75.2%) that reported any improvement efforts actually focused on multiple areas. The median number was three, but nearly 10% reported 7 or more different efforts underway. Courts also tended to undertake certain improvement efforts in conjunction with others. For example, courts that reported recent efforts to improve jury yield were also often engaged in specific efforts to decrease non-response rates. Other courts focused on in-court techniques to improve juror comprehension and jury instructions simultaneously.
Focus on … % of Courts
Upgrade Technology 58.8Decrease Non-Response Rate 53.7Improve Jury Yield 44.5Improve Facilities 43.1Improve Juror Utilization 42.2Improve Public Outreach 35.8Improve Jury Representation 32.8Improve Jury Instructions 29.2Improve Juror Comprehension 23.0Other Improvement Effort 10.9
Table 13: Local Court Jury Improvement Efforts
The existence and magnitude of local jury improvement efforts correlated, not surprisingly, with population size and jury trial volume.31 Courts with more jury trials and those in urban communities were more likely than rural courts to initiate improvement efforts. Statewide leadership in the form of a centralized jury management office or statewide task force/commission clearly played a substantial role in motivating local court activity. For example, local courts were significantly more likely to undertake local improvement efforts in
31 Population Rho = .383, Jury Trial Volume Rho = .210, both ps < .001.
17

states with a statewide jury task force or commission (56% of local courts) compared to those in which no statewide effort was underway (34% of local courts).32
This “trickle-down” effect of statewide leadership appeared to spur the existence of local court improvement efforts in some interesting ways. Certainly it affected the number of areas in which local courts try to improve jury operations. In states with a jury task force, the average number of efforts that local courts undertook was 3.2 compared to 1.6 in states with no statewide task force.33 In particular, statewide activities focused on court staff education and on changes to legislation or court rules appeared to have an impact on how many jury improvement efforts were undertaken at the local level,34 increasing the number of local court efforts on average by 50 to 70 percent. Whether increased activity on the local level results more from the educational efforts of the statewide task forces or in reaction to changes in state law is not known, and may not be possible to differentiate given the typical approach by many states of delivering local education about proposed or enacted changes to state law. As a practical matter, both motivations may play a part.
Jury Automation in Local Courts
As noted above at Table 13, upgrades to jury technology was the single most frequently reported focus of local jury improvement efforts, undertaken by 59 percent of courts reporting any improvement efforts. Although the Statewide Surveys didn’t specifically inquire about this aspect of jury operations, several states indicated concerted efforts to improve jury system technology. In other states, it was clear from the Local Court Surveys that various automation improvements had been initiated on a statewide basis. For example, in the District of Columbia, Massachusetts, New York, and North Carolina, all or nearly all of the local courts reported ongoing upgrades to jury system technology. Other examples that suggested a coordinated statewide effort included Arizona, in which three-quarters of the local courts reported the use of video during juror orientation; Iowa, in which more than half (54%) of local courts reported that citizens can check their reporting status on-line; California, which reported a statewide effort to equip jury assembly rooms with Internet access; South Dakota, which reported a legislative mandate to improve jury management technology; Missouri, which is implementing a statewide jury management system (30% of local courts reported that this had been completed in their jurisdiction); and Alaska, which is in the process of implementing an online jury software program. The apparent discrepancy between some of the Statewide Survey descriptions of improvements in jury automation and reports by local courts about technology improvements in their jurisdictions may be due to an implementation lag in the local courts or possibly that some local courts did not report these improvements because they were initiated at the state level rather than at the local level.
Approximately two-thirds of courts use some form of commercial software for their jury management systems. This market tends to be dominated by two national vendors – Jury
32 F (1, 1,342) = 39.00, p < .001. The existence of a statewide jury office had a similar, albeit diminished, effect (57% versus 44%). F (1, 1,172) = 21.599, p < .001. 33 F (1, 1,394) = 44.310, p , .001. 34 Court Staff Education F (1 ,46) = 4,323, p = .043; Change Legislation/Court Rules F (1, 46) = 6.873, p = .012.
18

Systems, Inc. (based in Encino, California) and ACS Government Systems (based in Lexington, Kentucky). Combined, these two firms held 42 percent of the commercial jury management contracts in the State-of-the-States Survey courts. These national vendors also tended to dominate in more populous jurisdictions compared to other commercial vendors.35 For example, the national vendors held 83% of the commercial contracts for courts in counties greater than 500,000 population and 59% of the commercial contracts for courts in counties with a population between 100,000 and 500,000, but only 35% of commercial contracts in courts with populations less than 100,000.
The remaining commercial vendors appear to concentrate their market on a statewide or regional basis. Just over one-third of local courts (34.8%) reported that they maintain in-house jury management systems. Courts in rural and smaller suburban jurisdictions were more likely to use commercial jury management software than those in more populous areas that, presumably, can afford to develop and support an in-house system. Not surprisingly, the use of more sophisticated forms of automation was more prevalent in courts located in urban areas compared to those in suburban and rural areas. See Table 14.
500,000 or More
100,000 to 500,000
25,000 to 100,000
Less than 25,000 All Courts
N = 84 233 404 526 1,247
Commercial Jury Software 56.5 59.2 62.4 76.1 65.2
Juror QualificationOnline 47.6 19.7 9.9 1.9 11.0IVR Technology 33.3 12.0 8.4 .8 7.5
Reporting TechnologyTelephone Call-In System 86.9 82.4 70.9 42.7 62.2Online 40.5 22.3 12.1 1.9 11.5Automated Call-Out System 2.4 2.3 3.5 3.5 3.2
OrientationBasic Information Online 61.9 36.6 17.8 61.0 19.1Orientation Video Online 22.6 10.1 8.0 1.6 6.6Orientation Video on Cable Television 3.6 1.2 .9 .7 1.0
Population Size
Table 14: Percent of Courts Using Various Types of Technology
The most popular form of technology, by a large margin, continues to be the telephone. Nearly two-thirds of courts employ a telephone call-in system to inform citizens about whether they should report for jury service. One-third of urban courts have implemented Interactive Voice Recognition (IVR) technology to permit citizens to respond to qualification questionnaires using their telephones. Some commercial vendors have developed an interface between the court’s jury management system and the telephone system to enable courts to send an automated voice message to citizens the day before they are scheduled to report reminding them of their
35 Chi-Square = 58.782, p < .001.
19

obligation or informing them that their service will not be needed that day,36 but this feature does not appear to have caught on in most courts yet. Indeed, it appears that rural and smaller suburban courts are actually more likely to telephone jurors manually to inform them about reporting status than larger suburban and urban courts are to use an automated call-out system.
Although web-based technology is ubiquitous in most areas of contemporary life, local courts do not appear to have embraced it for jury management purposes. Less than 20% provide basic juror orientation information online and barely more than half that percentage use the Internet for juror qualification or informing jurors about their reporting status. This technology was somewhat more prevalent for various applications in urban courts, but with the exception of posting orientation information online, fewer than half of the courts serving populations greater than 500,000 used Internet technology. Interestingly, courts that rely on commercial jury management software were actually less likely to employ all of the more sophisticated types of automation, even after controlling for population size.37
Several factors may be influencing courts’ decisions to use or not use these technologies. For example, courts employing either JSI or ACS commercial software were significantly more likely to use Internet or IVR technology for qualification, reporting, and orientation purposes than courts using state or regionally based commercial vendors.38 This suggests that state and regionally based vendors may not have incorporated the capacity for their jury management systems to interface with the courts’ telephone and Internet systems yet. Existing technology options may also be prohibitively costly for less populous courts, or possibly, those courts may be unwilling to employ technologies that they believe are not readily available to the majority of citizens in their communities due to the digital divide.
Jury Yield in Local Courts
The term “jury yield” refers to the number of citizens who are found to be qualified and available for jury service expressed as a percentage of the total number of qualification questionnaires or summonses mailed. It is a critical concept in jury system management insofar as it provides a standard measure of efficiency for jury operations. In essence, it measures the upfront administrative effort and cost that the court undertakes in securing an adequate pool of prospective jurors for jury selection. Courts employing a two-step qualification and summoning
36 G. THOMAS MUNSTERMAN & PAULA L. HANNAFORD-AGOR, THE PROMISE AND CHALLENGES OF JURY SYSTEM TECHNOLOGY 44-45 (NCSC 2003). 37 This finding derives from a series of logistic regression models in which a dummy variable (Commercial Vendor) was included as an independent variable to examine the probability that various types of IVR or Internet technology were employed in the court’s jury system controlling for population size. IVR Qualification Cox & Snell R Square = .098, Commercial Vendor Wald = 32.045, B = -1.413, p < .001; Online Qualification Cox & Snell R Square = .112, Commercial Vendor Wald = 27.855, B = -1.088, p < .001; Online Orientation Information Cox & Snell R Square = .134, Commercial Vendor Wald = 45.997, B = -1.100, p < .001; Online Video Orientation Cox & Snell R Square = .088, Commercial Vendor Wald = 61.692, B = -2.277, p < .001;Reporting Information Online Cox & Snell R Square = .086, Commercial Vendor Wald = 34.289, B = -1.125, p < .001; and Telephone Call-In System Cox & Snell R Square = .064, Commercial Vendor Wald = 8.162, B = -.415, p = .004. 38 Qualification by IVR F (1,638) = 5.532, p = .019; Qualification Online F (1, 638) =36.878, p < .001; Reporting Online F (1, 638) = 12.713, p <.001; Orientation Online F (1, 638) = 23.326, p < .0o01.
20
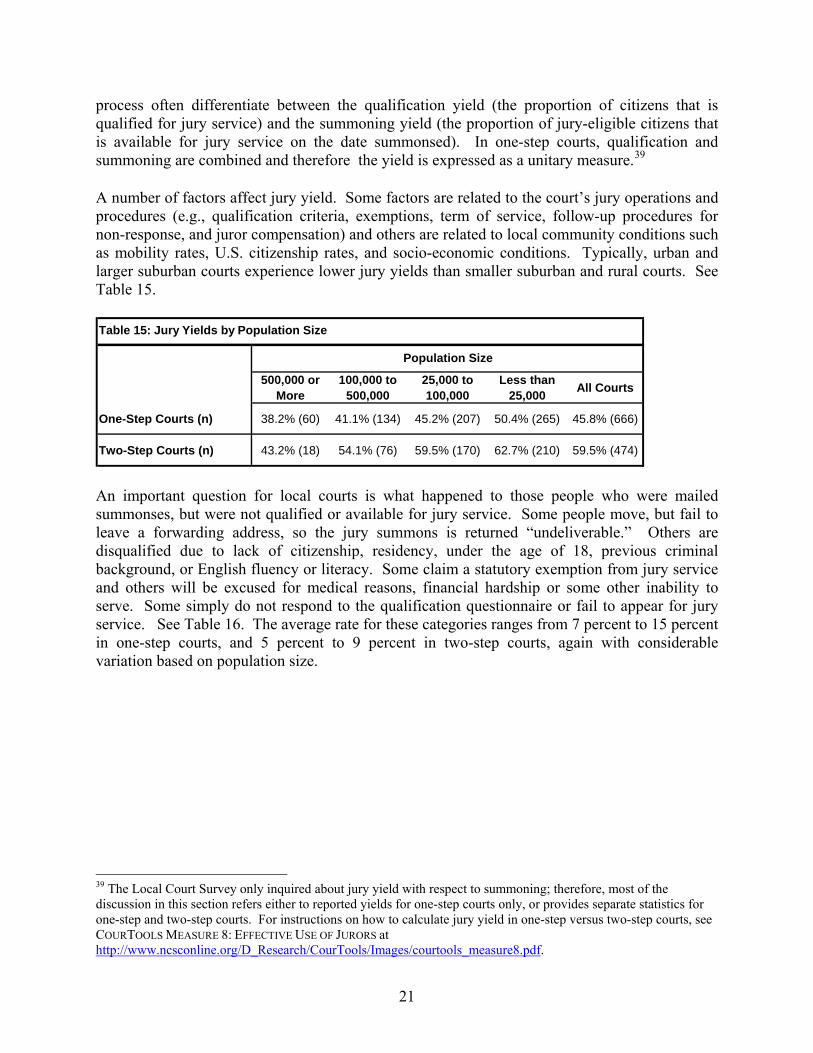
process often differentiate between the qualification yield (the proportion of citizens that is qualified for jury service) and the summoning yield (the proportion of jury-eligible citizens that is available for jury service on the date summonsed). In one-step courts, qualification and summoning are combined and therefore the yield is expressed as a unitary measure.39
A number of factors affect jury yield. Some factors are related to the court’s jury operations and procedures (e.g., qualification criteria, exemptions, term of service, follow-up procedures for non-response, and juror compensation) and others are related to local community conditions such as mobility rates, U.S. citizenship rates, and socio-economic conditions. Typically, urban and larger suburban courts experience lower jury yields than smaller suburban and rural courts. See Table 15.
500,000 or More
100,000 to 500,000
25,000 to 100,000
Less than 25,000 All Courts
One-Step Courts (n) 38.2% (60) 41.1% (134) 45.2% (207) 50.4% (265) 45.8% (666)
Two-Step Courts (n) 43.2% (18) 54.1% (76) 59.5% (170) 62.7% (210) 59.5% (474)
Table 15: Jury Yields by Population Size
Population Size
An important question for local courts is what happened to those people who were mailed summonses, but were not qualified or available for jury service. Some people move, but fail to leave a forwarding address, so the jury summons is returned “undeliverable.” Others are disqualified due to lack of citizenship, residency, under the age of 18, previous criminal background, or English fluency or literacy. Some claim a statutory exemption from jury service and others will be excused for medical reasons, financial hardship or some other inability to serve. Some simply do not respond to the qualification questionnaire or fail to appear for jury service. See Table 16. The average rate for these categories ranges from 7 percent to 15 percent in one-step courts, and 5 percent to 9 percent in two-step courts, again with considerable variation based on population size.
39 The Local Court Survey only inquired about jury yield with respect to summoning; therefore, most of the discussion in this section refers either to reported yields for one-step courts only, or provides separate statistics for one-step and two-step courts. For instructions on how to calculate jury yield in one-step versus two-step courts, see COURTOOLS MEASURE 8: EFFECTIVE USE OF JURORS at http://www.ncsconline.org/D_Research/CourTools/Images/courtools_measure8.pdf.
21

One-Step CourtsUndeliverable 15.1 14.4 16.0 13.5 14.6Disqualified 12.4 10.1 7.5 7.4 8.4Exempted 4.0 6.7 8.4 7.6 7.3Excused 9.4 9.5 9.1 9.1 9.2Non-Response/FTA 15.0 10.9 8.6 6.7 8.9
Two-Step CourtsUndeliverable 6.6 10.2 8.2 10.0 9.2Disqualified 6.5 9.6 7.8 6.6 7.5Exempted 2.9 3.4 4.7 6.3 5.1Excused 4.4 6.4 5.2 6.5 5.9Non-Response/FTA 13.1 6.2 5.9 5.4 6.0
Table 16: Average Undeliverable, Disqualification, Exemption, Excusal and Non-Response Rates, by Population Size
Population Size
Less than 25,000 All Courts500,000 or
More100,000 to
500,00025,000 to 100,000
More to the point, how can courts increase the jury yield by minimizing the number of people who fall into the not qualified and unavailable categories? As a practical matter, courts have few options other than acceptance when the people who are summonsed for jury service are disqualified (e.g., non-citizen, non-resident, under age 18, previous felony conviction, not fluent in English) as these criteria are minimum qualifications for jury service established by state legislatures. However, courts have developed a number of approaches to minimize other factors that affect jury yields. With respect to undeliverable summonses, for example, many courts have borrowed techniques from commercial mail-order companies such as contracting with National-Change-of Address (NCOA) vendors to provide updated addresses for people who have moved since the master jury list was compiled. Courts using multiple source lists to compile the master jury list should use the most frequently maintained list, or the most recently updated address, when deciding which of two or more duplicate records to retain.40 Analyses of the impact of the number and types of source lists on undeliverable rates were difficult to interpret, however. The use of state tax, unemployment compensation, and public welfare lists resulted in significantly reduced undeliverable rates in two-step courts.41 But unemployment and public welfare lists had no effect on undeliverable rates in one-step courts, and state tax lists correlated with significantly higher undeliverable rates in one-step courts.42 Additional research is needed to investigate these divergent findings and, if possible, to identify ways of maximizing the benefits of supplemental source lists.
Exemptions are established by state statute. As we discussed in the previous section, the number of exemption categories ranges from zero in Louisiana to nine in Florida. The number of exemption categories had a significant affect on exemption rates in one-step courts within those 40 G. THOMAS MUNSTERMAN & PAULA L. HANNAFORD-AGOR, THE PROMISE AND CHALLENGES OF JURY SYSTEM TECHNOLOGY 20-21 (NCSC 2003). 41 State Tax List F (1, 432) = 25.384, Unemployment List F (1, 432) = 38, 867, Public Welfare List F (1, 432) = 37.158, all ps < .001. 42 State Tax List F (1, 633) = 17.611, p < 001.
22

states43 – from an average of 4.7 percent in states with only one exemption to 14.3 percent in states with seven exemption categories. Florida, which had the highest number of exemption categories (9), had the second highest exemption rate (12.2%).
Similarly, term of service and juror compensation rates affect excusal rates. In Table 6, we saw that 28.6 percent of the U.S. population lives in states that mandate a one day or one trial term of service. Table 17 presents the actual breakdown for term of service for all of the courts represented in the Local Court Survey dataset. We find that more than one-third of local courts, and nearly two-thirds of the U.S. population,44 live in jurisdictions that have a one day or one trial term of service. It is clear from the difference between these percentages that courts in more populous jurisdictions are more likely to adopt one day or one trial terms of service than those in less populous jurisdictions.
Term of Service # of Courts % of Courts
Average # Jury Trials Annually
Estimated % of US Population
One Day or One Trial 490 35.1 129 63.4
Two to five days (one week) 213 15.3 85 17.8Six days to 1 month 327 23.4 46 11.7Greater than 1 month to 6 months 283 20.3 21 5.9Longer than 6 months 82 5.9 15 0.2
Table 17: Term of Service in Local Courts
As we discussed in Section III, the term of service defines the maximum amount of time that a person may be required to serve on jury duty. Although some courts establish the maximum term of service at six months or longer, it is clear from the average volume of jury trials conducted in these courts that very few citizens, if any, would ever actually report to their local courthouse for that period of time. Indeed, half of the courts in this category had four or fewer trials annually – less than one every three months. or many of these courts, the functional term of service is likely to be one day or one trial – or could be with little or no administrative effort on the part of the court – even if it is not stated as such.
Returning to the relationship between term of service and excusal rates, courts with a one day or one trial term of service had significantly lower excusal rates than those with longer terms of service (6.0 percent versus 8.9 percent, respectively).45 See Table 18. Moreover, courts with juror fees exceeding the national average ($21.95 flat fee or $32.34 graduated rate) also had significantly lower excusal rates – 6.8 percent compared to 8.9 percent for courts whose juror fees were lower than the national average.46 Courts with both a one day or one trial term of
43 We did not calculate the exemption rate in two-step courts because presumably anyone claiming the exemption had already done so at the qualification step. 44 Estimates for the proportion of US population were calculated using the methods described in Appendix E. 45 F=23.966 (1, 1,100), p < .001. 46 F=16.445 (1, 1,195), p < .001.
23

service and higher than average juror fees had excusal rates of 4.0 percent compared to 9.3 percent for those with longer terms of service and lower than average juror fees.
One Day / One Trial
Longer than One Day / One Trial Total
Juror Fee Exceeds National Average 4.1% 8.3% 6.6%
Juror Fee is Less than National Average 8.1% 9.3% 8.9%
Total 6.0% 8.9% 8.0%
Table 18: Average Excusal Rates, by Term of Service and Juror Compensation
Courts across the country have been increasingly challenged by citizens who fail to return their qualification questionnaires or who fail to appear (FTA) for jury service. Twenty percent of one-step courts reported non-response/FTA rates of 15 percent or higher. Even more remarkable, 10 percent of two-step courts, which had already located and qualified the prospective juror, reported FTA rates of 16 percent or higher. To address these problems, 80 percent of courts in the State-of-the-States Survey reported some type of follow-up program to track down non-responders and FTAs. See Table 19. The most common approach in both one-step and two-step courts was simply to send a second qualification questionnaire or summons. Two-step courts conducted order-to-show-cause (OSC) hearings about twice as often as one-step courts. Less than 15 percent of courts imposed fines on non-responders, although most state statutes permit this penalty. About one-fourth of courts had other types of follow-up programs, which often involved issuing a bench warrant ordering the local sheriff’s office to physically compel the juror’s presence in court.
Several factors affected the number of follow-up programs a court might employ. Two-step courts had significantly more follow-up programs, on average, than one-step courts, presumably because they have to conduct follow-up on two different stages of jury operations. Motivation also played a part – courts focusing on decreasing non-response/FTA rates reported more follow-up programs. This was especially true in urban and larger suburban courts, which tended to have higher non-response/FTA rates than less populous jurisdictions.
% of Courts
One-Step Courts (N=793)No Program 21.8Second Summons 52.0OSC Hearings 27.5Fines 13.7Other 25.0Multiple Programs 51.8
Two-Step Courts (N=531)No Program 14.5Second Summons 51.9OSC Hearings 49.4Fines 13.4Other 22.0Multiple Programs 57.6
Table 19: Non-Response and FTA Programs
Follow-up programs had various degrees of effectiveness. After controlling for population size and one-step or two-step jury operations, the Local Court Survey data showed that only those follow-up programs that involved a second summons or qualification, or that involved some other approach (e.g., bench warrant),
24

significantly reduced non-response/FTA rates.47 OSC hearings and fines had no effect, possibly due to the infrequency with which they are typically imposed. Courts that had no follow-up program had significantly higher non-response/FTA rates.48
Juror Privacy
As in other areas of contemporary life, courts have begun to recognize the need to respect jurors’ legitimate expectations of privacy. Unlike judges, clerks of court, and other public officials, jurors do not deliberately seek out this particular form of public service and do not, therefore, automatically surrender all expectations of privacy. In particular, they have a right to expect that personal information will be disclosed only to those individuals with a legitimate need for it and that the information will only be used for the purposes of jury administration and jury selection. To meet those expectations, courts have increasingly placed restrictions on the types of information that prospective jurors are required to disclose, to whom that information may be subsequently released, and at what point in the trial process (e.g., pre-trial, jury selection, post-trial) it can be released.49
Attorneys and their clients arguably have the greatest legitimate interest in access to juror information. The extent to which courts makes juror information available to attorneys before jury selection begins is a reasonable indication of the extent to which courts have enacted policies and procedures to protect juror privacy. Table 20 indicates the percentage of local courts that reported providing attorneys with access to juror information before jury selection begins. The vast majority of courts disclose the names of prospective jurors to attorneys before voir dire, but a substantial number of courts restrict access to additional information. For example, more than one-third of courts reported that they will not provided attorneys with a full street address, making it difficult, if not impossible in many jurisdictions, for attorneys to conduct background investigations on prospective jurors. More than one-quarter (26.7%) of courts reported that they provide no address information whatsoever on prospective jurors. Nearly half of all courts restrict access to qualification information.
In many states, access to juror information is restricted by state statute or court rule. Thus, we found that access to some of these categories of information was restricted in all of the Local Court respondents. For example, access to jurors’ full street address was uniformly denied in courts in Arizona, Delaware, Hawaii, New Jersey, and the District of Columbia. New Jersey and the District of Columbia do provide access to jurors’ zip codes, however. Similarly, Delaware, Massachusetts, North Carolina, and the District of Columbia restrict
Juror Name 88.3%
Full Street Address 63.5%
Zip Code Only 12.8%
Qualification Information 55.2%
Table 20: Attorney Access to Juror Information Before Jury Selection Begins
Type of Juror Information % of Courts
47 F (7, 1,121) = 18.750, p < .001. 48 One-Step Non-Response/FTA Rate F (1, 648), p < .001; Two-Step Non-Response/FTA Rate F (1, 470), p = .096. 49 See generally Paula L. Hannaford, Safeguarding Juror Privacy: A New Framework for Court Policies and Procedures, 85 JUDICATURE 18 (2001).
25

access to juror qualification information.
In addition to basic information such as name and address, the majority of courts obtain preliminary voir dire information from prospective jurors, such as marital status (64%), occupation (72%), number and ages of minor children (52%), and other information not directly related to juror qualification criteria or contact information (28%). To gauge the extent to which local courts provide this type of information to attorneys, the NCSC Center for Jury Studies created a numerical index ranging from 0 to 4 to indicate the number of categories (marital status, occupation, number and ages of minor children, and other) of voir dire information that courts make available to attorneys before jury selection begins. Nationally, local courts provided information on an average of 2.21 categories of voir dire information (median 3 categories), but again there was a great deal of state-to-state variation. The median index for six states (Alaska, California, Colorado, North Carolina, Oklahoma, and Utah) was less than 1, indicating very little access to juror information before voir dire. The statewide median for Hawaii, Minnesota, Massachusetts, and New Hampshire was 4, indicating that local courts routinely provide this information to attorneys.
All of these preliminary operational matters obviously have substantial implications for the efficiency and cost-effectiveness of each court’s jury system. More sophisticated technologies can reduce staff time and associated costs as well as provide better management information to court administrators to assess performance and focus on problem areas. Improved jury yields essentially translate as reduced administrative costs per juror summonsed for service. Restrictions on access to juror information do not necessary reduce costs or boost efficiency, although in some instances courts that have reviewed their approach to juror privacy have declined to collect juror information for which they do not perceive a legitimate need for jury administration or selection purposes. It should not be overlooked, however, that operational matters also provide citizens with their first impressions of jury service. It establishes what they can expect from courts in terms of convenience in communication with the jury office, demands on their time, reimbursement for out-of-pocket expenses, and the levels of respect for privacy. It is clear from examining the Local Court Surveys that state courts differ a great deal across all of these dimensions. As we discuss in the next section, citizens also experience a variety of practices in the courtroom during jury selection (voir dire) and during trial.
26

V. JUDGE & LAWYER SURVEY
The previous section focused on local court operations such as how prospective jurors are qualified and summonsed for jury service, how long they serve, and what type of improvements efforts courts have undertaken. In this section, we examine data from the Judge & Lawyer Survey, which focused primarily on in-court procedures and trial innovations. Just as local court operations can vary from court to court, even within states, in-court practices and procedures can vary from judge to judge, even within local courts. To some extent, in-court practices are affected by court rules and case law proscribing acceptable and unacceptable procedures, but the majority of states leave a great deal of discretion in the hands of the trial judge to determine how to manage the jury trial and what tools or assistance, if any, can be provided to jurors. How this discretion is exercised often depends greatly on local litigation culture. This component of the State-of-the-States Survey is the first known study to document on a national basis the extent to which judges employ various practices and procedures during voir dire, trial, and jury deliberations.
Voir Dire
Jury selection practices vary tremendously from state to state across a number of key characteristics. For example, all courts agree that the purpose of voir dire is to identify and remove prospective jurors who are unable to serve fairly and impartially. But not all states recognize the exercise of peremptory challenges as a legitimate purpose of voir dire. Although most judges frown on the practice, many lawyers also view the voir dire as the beginning of trial advocacy – that is, their first opportunity to gain favor with the trial jurors or even present evidence if they can.
Other key differences in voir dire among states are the number of peremptory challenges available to each side; the legal criteria for ruling on challenges for cause; and the basic mechanics of voir dire such as judge-conducted or lawyer-conducted questioning, the use of general or case-specific questionnaires, and panel versus individual questioning.
Figure 1: Who Conducts Voir Dire?
0
10
20
30
40
50
% o
f Res
pond
ents
State Courts Federal Courts
JudgeOnly
Judge w/ Limited Attorney
Attorney w/ Limited Judge
AttorneyOnly
Judge & Attorney Equally
Figure 1 illustrates the continuum of voir dire questioning from an exclusively judge-conducted voir dire on the left to an exclusively attorney-conducted voir dire on the right. Although attorney-conducted voir dire is common in state courts and judge-conducted voir dire is the norm in federal courts, there is still substantial state-to-state variation. See Table 21. In addition, attorney
27

participation in voir dire was slightly, but significantly, higher50 in civil trials than in criminal trials in 19 states, suggesting that judges in those jurisdictions are less restrictive in jury selection in civil trials. In two states – Massachusetts and New Jersey – the pattern was reversed, with judges exerting greater control in civil trials and giving lawyers slightly more participation in criminal trials.
The balance between judge-conducted and attorney-conducted voir dire is importanfor several reasons. Empirical research supports the contention that juror responses to attorney questions are generally more candid because jurors are less intimidated and less likely to respond to voir dire questions with socially desirable answers.
t
Who questions the prospective jurors is not the only aspect of voir dire that can differ
Judges and attorneys
e
51 Moreover, attorneys are generally more knowledgeable about the nuances of their cases and thus are better suited to formulate questions on those issues than judges. On the other hand, many judges prefer to conduct most or all of the voir dire themselves. They argue that attorneys waste too much time and unduly invade jurors’ privacy by asking questions that are only tangentially related to the issues likely to arise at trial.
substantially from judge to judge and from court to court. The methods that judges and attorneys use to question jurors and to learn jurors’ responses also vary considerably, both in form and in combinations of forms. See Table 22. For example, the vast majority of judges and attorneys (86%) reported that in their most recent jury trial, at least some questions were posed to the full panel, usually with instructions to answer by a show of hands. Another common approach is to question each juror individually in the jury box, moving from juror to juror until the entire venire
panel has been questioned.
have gradually become more aware of jurors’ reluctance to disclose sensitive or embarrassing information in the ly one-third reported presence of the entire jury panel and courtroom observers. Approximat
ge and Attorney Conduct Voir Dire Equally
edominantly or Exclusively Attorney-Conducted Voir Dire
AZ, DC, DE, MA, MD, ME, NH, NJ, SC, UT
CA, CO, HI, ID, IL, KY, MI, MN, MS, NM, NV, NY, OH, OK, PA, VA, WI, WV
AK, AL, AR, CT, FL, GA, IA, IN, KS, LA, MO, MT, NC, ND, NE, OR, RI, SD, TN, TX, VT, WA, WY
: Who Conducts Voir Dire in State Courts?
Predom
Jud
Pr
Table 21
inantly or Exclusively Judge-Conducted Voir Dire
Table 22: Voir Dire Methods
State Courts Federal CourtsQuestions to prospective jurors in the venire… Full Panel 86 86 Individuals in the Jury Box 63 52 Individuals at Sidebar / Chambers 31 31 General Questionnaire 34 33 Case Specific Questionnaire 5 10
% of Respondents
50 The average difference in ratings between criminal and civil voir dire in these states was only .45 higher on a scale of 1 (exclusively judge-conducted voir dire) to 5 (exclusively attorney-conducted voir dire). The only state with a difference greater than 1 was New York, for which survey respondents indicated that criminal voir dire was slightly dominated by judges (2.81), but civil voir dire was heavily dominated by lawyers (4.58). 51 Susan E. Jones, Judge versus Attorney-Conducted Voir Dire, 11 L. & HUMAN BEHAV. 131 (1987).
28

that jurors were given the opportunity to answer questions in the relative privacy of a sidebar conference or in the judge’s chambers. Other judges and lawyers provide jurors with written questionnaires to remove the necessity of disclosing information orally.
Most of these techniques are used in combination with one another. Fewer than one-third of jury
Capital felony trials required the greatest amount of time to impanel a jury; the median was 6
Not surprisingly, a number of trial characteristics in addition to case type can affect the length of
To illustrate how to read this table, consider the example of a civil trial in which the judge and
the length of voir dire.
trials relied on a single voir dire technique. In nearly half of the trials, voir dire involved direct questioning of the entire panel with supplemental individual questioning in the jury box or at sidebar. Seventeen percent (17%) of trials involved all three methods. Written questionnaires supplemented oral voir dire in 38 percent of the trials and were the only form of voir dire in 1 percent of the trials.
hours in state courts and 7 hours in federal courts. Non-capital felony trials and civil trials required 2 hours, and misdemeanor trials only 1.5 hours in state courts and 1 hour in federal courts. These figures mask a great deal of variation, however. For example, South Carolina consistently reported the shortest average voir dire time (30 minutes) in both felony and civil trials, with Delaware and Virginia closely following (1 hour or less). South Carolina relies heavily on the use of written questionnaires that are distributed to attorneys before voir dire, rather than oral questioning in court. Connecticut consistently had the longest voir dire time – 10 hours in felony trials and 16 hours in civil trials, ostensibly due to the statewide practice of predominantly attorney-conducted individual voir dire with each prospective juror. See Appendix F, Tables 2 and 3, for state-by-state comparisons of voir dire length in felony and civil trials.
jury selection including the number of jurors to be impaneled, the number of peremptory challenges, and the relative level of evidentiary and legal complexity that jurors are likely to encounter during trial. Table 23 indicates the average number of minutes that are added to or subtracted from the length of voir dire by these factors as well as by the use of various voir dire practices. The values were calculated using linear regression methods, which also incorporate the level of variation to assess whether those values indicate a statistically measurable difference in voir dire length as a result of those factors (indicated with asterisks) or whether those values are more likely the result of random chance.
lawyers conduct voir dire on a more-or-less equal basis by questioning jurors individually in the jury box (the Reference trial). Neither the evidence nor the applicable law is expected to be complex. The final jury will be composed of 12 jurors and each side may exercise up to 3 peremptory challenges during jury selection. Using the regression model to calculate the values in Table 23, jury selection for this type of trial would require an average of 114 minutes to complete, or just under 2 hours. Imagine now that instead of a civil trial, this is misdemeanor trial, but all of the other factors have stayed the same. As a result, voir dire would take on average 25 minutes less to complete as indicated by the -25 value next to the trial characteristic for misdemeanor. Now imagine that it is the same misdemeanor trial, but the attorneys predominantly conduct the voir dire examination of jurors, which adds 25 minutes on average to
29

There are two important caveats with respect to the use of this table. First, although a number of the factors included in the regression model were statistically significant, the model itself was not particularly robust – that is, these trial characteristics and voir dire procedures explain only a
# Minutes Added or Subtracted
# Minutes Added or Subtracted
small proportion of the variation in voir dire length.52 It is highly likely that this aspect of trial procedure is also affected by local legal culture, demographic and attitudinal characteristics of the local jury pool, and individual judge and lawyer preferences, which we were unable to incorporate into the regression model. Second, readers should not overlook weak (single asterisk) or non-existent (no asterisk) statistical significance for several of these factors. These indicate that the values generated by the model have greater than 5 percent probability of resulting from random chance rather than reflecting an accurate measure of the length of voir dire.
Table 23: Effect of Trial Characteristics and Voir Dire Practices on Length of Voir Dire
Trial Characteristics Voir Dire Practices
Casetype Who Conducted Voir Dire?Capital Felony 707 *** Exclusively by Judge - 47 ***Felony 8 Predominantly by Judge - 14Misdemeanor - 25 ** Equally by Judge & Attorneys ReferenceCivil Reference Predominantly by Attorney 25 **
Exclusively by Attorney 105 ***
Evidentiary Complexity Oral Questions Posed to …
Not at all Complex Reference Entire Panel -134 ***Moderately Complex 60 *** Individual Jurors in Jury Box ReferenceExtremely Complex 119 *** Individual Jurors at Sidebar 82 ***
Legal Complexity Use of Questionnaires
Not at all Complex Reference None ReferenceModerately Complex 43 *** General Written Questionnaires - 13 *Extremely Complex 85 *** Case-Specific Questionnaires 227 ***
Number of Trial Jurors Impaneled
6 Jurors 71 ***8 Jurors 47 ***12 Jurors Reference
Number of Peremptory Challenges Available to Parties
3 per side Reference6 per side 38 ***12 per side 114 ***
* p < .10** p < .05*** p < .01
In spite of these weaknesses, these analyses do indicate a measurable relationship between veral trial characteristics and voir dire practices and the average length of voir dire. Not
surprisingly, as the issues to be decided at trial become increasingly serious, judges and attorneys spend greater amounts of time examining jurors. Thus, felony voir dire on average is about an
se
52 Adjusted R Square=0.217.
30

hour longer than civil trials, and voir dire in capital felony trials more than 13 hours longer. Increasing levels of trial complexity also contribute to longer voir dire, although evidentiary complexity has a stronger impact than legal complexity. Ironically, as the size of the jury increases, the amount of time needed to impanel the jury decreases. As a general rule, judge-conducted voir dire takes less time than attorney-conducted voir dire. Oral questions posed to the entire panel takes substantially less time, while individual voir dire at sidebar and the use of case-specific questionnaires tends to increase the length of voir dire.
Trial Practices
Once the jury has been impaneled, the evidentiary portion of the trial begins. This aspect of trial practice has perhaps undergone the most dramatic changes in recent years. In particular, a sea
rred in the way judges and attorneys view the jury’s role during trial. The traditional view is that jurors are passive receptacles of evidence and law who are capable of
change has occu
suspending judgment about the evidence until final deliberations, of perfectly and completely remembering all of the evidence presented at trial, and of considering the evidence without reference to preexisting experience or attitudes. This view has rapidly given way to a contemporary understanding of how adults perceive and interpret information, which posits that jurors actively filter evidence according to preexisting attitudes, making preliminary judgments throughout the trial.53 This view of juror decision-making has spurred a great deal of support for trial procedures designed to provide jurors with common-sense tools to facilitate juror recall and comprehension of evidence, and juror confidence and satisfaction with deliberations.54 The Judge & Lawyer Survey asked trial practitioners to report their experiences with these types of techniques in their most recent trials. Table 24 provides an overview comparing the responses of practitioners in state court to those in federal court.
53 See generally B. Michael Dann, “Learning Lessons” and “Speaking Rights”: Creating Educated and Democratic Juries, 68 IND. L. J. 1229 (1993). 54 G. THOMAS MUNSTERMAN, PAULA L. HANNAFORD-AGOR & G. MARC WHITEHEAD, JURY TRIAL INNOVATIONS (2d ed. 2006); AMERICAN BAR ASSOCIATION, supra note 4.
31

Table 24: Trial Innovations State Courts
Federal Courts
Note taking (%)Jurors could take notes 69.0 71.2Jurors given paper for notes 63.7 68.4Jurors given a notebook 5.8 11.2
Allowed juror questions during trials (%) 15.1 10.9Criminal Trials 14.0 11.4Civil Trials 16.1 10.9
Could discuss evidence before deliberations (%) 1.5 0.9Criminal Trials 0.7 0.3Civil Trials 2.2 1.3
Juror instruction methods (%)Preinstructed on substantive law 17.7 16.9Instructed before closing arguments 41.2 35.5Given guidance on deliberations 54.4 52.7At least 1 copy of written instructions provided 68.5 79.4All jurors received copy of written instructions 32.6 39.0
It now appears that permitting jurors to take notes is a widely accepted practice in most jurisdictions. More than two-thirds of the trials in both state and federal courts permitted juror notetaking, and the vast majority of those provided writing materials for jurors to do so. In spite of its support in many jurisdictions, as well as the overwhelming empirical research attesting to its effectiveness,55 juror notetaking was permitted in less than half the trials in 14 states, 8 of which were located in New England or the Mid-Atlantic region of the United States. One factor in judges’ decisions to permit juror notetaking was the complexity of the case; jurors serving in trials with more complex evidence were significantly more likely to be permitted to take notes and to be provided with notetaking materials than jurors in less complex trials.56
A second factor was the existence, or lack thereof, of statutes, court rules, or caselaw expressly stating the extent of judicial discretion to permit or prohibit juror notetaking. For example, Arizona, Colorado, Indiana and Wyoming mandate that trial judges permit jurors to take notes;57 judges have no discretion to prohibit the practice. Only Pennsylvania and South Carolina reported on the Statewide Survey that juror notetaking was prohibited.58
This question of legal authority for different jury trial practices is one that has important implications for jury improvement efforts. We will highlight the general issue using juror
55 Larry Heuer & Steven Penrod, Juror Notetaking & Question Asking During Trials, 18 L. & HUMAN BEHAV. 121 (1994). 56 Jurors Permitted to Take Notes F (6, 11,351) = 25.460, Jurors Given Writing Materials F (6, 11,351) = 35.529, both ps < .001. 57 ARIZ. R. CIV. PROC. Rule 39(p); ARIZ. R. CRIM. PROC. Rule 18.6(d); COLO. R. CIV. PROC. Rule 47(t); COLO. R. CRIM. PROC. Rule 16(f); IND. R. CT. Jury Rule 20; WYO. R.. CIV. PROC. Rule 39.1(a); WYO. R. CRIM. PROC. Rule 24.1(a). 58 Pennsylvania prohibits juror notetaking in criminal trials only. PA. R. CRIM. PROC. Rule 644. South Carolina reported that juror notetaking was prohibited in both criminal and civil trials, but did not report the authority for the prohibition.
32

notetaking as an illustration, but readers should understand that the existence or absence of positive law had some impact on all of the trial techniques examined in the Judge & Lawyer Survey. The Statewide Survey requested that respondents indicate whether these trial practices were required, permitted in the discretion of the trial judge, or prohibited and to provide the legal authority (statute, court rule, or court opinion). Table 25 shows the percentage of trials in which jurors were permitted to take notes based on responses to the Statewide Survey concerning the existence of legal authority governing juror notetaking. Not surprisingly, in states where juror notetaking is required, the percentage of trials in which jurors were permitted to take notes is extremely high. Overall, jurors were permitted to take notes in more than two-thirds of the trials in states that leave the decision on juror notetaking to the discretion of the trial judge, but state-by-state rates of juror notetaking ranged from a low of 19 percent in Rhode Island to a high of 96
percent in Arkansas. See Appendix F, Table 7. What is extremely surprising is the apparent lack of compliance in those states that prohibit juror notetaking. According to the Judge & Lawyer Survey reports, of the 206 criminal trials that took place in Pennsylvania and South Carolina (the only two states that prohibit juror
notetaking), more than one-fourth of the judges permitted jurors to take notes, and of the 36 civil trials that took place in South Carolina, nearly half (42%) permitted jurors to take notes! In fact, in 23% of both the criminal and civil trials, jurors were actually given writing materials with which to take notes!
Juror Notetaking … Civil Trials Criminal Trials
Prohibited 42 27Permitted 70 69Required 97 95
% of Trials in which Jurors were Permitted to Take Notes
Table 25: Impact of Law Governing Juror Notetaking
The apparent non-compliance with the prohibition on juror notetaking by Pennsylvania and South Carolina trial judges is quite puzzling. Certainly one possibility may be that judges and lawyers in those states have learned enough about the benefits of this technique (and the absence of any disadvantages) that they simply ignore the prohibition. As we find throughout this discussion, many of these techniques are employed in combination with one another, suggesting that judicial and lawyer education about these techniques in many jurisdictions may have begun to show measurable effects.
Yet another possibility is the extent to which the trial bench and bar may be unaware of prohibitions on different trial court practices – if, in fact, any legal authority for the prohibitions actually exists. For example, the South Carolina Statewide Survey reported that juror notetaking is prohibited in both criminal and civil trials, but it did not report the legal authority for the prohibition. A search of the South Carolina statutes, court rules, and reported judicial opinions did not reveal the source of the prohibition. In fact, the only judicial opinion that discusses juror notetaking – a 1985 appeal from a capital felony trial – indicated that juror notetaking is a matter of trial court discretion, and not prohibited at all.59 Perhaps the individual who completed South Carolina’s Statewide Survey was simply mistaken. Or perhaps the prohibition on juror notetaking in South Carolina simply reveals a widespread perception within the South Carolina
59 South Carolina v. South, 331 S.E.2d 775 (S.C. 1985)(“Finally, South contends the lower court erred in allowing jurors to take notes. Such was a proper exercise of discretion.”). Id. at 778.
33
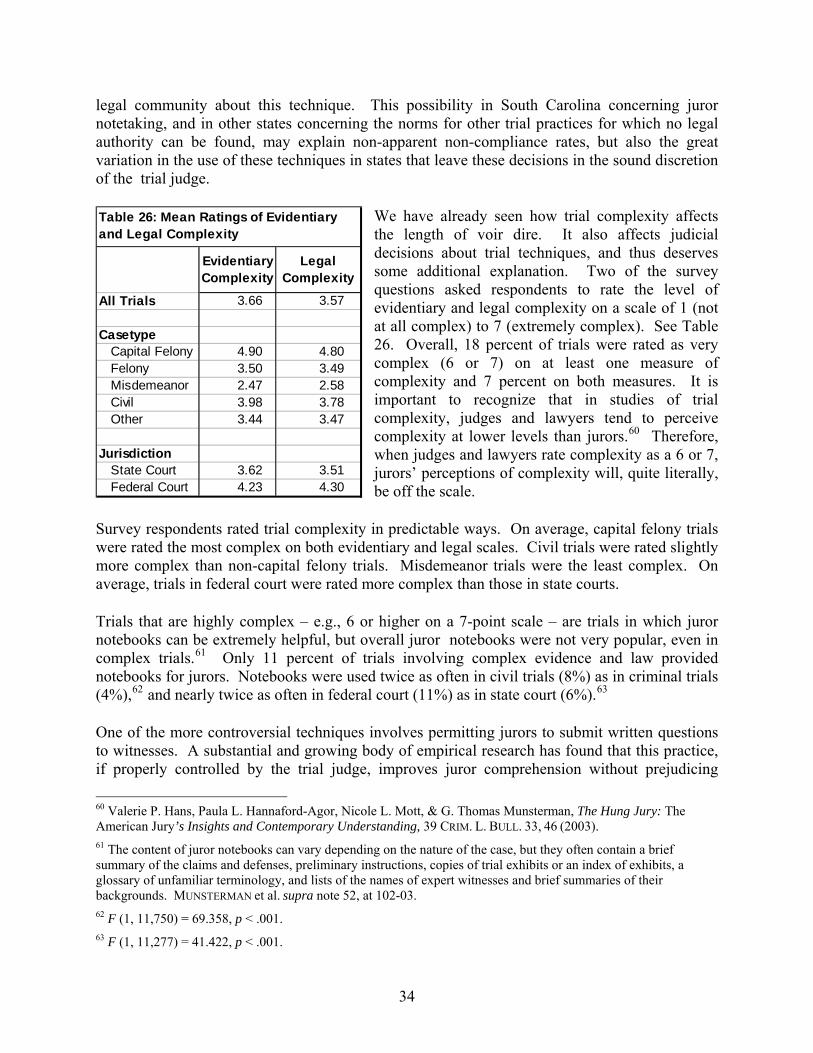
legal community about this technique. This possibility in South Carolina concerning juror notetaking, and in other states concerning the norms for other trial practices for which no legal authority can be found, may explain non-apparent non-compliance rates, but also the great variation in the use of these techniques in states that leave these decisions in the sound discretion of the trial judge.
We have already seen how trial complexity affects the length of voir dire. It also affects judicial decisions about trial techniques, and thus deserves some additional explanation. Two of the survey questions asked respondents to rate the level of evidentiary and legal complexity on a scale of 1 (not at all complex) to 7 (extremely complex). See Table 26. Overall, 18 percent of trials were rated as very complex (6 or 7) on at least one measure of complexity and 7 percent on both measures. It is important to recognize that in studies of trial complexity, judges and lawyers tend to perceive complexity at lower levels than jurors.60 Therefore, when judges and lawyers rate complexity as a 6 or 7, jurors’ perceptions of complexity will, quite literally, be off the scale.
Evidentiary Complexity
Legal Complexity
All Trials 3.66 3.57
CasetypeCapital Felony 4.90 4.80Felony 3.50 3.49Misdemeanor 2.47 2.58Civil 3.98 3.78Other 3.44 3.47
JurisdictionState Court 3.62 3.51Federal Court 4.23 4.30
Table 26: Mean Ratings of Evidentiary and Legal Complexity
Survey respondents rated trial complexity in predictable ways. On average, capital felony trials were rated the most complex on both evidentiary and legal scales. Civil trials were rated slightly more complex than non-capital felony trials. Misdemeanor trials were the least complex. On average, trials in federal court were rated more complex than those in state courts.
Trials that are highly complex – e.g., 6 or higher on a 7-point scale – are trials in which juror notebooks can be extremely helpful, but overall juror notebooks were not very popular, even in complex trials.61 Only 11 percent of trials involving complex evidence and law provided notebooks for jurors. Notebooks were used twice as often in civil trials (8%) as in criminal trials (4%),62 and nearly twice as often in federal court (11%) as in state court (6%).63
One of the more controversial techniques involves permitting jurors to submit written questions to witnesses. A substantial and growing body of empirical research has found that this practice, if properly controlled by the trial judge, improves juror comprehension without prejudicing
60 Valerie P. Hans, Paula L. Hannaford-Agor, Nicole L. Mott, & G. Thomas Munsterman, The Hung Jury: The American Jury’s Insights and Contemporary Understanding, 39 CRIM. L. BULL. 33, 46 (2003). 61 The content of juror notebooks can vary depending on the nature of the case, but they often contain a brief summary of the claims and defenses, preliminary instructions, copies of trial exhibits or an index of exhibits, a glossary of unfamiliar terminology, and lists of the names of expert witnesses and brief summaries of their backgrounds. MUNSTERMAN et al. supra note 52, at 102-03. 62 F (1, 11,750) = 69.358, p < .001. 63 F (1, 11,277) = 41.422, p < .001.
34

litigants’ rights to a fair trial.64 The crux of the controversy stems from philosophical arguments about the role of the jury in the context of an adversarial system of justice. The practice is mandated for criminal trials in three states,65 prohibited in eleven states,66 and left to the sound discretion of the trial court in the rest. In civil trials, juror questions are mandated in four states,67 prohibited in ten states,68 and left to the discretion of the trial judge in the rest.
Compliance with prohibitions juror questions was greatly improved over that for juror notetaking. None of the 1,175 criminal trials in states that prohibit juror questions violated the prohibition, and only 6 percent of the 1,394 civil trials did not follow the rule. In states that mandate that jurors be permitted to submit questions to witnesses, jurors were permitted to do so in 84% of the criminal trials and 86% of the civil trials.
Given the ongoing controversy in many jurisdictions, what is most surprising from these data is that jurors were allowed to ask questions in 14.5 percent of all trials, and 15.6 percent of civil trials. Rules or case law expressly permitting or prohibiting juror questions had a significant impact on the practice.69 Evidentiary complexity also played a role, with judges permitting juror questions in 17 percent of the most complex cases, but only 12 percent of the least complex cases.70 Judges were also significantly less likely to permit juror questions in federal court compared to state courts.71
Another controversial technique is to allow jurors in civil trials to discuss the evidence among themselves before final deliberations.72 Arizona, Colorado, and Indiana have enacted court rules
64 Shari S. Diamond, Mary R. Rose, Beth Murphy, & Sven Smith, Juror Questions During Trial: A Window into Juror Thinking, 59 VANDERBILT L. REV. 1927 (2006); Larry Heuer & Steven Penrod, Juror Notetaking & Question Asking During Trials, 18 L. & HUMAN BEHAV. 121 (1994). 65 ARIZ. R. CRIM. PROC. Rule 18.6(e); COLO. R. CIV. PROC. Rule 47(u); COLO.R. CRIM. PROC. Rule 24(g); BURNS IND. JURY R. Rule 20(7). 66 Matchette v. Georgia, 364 S.E.2d 545 (1988); Minnesota v. Costello, 646 N.W.2d 204 (2002; Wharton v. Mississippi, 784 So.2d 985 (1998); Nebraska v. Zima, 468 N.W.2d 377 (1991); Morrison v. Texas, 845 S.W.2d 882 (1992). The Statewide Surveys for Illinois, Louisiana, Maine, Michigan, North Carolina, Oklahoma, and South Carolina did not report the legal authority for this prohibition, and NCSC staff were unable to locate the source of prohibition in the relevant state statutes, court rules, and case law. Arkansas recently prohibited juror questions by court rule. See ARK. R. CRIM. P. Rule 33.8. The rule was enacted after data collection for the State-of-the-States Survey was complete. 67 ARIZ. R. CIV. PROC. Rule 39(b)(10); COLO. R. CIV. PROC. Rule 47(u); IND. R. CT. Jury Rule 20; WYO. R. CIV. PROC. Rule 39.4. 68 Minnesota v. Costello, 646 N.W.2d 204 (2002); Nebraska v. Zima, 468 N.W.2d 377 (1991); Morrison v. Texas, 845 S.W.2d 882 (1992). The Statewide Surveys for Georgia, Louisiana, Maine, Michigan, North Carolina, Oklahoma, and South Carolina did not report the legal authority for this prohibition, and NCSC staff were unable to locate the source of prohibition in the relevant state statutes, court rules, and case law. 69 Cox & Snell R Square = .171, Juror Qs Permitted (Criminal) Wald=446.098, p < .001; Juror Qs Permitted (Civil) Wald =14.274, p < .001. 70 Id. Evidentiary Complexity Wald = 23.048, p < .001; Legal Complexity Wald = .510, ns. 71 Id. State Court Wald = 9.781, p = .002 72 MUNSTERMAN et al., supra note 52, at 124-25.
35

explicitly permitting this practice.73 Maryland has caselaw that apparently condones the practice.74 Elsewhere, the practice is implicitly permitted by virtue of the fact that no legal authority explicitly prohibits it. In most states it is prohibited altogether.75 Overall, juror discussions were permitted in only 2 percent of state jury trials and only 1 percent of federal court trials. Surprisingly, one-third of the trials in which jurors were permitted to discuss the evidence took place in states that prohibit the practice. Given the large number of states (29) in which unauthorized juror discussions took place, it appears that this particular technique has generated enough interest to encourage a small number of judges to secure the consent of counsel and to permit juror discussions in individual cases, even though they are expressly prohibited.
A substantial amount of research suggests that juror comprehension of the law is affected by the timing and form of jury instructions. One technique growing in prevalence (18%) is to pre-instruct jurors about the substantive law – that is, to provide a basic overview of the black letter law governing the case in addition to administrative housekeeping rules and general legal principles.76 Pre-instructions provide jurors with a legal context in which to consider the evidence, helping them better understand and evaluate evidence as they hear it and remember evidence more accurately. Eight states report that they require judges to pre-instruct jurors on the substantive law before the evidentiary portion of the trial,77 although most of the required instructions deal with basic legal principles such as burden of proof and admonitions concerning juror conduct rather specific instructions on the elements of crimes or claims to be proven at trial. Two states – Nevada and Texas – prohibit pre-instructions.78
As before, the existence of rules concerning pre-instructions affected judges’ decisions to pre-instruct juries.79 Judges were also significantly less likely to pre-instruct in civil trials compared to criminal trials.80 Federal judges were marginally more likely to pre-instruct than state judges,81 but trial complexity was unrelated to judges’ decisions to pre-instruct.82 It does appear 73 ARIZ. R. CIV. PROC. Rule 39(f); COLO. JURY INSTRUCTIONS 1:4, 1:8; 74 Wilson v. Maryland, 242 A.2d 194 (1968). 75 See Valerie P. Hans, Paula L. Hannaford & G. Thomas Munsterman, 32 U. MICH. J.L. REFORM 349, 352-60 (1999). 76 G. THOMAS MUNSTERMAN, PAULA L. HANNAFORD-AGOR, & G. MARC WHITEHEAD, JURY TRIAL INNOVATIONS 132-33 (2d ed. 2006). 77 COLO. R. CIV. PROC. Rule 47(a)(2)(V), 47(a)(5); COLO. R. CRIM. PROC. Rule 24(a)(5); IND. R. CT. Jury Rules 20(a); MO. R. S. CT. Rule 27.02; N.Y. CRIM. PROC. LAW §§ 260.30, 270.40; OR. R. CIV. PROC. Rule 58B(2); OR. REV. STAT. § 136.330; TENN. R. CRIM. PROC. Rule 51.03(1); TENN. R. CIV. PROC. Rule 30(d)(1); WYO. R. CIV. PROC. Rule 39.3, WYO. R. CRIM. PROC. Rule 24.3. No legal authority could be found for the requirement in South Carolina. 78 Neither state cited legal authority for the prohibition in their respective Statewide Surveys. 79 Cox & Snell R Squared = .054, Pre-instruction Rule (Civil) Wald = 22.531, p < .001; Pre-instruction Rule (Criminal) Wald = 11.416, p = .001. 80 Id. Criminal Trial Wald = 94.564, p < .001. 81 Id. Jurisdiction Wald = 3.726, p = .054. 82 Id. Evidentiary Complexity Wald = .851, .Legal Complexity Wald = .022, both ps, ns.
36

that many judges who pre-instructed their juries view this technique as part of a set of jury trial practices; those who did so were also significantly more likely to permit jurors to take notes, to submit questions to witnesses, to permit juror discussions before deliberations, to deliver final instructions before closing arguments, and to provide jurors with a written copy of the instructions.83
Other techniques to improve juror comprehension of the law involve instructing the jury before closing arguments and to provide written copies of the instructions to jurors for use during deliberations.84 The rationale for the former is that closing arguments are more meaningful within the legal framework provided by the instructions. However, fewer than half of the trials in the study did so. Because jury instructions are often quite lengthy, written instructions ensure that jurors are able to consider all of the instructions during deliberations, not just those portions that they can remember. At least one copy of written instructions was provided to the jury in more than two-thirds of state jury trials, and nearly three-quarters of federal jury trials. However, only one-third provided copies for all jurors during deliberations.
State rules governing the timing and form of instructions were a significant factor in when and how instructions were delivered in both criminal and civil trials.85 Evidentiary complexity was a factor in the use of both techniques, but surprisingly in different directions. Controlling for other factors, judges were less likely to instruct before closing arguments in complex trials,86 but more likely to provide written instructions.87 Federal judges were less likely than state judges to instruct before closing arguments,88 but were more likely to provide written instructions to juries.89 Like pre-instructions, much of the discretion exercised by judges appears to be affected by their awareness and support for other jury trial innovations. Judges who instructed before closing arguments were significantly more likely to pre-instruct juries, to permit juror notetaking and juror discussions, and to provide written instructions, but not to permit juror questions.90 Judges who provided the jury with at least one copy of written instructions were marginally more likely to pre-instruct on the law, to permit jurors to take notes, and to deliver final instructions before closing arguments, but not to permit juror questions or discussions.91
83 Id. Juror Notetaking Wald = 22.471, p < .001; Juror Questions Wald = 116.235, p < .001; Juror Discussions Wald = 32.536, p < .001; Instructions Before Closing Wald = 16.867, p < .001; and Written Instructions Wald = 3.705, p = .054. 84 MUNSTERMAN et al., supra note 52, at 142-43, 151-52. 85 Instructions before Closing Cox & Snell R Square = .282; Rules on Timing of Instructions (Civil) Wald = 11.389, p =.001; Rules on Timing of Instructions (Criminal) Wald = 113.983, p < .001. Written Instructions Cox & Snell R Square = .283, Rules on Written Instructions (Criminal) Wald = 1339.244, p < .001. 86 Id. Evidentiary Complexity Wald = 6.296, p = .012; Legal Complexity Wald = .238, ns. 87 Id. Evidentiary Complexity Wald = 17.476, p < .001; Legal Complexity Wald = .205, ns. 88 Id. Jurisdiction Wald = 22.744, p < .001. 89 Id. Jurisdiction Wald = 66.056, p < .001. 90 Juror Notetaking Wald = 132.911, p < .001; Juror Questions Wald = .176, ns; Juror Discussions Wald = 10.711, p = .001; Pre-Instructions Wald = 18.805, p < .001; Written Instructions Wald = 410,537, p < .001. 91 Juror Notetaking Wald = 345.551, p < .001; Juror Questions Wald = .306, ns; Juror Discussions Wald = .921, ns; Pre-Instructions Wald = 2.726, p < .099; Instructions before Closing Wald = 404. 073, p < .001.
37

Local practices and trial exigencies affected some procedural aspects of the trials in this study. Juries deliberating in state courts were significantly more likely to be sequestered (25% of all trials) than juries in federal court (15% of all trials).92 Moreover, criminal juries in state courts were more likely to be sequestered than civil juries (27% and 23%, respectively), but that pattern was reversed in federal courts with civil juries more likely to be sequestered (11% and 17%, respectively).93 Alternates were most likely to deliberate in federal civil trials (23%).94 Alternates deliberated in state civil trials 10% of the time, but in just 1% of criminal trials in both state and federal trials.
What effect do these techniques have on the length of jury deliberations? In Table 27 we see that the length of deliberations across all case categories is slightly shorter in state courts compared to federal courts, although some state court deliberations exceeded those in federal court. For example, Connecticut had the longest average deliberation time (7.75 hours) in felony trials. Wisconsin had the shortest (1 hour).
Like voir dire, the length of deliberations was affected by a number of factors, some related to trial characteristics and some related to the types of jury techniques employed by the judge. Table 28 was constructed using the same methods as Table 23 and indicates the effect of these factors on the length of jury deliberations.95 The reference trial is again a civil trial in state court in which the evidence and law are not at all complex, twelve jurors were required to deliberate to a unanimous verdict, and no decision-making aids were provided to jurors during trial or deliberations. The average deliberation time for such a trial is 166 minutes (2.77 hours).
State Courts
Federal Courts
Capital Felony 6.0 10.0
Felony 3.0 4.0
Misdemeanor 2.0 2.5Civil 3.0 4.0
Other 2.0 2.5
Table 27: Median Deliberation Time (hours)
92 F = 48.617, p < .001. Although statistically significant, this finding should be viewed with caution insofar that respondents may have defined the term “sequestered” to encompass deliberations in which the jury was kept together during routine breaks during deliberations (e.g., lunch), but not sequestered overnight. 93 State Court F = 19.355, p < .001; Federal Court F = 5.371, p = .021. 94 The Federal Rules of Civil Procedure specifies that civil juries consist of “not fewer than six and not more than twelve members” and requires that all jurors impaneled participate in deliberations. FED. R. CIV. PROC. Rule 48. 95 Like the voir dire regression model, the deliberation model failed to include the vast majority of factors that explain deliberation length in jury trials. Adjusted R Square=0.146. It is thus subject to the same caveats discussed in the voir dire model.
38

Trial Characteristics Trial Practices
State Court Reference *** None ReferenceFederal Courts 123 Jurors Permitted to Take Notes 26 ***
Casetype Jurors Provided a Notebook31 **
Capital Felony 225 ***Jurors Permitted to Submit Questions to Witnesses 7
Felony 39 *** - 10Misdemeanor - 7Civil Reference
Evidentiary Complexity Jurors Permitted to Discuss Evidence - 15
Not at all Complex Reference ***Moderately Complex 112 ***Extremely Complex 223 ***
Legal Complexity Jurors Instructed before Closing Arguments - 23 ***
Not at all Complex Reference ***Moderately Complex 55 ***Extremely Complex 109 ***
Number of Trial Jurors Impaneled Written Instructions
6 Jurors - 18 ** 1 Copy of Instructions for Jury 35 ***12 Jurors Reference ** 5
Alternates Deliberated 7
Jurors Sequestered - 36 ***
Unanimous Verdict Required - 20 **
* p < .01** p < .05*** p < .001
All Jurors Provided Written Instructions
Table 28: Effect of Trial Characteristics and Trial Practices on Length of Deliberations
# Minutes Added or Subtracted
# Minutes Added or Subtracted
As a general matter, trial characteristics tended to affect deliberation length more often than trial practices. On average, juries deliberate in state court less time than federal juries.96 Juries in both capital and non-capital felony trials deliberate significantly longer than civil trial juries, but there was no significant difference between civil and misdemeanor deliberations.97 Both evidentiary and legal complexity resulted in increased deliberations.98 Surprisingly, the number of impaneled jurors deliberating had no effect on deliberation length, but permitting alternates to
96 Id. Jurisdiction t = -7.704, p < .001. 97 Id. Capital felony t = 9.650, p < .001; Non-capital felony t = 4.223, p < .001; Misdemeanor t = -.013, ns. 98 Id. Evidentiary Complexity t = 9.002, p < .001; Legal Complexity t = 7.160, p< .001.
39

deliberate did lengthen deliberations.99 Sequestering juries and requiring a unanimous verdict actually decreased deliberation time.100
Some trial practices did affect deliberation length. For example, jurors who were instructed before closing arguments deliberated for shorter periods, suggesting that they may have less difficulty understanding and applying the instructions.101 On the other hand, jurors who were permitted to take notes, jurors who were given trial notebooks, and juries that were given at least one written copy of the instructions tended to deliberate longer, perhaps because jurors who were equipped with those tools engaged in more thorough deliberations.102 Other techniques such as juror questions, pre-instruction on the evidence and law, and juror discussions had no effect on deliberation length.
As we noted earlier, many judges often use innovative jury trial techniques in various combinations. We wanted to gauge the extent to which statewide initiatives had an effect on judges’ willingness to do so. To examine this issue, we constructed an index of key jury techniques consisting of juror notetaking, juror questions, juror discussions, pre-instructions, instructions before closing arguments, and written instructions. The index ranged from 0 (no innovative techniques employed at trial) to 6 (all key techniques employed). The median index value was 2 – that is, an average of two techniques employed per trial. Then, using regression analyses to control for the trial venue (state or federal court), evidentiary and legal complexity, and case type (criminal or civil), we measured the impact of various statewide initiatives to determine which, if any, resulted in increased use of these techniques.103 We found that educational efforts directed at all potential audiences (judges, attorneys, and the public) resulted in increased use of innovative techniques.104 More intensive efforts to test and evaluate these techniques (e.g., evaluations, court observations) were also associated with increased use of key innovations.105 Surprisingly, some approaches to jury improvement correlate with lower use of these techniques, most notably, the existence of a statewide task force or commission.106 But this may be simply a matter of timing. That is, the substantive work of these task forces may not yet have translated into measurable increases in the use of jury innovations.
99 Id. Number of Jurors t = .695, ns; Alternates deliberated t = 2.879, p = .004. 100 Id. Jurors sequestered t = -4.395, p < .001; Unanimous verdict t = -2.889, p = .004. 101 Id. Instructions before Closing t = -3.539, p < .001. 102 Id. Juror Notetaking t = 3.180, p = .001; Juror Notebooks t = 4.780, p < .001; Written Instructions t = 4.471, p < .001. 103 Adjusted R Square=.138; F (14, 11,006)=127.22, p < .001. Of the trial characteristic factors incorporated into the model, only Evidentiary complexity (t =5.919, p < .001) and Type of case ( t = 4.754, p < .001) were statistically significant. 104 Judge education t = 13.841, Attorney education t = 7.259, and Public education t = 21.920, all ps < .001. 105 Evaluate ( t = 12.735), Court observation ( t = 11.181), all ps < .001. 106 Statewide Task Force t = -13.324), p < .001.
40

VI. CONCLUSIONS
The State-of-the-States Survey of Jury Improvement Efforts is, to the best of our knowledge, the most comprehensive snapshot of jury operations and practices ever yet undertaken. From it, we confirmed a great deal of information about how state and local courts operate and manage their jury systems. Some of these findings were suspected, but we lacked reliable empirical documentation on which to confirm these suspicions. The statistics on jury yield, for example, fall roughly in the ranges we expected, but we anticipate that more precise statistics will provide courts with a better baseline on which to assess their own performance.
On the other hand, the State-of-the-States Survey also resulted in many surprises, not the least of which was the actual number of jury trials conducted annually in state courts. The NCSC had previously estimated the number of jury trials conducted in general jurisdiction courts,107 but the State-of-the-States Survey indicates that a considerable proportion of jury trials – perhaps as much as 40 percent – are actually conducted by limited jurisdiction courts, which had been excluded from previous estimates. The volume of jury trial activity in these courts is certainly a surprise and suggests that recent trends to eliminate the right to trial by jury for low-level offenses and low-value civil cases in many jurisdictions has not been as widespread and successful as previously imagined. It also helps to explain the relatively high summoning rates – 15% of the adult American population each year – and the increasing proportion of Americans that report having served as trial jurors.
Certainly one finding from the State-of-the-States Survey is that, in spite of statewide efforts to regulate jury operations and trial practices in some jurisdictions, most jury operations and practices are still governed on a local, and even individual, basis. The use of general terminology to describe jury practices (e.g., term of service, statutory exemptions, one-step versus two-step summoning procedures) tends to mask a great deal of local variation. As we discovered during the long, slow process of collecting data for the State-of-the-States Survey, the extent of continued local autonomy not only makes it difficult to collect data, but also makes it difficult to define terms and to compare data across jurisdictions. It also indicates the inherent challenge – and the likelihood of substantial local resistance – that states face in attempting to implement statewide changes in jury procedures.
Another curious finding from the Judge & Lawyer Survey is the extent to which judges and lawyers reported the use (or non-use) of various trial techniques (e.g., juror notetaking, juror questions to witnesses, written copies of instructions) that apparently conflicts with existing court rules or policies. As a general matter, judges and lawyers are more likely to use these techniques in jurisdictions that prohibit them than to not use them in jurisdictions that mandate them. Some instances of these inconsistencies may be the result of mistakes or misunderstandings on the part of the individuals who completed the Judge & Lawyer Survey or the Statewide Survey. However, the strong correlations among the different trial techniques suggests that at least in some cases, judges and lawyers have concluded that the benefits of these techniques in terms of improved juror performance and satisfaction outweighs any potential
107 BRIAN J. OSTROM, NEAL B. KAUDER & ROBERT C. LAFOUNTAIN, EXAMINING THE WORK OF STATE COURTS, 2001, 102-03 (2001).
41

disadvantages. This decidedly Ghandi-esque approach to jury improvement at a grassroots level is very intriguing, to say the least.
We also found it heartening to see how prominent jury operations and practices are in statewide and local court improvement efforts. To some extent, we saw that local court efforts are affected by statewide initiatives, especially those involving mandated changes in jury procedures. But the level of local court activity, even in jurisdictions that had not undertaken a statewide jury improvement initiative, was considerable. A number of factors may be driving local court efforts, including the need to reduce the cost of jury operations, to improve the efficiency and effectiveness jury operations, and to be more responsive to local community demands on juror time and resources.
So how should state and local courts use this Compendium Report and the state-by-state tables (available on the Center for Jury Studies website at http://www.ncsconline.org/D_Research/cjs/)? Certainly we hope that the comparative information and analysis will encourage courts that do not routinely collect and review data on their jury operations and practices to begin doing so. This type of information is invaluable for identifying areas of relative strength and weakness, setting improvement priorities, and formulating effective strategies for addressing weaknesses. With data from the State-of-the-States Survey, judges and court administrators can now evaluate their own practices in light of those of their peers within their respective states and across the country.
As we had hoped, the State-of-the-States Survey also provides direction to the NCSC Center for Jury Studies concerning the types of activities that we should pursue to better assist state and local court policymakers. In some respects, surprises among the State-of-the-States Survey indicate the need for additional research. For example, how effective are various techniques to improve the accuracy of addresses on the master jury list, thus improving the overall jury yield? To what extent do various voir dire methods elicit candid and complete information from jurors? What implications do these methods have on juror privacy expectations? To what extent do jurors make use of decision-making aids when they are offered to them during trial?
Other areas for future research include topics that the State-of-the-States Survey did not address, either because we believed that too few courts could easily report on these topics or because we simply overlooked the issue while designing the surveys. The former category includes the extent to which courts collect and analyze information about the demographic characteristics of their jury pools and how well those jury pools reflect a fair cross section of their respective communities. Questions concerning juror utilization was also omitted from the Local Court Survey, but is critically important to the issues not only of court efficiency, but also citizen satisfaction with jury service. Finally, the Judge & Lawyer Survey failed to include questions on trial outcomes and trial length as well as respondents’ opinions about voir dire and trial techniques (regardless of whether these were used at trial). All of these issues we hope to address in the future, perhaps in a subsequent iteration of the State-of-the-States Survey.
In the meantime, we continue to pursue other components of the National Jury Program, many of which are related to issues explored in the State-of-the-States Survey. The NCSC Center for Jury Studies is currently planning a National Conference on Pattern Jury Instructions, tentatively
42

scheduled for April 17-18, 2008. We are also seeking funding to develop a series of performance measures and tools for courts to use in assessing their jury operations; to host an Urban Courts Workshop to provide urban and statewide jury systems an opportunity to share information about innovative approaches they have developed to address the unique issues associated with heavy volume jury systems; to document the various funding streams that support the American jury system; and to undertake a series of demonstration projects to implement the ideals of the ABA Principles for Juries and Jury Trials into actual jury practices in up to six jurisdictions. Of course, the NCSC Center for Jury Studies will continue to assist courts through education, technical assistance, and research.
43
APPENDICES
APPENDIX A: FINANCIAL CONTRIBUTORS TO THE NATIONAL PROGRAM TO INCREASE CITIZEN PARTICIPATION IN JURY SERVICE THROUGH JURY INNOVATIONS
APPENDIX B: STATEWIDE, LOCAL COURT, AND JUDGE & LAWYER SURVEYS FROM THE STATE-OF-THE-STATES SURVEY OF JURY IMPROVEMENT EFFORTS
APPENDIX C: STATE-BY-STATE RESPONSE RATES
APPENDIX D: NOTES ON METHODOLOGY USED TO CALCULATE NATIONAL STATISTICS
APPENDIX E: STATE TABLES ON KEY JURY OPERATION AND PRACTICE MEASUREMENTS
45

APPENDIX A: FINANCIAL CONTRIBUTORS TO THE NATIONAL PROGRAM TO INCREASE CITIZEN PARTICIPATION IN JURY SERVICE THROUGH JURY INNOVATIONS
Robins, Kaplan, Miller & Ciresi L.L.P. ($100,000 Legacy Donor) The U.S. Chamber of Commerce State Justice Institute Shook, Hardy & Bacon L.L.P. The Product Liability Advisory Council Foundation The Kirkland & Ellis Foundation The American Association for Justice (formerly ATLA) Susman Godfrey LLP Reed Smith LLP Simmons Cooper LLC Wilmer Hale LLP Cohen, Milstein, Hausfeld & Toll, LLP Debevoise & Plimpton LLP Hunton & Williams LLP Sonnenschein Nath & Rosenthal, LLP Vinson & Elkins, LLP The Lanier Law Firm, PC Gibbs & Bruns, LLP Locke Liddell & Sapp, LLP Fulbright & Jaworski, LLP Carrington Coleman Sloman & Blumenthal, LLP
Levin Fishbein Sedran & Berman
Baker Botts, LLP Williams Bailey Law Firm, LLP Jamail & Kolius Bracewell & Giuliani, LLP Richard Warren Mithoff, PC E.I. DuPont de Nemours & Co. Chimicles & Tikellis, LLP Boies Schiller & Flexner, LLP The Defense Research Institute Frederick M. Baron, Esquire Zelle Hofmann Voelbel Mason & Gette LLP Bolognese & Associates, LLC Finnegan Henderson Farabow Garrett & Dunner, LLP
Abraham Watkins Nichols Sorrels Matthews & Friend, LLP Sayles Werbner, APC Stanley Mandel & Iola, LLP Paul Hastings Janofsky & Walker, LLP Sullivan & Cromwell, LLP The Olender Foundation The State Bar of Texas Donna D. Melby, Esquire American Board of Trial Advocates [ABOTA] – Minnesota State Chapter Epstein Becker Green Wickliff & Hall, LLP McGuireWoods, LLP Simpson Thacher & Bartlett LLP Levin Papantonio Thomas Mitchell Echsner & Proctor, PA Shearman & Sterling LLP Weil, Gotshal & Manges LLP Stein Mitchell & Mezines LLP Mark A. Modlin, TC Ashcraft & Gerel, LLP Kirkpatrick & Lockhart Nicholson Graham LLP Smyser Kaplan & Veselka, LLP
Gregory P. Joseph Law Offices LLC Chadbourne & Park, LLP Hill Williams, PLLC The Fullenweider Firm Stanley M. Chesley, Esquire Hurwitz & Fine, P.C. William H. Graham, Esquire Vincent J. Esades, Esquire Ellen Relkin, Esquire JMW Settlements, Inc. Same Day Process Services, Inc. Bruce Braley, Esquire DecisionQuest, A Bowne Company
47

APPENDIX B: STATEWIDE, LOCAL COURT, AND JUDGE & LAWYER SURVEYS FROM THE STATE-OF-THE-STATES SURVEY OF JURY IMPROVEMENT EFFORTS
49

National Program to Increase Citizen Participation in Jury Service
State of the States Statewide Survey
State: _______________________________ Date: ____________ 1. Current Status of Jury Improvement/Jury Reform Efforts
A. Is there an office or a formal organization or entity in your state concerned with managing or overseeing jury management? Yes / No
If yes, how was that office or organization created?
Administrative Order (e.g., by Chief Judge/Justice, by court of last resort, by statewide judicial council)
Court rule (please cite: ___________________________________________) Other authority (please specify: ____________________________________)
B. Is there or has there existed in the past 10 years a task force or commission on jury improvement/jury reform? Y / N
If yes, what is the name(s) of Statewide Task Force(s)/Commission(s):
__________________________________________________________________
__________________________________________________________________
Contact Information for Task Force/Commission Chairperson:
__________________________________________________________________
__________________________________________________________________
Is the Task Force/ Commission currently active? Y / N
If no, dates of operation? _____________________________________________
What person or agency created the Task Force/Commission? Chief Judge/Justice State Court of Last Resort State Judicial Council Other person or agency
51

National Program to Increase Citizen Participation in Jury Service
How large was the Task Force/Commission? _______________ members
What constituencies were represented on the Task Force/Commission? Trial judges Appellate judges Court administrators Jury managers Clerks of court Prosecutors
Criminal defense lawyers Civil litigation lawyers State legislators Private citizens/former jurors Other constituencies
Has the Task Force/Commission submitted a written report of its activities? Y / N
If yes, please provide the report title and release date: _________________________
_____________________________________________________________________
If the report is available online, please provide the URL: _______________________
D. Please indicate any current or ongoing projects concerning jury improvement/jury reform
efforts in which your state is involved. Judicial education Court staff education Attorney education Changes to legislation or court rules Pilot or demonstration programs
Evaluations Public education/outreach Survey research Court observation Other: ___________________________
52

2. Jury Management and Administration
A. What source lists are required or permitted to be used to compile to the mast jury list? Required Permitted
Registered Voter □ □ Licensed Driver □ □ State Tax Rolls □ □ Unemployment □ □ Public Assistance □ □ Other: ____________ □ □
Is the master jury list compiled at the state level or at the local level? State / Local
B. What are the juror fees in this state? Flat daily rate of $ ___________ Graduated rate of $ _______for first day; $ ______ for ______ days; $ ________ to
the completion of service Reimbursement for mileage/travel at $ __________ Other juror compensation (e.g., reimbursement for child care) $__________________
Are employers required to compensate employees while on jury service? Y / N Employer size: _________________ Number of days: ____________________________
C. Is the term of jury service determined at the state level or the local level? State / Local If at the state level, what is the term of service? ________________ days / weeks If at the local level, what (if any) is the maximum permissible term of service? ___________________ days / weeks
D. Does this state employ a standardized Qualification Questionnaire/Summons? Y / N If yes, where can we obtain a copy? __________________________________________
E. Is summoning and qualification conducted as a one-step or two-step process?
Qualification questionnaires and jury summonses are mailed simultaneously (one-step process) in this state.
Qualification questionnaires are first sent to prospective jurors. Summonses are then sent only to qualified individuals (two-step process) in this state.
Individual counties within the state use both one-step and two-step procedures for qualification and summoning.
53

F. Please indicate any criteria for jury service. U.S. Citizenship Residency (established after _____ days / months) Age: _____ years or older No felony conviction* No misdemeanor conviction* English fluency/proficiency Other qualification: _________________________________________________
* Is this prior criminal conviction a temporary or permanent disqualification from jury service?
Permanent Temporary
Does the state promulgate criteria or guidelines for determining the English fluency of prospective jurors? Y / N If yes, where can these criteria or guidelines be obtained?
Does the state promulgate criteria or guidelines for deciding requests to be excused for any of the reasons above? Y / N If yes, where can these criteria or guidelines be obtained?
G. Please indicate any statutorily recognized exemptions from jury service.
Previous jury service (within __________ months / years) Over _______ years of age Political office holders Judicial officers Licensed attorneys Law enforcement personnel Health care providers Other exemptions: _____________________________________________________
H. Please indicate any statutory basis for excusal from jury service. Public necessity Medical hardship Financial hardship Extreme inconvenience Other basis: __________________________________________________________
54

3. Voir Dire Procedures and Practices
A. Has the state developed a standardized questionnaire for use in voir dire? Y / N If yes, where can we obtain a copy? __________________________________________
Has this questionnaire been implemented on a statewide basis, on a local basis, or by individual judge?
Statewide implementation Local implementation Individual judge implementation
B. Under state law, are juror responses to the Qualification Questionnaire a public record
that may be made available to parties for voir dire purposes? Y / N If yes, please indicate the source of legal authority: ______________________________
C. Under state law, who is permitted to question prospective jurors?
Criminal Civil Judge only, no attorney participation □ □ Judge only, attorneys provide suggested written questions □ □ Judge primarily with limited oral questioning by attorneys □ □ Judge and attorney equally □ □ Attorney primarily with limited judge participation □ □ Attorney only □ □
If attorney only, is the judge present for voir dire? Y / N
D. What grounds are recognized in positive law (e.g., statute, court rule, case law, administrative order) for removing prospective jurors from the venire for cause? Please cite relevant authority.
Personal relationship to parties, attorneys, or witnesses Personal knowledge of case Personal or family experience with crime or civil claim Exposure to media reports Attitudes/bias regarding parties Attitudes/bias regarding police Attitudes/bias regarding case characteristics Hardship Other:
E. How many peremptory challenges are allotted to each side?
State/Plaintiff Defendant Alternates Multiple parties? Capital Felony: ____________ _________ _________ _______________ Felony: ____________ _________ __________ _______________ Misdemeanor ____________ _________ __________ _______________ Civil: ____________ _________ __________ _______________
55

4. Trial Procedures and Practices
Please indicate whether the following procedures or practices are required, permitted, or prohibited in your state and provide the legal authority (e.g., statute, court rule, court opinion) or indicate its absence. A. Juror note taking Authority (indicate none, if applic)
Required □ civil □ criminal ________________________ Permitted □ civil □ criminal ________________________ Prohibited □ civil □ criminal ________________________
B. Juror submission of questions to witnesses Required □ civil □ criminal ________________________ Permitted □ civil □ criminal ________________________ Prohibited □ civil □ criminal ________________________
C. Juror discussion before deliberations Required □ civil □ criminal ________________________ Permitted □ civil □ criminal ________________________ Prohibited □ civil □ criminal ________________________
D. Preliminary instructions on law Required □ civil □ criminal ________________________ Permitted □ civil □ criminal ________________________ Prohibited □ civil □ criminal ________________________
E. Final instructions before closing argument Required □ civil □ criminal ________________________ Permitted □ civil □ criminal ________________________ Prohibited □ civil □ criminal ________________________
F. Final instructions after closing argument Required □ civil □ criminal ________________________ Permitted □ civil □ criminal ________________________ Prohibited □ civil □ criminal ________________________
G. Interim commentary by counsel Required □ civil □ criminal ________________________ Permitted □ civil □ criminal ________________________ Prohibited □ civil □ criminal ________________________
56
5. Jury Deliberations Please indicate whether the following procedures or practices are required, permitted, or prohibited in your state and provide the legal authority (e.g., statute, court rule, court opinion) or indicate its absence.
A. Guidance on conducting deliberations Required □ civil □ criminal ________________________ Permitted □ civil □ criminal ________________________ Prohibited □ civil □ criminal ________________________
B. Pattern instructions mandated by state Required □ civil □ criminal ________________________ Permitted □ civil □ criminal ________________________ Prohibited □ civil □ criminal ________________________
C. Written instructions provided Required □ civil □ criminal ________________________ Permitted □ civil □ criminal ________________________ Prohibited □ civil □ criminal ________________________
D. Alternates participate in deliberations Required □ civil □ criminal ________________________ Permitted □ civil □ criminal ________________________ Prohibited □ civil □ criminal ________________________
E. Sequestration Required □ civil □ criminal ________________________ Permitted □ civil □ criminal ________________________ Prohibited □ civil □ criminal ________________________
6. Special Topics
A. Please provide any state statutes, court rules, policies, or summaries developed or implemented to assist local courts in managing notorious trials.
___________________________________________________________________________
___________________________________________________________________________
___________________________________________________________________________
B. Please provide any statewide statutes, court rules, policies or procedures exist to protect juror privacy during jury selection, during trial, and after trial.
___________________________________________________________________________
___________________________________________________________________________
___________________________________________________________________________
57
C. Please describe any resources or programs that the state makes available to local courts to address instances of juror stress.
___________________________________________________________________________
___________________________________________________________________________
___________________________________________________________________________
D. Do juries sentence defendants convicted of non-capital crimes? Y / N If yes, describe the trial process (e.g., bifurcated, not bifurcated), evidence that is admissible for the jury’s consideration including sentencing guidelines, and the standards for judicial review or modification of the sentence.
___________________________________________________________________________
___________________________________________________________________________
___________________________________________________________________________
E. Is capital punishment authorized in your state? Y / N If yes, please provide specific statutes, court rules, procedures, policies, or summaries concerning the conduct of capital jury trials.
___________________________________________________________________________
___________________________________________________________________________
___________________________________________________________________________
Please send completed responses to:
Chris Connelly
Court Research Analyst The Center for Jury Studies
National Center for State Courts 2425 Wilson Blvd Suite 350
Arlington, VA 22201 [email protected]
58

National Program to Increase Citizen Participation in Jury Service
59
State of the States Local Court Survey
Court: _______________________________ Date: ____________ County in which court is located: State: 1. Current Status of Local Jury Improvement/Jury Reform Efforts
A. Is there currently or has there been a jury improvement/reform effort in this court in the past five years? Yes / No
If yes, please describe how this effort has been implemented and the contact information for
the person organizing this effort. ___________________________________________________________________________
________________________________________________________________________
_____________________________________________________________________
B. Is there a local court committee or office concerned with managing or overseeing jury
management? Yes / No If yes, please describe the committee composition (e.g., trial judges, court staff, lawyers,
citizens) and contact information for the committee chairperson. ________________________________________________________________________
________________________________________________________________________
________________________________________________________________________
1. Please indicate any current or ongoing jury improvement efforts in this court. Improve the representation in jury pool Improve jury yields Decrease incidence of non-respondents Improve jury facilities Upgrade jury system technology Improve juror utilization Improve juror comprehension (in-court reforms) Improve jury instructions Improve public outreach Other ___________________________

National Program to Increase Citizen Participation in Jury Service
60
2. Jury Management and Administration
A. Is the master jury list for this court compiled locally or at the state level? Local State
B. What source lists are used to compile the master jury list?
Registered Voter Licensed Driver State Tax Rolls Unemployment Public Assistance Other: ___________________
C. What are jurors paid in this court?
Flat daily rate of $ _______________ Graduated rate of $ ______ for the first day; $ _______ for _______ days; $ _______
to the completion of service Reimbursement for mileage/travel at $ _______________ Other juror compensation (e.g., reimbursement for child case) $ _________________
D. What is the term of jury service? _____________________________________________
________________________________________________________________________
E. Are jurors summonsed and qualified simultaneously or in two separate steps?
Qualification questionnaires and jury summonses are mailed simultaneously (one-step process) in this jurisdiction.
Qualification questionnaires are first sent to prospective jurors. Summonses are then sent only to qualified individuals (two-step process) in this jurisdiction.
F. Who decides juror requests to be excused from jury service and what criteria are used for deciding these requests?
Judge ____________________________________________________________
________________________________________________________________________
Jury Administrator ________________________________________________
________________________________________________________________________
Other _______________________________________________________________
_______________________________________________________________________

National Program to Increase Citizen Participation in Jury Service
61
G. How does the court follow-up on persons who fail to respond to summonses or fail to appear for service?
Follow-up or Second notice Order to Show Cause Fines (Range $_____________________________) Other None
H. Approximately how many jury summonses are mailed each year? __________________ I. Please describe the percentage of prospective jurors who are:
Summonses returned as undeliverable __________% Disqualified __________% Exempted __________% Excused for hardship __________% Deferred to another term __________% Non-response / FTA __________% Qualified and available to serve __________%
SHOULD TOTAL TO 100%
J. Approximately how many juries are impaneled each year? Felony: _______________ Misdemeanor _______________ Civil _______________ Other _______________
K. Does your court routinely screen prospective jurors for English language proficiency? Yes / No If yes, please describe the procedures used? ________________________________________________________________________
________________________________________________________________________
________________________________________________________________________
L. What accommodations does your court provide for prospective jurors with disabilities? Assisted language devices Sign language interpreters Wheelchair ramps Other (please describe) _________________________________________________
_______________________________________________________________________
M. Please indicate the technologies that support your jury system. Base System:

National Program to Increase Citizen Participation in Jury Service
62
Jury Systems, Inc. (Jury + / Jury + Next Generation) ACS Government Systems Other commercial software (please specify): _____________________________ Software developed in-house
Verification of qualification information
First-class mail Interactive Voice Response (IVR) interface Internet interface Other (please specify): __________________________________________________
Reporting technology
Jurors receive summons only Jurors receive postcard informing them when to report Jurors receive automated telephone call informing them when to report Jurors call in, listen to telephone message informing them when to report Jurors log on to court webpage with information about when to report Other (please specify): __________________________________________________
Orientation
Jurors receive live orientation at courthouse Jurors receive informational brochure/booklet with summons Jurors can read orientation materials at court website Jurors can view orientation videotape online at court website Jurors can view orientation videotape on local cable television Jurors can view orientation videotape at local public library Other (please specify): __________________________________________________

National Program to Increase Citizen Participation in Jury Service
63
3. Voir Dire Procedures and Practices
A. What kinds of juror information are routinely available to attorneys prior to trial? Name Street Address Zip code or Neighborhood designation only Qualification information Marital status Occupation / Employer Number and ages of minor children Other: _______________________________________
B. Are attorneys routinely given access to jurors’ qualification questionnaires? Y / N
C. Do prospective jurors complete a standardized questionnaire for voir dire purposes?
Y / N If yes, where can we obtain a copy? __________________________________________
D. What is the typical length of voir dire in hours?
Capital Felony: ______________________________ Non-capital felony: ___________________________ Misdemeanor: _______________________________ Civil: ______________________________________
E. What local court rules, policies, or procedures exist to protect juror privacy during jury
selection, during trial, or after completing jury service?
___________________________________________________________________________
___________________________________________________________________________
Name and Title of Survey Respondent: ______________________________________________ Telephone: ________________________ Facsimile: _________________________________ E-Mail: _______________________________________________________________________
Please send completed responses to: Chris Connelly
Court Research Analyst The Center for Jury Studies
National Center for State Courts 2425 Wilson Blvd Suite 350
Arlington, VA 22201 [email protected]

National Program to Increase Citizen Participation in Jury Service
State of the States Judge & Lawyer Survey
1. Identification Information
A. I am a: State trial judge Federal trial judge Attorney
o primarily criminal prosecution o primarily criminal defense o primarily civil plaintiff o primarily civil defense
Other legal practitioner
B. Please indicate the location of the court (county, state) in which you preside (judge) or most often practice (attorney): ________________________________________________________________________
C. Please indicate the type of case in your most recent jury trial. Capital felony Felony Misdemeanor Civil Other jury trial
If you are an attorney, please indicate who you represented.
Prosecution / Plaintiff Defendant
What was the date(s) of trial? _______________________________________________
Where was the trial held (county, state)?_______________________________________ State court Federal court
On a scale of 1 to 7, how complex was the evidence in that trial? Not at all complex 1 2 3 4 5 6 7 Very complex On a scale of 1 to 7, how complex was the law in that trial? Not at all complex 1 2 3 4 5 6 7 Very complex
65
National Program to Increase Citizen Participation in Jury Service
For the following questions, please indicate the practices, procedures, and techniques employed in your most recent jury trial. 2. Voir Dire
A. How were questions posed to prospective jurors in the venire? (check all that apply) Oral questions posed to full panel Oral questions posed to individual jurors in jury box Oral questions posed to individual jurors at sidebar, in chambers, or otherwise outside
the hearing of other jurors Written responses to standardized questionnaire Written responses to a case specific questionnaire
When was the questionnaire given to prospective jurors? o Prior to reporting for service o Jury assembly room before jury selection o In courtroom before questioning
B. What method was used to conduct the voir dire?
Strike & Replace Method: Twelve or more prospective jurors are seated in the jury box and examined by judge and/or attorneys. Judge rules on challenges for cause. Attorneys exercise peremptory challenges. Seats that are vacated by struck jurors are refilled by random selection.
Six/Four Pack Method: Similar to Strike & Replace Method except prospective jurors are questioned in groups of six or four until the full number of jurors is reached.
Struck: The entire panel is examined by the judge and/or attorneys and the judge rules on challenges for cause and hardship. Prospective jurors equal to the number of impaneled jurors, alternates and peremptory challenges is seated. The attorneys exercise peremptory challenges alternately until the final panel is selected and sworn.
Individual: Prospective jurors are examined individually outside the hearing of other jurors (e.g., at sidebar or in chambers). The judge rules on challenges for cause after each juror is questioned. After questioning outside the presence of other jurors, attorneys may be required to exercise peremptory challenges at the completion of each examination.
Other method (please describe): ________________________________________________________________________
________________________________________________________________________
________________________________________________________________________
________________________________________________________________________
66

National Program to Increase Citizen Participation in Jury Service
C. Who questioned the jurors during the voir dire? Judge only Judge primarily with limited attorney follow-up Judge and attorney equally Attorney primarily with limited judge Attorney only
o If attorney only, was the judge present for the voir dire? Y / N
How long was the voir dire? __________________________ (hours)
• Please indicate which of the following trial procedures or practices were employed in
your most recent jury trial Jurors were permitted to take notes Jurors were provided with writing utensils and notepaper for taking notes Jurors were provided with a notebook containing one or more of the following: a glossary
of unfamiliar terms, names and short biographies of witnesses, copies of documentary evidence or exhibits, preliminary or final instructions, and notepaper for taking notes
Jurors were permitted to submit questions in writing to witnesses Jurors were permitted to discuss the evidence among themselves prior to deliberations Jurors were given substantive instructions on the law prior to the evidentiary portion of
the trial Jurors were instructed on the law before closing argument Jurors were instructed on the law after closing argument Attorneys were permitted to provide interim summation to the jury during the evidentiary
portion of the trial
Please describe any other procedures or practices employed during your most recent jury trial that were intended to improve juror comprehension, attention levels, performance, or satisfaction with jury service during trial. ________________________________________________________________________
________________________________________________________________________
________________________________________________________________________
________________________________________________________________________
67

National Program to Increase Citizen Participation in Jury Service
68
Jury Deliberations
4. Please indicate which of the following trial procedures or practices were employed in your most recent jury trial.
Jurors were given guidance on how to conduct deliberations At least one written copy of the final jury instructions was provided to the jury All jurors were provided with a written copy of the final jury instructions Alternates were permitted to participate in deliberations Jurors were sequestered for deliberations
How long were the jury deliberations? __________________________ (hours)
Please describe any other procedures or practices employed during your most recent jury trial that were intended to improve juror comprehension, attention levels, performance, or satisfaction with jury deliberations. ___________________________________________________________________________
___________________________________________________________________________
Special Issues
5. Please indicate if any of the following issues arose in your most recent jury trial and
what procedures, if any, the court employed to address those issues. Notorious trial / High profile trial: ____________________________________________
________________________________________________________________________
Capital jury trial: _________________________________________________________
________________________________________________________________________
Juror stress: _____________________________________________________________
________________________________________________________________________
Jury sentencing in non-capital trial: ___________________________________________
________________________________________________________________________
Please send to Chris Connelly Court Research Analyst
The Center for Jury Studies National Center for State Courts
2425 Wilson Blvd Suite 350 Arlington, VA 22201

National Program to Increase Citizen Participation in Jury Service
69
APPENDIX C: STATE-BY-STATE RESPONSE RATES

National Program to Increase Citizen Participation in Jury Service
70

National Program to Increase Citizen Participation in Jury Service
State # Surveys # Counties % State Population
Alabama 8 8 8Alaska 9 9 29Arizona 12 12 97Arkansas 30 30 56California 52 52 98Colorado 21 21 64Connecticut 1 8 97Delaware 3 3 100District of Columbia 1 1 100Florida 14 30 53Georgia 60 60 53Hawaii 4 4 100Idaho 10 10 55Illinois 87 87 97Indiana 79 79 95Iowa 28 41 52Kansas 10 17 20Kentucky 90 90 57Louisiana 51 56 92Maine 12 12 83Maryland 22 22 95Massachusetts 14 14 100Michigan 27 29 73Minnesota 17 17 66Mississippi 33 38 38Missouri 67 67 53Montana 34 34 53Nebraska 57 57 41Nevada 9 17 100New Hampshire 7 7 85New Jersey 21 21 100New Mexico 8 12 60New York 58 58 99North Carolina 8 8 17North Dakota 30 30 76Ohio 5 5 14Oklahoma 14 14 10Oregon 22 22 82Pennsylvania 25 26 64Rhode Island 1 1 36South Carolina 19 19 45South Dakota 9 65 92Tennessee 12 32 43Texas 105 112 70Utah 16 16 91Virginia 51 51 42Washington 23 23 87West Virginia 34 34 70Wisconsin 56 56 64Wyoming 6 6 41
71

National Program to Increase Citizen Participation in Jury Service
APPENDIX D: NOTES ON METHODOLOGY USED TO CALCULATE NATIONAL STATISTICS
National and statewide statistics were generated from Local Court Survey data and Judge and Attorney Survey data in order to glimpse a snapshot of the nation as a whole and to compare the results from an individual state to those of the nation at large. Depending on the format of the data, national and statewide statistics were calculated in several ways.
The easiest statewide or national statistic to compute is a frequency or an average. For example, if you wanted to know the median voir dire time for Virginia State Courts you would select the subset of Judge and Attorney Surveys submitted by Virginia State Courts and compute the median. For the national percentage of state courts using a one-step qualification and summoning process, you would run a frequency on the qualification and summoning variable for all Local Court Surveys.
Some of the national and statewide statistics from the Local Court Survey used a more complicated method to aggregate individual surveys. The examples below will demonstrate how the Local Court Survey was aggregated at the state level to create statewide statistics which were then aggregated to provide national statistics. Fifty-one counties in Virginia submitted Local Court Surveys, and these will be used for the example calculations. The populations of these 51 counties were obtained from the 2000 U.S. Census American Factfinder website (http://factfinder.census.gov/home/saff/main.html?_lang=en), added together, and considered the “represented population”. The percent of the state represented in the survey is the represented population divided by the total population of the state.
Example 1: Given from Local Court Surveys: Sum of 51 VA Local Court Surveys county populations: 2,994,313 Year 2000 Population of VA (from US Census): 7,078,515 Calculated: Percent Represented: 2,994,313 / 7,078,515 *100 = 42.3 %
The Local Court Survey asked each locality to approximate the number of jury summonses mailed each year and the number of felony, misdemeanor, civil, and “other” juries impaneled each year. The numbers provided by the local courts were summed for the represented population of the state (or nation) and then extrapolated to provide an estimate of the entire state’s (or nation’s) annual summonses and jury trials. See the example below.
Example 2: Given from Local Court Surveys Sum of 51 VA Local Court Surveys No. of Summonses Mailed: 127,990 Sum of 51 VA Local Court Surveys No. of Felony Juries Impaneled: 779 Sum of 51 VA Local Court Surveys No. of Misdemeanor Juries Impaneled: 304 Sum of 51 VA Local Court Surveys No. of Civil Juries Impaneled: 624
73

National Program to Increase Citizen Participation in Jury Service
74
Sum of 51 VA Local Court Surveys No. of Other Juries Impaneled: 19 Sum of 51 VA Local Court Surveys Total No. of Juries Impaneled: 1,726 Calculated: Estimated No. of Summonses mailed in VA: 127,990 / 0.423 = 302,577 Estimated No. of Felony Juries Impaneled in VA: 779 / 0.423 = 1,842 Estimated No. of Misdemeanor Juries Impaneled in VA: 304 / 0.423 = 719 Estimated No. of Civil Juries Impaneled in VA: 624 / 0.423 = 1,475 Estimated No. of Other Juries Impaneled in VA: 19 / 0.423 = 45 Estimated Total No. of Juries Impaneled in VA: 1,726 / 0.423 = 4,080 Estimated Trial Rate per 100,000 Population: 4,080 / (7,078,515 / 100,000) = 57.6
The estimated number of jurors impaneled on a statewide or national basis was calculated from the estimated number of juries impaneled. Based on the minimum number of jurors required for each state by statute and depending on the trial type, the number of jurors was computed. Note that for the “other” trial category, 12 jurors were assumed across all states. Due to the large variation in number of jurors required by trial type (eminent domain, family law, juvenile, etc.) and across states, it was simplest to assume 12 jurors in all cases even though this number may be over-inclusive.
Example 3: Given by state statute: No. of Jurors Required by VA for a Felony Trial: 12 No. of Jurors Required by VA for a Misdemeanor Trial: 7 No. of Jurors Required by VA for a Civil Trial: 7 No. of Jurors for an Other Trial: 12 Year 2000 VA Population Age 18 and greater (from US Census): 5,340,253 Calculated: Estimated Felony Jurors Impaneled in VA: 1,842 * 12 = 22,104 Estimated Misdemeanor Jurors Impaneled in VA: 719 * 7 = 5,033 Estimated Civil Jurors Impaneled in VA: 1,475 * 7 = 10,325 Estimated Other Jurors Impaneled in VA: 45 * 12 = 540 Estimated Total Jurors Impaneled in VA: Sum of above = 38,002 Percent of Adult Population Impaneled: 38,002 / 5,340,253 * 100 = 0.7 %

75
APPENDIX E: STATE TABLES ON KEY JURY OPERATION AND PRACTICE MEASUREMENTS
TABLE 1: VOIR DIRE LENGTH IN NON-CAPITAL FELONY TRIALS
TABLE 2: VOIR DIRE LENGTH IN CIVIL TRIALS
TABLE 3: WHO CONDUCTS VOIR DIRE
TABLE 4: ATTORNEY ACCESS TO JUROR INFORMATION BEFORE VOIR DIRE
TABLE 5: ATTORNEY ACCESS TO JUROR QUALIFICATION INFORMATION BEFORE VOIR DIRE
TABLE 6: JURORS EXAMINED INDIVIDUALLY AT SIDEBAR OR IN CHAMBERS DURING VOIR DIRE
TABLE 7: JURORS PERMITTED TO TAKE NOTES
TABLE 8: JURORS PROVIDED WITH WRITING MATERIALS
TABLE 9: JURORS PERMITTED TO SUBMIT QUESTIONS TO WITNESSES
TABLE 10: JURORS INSTRUCTED BEFORE CLOSING ARGUMENTS
TABLE 11: JURY PROVIDED WITH AT LEAST ONE COPY OF WRITTEN INSTRUCTIONS
TABLE 12: ALL JURORS PROVIDED WITH WRITTEN INSTRUCTIONS

76

77
Length of Voir Dire for Felony Trials
State Sample Size Median Length (Hr)South Carolina 32 0.5Alabama 27 1.0Delaware 12 1.0Maine 15 1.0New Hampshire 23 1.0Virginia 118 1.0West Virginia 28 1.3Arkansas 22 1.5Kentucky 74 1.5Maryland 178 1.5Massachusetts 70 1.5Michigan 166 1.5Mississippi 50 1.5New Mexico 51 1.5Pennsylvania 149 1.5Wisconsin 7 1.5Florida 186 2.0Georgia 105 2.0Indiana 112 2.0Iowa 58 2.0Kansas 56 2.0Montana 21 2.0Nebraska 43 2.0North Carolina 133 2.0North Dakota 49 2.0Ohio 71 2.0Oregon 117 2.0Rhode Island 21 2.0South Dakota 75 2.0Tennessee 73 2.0Texas 148 2.0Utah 166 2.0Vermont 29 2.0Washington 71 2.0Wyoming 25 2.0Colorado 57 2.5Idaho 14 2.5Oklahoma 70 2.5Arizona 90 3.0Hawaii 24 3.0Illinois 145 3.0Minnesota 110 3.0Missouri 97 3.0Nevada 43 3.0DC 60 3.5Alaska 67 4.0California 167 4.0Louisiana 93 4.0New Jersey 48 4.5New York 148 5.0Connecticut 28 10.0
n/a = Not Applicable National Center for State Courts, 2007
State Rankings of Judge & Attorney Survey Results
Median length of voir dire in hours for felony trials.

78
Length of Voir Dire for Civil Trials
State Sample Size Median Length (Hr)South Carolina 42 0.5Delaware 24 0.8Virginia 91 0.8Arkansas 21 1.0Maine 43 1.0Maryland 113 1.0Massachusetts 87 1.0New Hampshire 17 1.0Vermont 13 1.0West Virginia 56 1.0Rhode Island 17 1.3DC 37 1.5Kentucky 107 1.5Oregon 210 1.5Tennessee 91 1.5Michigan 402 1.7Alabama 29 2.0Arizona 58 2.0Colorado 60 2.0Georgia 202 2.0Indiana 130 2.0Iowa 60 2.0Kansas 41 2.0Minnesota 180 2.0Mississippi 47 2.0Missouri 222 2.0Montana 32 2.0Nebraska 63 2.0Nevada 86 2.0New Jersey 115 2.0New Mexico 33 2.0Ohio 174 2.0Oklahoma 63 2.0Pennsylvania 544 2.0South Dakota 96 2.0Texas 313 2.0Utah 160 2.0Wisconsin 93 2.0Wyoming 19 2.0North Dakota 62 2.3Florida 88 2.5Idaho 30 2.5Hawaii 40 3.0Illinois 519 3.0Louisiana 54 3.0New York 216 3.0North Carolina 67 3.0Washington 77 3.0Alaska 102 3.8California 184 4.0Connecticut 137 16.0
n/a = Not Applicable National Center for State Courts, 2007
State Rankings of Judge & Attorney Survey Results
Median length of voir dire in hours for civil trials.

79
Who Questioned the Jurors During Voir Dire
State Sample Size Average ScoreSouth Carolina 83 1.05Maine 65 1.19Delaware 41 1.20Massachusetts 197 1.28New Jersey 168 1.35Maryland 347 1.75Utah 406 1.92New Hampshire 45 2.00DC 107 2.08Arizona 161 2.27California 446 2.57Nevada 140 2.79Illinois 781 2.84West Virginia 90 2.96Michigan 799 3.06Virginia 226 3.08Pennsylvania 748 3.09Colorado 176 3.11Oklahoma 173 3.12Wisconsin 179 3.24Idaho 68 3.28Mississippi 126 3.37Hawaii 69 3.40Minnesota 345 3.50Ohio 255 3.51New Mexico 97 3.55New York 450 3.55Kentucky 211 3.56Louisiana 159 3.61Florida 405 3.62Nebraska 150 3.64Rhode Island 62 3.66Arkansas 45 3.68Washington 165 3.71Alabama 57 3.73Indiana 274 3.73Tennessee 181 3.85Kansas 111 3.91Oregon 393 3.93North Dakota 154 3.94Georgia 382 3.96Montana 66 3.98North Carolina 245 3.98Wyoming 47 3.98Alaska 225 4.03Texas 574 4.09South Dakota 213 4.13Iowa 168 4.16Missouri 348 4.19Vermont 57 4.30Connecticut 170 4.54
n/a = Not Applicable National Center for State Courts, 2007
State Rankings of Judge & Attorney Survey Results
Mean score from most judge-dominated voir dire (scoring a 1) to most attorney-dominated voir dire (scoring a 5) for all jury trials.

80
Access to Juror Information
State Sample Size Mean ScoreCalifornia 52 0.15Alaska 9 0.56North Carolina 8 0.63Oklahoma 15 0.80Colorado 21 0.81Utah 16 0.81DC 1 1.00Florida 14 1.07New Jersey 21 1.10Alabama 8 1.13Louisiana 51 1.20Georgia 60 1.47Virginia 51 1.53Mississippi 36 1.58Maine 12 2.08Missouri 67 2.13Kentucky 90 2.16Nebraska 57 2.16Ohio 5 2.20Oregon 22 2.27Texas 105 2.35Iowa 28 2.43Pennsylvania 25 2.48Maryland 22 2.50South Dakota 9 2.56Illinois 87 2.72North Dakota 30 2.73New Mexico 8 2.75Tennessee 12 2.75Nevada 9 2.78Washington 23 2.78South Carolina 19 2.79Arizona 12 2.83Kansas 10 2.90Montana 34 2.91Arkansas 30 2.93Michigan 27 2.96Connecticut 1 3.00Delaware 3 3.00West Virginia 34 3.00Idaho 10 3.10Indiana 79 3.13Wyoming 6 3.17Minnesota 17 3.41Hawaii 4 3.50New Hampshire 7 3.57Massachusetts 14 4.00New York 58 n/aRhode Island 1 n/aVermont 0 n/aWisconsin 56 n/a
n/a = Not Applicable National Center for State Courts, 2007
State Rankings of Local Court Survey Results
Mean score for 4 possible categories of "other juror information" that attorneys are given access to prior to trial: marital status, occupation, children, and other. These are less typical than other types of juror information such as name, address, and

81
Access to Jurors' Qualification Questionnaires
State Sample Size % of CourtsDelaware 3 0.0Massachusetts 14 0.0New York 58 0.0California 52 2.8New Jersey 21 4.8Maryland 22 9.1Utah 16 13.3Minnesota 17 17.6Arizona 12 25.0Virginia 51 28.0North Carolina 8 28.6Oklahoma 15 36.4Alaska 9 37.5Louisiana 51 38.6Idaho 10 44.4Georgia 60 50.0Florida 14 55.6Alabama 8 60.0Ohio 5 60.0Pennsylvania 25 61.9Oregon 22 63.6Illinois 87 72.0Michigan 27 73.1West Virginia 34 73.5South Carolina 19 73.7Colorado 21 75.0North Dakota 30 75.9Iowa 28 81.5Washington 23 87.0South Dakota 9 87.5Mississippi 36 87.9Kansas 10 88.9Nevada 9 88.9Texas 105 90.4Tennessee 12 91.7Missouri 67 92.3Nebraska 57 92.9Kentucky 90 96.5Arkansas 30 100.0Connecticut 1 100.0Hawaii 4 100.0Indiana 79 100.0Maine 12 100.0Montana 34 100.0New Hampshire 7 100.0New Mexico 8 100.0Wyoming 6 100.0DC 1 n/aRhode Island 1 n/aVermont 0 n/aWisconsin 56 n/a
n/a = Not Applicable National Center for State Courts, 2007
State Rankings of Local Court Survey Results
Percent of local court respondents that routinely give attorneys access to jurors' qualification questionnaires.

82
Jurors Questioned at Sidebar or in Chambers
State Sample Size % of RespondentsRhode Island 62 66.1Maryland 347 63.7Connecticut 170 62.9Massachusetts 197 60.4Hawaii 69 58.0DC 107 57.9New Hampshire 45 55.6Maine 65 53.8New Jersey 168 53.0Pennsylvania 748 52.9Alaska 225 51.1West Virginia 90 50.0Wyoming 47 44.7Utah 406 44.3Delaware 41 43.9Texas 574 43.7Kentucky 211 41.7New York 450 40.2Arizona 161 38.5Louisiana 159 35.8Colorado 176 35.2Missouri 348 34.2California 446 33.2Florida 405 32.3Vermont 57 31.6Montana 66 30.3Alabama 57 28.1New Mexico 97 26.8Arkansas 45 26.7Illinois 781 26.6Iowa 168 24.4Wisconsin 179 24.0Mississippi 126 22.2Oklahoma 173 22.0Georgia 382 20.2South Carolina 83 19.3Idaho 68 19.1Virginia 226 19.0Ohio 255 17.6Kansas 111 17.1Nevada 140 17.1Nebraska 150 16.7Washington 165 15.8Minnesota 345 13.9South Dakota 213 13.1Indiana 274 12.0North Dakota 154 11.0Tennessee 181 8.3Michigan 799 8.0Oregon 393 4.8North Carolina 245 2.4
n/a = Not Applicable National Center for State Courts, 2007
State Rankings of Judge & Attorney Survey Results
Percent of respondents who reported that jurors were questioned individually at sidebar or in chambers, outside the range of hearing of other jurors, during voir dire.

83
Jurors Permitted to Take Notes
State Sample Size % of RespondentsWyoming 47 95.7Arkansas 45 95.6Arizona 161 95.0Indiana 274 94.9Colorado 176 92.6Oregon 393 92.1Minnesota 345 91.9California 446 91.5Alabama 57 91.2Idaho 68 91.2Maryland 347 90.5Utah 406 90.4Hawaii 69 88.4Iowa 168 88.1New Mexico 97 87.6Illinois 781 87.3Washington 165 87.3Alaska 225 87.1DC 107 86.9Montana 66 86.4Wisconsin 179 86.0Nevada 140 83.6Georgia 382 81.9South Dakota 213 80.8Tennessee 181 77.3North Dakota 154 76.6Kentucky 211 76.3Massachusetts 197 67.0North Carolina 245 64.9Virginia 226 59.7Vermont 57 59.6Mississippi 126 57.1Florida 405 55.1Ohio 255 53.7Texas 574 53.0Michigan 799 52.1Oklahoma 173 50.3Connecticut 170 47.6Delaware 41 46.3Pennsylvania 748 46.1West Virginia 90 44.4Missouri 348 40.2New Jersey 168 39.9South Carolina 83 38.6Kansas 111 36.0Louisiana 159 34.6New York 450 32.7Nebraska 150 24.7Maine 65 23.1New Hampshire 45 20.0Rhode Island 62 19.4
n/a = Not Applicable National Center for State Courts, 2007
State Rankings of Judge & Attorney Survey Results
Percent of respondents who reported that jurors were permitted to take notes.
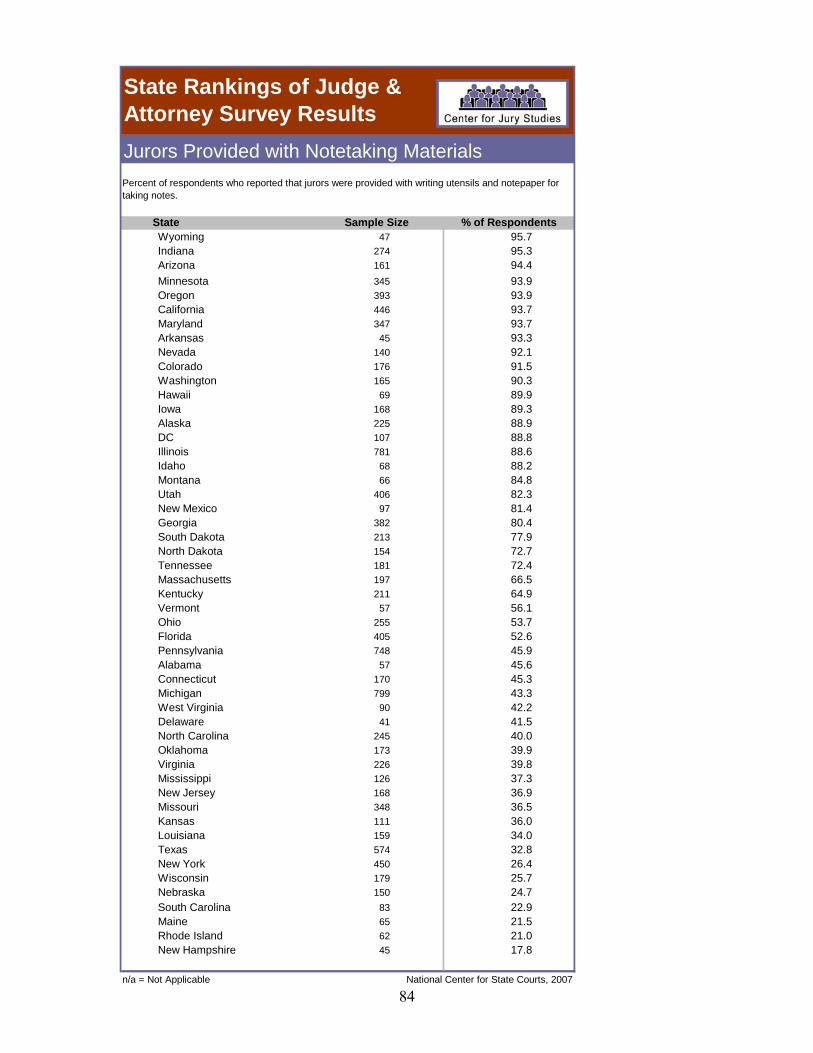
84
Jurors Provided with Notetaking Materials
State Sample Size % of RespondentsWyoming 47 95.7Indiana 274 95.3Arizona 161 94.4Minnesota 345 93.9Oregon 393 93.9California 446 93.7Maryland 347 93.7Arkansas 45 93.3Nevada 140 92.1Colorado 176 91.5Washington 165 90.3Hawaii 69 89.9Iowa 168 89.3Alaska 225 88.9DC 107 88.8Illinois 781 88.6Idaho 68 88.2Montana 66 84.8Utah 406 82.3New Mexico 97 81.4Georgia 382 80.4South Dakota 213 77.9North Dakota 154 72.7Tennessee 181 72.4Massachusetts 197 66.5Kentucky 211 64.9Vermont 57 56.1Ohio 255 53.7Florida 405 52.6Pennsylvania 748 45.9Alabama 57 45.6Connecticut 170 45.3Michigan 799 43.3West Virginia 90 42.2Delaware 41 41.5North Carolina 245 40.0Oklahoma 173 39.9Virginia 226 39.8Mississippi 126 37.3New Jersey 168 36.9Missouri 348 36.5Kansas 111 36.0Louisiana 159 34.0Texas 574 32.8New York 450 26.4Wisconsin 179 25.7Nebraska 150 24.7South Carolina 83 22.9Maine 65 21.5Rhode Island 62 21.0New Hampshire 45 17.8
n/a = Not Applicable National Center for State Courts, 2007
State Rankings of Judge & Attorney Survey Results
Percent of respondents who reported that jurors were provided with writing utensils and notepaper for taking notes.

85
Juror Questions to Witnesses
State Sample Size % of RespondentsArizona 161 91.3Indiana 274 86.1Colorado 176 62.5New Mexico 97 58.8New Jersey 168 35.1Wyoming 47 34.0Washington 165 33.9Oregon 393 28.0Wisconsin 179 27.4Vermont 57 26.3Kentucky 211 24.6Utah 406 24.4Idaho 68 23.5Hawaii 69 23.2California 446 22.9DC 107 22.4Tennessee 181 21.5Nevada 140 18.6Massachusetts 197 18.3Florida 405 14.6Alaska 225 14.2Ohio 255 14.1Arkansas 45 13.3South Dakota 213 12.2Michigan 799 12.1Virginia 226 11.5Maryland 347 9.2New Hampshire 45 8.9Nebraska 150 6.7Montana 66 6.1New York 450 4.9Rhode Island 62 4.8Connecticut 170 4.7Alabama 57 3.5North Dakota 154 3.2Oklahoma 173 2.9Kansas 111 2.7Minnesota 345 2.6West Virginia 90 2.2Georgia 382 2.1Texas 574 1.7Maine 65 1.5Iowa 168 1.2Missouri 348 1.1Illinois 781 1.0Pennsylvania 748 0.8Louisiana 159 0.6Delaware 41 0.0Mississippi 126 0.0North Carolina 245 0.0South Carolina 83 0.0
n/a = Not Applicable National Center for State Courts, 2007
State Rankings of Judge & Attorney Survey Results
Percent of respondents who reported that jurors were permitted to submit questions in writing to witnesses.

86
Jurors Instructed Before Closing Arguments
State Sample Size % of RespondentsArkansas 45 93.3West Virginia 90 91.1Kansas 111 90.1Montana 66 89.4Oklahoma 173 87.3Virginia 226 87.2New Mexico 97 86.6Washington 165 84.8Maryland 347 84.4Colorado 176 81.8Iowa 168 80.4Idaho 68 79.4South Dakota 213 79.3Utah 406 77.8Texas 574 77.2Wyoming 47 76.6Nevada 140 73.6Missouri 348 70.7Kentucky 211 70.6Wisconsin 179 70.4California 446 69.7Arizona 161 67.1Mississippi 126 64.3Hawaii 69 63.8Minnesota 345 50.7North Dakota 154 48.7DC 107 42.1Delaware 41 39.0Nebraska 150 33.3Maine 65 32.3Alaska 225 31.6Tennessee 181 28.7Rhode Island 62 25.8Oregon 393 20.6Indiana 274 18.6New Hampshire 45 17.8Ohio 255 17.6Pennsylvania 748 9.8Illinois 781 9.7Florida 405 9.6New Jersey 168 8.9Michigan 799 8.4South Carolina 83 8.4Louisiana 159 7.5Alabama 57 7.0Georgia 382 6.5New York 450 5.6Massachusetts 197 4.6North Carolina 245 4.5Connecticut 170 3.5Vermont 57 3.5
n/a = Not Applicable National Center for State Courts, 2007
State Rankings of Judge & Attorney Survey Results
Percent of respondents who reported that jurors were instructed on the law before closing arguments.

87
At Least One Copy of Jury Instructions
State Sample Size % of RespondentsMontana 66 100.0Wyoming 47 100.0Iowa 168 98.8Kentucky 211 98.6New Mexico 97 97.9Idaho 68 97.1North Dakota 154 96.8Kansas 111 96.4Arizona 161 96.3Illinois 781 95.5Wisconsin 179 95.5Delaware 41 95.1Missouri 348 94.8Virginia 226 94.7Texas 574 94.6California 446 94.2Hawaii 69 94.2Indiana 274 94.2South Dakota 213 93.9Washington 165 93.9Colorado 176 93.8Utah 406 93.6Arkansas 45 93.3Nebraska 150 93.3Alaska 225 91.6Minnesota 345 91.6Nevada 140 90.0New Hampshire 45 88.9Vermont 57 87.7DC 107 86.9Oklahoma 173 86.7Tennessee 181 86.7Ohio 255 85.1Mississippi 126 81.0Florida 405 72.8Oregon 393 61.1West Virginia 90 56.7Maine 65 44.6Michigan 799 40.9Rhode Island 62 38.7Maryland 347 38.6North Carolina 245 35.1Louisiana 159 34.0Connecticut 170 31.8Georgia 382 28.0New Jersey 168 26.2Massachusetts 197 22.8South Carolina 83 20.5Alabama 57 12.3Pennsylvania 748 11.1New York 450 10.7
n/a = Not Applicable National Center for State Courts, 2007
State Rankings of Judge & Attorney Survey Results
Percent of respondents who reported that at least one written copy of the final jury instructions was provided to jurors.

88
All Jurors Received a Copy of Jury Instructions
State Sample Size % of RespondentsArizona 161 80.7Indiana 274 77.4Hawaii 69 72.5Wyoming 47 70.2Washington 165 68.5Colorado 176 67.0Oklahoma 173 64.2Iowa 168 61.9Idaho 68 58.8Kansas 111 58.6Vermont 57 57.9Texas 574 57.0Alaska 225 55.6Utah 406 53.7Kentucky 211 53.6Nebraska 150 52.0California 446 49.3Minnesota 345 46.7Ohio 255 46.3Montana 66 45.5New Mexico 97 45.4Nevada 140 44.3Missouri 348 43.4Tennessee 181 38.7Florida 405 38.3New Hampshire 45 35.6South Dakota 213 34.7Delaware 41 34.1North Dakota 154 29.9Oregon 393 29.5Virginia 226 28.8Maine 65 27.7Mississippi 126 27.0DC 107 21.5Rhode Island 62 19.4Connecticut 170 17.6North Carolina 245 17.6Michigan 799 16.8Illinois 781 15.1Maryland 347 14.7Georgia 382 14.1New Jersey 168 13.7Massachusetts 197 9.6West Virginia 90 8.9Arkansas 45 6.7South Carolina 83 6.0Wisconsin 179 5.6Alabama 57 5.3New York 450 5.3Pennsylvania 748 5.1Louisiana 159 0.6
n/a = Not Applicable National Center for State Courts, 2007
State Rankings of Judge & Attorney Survey Results
Percent of respondents who reported that all jurors received a written copy of the final jury instructions.