Embed Size (px)
Citation preview

P l a c e r Mining i n t h e Upper Cha tan ika River System
1980-1986
by Alan H . Townsend
T e c h n i c a l Repor t No. 87-2
Don W. C o l l i n s w o r t h Commissioner
Bruce H. Baker A c t i n g D i r e c t o r
Alaska Department o f F i s h and Game D i v i s i o n of H a b i t a t
P.O. Box 3-2000 Juneau , Alaska 99802-2000
J u l y 1987

TABLE OF CONTENTS
Page
........................................ L i s t o f T a b l e s i v
....................................... L i s t o f F i g u r e s v
Acknowledgements ...................................... v i
E x e c u t i v e Summary ..................................... v i i
I n t r o d u c t i o n and Background ........................... I
S t u d y Area ........................................ 5
Methods ................................................ 8
P l a c e r Mining. Upper C h a t a n i k a R i v e r Dra inage . 1986 .... 9
R e s u l t s ............................................... 1 5
D i s c u s s i o n ........................................ 2 1
R e f e r e n c e s ........................................ 2 4
................ Appendix A ( D e s c r i p t i o n o f Mine S i t e s ) 27 Mine S i t e A ...................................... 2 7 Mine S i t e B ...................................... 27 Mine S i t e C ...................................... 2 7 Mine S i t e D ...................................... 28 Mine S i t e E ...................................... 28 Mine S i t e F ...................................... 28 Mine S i t e G ...................................... 29 Mine S i t e H ...................................... 29 Mine S i t e I ...................................... 29
iii

LIST OF TABLES
Table Page
1 Fishing Use and Number of Whitefish Taken from Chatanika River ............................. 3
2 Average Turbidity (NTU) Based on Grab Samples Collected Downstream from Miner F Located on Deep and Hope Creeks for the Years 1983, 1985, and ............................................. 1 9 8 6 17

LIST OF FIGURES
Figure Page
1 Chatanika, Tolovana, Chena, and Tanana Rivers .......................... Near Fairbanks, Alaska 6
2 Upper Chatanika River Above Long Creek Including ......... Faith Creek and Faith Creek Tributaries 7
3 Placer Mining Activity - Upper Chatanika River Drainage, 1980-86 ............................... 10
4 Active Placer Mining Sites on Upper Chatanika River Drainage, 1986 ............................ 11
5 ADF&G Sample Days Within Selected Turbidity Ranges, Faith Creek ............................. 16
6 INF Sample Days Within Selected Turbidity Ranges, Chatanika River ......................... 18
7 Turbidity in Chatanika River at Poker Creek. Data From INF ................................... 20

ACKNOWLEDGEMENTS
The Institute of Northern Forestry (INF) provided the most comprehensive set of water samples and data analysis available for the Mid-dle Chatanika River. A special thanks to Jerry Hilgert and the rest of the staff at INF for their data contribution for this paper.
Mary Moorman and Steve Mack (Alaska Department of Natural Resources) also provided much needed support with their water sample analysis and the Faith Creek flow data. Their assistance, provided through the Division of Geological and Geophysical Survey, enabled the cooperating agencies to include many more water samples in the data during 1986 than would have otherwise been possible.
Leslie Simmons (Alaska Department of Environmental Conservation) was very helpful with the tedious job of servicing, the ISCO water sampler on many occasions.
A hearty thanks to many Habitat Division staff members for their assistance with the ISCO, data analyses, typing, and editorial and technical review.
And lastly, thank you Upper Chatanika River placer miners for the cooperation they gave the agencies during the data collection for this report and for the progress they made toward achieving true multiple use on the Chatanika River.

EXECUTIVE SUMMARY
Increased placer mining activity on Upper Chatanika River tributaries from 1980 to 1985 increased suspended solids concentrations throughout much of the Chatanika River. The increase in placer mining activity was paralleled by an increase in user conflicts on the Chatanika River system. Sport fishermen were less successful at catching whitefish. Creel census surveys suggest that many fishermen may have avoided participation in the fishery during the seasons when turbidity levels were elevated as a result of placer mine effluent.
In 1986, the Alaska departments of Natural Resources, Environmental Conservation, and Fish and Game designated the Chatanika River as a "Special Priority" stream for reducing turbidity from placer mines. These agencies worked. cooperatively with the miners to provide technical assistance during the mining plan development process and field monitoring of mining activities.
Water quality data collected by the three state agencies in 1986 on Faith Creek and data collected during 1984, 1985, and 1986 by the Institute of Northern Forestry on the Middle Chatanika River clearly show that the cooperative efforts between agencies and industry resulted in cleaner water downstream from placer mining. The cleaner water has enhanced resumption of recreational fishing opportunities and has provided direct evidence that multiple use can be achieved within a watershed.
v i i

INTRODUCTION AND BACKGROUND
In 1972 the price of gold was deregulated by the federal government. Subsequently, the price of gold increased from $35 per Troy ounce (02) in 1972 to $38 per oz in 1973. By 1976, the price of gold exceeded $100 per oz. This increase in gold prices generated renewed interest in Alaska's placer gold deposits. Placer gold that had been unprofitable to mine at $35 per oz gave new life to a nearly dormant industry when by 1980 gold prices exceeded $600 per oz.
The increase in placer gold mining activity from 1975 to 1985 was not accompanied by a comparable increase in treatment technology for mining effluent. Consequently, suspended solids from placer-mine discharges increased levels of suspended solids in the Chatanika River system for up to 100 miles from the sediment sources.
Placer mining in the Chatanika River drainage increased from two or three small operations in the early 1970's to 25 or more bv the mid-1980's. During this same period there were four to nine placer operations on tributaries to the Middle Chatanika River and 5 to 13 operations on the Goldstream Creek drainage, a tributary to the Lower Chatanika River. Most mining operations in the Middle Chatanika River, except for occasional recreational suction dredqes and one mine site on Any Creek (a tributary to Our Creek), were located on tributaries above areas of old tailings or the operations were offstream using closed systems with no water discharge. The old tailings filtered most of the mining sediments before the water was released to the Middle Chatanika River. Therefore, fewer water quality problems have been associated with effluent from the Middle Chatanika River mines.
Small-scale placer-mining operations ( e . , less than 200 cubic yards per day [cyd]) and exploration activities were conducted on Faith Creek and eight other Upper Chatanika River tributaries between 1980 and 1986. Of these streams, Sourdough Creek (1980-81) and Faith Creek were the only tributaries documented as contributing suspended solids generated by placer mining to the Upper Chatanika River. In addition, a Steese Highway reconstruction project from Milepost 55 to 62, including several hundred feet of channelization in the Chatanika River, may have contributed some sediment to the system durinq 1983 (Winters 1983).
Fishermen and recreational users filed multiple complaints with the Alaska Department of Environmental Conservation (ADEC) regarding poor water quality in the Chatanika River during the summer of 1980 and 1981 (Rrossia and Reeves 1982). Recreational use of the Chatanika River also declined during this period (Mills 1979, 1980, and 1981).

The number of complaints declined from 1982 through 1984 (ADEC , unpublished) while angler use of the drainage remained below pre-198 0 participation levels (Table 1) . Elevated suspended solids prevented or hindered fish survey projects in the Chatanika River between Sourdough Creek and the Trans-Alaska Pipeline System crossing during 1980 and 1983 through 1985 (Kramer 1981, Holmes 1986, Barton 1984).
Turbidity from the Lower Chatanika placer operations affects recreational activities on Goldstream Creek and approximately the last 25 miles of the Chatanika River. In 1984, a water sample collected by a representative of the ADEC from near the mouth of Goldstream Creek on August 15 had a turbidity of 30 NTU and a sample collected the same day approximately 20 miles below mining on Goldstream Creek was 190 NTU (Hock and Toland 1985) . The remoteness of this area limited the potential for conflicts with recreational users of the system through 1983. However, as access improves and recreational uses increase on the Lower Chatanika River more user conflicts may occur as a result of turbid water from Goldstream Creek. Aquatic habitat studies in the Goldstream Creek drainage were conducted in 1986 and 1987 as a result of funding provided by Tanana Chiefs Conference. A report (Water Quality and Aquatic Habitat Assessments of Goldstream Creek Drainage) by Weber and Robus will be completed and available in late 1987.
Water-quality measurements prior to 1984 are limited in number for the Middle Chatanika River system. Substantial records are available for Faith Creek only for the 1986 summer season. Prior to implementation of the tri-agency sampling program on Faith Creek in 1986, agency personnel collected a number of grab samples. In 1984, 40 grab samples were collected on Faith Creek at the Steese Highway (Stevens, unpublished data; Hock and Toland 1985; and Weber and Townsend, unpublished data). The average turbidity level for these 40 samples was 87 NTU (range 14 to 400).
From 1982 through 1985, water-quality-related conflicts in the Upper Chatanika River drainage occurred primarily during the placer-mining season, generally from mid-June through mid-September (approximately 110 days). The open-water recreation season generally occurs from early June through early October (approximately 130 days). This places both user groups in the drainage during the same period for about 85 percent of the available open-water recreational opportunities.
Increased placer mining also affected state regulatory agencies with natural resource management and permit responsibilities. The three agencies involved with placer

Table I. Fishing Use andlNumber of Whitefish Taken from Chatanika River
Year Person- Number of
Days ~ i s h e d ~ Whitefish
'nills 1979, 80, 81, 82, 83, 84, 85, 86 2 ~ o t a l Person-Days Fished for All Fish Species in Chatanika River
3 ~ o Data Available for 1979 4 ~ l a r k 1986

mining were the ADEC (water quality standards), Alaska Department of Fish and Game (ADF&G) (fish passage and fish habitat protection) , and Alaska Department of Natural Resources (ADNR) (state land use and water allocation). In 1980, these agencies developed a master permit application for placer mining to expedite the permit process for miners and the state. The state resource agencies also developed a unified and cooperative approach for a placer mining field program in 1980.
The state revised the master permit application in 1981 and called it the State of Alaska Annual Placer Mining Application (APMA). In 1984, the three state resource agencies revised the agreement for cooperative review and enforcement efforts, and a list of priority streams was added to identify areas where the agencies would concentrate field programs to maximize use of limited funding and personnel. This agreement was updated in 1985 and 1986 to include enforcement procedures and priorities.
The ADNR, ADEC, and ADF&G identified three drainages (Peters Creek, George River, and the Chatanika River) as "special priority" systems in the 1986 State of Alaska Interagency Placer Mining Guidelines. This agreement provided a basis for intensified efforts on the part of the three state resource agencies to work with miners on these systems with the objective of achieving a high degree of compliance with applicable laws and regulations. These three systems were selected because of their high resource values and public use. The Chatanika River, excluding Goldstream Creek, was one of these three streams.
All APMArs submitted for mining in the "special priority" drainages were reviewed by the state resource agencies. The objective of this plan-review process was to develop, in cooperation with individual miners, mining plans designed to substantiall-y improve the water quality of mine effluents in order to provide for the proper protection of fish and wildlife and their habitat. A combination of improved mining operations, increased field monitoring by resource agencies, a cooperative attitude among the miners and the resource agencies, and ongoing enforcement actions improved Chatanika River water quality in 1986.
This report focuses on the Upper Chatanika River drainage. Multiple-use conflicts and the actions taken by the resource agencies in cooperation with miners are presented. Descriptions of each mining operation and the mining plans developed and implemented are included in Appendix A.

STUDY AREA
Location of the Chatanika River drainage in relation to Fairbanks, Alaska and other maior waterbodies is shown in Figure 1. Mining on the Chatanika River system occurs in three reaches of the river: (I) the Upper Chatanika from Long Creek to the headwaters; (2) the Middle Chatanika from Long Creek downstream to Our Creek; and (3) the Lower Chatanika River, including Goldstream Creek and tributaries. Placer-mining operations in the Upper Chatanika drainage from 1980 through 1986 have been conducted mainly on Faith Creek and Faith Creek tributaries (Figure 2).
Prior to 1980, the Chatanika River ranked as the second most popular sportfishing stream in interior Alaska. Anglers expended 10,835 user-days in 1978. By 1981, the number of angler user-days decreased to 4,691. Fish species utilized by anglers in the Chatanika River include Arctic grayling, chinook and chum salmon, sheefish, northern pike, burbot, and whitefish (Mills 1979, 1980, 1981, 1982, 1983, 1984, and 1985). Arctic grayling, whitefish, and salmon are the main species fished in the Upper and Middle Chatanika River with northern pike, sheefish, and burbot comprising the main fish species sought in the Lower Chatanika River.
More than 100 hunters use the Chatanika River drainage each year to hunt moose, black bear, ducks, geese, and small game. Hunters harvested approximately 40 moose in the Chatanika River drainage above Goldstream Creek in 1985 (Haggstrom 1987). In addition, 20 people were known to have trapped the Chatanika drainage during the 1984-85 season, and other trappers likely used the area also (Melchior 1987).
Approximately 150 river-front recreational, remote cabin, and homesite lots are privately owned on the Chatanika River between Faith and Goldstream Creeks (Buist 1986). Many of the sites with dwellings rely on the Chatanika River for domestic water. In addition to these sites there are three state-managed and one Department of Interior (DOI) -managed recreation sites on the Chatanika River. The state sites are located near 39-Mile Steese Highway (one) and 11-Mile Elliott Highway (two). The DO1 camping facility is located near 61-Mile Steese Highway.


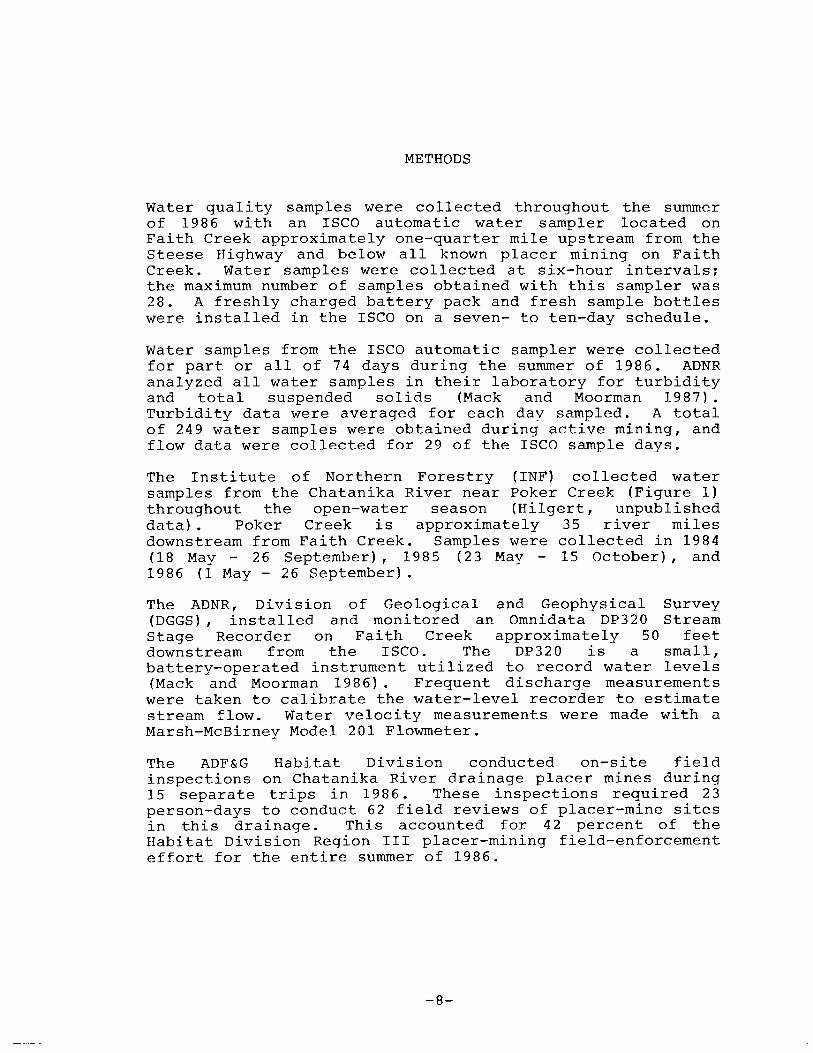
METHODS
Water quality samples were collected throughout the summer of 1986 with an ISCO automatic water sampler located on Faith Creek approximately one-quarter mile upstream from the Steese Highway and below all known placer mining on Faith Creek. Water samples were collected at six-hour intervals; the maximum number of samples obtained with this sampler was 28. A freshly charged battery pack and fresh sample bottles were installed in the ISCO on a seven- to ten-day schedule.
Water samples from the ISCO automatic sampler were collected for part. or all of 74 days during the summer of 1986. ADNR analyzed all water samples in their laboratory for turbidity and total suspended solids (Mack and Moorman 1987). Turbidity data were averaged for each day sampled. A total of 249 water samples were obtained during active mining, and flow data were collected for 29 of the ISCO sample days.
The Institute of Northern Forestry (INF) collected water samples from the Chatanika River near Poker Creek (Figure I) throughout the open-water season (Hilgert, unpublished data). Poker Creek is approximately 35 river miles downstream from Faith Creek. Samples were collected in 1984 (18 May - 26 September), 1985 (23 May - 15 October), and 1986 (1 May - 26 September).
The ADNR, Division of Geological and Geophysical Survey (DGGS) , installed and monitored an Omnidata DP320 Stream Stage Recorder on Faith Creek approximately 50 feet downstream from the ISCO. The DP320 is a small, battery-operated instrument utilized to record water levels (Mack and Moorman 1986). Frequent discharge measurements were taken to calibrate the water-level recorder to estimate stream flow. Water velocity measurements were made with a Marsh-McBirney Model 201 Flowmeter.
The ADF&G Habitat Division conducted on-site field inspections on Chatanika River drainage placer mines during 15 separate trips in 1986. These inspections required 23 person-days to conduct 62 field reviews of placer-mine sites in this drainage. This accounted for 42 percent of the Habitat Division Region I11 placer-mining field-enforcement effort for the entire summer of 1986.

PLACER MINING, UPPER CHATANIKA RIVER DRAINAGE, 1986
The number of placer-mining operations in the upper part of the Chatanika River drainage increased from two in 1980 to eight in 1986 (Figure 3). In 1986 there were four large-scale (more than 200 cyd) and four small-scale (less than 200 cyd) placer gold operations on the Upper Chatanika River (Figure 4). All four large-scale mines and one small-scale mine were located in the Faith Creek drainage.
Based on APMA information and agency observations, the four large mines processed 4,500 cyd when all four operated to capacity, and their combined water use was about 6,000 gallons per minute (gpm). The four small mines together processed up to 63 cyd and used about 1,000 gpm.
Miners submitting plans that did not initially provide sufficient information to show proper protection of aquatic habitat were requested to provide additional information concerning their mining proposals. Five Upper Chatanika River miners made office appointments with agency representatives for consultation and design assistance. These miners and state agency representatives worked cooperatively over a two- to three-week period to develop mining plans that would ensure adequate protection of aquatic habitat. These plans included a number of best mining practices such as adequate water-treatment facilities, reduced water-use rates, surface-water bypass channels, and non-point source sediment control. Plans for each mine site varied and reflected site-specific conditions of the mine area as well as the equipment available to each miner.
In response to aqency requests, four miners provided sufficient additional information for plan approval without office consultation. One miner on the Upper Chatanika did not submit an APMA. Details of each operation are presented in Appendix A (e.g., Mine Site A, B, and C).
Agencies reviewed all APMA's submitted for placer mining on the Upper Chatanika River. Miners and state agency representatives used the report Best Management Practices For Placer Mining - Reference Manual (Rundquist et al. 1986) to desian and evaluate each minins plan. Up to four office consultitions were made with miners large-scale operations before a mutually acceptable mining plan was developed and permitted. Individual miners and state agency representatives jointly reviewed changes to approved plans in the field when design proposals did not significantly reduce suspended solids reaching the receiving stream. In

Figure 3. Placer Mining Activity Upper Chatanika River Drainage, 1 9 80 - 8 6
YEAR > 200 cyd EZTl * 200 cyd 0 Applied -
No mining

Figure 4. A c t i v e Placer Mining S i t e s o n Upper Chatanika River dra inage i n 1986.
37 m i l o r to
r Active Placer Mining Sites
SCALE 1:250.000
10 MILES I

two specific cases, mining plans were revised in the field in cooperation with state field personnel, and permits were formally amended.
Three major aspects of each mining plan were reviewed in detail with the respective miners. These three factors were: (1) water-use reduction; (2) excess-water control; and (3) wastewater treatment. All Faith Creek miners used material-classification equipment in front of their washplants to reduce the size of the materials sluiced, thereby reducing their water use. Three mines additionally reduced water use by incorporating high-rate (80-90'20) recycling of washwater in their mining operations.
Miners controlled excess surface water by constructing bypass channels or utilizing bypass channels constructed during previous seasons. Four Faith Creek miners consistently used bypass channels during the 1986 season. One miner (Mine Site F) used a bypass at one site and not at another. This miner, located on Deep and Hope creeks, did not submit a placer mining application for the 1986 mining season. The three small-scale operations on tributaries to the Upper Chatanika River either used bypass channels or operated only small suction dredges that did not cause turbidity to reach observable levels in the Chatanika River. All permitted bypass channels were designed to accommodate anticipated stream flows during the mining season; two of the bypasses were in locations known to support fish and were constructed to provide free movement of fish.
Miners and agency representatives discussed control measures for subsurface water during development of mining plans. However, site-specific flow information was not available to develop groundwater-control plans. Groundwater control was conducted on site by trial and error at three mines (Mine Sites A, B, and C) . Two miners successfully controlled the groundwater within one to two weeks of mining start-up and the third miner succeeded after approximately two months. The miner located on Deep Creek left the area after operating only a short period of time. The small-scale operations did not encounter difficulty with groundwater.
Wastewater-treatment facilities were designed to specifically reduce turbidity. Four of the five mines used multiple settling ponds as the primary treatment method to remove suspended solids from mining wastewater. Miners A, B, and D had pre-settling ponds to collect settleable solids which reduced settling-pond maintenance. Miner C filtered wastewater through tailings generated by the operation. Filtering wastewater through the fresh tailings effectively removed most settleable solids prior to wastewater reaching

the recycling pump, reduced settling pond maintenance, and mixed the washwater with groundwater for recycling back to the washplant.
Miner D used oilfield drilling-mud-recovery hydrocyclones to separate the heavier suspended solids from the mininq washwater and three large tanks to collect, hold, and further treat washwater. Water from the tanks was recycled back to the washplant and only a few gpm were lost from the system. This operation discharged no mining water back to Faith Creek since all water lost from the system percolated into the ground within a few feet of the water-treatment plant, which was located more than 100 feet from the active flow of Faith Creek.
Miner A tested flocculants and coagulants at the bottom end of the washwater-treatment system to reduce turbidity. The results of this test are in the final Placer Mining Demonstration Grant Report (Phillips and Pollen 1987) available from the ADEC. Field observations and discussions with Miner A indicate that a combination of flocculants and coagulants may be an effective approach for meeting the Alaska Water Quality Standards for turbidity. The final effluent observed by ADEC and ADF&G during this test appeared clear and was measured by the miner's project manager at less than 5 NTU during 9 of 11 days the test was conducted. This pilot project with flocculants and coagulants was conducted on 80-150 gpm of excess water below a high-rate recycling operation. Only washwater that was not retained for recycle was treated with clarifiers, thus minimizing the quantity of chemicals required for the final treatment of the mining water.
Miner B's perforated spray pipe and gravel filter system succeeded in increasing the retention time of 50-80% of the wastewater. The total of eight to nine settling ponds above and below the filter also increased retention time. These treatment facilities combined with overland discharge through floodplain vegetation appeared to reduce turbidity downstream from this mine. Water samples collected above and below Miner B illustrated the following possibilities: (I) the wastewater-treatment system reduced turbidity; (2) substantial dilution occurred between the upstream and downstream sample sites; and ( 3 ) suspended solids settled out in Faith Creek. Samples collected upstream from Miner B were consistently more turbid than same day samples collected downstream of the discharge point for wastewater from this mining operation.
Miner F did not submit a placer mining application and operated briefly during the summer of 1986 without the

appropriate permits. Miner F also made no attempt to work with the resource agencies in the development of an acceptable mining plan. Two or three small settling ponds were used by Miner F. All ponds used had breaches eroded through the dams (except for a beaver pond located on the lower portion of Deep Creek), and the ponds averaged less than three feet deep. The beaver pond had an intact dam but was nearly full of sediment from past mining activities. Therefore, water was not retained for a sufficient period of time to provide an adequate level of treatment.

RESULTS
Between June 15 and September 30, the time period when active sluicing normally occurs, water-quality data were obtained on Faith Creek for 70 days. During the 1986 mininq season, turbidity in Faith Creek below all mining was 25 NTU or less on 32 (46 percent) of the days sampled (Figure 5). Stream turbidities were between 26 and 50 NTU on 24 sample days (34 percent) , between 51 and 100 NTU on 7 sample days (10 percent) , and greater than 100 NTU on 7 (10 percent) of the 70 days sampled (Figure 5).
In 1986, turbidity levels increased substantially during three recorded high-flow events (peaks occurred on June 24, July 20, and August 21) . In addition, increased turbidity levels occurred for the seven days during 1986 when Miner F was active. Water samples collected below Miner F averaged more than 800 NTU in 1986 (Table 2). In 1983 and 1985, grab samples collected downstream of Miner F's operation averaged over 600 and 1,400 NTU, respectively (Table 2). Appropriate legal action was taken against Miner F by the State of Alaska in 1984 and 1985.
If average daily turbidities for the three recorded high- flow events and the seven days of Miner F's activities (a total of 12 days during the summer of 1986) are deleted from the data set, Faith Creek averaged 25 NTU for the entire mining season. A turbidity level of 25 NTU in lower Faith Creek would result in less than a five to seven NTU increase in turbidity of the Chatanika River six miles below Faith Creek because of an approximate threefold dilution from McManus Creek, Sourdough Creek and several unnamed tributaries. Background turbidity levels in Sourdough and McManus creeks and the unnamed tributaries generally are less than 1 NTU under normal flow conditions.
Data collected by Hilgert on the Middle Chatanika River between June 15 and September 30 of each year between 1984 and 1986 were averaged on a daily basis and tabulated based on selected turbidity ranges (Figure 6 ) . In 1986, the average turbidity in the Middle Chatanika River drainage was less than 2.5 NTU on 70 percent of the (65 of 93) sample days. In 1984 and 1985, the percent of sample days with an average turbidity less than 2.5 NTU was 40 percent (34 of 85) and 10 percent (9 of 86), respectively. Average turbidity values of less than 5 NTU in the Middle Chatanika River were recorded on 78 percent (66 to 85) (1984), 48 percent (41 of 86) (1985), and 87 percent (81 of 93) (1986) of the sample days. Average turbidity values of less than 25 NTU in the Middle Chatanika River were recorded on more

Fig. 5. ADF&G Sample Days Within Selected Turbidity Ranges, Faith Creek
6-10 11-25 26-50 51-100
Range of Turbidity, NTU

Table 2. Average Turbidity (NTU) Based on Grab Samples Collected Downstream from Miner F Located on Deep and Hope Creeks for the Years 1983, 1985, and 1986
Date Turbidity Average Turbidity (NTU) (per/year , NTU) Stream Name
Deep Creek Deep Creek Deep Creek
Deep Creek Deep Creek Deep Creek Deep Creek Deep Creek Deep Creek
Deep Creek Hope Creek Hope Creek Deep Creek Deep Creek Deep Creek
- b~inters and Townsend, 1983 'winters, 1983 C Reeves, 1984 d~c~allister, R. 1985. ADEC. Northern Testing Laboratories e Post, R. 1985. ADF&G. Northern Testing Laboratories f~iller, G. 1985. ADEC. Northern Testing Laboratories g~iller, G. or P. McGee. 1985. ADEC. Northern Testing
Laboratories h~ack, S. 1987 '~c~allister, R. 1986. ADEC. Northern Testing Laboratories j~c~allister , R. 1986. ADEC. Northern Testing Laboratories k~ownsend, A. 1986. ADF&G. Northern Testing Laboratories 'Mccallister , R. 1986. ADEC. Northern Testing Laboratories m~ownsend, A. 1986. ADF&G. Northern Testing Laboratories

Fig. 6. INF Sample Days Within Selected Turbidity Ranges, Chatanika River
w <2.5 2.5-5 6-10 11-25 26-50 51-100 >lo0
Average Turbidity, NTU
EBZB 1984 1985 1986

than 90 percent of all sample days in all three years of data collected by Hilgert. The most notable improvement in water quality occurred in the relative percentage of days when the turbidity levels in the Middle Chatanika River were less than 2.5 and 5 NTU.
Water-quality measurements for the Middle Chatanika River system collected by the INF also were compared for the month of September over the three years of sample records. The whitefish spear fishery on the Chatanika River historically opens on the first of September and continues until the river freezes over. Water clarity in the Chatanika River during this time period directly affects the ability of fishermen to observe and capture whitefish. Average daily turbidities in the Middle Chatanika River were reduced substantially in 1 9 8 6 compared to 1 9 8 5 and 1 9 8 4 levels (Figure 7 ) , and the number of whitefish taken during the 1 9 8 6 fall fishery was estimated at more than 20,000 (Clark 1 9 8 6 ) .

Fig. 7 . Turbidity in Chatanika River at Poker Creek. Data From INF.
September
1985

DISCUSSION
The background, natural turbidity of the Upper and Middle Chatanika River during normal flow is less than 1 NTU. Discharge of placer-mining wastewater elevated the turbidity of the Middle Chatanika River to more than 100 NTU over 30 miles downstream in 1985 (ADEC, 1986). In 1984, a series of 28 water samples was collected from the Chatanika River during a four-day period, and the mean turbidity during that period was 74 NTU with a range from 0.7 to 310 NTU (Hock and Toland 1985). Six of the 28 samples (21%), measured more than 100 NTU. Only one water sample from the Middle and Upper Chatanika River in 1986 exceeded 100 NTU (Hilgert, INF unpublished data), and that sample was collected on June 2 before active sluicing had bequn. Increased levels of suspended solids have been documented during breakup in several systems where placer mining has occurred (Townsend 1987). Elevated levels of solids are most likely associated with resuspension of sediments due to increased discharge during the spring breakup period.
Additional analyses of water-quality data collected from the Middle Chatanika River demonstrate the success of the cooperative effort of the miners and state agencies in reducing suspended solids in the Chatanika River from placer mining. Water samples collected on near Poker Creek on the Chatanika River during the normal mining season (June 15 - September 30) showed that the average turbidity was less than 2.5 NTU during 40 percent of the 1984 sample days, 10 percent of the 1985 sample days, and 70 percent of the 1986 sample days. Average turbidity values were less than 5 NTU in the Middle Chatanika River during 78 percent (1984), 48 percent (1985), and 87 percent (1986) of the sample days. These samples clearly show that the goal of reducing turbidity (suspended solids) in the Upper and Middle Chatanika River was achieved in 1986.
The increased turbidity in the Chatanika River from placer mining interfered with, or prevented, fish-survey projects during 1980, 1983, 1984, and 1985 (Barton 1984, Holmes 1986, Kramer 1981) . IJser surveys (Mills 1979, 1980, 1981, 1982, 1983, 1984, 1985, and 1986) and creel census information (Clark 1986) for 1977 to 1986 suggest that many fishers may have avoided participation in the popular fall whitefish sport fishery during years when turbidity levels were elevated. This fishery takes place in the Middle Chatanika River during September and early October.
In 1986, when the turbidity levels did not exceed 5 NTU during the whitefish sport fishery, 20,000 or more whitefish

were harvested, a 28 percent increase over the next highest harvest and an 84 percent increase over the poorest whitefish season. However, the whitefish harvest increased each of the last three years, and the relative increase in the number of days fished must also be considered to realize the actual benefits of the cleaner water.
The average number of whitefish harvested per day fished was calculated. An increase in fishing success accompanied the increase in numbers of days fished. In 1983, only 0.5 whitefish were harvested for each day fished. This harvest rate increased to 1 .I in 1984, 1.4 in 1985, and 1.6 fish in 1986. The 1.6 estimate for 1986 is conservative since this harvest number is based on the low end of an estimated 20,000 to 40,000 whitefish taken from the Chatanika (Clark 1986). Typically, preliminary estimates encompass a wide range, and as the data analysis is completed, a harvest rate toward the middle of the original estimate could be expected. Therefore, the number of whitefish harvested per day fished in 1986 probably was between 2 and 2.25 or nearly double the 1985 catch rate.
The combined efforts of seven placer-mine operators and the three cooperating state agencies reduced the daily amount of suspended solids reaching the Chatanika River from placer mines. These efforts included developing good mining plans, which included best mining practices for surface-water and groundwater control; classifying material and reducing water use; high-rate recycling of mining washwater; and initiating a pilot project which tested several flocculants and coagulants. Another large factor contributing to the overall reduction of suspended solids in Faith Creek and the Chatanika River was the greatly reduced amount of time that Miner F was active in the Faith Creek drainage. This eliminated up to 90 days of 1000 gpm effluent with turbidity values which typically ranged from 100 to more than 3000 NTU . The data clearly show that a positive and cooperative attitude on the part of both the miners and the state resource agencies coupled with a firm enforcement policy, will result in better downstream water quality. The success of the miners in carrying out good mining practices will result in fewer suspended solids being carried away from their mines. Finally, the 1986 mining season on the Upper Chatanika River and the success of the whitefish fishermen on the Middle Chatanika River demonstrate that multiple use of a watercourse is not a myth.
We, the state resource agencies who worked with the Upper Chatanika River placer miners, believe that the 1986

demonstration of positive attitudes, implementation of best mining practices, technical assistance, and field monitoring (both agency and self -monitoring by the individual miners) is the first step to ensuring the continuation of an industry and the maintenance of healthy fisheries populations within the same drainages.

REFERENCES
ADEC. 1986. Suspended solids and turbidity in drainages subjected to impacts from placer mines including an analysis of the method detection limit for settleable solids - Interior Alaska (August 5-16, 1985). Environmental Quality Monitoring and Laboratory Operations, ADEC, Juneau. 33 pp.
Barton, L.H. 1984. A catalog of Yukon River salmon spawning escapement surveys. ADF&G Technical Data Report No. 121, Fairbanks. 472 pp.
Rrossia, J. and J. Reeves. 1982. Alaska Department of Environmental Conservation northern region's activity report for 1981 placer mining season. ADEC, Fairbanks. 64 PP.
Buist, P.R. 1986. Personal Communication, Natural Resource Officer, Division of Land and Water Management, ADNR, Fairbanks.
Clark, J. 1986. Personal Communication, Regional Supervisor, Sport Fish Division, ADF&G, Fairbanks.
Haggstrom, D.A. 1987. Personal Communication, Game Biologist, Game Division, ADF&G, Fairbanks.
Hock, J.D. and D. Toland. 1985. Suspended solids and turbidity in drainages subjected to impacts from placer mines - Interior Alaska (August 7-16, 1984). Environmental Quality Monitoring and Laboratory Operations, ADEC, Juneau. 22 pp.
Holmes, R.A. 1986. Chatanika River water quality. (Memorandum to A. Townsend dated December 1, 1986) . Sport Fish Biologist, Sport Fish Division, ADF&G, Fairbanks. 1 p.
Kramer, M.J. 1981. Evaluation of interior Alaskan waters and sport fish with emphasis on managed waters - Fairbanks district. ADF&G, Federal Aid in Fish Restoration, Annual Performance Report, 1.980-1981, Vol. 22, Study G-111-H. 83 pp.
Mack, S.F., and M. Moorman. 1986. Hydrologic and water-quality investigations related to the occurrence of placer mining in interior Alaska. Summers 1984-1985. Public-data file 86-16. ADNR, Fairbanks.

Mack, S.F., and M. Moorman. 1987. Hydrologic and water-quality investigations related to the occurrence of placer mining in interior Alaska. Summer 1986. Public-data file 87-10. ADNR, Fairbanks.
Melchior, H.R. 1987. Personal Communication, Game Biologist, Game Division, ADF&G, Fairbanks.
Mills, M.J. 1979. Statewide harvest study. ADF&G, Federal Aid in Fish Restoration, Annual Performance Report, 1978-1979, Vol. 20, Study SW-I-A. 112 pp.
. 1980. Statewide harvest study. ADF&G, Federal Aid in Fish Restoration, Annual Performance Report, 1979-1980, Vol. 21, Study SW-I-A. 65 pp.
. 1981. Statewide harvest study. ADF&G, Federal Aid in Fish Restoration, Annual Performance Report, 1980-1981, Vol. 22, Study SW-I-A. 107 pp.
. 1982. Statewide harvest study. ADF&G, Federal Aid in Fish Restoration, Annual Performance Report, 1981-1982, Vol. 23, Study SW-I-A. 115 pp.
. 1983. Statewide harvest study. ADF&G, Federal Aid in Fish Restoration, Annual Performance Report, 1982-1983, Vol. 24, Study SW-I-A. 118 pp.
. 1984. Statewide harvest study. ADF&G, Federal Aid in Fish Restoration, Annual Performance Report, 1983-1984, Vol. 25, Study SW-I-A. 122 pp.
. 1985. Statewide harvest study. ADF&G, Federal Aid in Fish Restoration, Annual Performance Report, 1984-1985, Vol. 26, Study SW-I-A. 135 pp.
. 1986. Statewide harvest study. ADF&G, Federal Aid in Fish Restoration, Annual Performance Report, 1985-1986, Vol. 27, Study SW-I-A. 137 pp.
Phillips, N.L., and M.R. Pollen. 1987. Placer mining demonstration grant #I008 - Final Report. Esperanza Resources Company, Inc. ADEC Placer Mining Grant Program. 81 pp.
Reeves, J. 1984. Enforcement summary for 83 field season. (Memorandum to D. Lowery dated January 6, 1984). Environmental Field Officer, ADEC, Fairbanks. 11 pp.
Rundquist, L.A., N.E. Bradley, J.E. Baldrige, P.D. Hampton, T.R. Jennings, and M.R. Joyce. 1986. Best management

practices for placer mining - reference manual. Entrix, Inc. Prepared for ADF&G, Juneau. 209 pp.
State of Alaska. 1986. Interagency placer mining guidelines. ADEC, ADNR, and ADF&G. 8 pp.
Townsend, A. 1987. Breakup water samples. (Memorandum to A1 Ott dated May 20, 1987). Habitat Biologist, ADF&G, Fairbanks. 2 pp.
Winters, J. 1983. Chatanika River trip report - August 17, 1983. (Memorandum to Files dated August 18, 1983). Habitat Biologist, ADF&G, Fairbanks. 2 pp.
Winters, J. and A. H. Townsend. 1983. Field trip to the Chatanika River, July 22, 1983. (Memorandum to Files dated August 10, 1983). Habitat Biologists, ADF&G, Fairbanks. 2 pp.

APPENDIX A
This appendix contains a description of each mine site located in the Upper Chatanika River drainage.
Mine Site A
Miner A operated on two separate sites during 1 9 8 6 , the first half of the season on Homestake Creek, a tributary to Faith Creek, and the second half on Faith Creek. This mine processed material through the washplant during all or part of 8 0 days and washed up to 1 6 0 0 cyd using 1 5 0 0 gpm water. The washplant was equipped with a vibrating screen to classify pay material for water-use reduction. Three to ten settling ponds were used throughout the season and 8 0 to 9 0 percent of the washwater was recycled from the third settling pond. The first two settling ponds were cleaned out as needed to prevent sediment build-up in the recycling pond. A channel was excavated along one side of the Homestake Creek site to collect and bypass excess surface water around the mine and settling ponds. An additional channel was excavated to bedrock across the upstream end of the mine and parallel to the bypass channel to control excess groundwater on the Faith Creek site.
Mine Site B
Miner B, located on Faith Creek, processed up to 1 2 0 0 cyd during all or part of 6 8 days using 1 4 0 0 gpm water, and used a gravel filtration system, settling ponds, and a final overland discharge to treat mining effluent. The gravel filter was constructed from old tailings and was approximately 3 0 0 feet long, 1 0 0 feet wide and 1 0 feet high. A perforated, T-shaped pipe was installed on the filter and mining water was pumped onto the filter from the third settling pond. This water percolated through the filter and was directed to five additional settling ponds before flowing approximately to t mile across a vegetated floodplain to Faith Creek. Excess surface water was bypassed around the mine site and water treatment facil- ities. Miner B also used a vibrating screen to classify material before sluicing.
Mine Site C
Miner C, also located on Faith Creek, used a trommel to classify material prior to sluicing. This miner processed 5 0 0 to 8 0 0 cyd using about 1 0 0 0 qpm water for all or part of 45 days. All excess surface water was directed around the mine site with a bypass channel. Groundwater was collected

in channels excavated along the outside edges of the mine site. Only groundwater was used for makeup water at this mine. At this site, mining cuts were approximately 30 feet wide, 4 0 0 to 6 0 0 feet long, and 1 0 feet deep, and mining proceeded from downstream to upstream on each cut. The tailings and washwater were discharged from the washplant to the previous mine cut that provided continuous filtering of the washwater. The filtered water was recycled to the washplant and excess groundwater and mining water were collected in an excavated channel and directed to a series of five small settling ponds. The final discharge water was filtered through a gravel berm, approximately 1 0 feet wide, at about 200 gpm.
Mine Site D
Miner D, also located on Faith Creek, was capable of processing up to 1 5 0 to 200 cyd using 6 0 0 gpm water. The number of days that this operation actually processed material is not known and no sluicing was observed. This operation was set up offstream with an excavated pit to collect groundwater for the washplant. A series of three large tanks were used to treat mining water after it had been pumped through a system of 20 to 2 4 small hydrocyclones. According to the mine operator, approximately 20 to 40 gpm of water was lost from the system during washplant operation. The size of the area excavated and the amount of fresh tailings present verified this operator's statement that most of the season had been spent testing and fine-tuning the system.
Mine Site E
Miner E processed 2 to 5 cyd on Caribou Creek using 5 0 gpm water, hand tools, and a small suction dredge.
Mine Site F
Miner F operated briefly on two separate tributaries to Faith Creek, 3 to 4 days on Hope Creek and 3 to 4 days on Deep Creek. On a previous APMA this operator applied for permits to process 9 0 0 cyd using 1 0 0 0 gpm water with the same basic equipment observed on site this season. On Hope Creek, Miner F used an existing bypass channel for excess surface water control. Two small settling ponds were constructed in an abandoned mining cut to treat mining effluent. The washplant was equipped with a vibrating screen and washwater was pumped from the bypass channel for sluicing. On Deep Creek this miner had no bypass channel and the entire flow of the creek passed through an old

s e t t l i n g pond and two beaver ponds p r i o r t o e n t e r i n g F a i t h Creek.
Mine S i t e G
Miner G used a smal l s u c t i o n dredge and a rubber t i r e d garden t r a c t o r on F l a t Creek t o p rocess 8 cyd wi th 550 gpm water .
Mine S i t e H
Miner H I l o c a t e d on Sourdough Creek, processed up t o 30 cyd w i t h a s u c t i o n dredge and hand-fed s l u i c e box. Water u se f o r t h i s ope ra t ion was 4 0 0 gpm.
Mine S i t e I
Miner I used a s u c t i o n dredge and a smal l backhoe t o p rocess 2 0 cyd wi th 4 0 0 gpm water on an unnamed t r i b u t a r y t o t h e Upper Chatanika River .
Note: There was one a d d i t i o n a l miner t h a t d i d no t o p e r a t e o r on ly conducted hand t o o l assessment a c t i v i t i e s .