Embed Size (px)
Citation preview
2013
International Summer Water Resources Research School
Dept. of Water Resources Engineering, Lund University
Treatment of dye wastewater with ozone solution
By
Hanna Palm Johansson
Treatment of dye Hanna Palm Johansson wastewater with ozone solution 2013-07-20
Lingfeng Summer Research School, 2013 1
Abstract The textile industry annually produces large amounts of waste water which contains several different
compounds from the production. There are several ways to treat waste water from textile factories in
order to remove the remains of the dyes. The most common ways are physical, chemical and biological
treatment. One efficient way that does not contribute to any secondary pollution has improved to be
ozone oxidation. This project will focus on making a small-scale equipment and optimizing some
parameters in the treatment process of the waste water. The parameters to be determined are the pH,
oxygen flow rate and the mixing ratio between waste water and ozone solution. An experimental setup
consisting of an oxygen source, ozone generator, tubes, pumps and a spectrophotometer are to be used.
The results showed that the most efficient pH was the original pH of the waste water, 8.43. The best flow
rate of the oxygen was 1600 mL/min and the most appropriate speed of the pump controlling the ozone
solution was 420 mL/min.
Key words: dye wastewater, oxidation, ozone, decolourization, small-scale equipment

Treatment of dye Hanna Palm Johansson wastewater with ozone solution 2013-07-20
Lingfeng Summer Research School, 2013 2
Contents Abstract ....................................................................................................................................................... 1
1. Introduction ............................................................................................................................................ 3
1.1 Aim ..................................................................................................................................................... 3
2. Background ............................................................................................................................................. 3
2.1 Dye wastewater .................................................................................................................................. 3
2.2 Oxidation ............................................................................................................................................ 4
2.3 Ozone ................................................................................................................................................. 4
2.4 COD ................................................................................................................................................... 5
2.5 Spectrophotometer.............................................................................................................................. 5
3. Method and materials ............................................................................................................................ 5
3.1 COD analysis ...................................................................................................................................... 6
4. Result ....................................................................................................................................................... 6
4.1. Effect of pH on treatment .................................................................................................................. 7
4.2 Effect of oxygen flow rate on treatment ............................................................................................. 7
4.3 Effect of mixing ratio on treatment .................................................................................................... 8
4.4. Result of COD analysis ................................................................................................................... 10
5. Discussion .............................................................................................................................................. 10
5.2 Effect of oxygen flow rate on treatment ........................................................................................... 10
5.3 Effect of mixing ratio on treatment .................................................................................................. 10
5.4 COD ................................................................................................................................................. 11
5.5 Limitations ....................................................................................................................................... 11
5.6 Sources of error ................................................................................................................................ 12
5.7 Improvements ................................................................................................................................... 12
5.8 Conclusion ........................................................................................................................................ 12
6. Acknowledgement ................................................................................................................................ 12
7. References ............................................................................................................................................. 13
8. Appendix ............................................................................................................................................... 13
8.1. Effect of pH on treatment ................................................................................................................ 13
8.2. Effect of oxygen flow rate on treatment .......................................................................................... 14
8.3. Effect of mixing ratio on treatment ................................................................................................. 14
Treatment of dye Hanna Palm Johansson wastewater with ozone solution 2013-07-20
Lingfeng Summer Research School, 2013 3
1. Introduction
The textile industry in China is the largest in the world and it uses enormous amounts of water for
bleaching, sizing, desizing, mercerizing and dyeing. Around 0.2-0.5 m3 water is required for every kilo
finished textile goods. The textile industry as well as many other industries like pharmaceutical, food and
paper use over 30 000 different kinds of dyes with 8 000 different chemical structures. The chemicals are
used to treat the products in many different ways and are very often released in the waste water (D.
Glasser, 2010)
The dye residue from the textile industries results in large amounts of dye wastewater that is spread in
streams and whole rivers can be found to be completely coloured. Textile wastewater is considered to be
one of the industrial wastewaters that is most difficult to treat due to the components being hardly
biodegradable (T.Y. Chen, 2009). The dye wastewater from the textile industries is characterized by deep
colour, high chemical oxygen demand (COD) and a pH varying between 2 and 12 (LIU Jia-le, 2007). The
water also has a high concentration of organic carbon (Jiangning Wu, 1998). Chemical reagents and
biological methods have been used for a long time to treat the waste water, though it has resulted in
further pollution. A more efficient way to handle dye wastewater is to use ozone. Thanks to its strong
oxidation properties, ozone has approved to be appropriate when treating waste water. The use of ozone
in wastewater treatment is a relatively environmentally friendly way to deal with the waste water (D.
Glasser, 2010).
In this experiment ozone is used to oxidize dye wastewater from the textile industry in order to treat it.
Synthetic waste water will be used as well as real waste water from a textile industry. Different
parameters, such as pH, oxygen flow rate and the mixing ration between oxygen solution and dye waste
water, are to be determined in order to optimize the oxidation process.
1.1 Aim
The purpose with this project is to determine different parameters in order to optimize the process of
treating dye wastewater. The parameters that will be analyzed are the flow rate of oxygen, mixing ratio
between ozone solution and dye water and finally the pH-value of the mixed solution.
2. Background 2.1 Dye wastewater
Waste water from the textile industry is characterized by the dye remains in the water. The dyes affect the
transparency of the water and often contain toxic and carcinogenic compounds making them harmful to
the environment (Jiangning Wu, 2008). Due to incomplete dye fixation on fibres 5 – 80 % of the initial
dye can be found in the waste water (Arlindo C. Gomesa, 2010). When dyeing cotton so called reactive
dyes are commonly used. Usually 30 % of the dye remains in the waste water when using this kind of
dye. Dyes were intentionally designed to resist degradation and how they affected the environment was
not considered to be very important. Biological treatment has earlier been used to treat dye wastewater.
These methods consider the degradation compounds but are ineffective in removing the colour (Jiangning
Wu, 2008). The dyes used in the textile industry are highly structured molecules with two key
components, cromophore and the functional group. Cromophore constitutes the colours and the functional
group bonds the dye to the textile fibre (Arlindo C. Gomesa, 2010). The composition of dye
chromophores is characterized by double bonds between carbon and nitrogen and aromatic and
heterocyclic rings containing oxygen, nitrogen and sulphur. Those rings can absorb UV light at different
wavelengths resulting in the characteristic colours of waste water from textile industries (LIU Jia-le,
2007). The amount of dyes used only in the textile industry is about 10 000 and every year 7105 tons of
dyes are used. So called azo dyes are the most common and stands for over 50 % of the dyes used. Azo
Treatment of dye Hanna Palm Johansson wastewater with ozone solution 2013-07-20
Lingfeng Summer Research School, 2013 4
dyes are chemical stable and are carcinogenic. Most of them are not biodegradable and biological
treatment has proved not to be efficient enough in order to treat them (Arlindo C. Gomesa, 2010).
Regarding the structure of the dyes
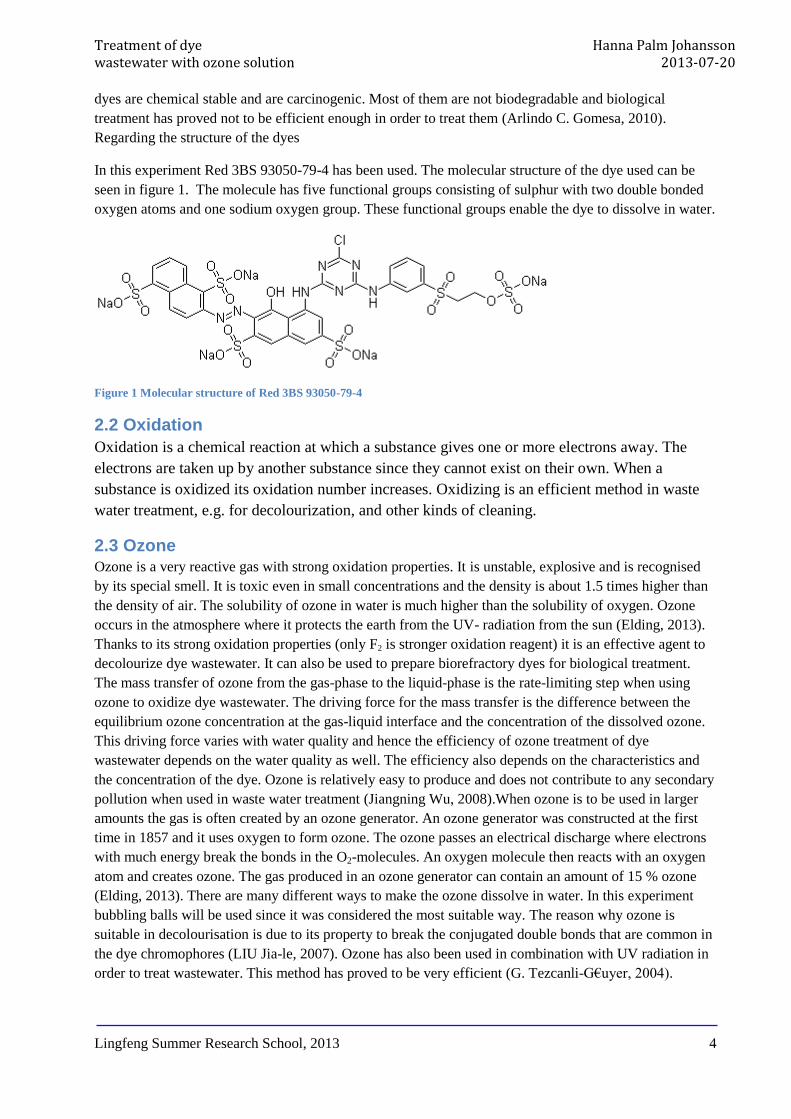
In this experiment Red 3BS 93050-79-4 has been used. The molecular structure of the dye used can be
seen in figure 1. The molecule has five functional groups consisting of sulphur with two double bonded
oxygen atoms and one sodium oxygen group. These functional groups enable the dye to dissolve in water.
Figure 1 Molecular structure of Red 3BS 93050-79-4
2.2 Oxidation
Oxidation is a chemical reaction at which a substance gives one or more electrons away. The
electrons are taken up by another substance since they cannot exist on their own. When a
substance is oxidized its oxidation number increases. Oxidizing is an efficient method in waste
water treatment, e.g. for decolourization, and other kinds of cleaning.
2.3 Ozone
Ozone is a very reactive gas with strong oxidation properties. It is unstable, explosive and is recognised
by its special smell. It is toxic even in small concentrations and the density is about 1.5 times higher than
the density of air. The solubility of ozone in water is much higher than the solubility of oxygen. Ozone
occurs in the atmosphere where it protects the earth from the UV- radiation from the sun (Elding, 2013).
Thanks to its strong oxidation properties (only F2 is stronger oxidation reagent) it is an effective agent to
decolourize dye wastewater. It can also be used to prepare biorefractory dyes for biological treatment.
The mass transfer of ozone from the gas-phase to the liquid-phase is the rate-limiting step when using
ozone to oxidize dye wastewater. The driving force for the mass transfer is the difference between the
equilibrium ozone concentration at the gas-liquid interface and the concentration of the dissolved ozone.
This driving force varies with water quality and hence the efficiency of ozone treatment of dye
wastewater depends on the water quality as well. The efficiency also depends on the characteristics and
the concentration of the dye. Ozone is relatively easy to produce and does not contribute to any secondary
pollution when used in waste water treatment (Jiangning Wu, 2008).When ozone is to be used in larger
amounts the gas is often created by an ozone generator. An ozone generator was constructed at the first
time in 1857 and it uses oxygen to form ozone. The ozone passes an electrical discharge where electrons
with much energy break the bonds in the O2-molecules. An oxygen molecule then reacts with an oxygen
atom and creates ozone. The gas produced in an ozone generator can contain an amount of 15 % ozone
(Elding, 2013). There are many different ways to make the ozone dissolve in water. In this experiment
bubbling balls will be used since it was considered the most suitable way. The reason why ozone is
suitable in decolourisation is due to its property to break the conjugated double bonds that are common in
the dye chromophores (LIU Jia-le, 2007). Ozone has also been used in combination with UV radiation in
order to treat wastewater. This method has proved to be very efficient (G. Tezcanli-G€uyer, 2004).
Treatment of dye Hanna Palm Johansson wastewater with ozone solution 2013-07-20
Lingfeng Summer Research School, 2013 5
2.4 COD
COD, Chemical Oxygen Demand, is an index of the organic material in a water sample. To decide the
COD of a water sample an oxidation reagent is added making the organic material oxidize. How much
they oxidize depends on which oxidation reagent that is used. The more oxidyzable compounds the
sample contains the higher COD value (Nationalecyklopedin, 2013). To prepare a COD analysis some
chemicals are added to the water sample and then it is heated for two hours. See detailed information in
paragraph 3.1.
2.5 Spectrophotometer
A spectrophotometer is used to measure the absorbance of electromagnetic waves of a solution. It can be
used to determine the composition and the purity of a sample. A low absorbance means that the sample is
clean and with a low concentration of solid compounds. The wavelength of the spectrophotometer
depends on the colour of the sample (Nationalencyklopedin, 2013).
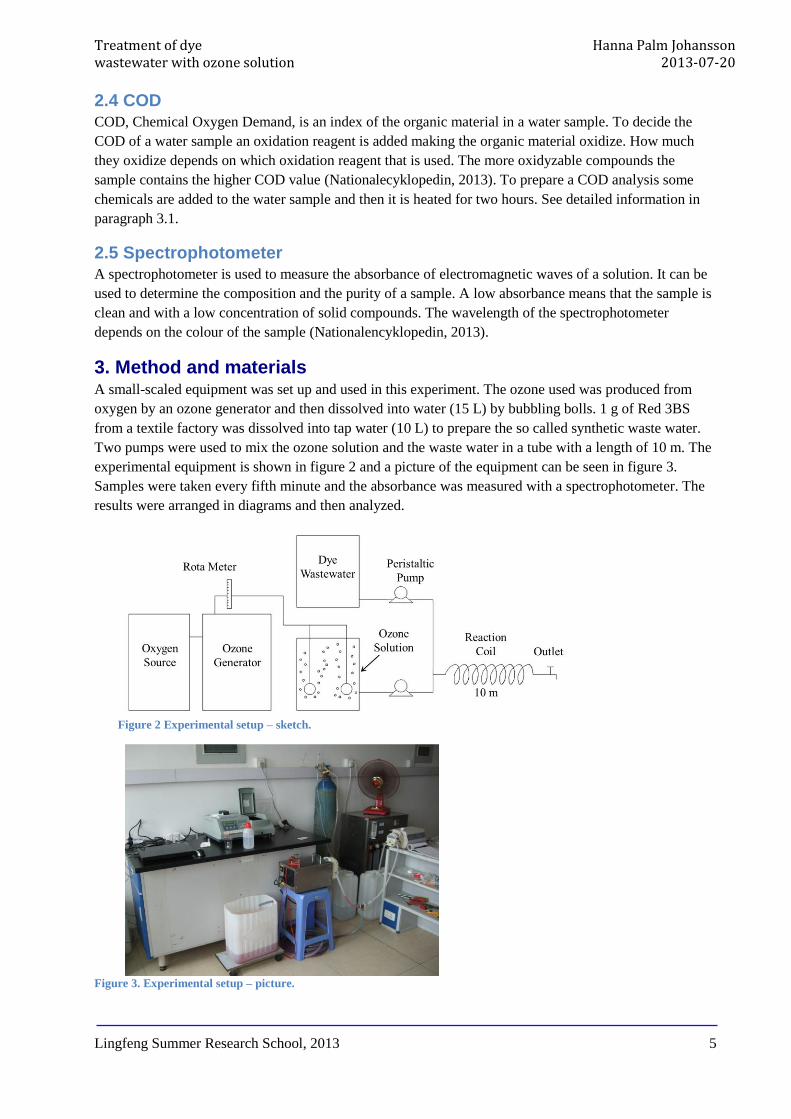
3. Method and materials
A small-scaled equipment was set up and used in this experiment. The ozone used was produced from
oxygen by an ozone generator and then dissolved into water (15 L) by bubbling bolls. 1 g of Red 3BS
from a textile factory was dissolved into tap water (10 L) to prepare the so called synthetic waste water.
Two pumps were used to mix the ozone solution and the waste water in a tube with a length of 10 m. The
experimental equipment is shown in figure 2 and a picture of the equipment can be seen in figure 3.
Samples were taken every fifth minute and the absorbance was measured with a spectrophotometer. The
results were arranged in diagrams and then analyzed.
Figure 3. Experimental setup – picture.
Figure 2 Experimental setup – sketch.
Treatment of dye Hanna Palm Johansson wastewater with ozone solution 2013-07-20
Lingfeng Summer Research School, 2013 6
A smaller amount of real waste water from a textile factory was available for this experiment. It was,
however, not enough to be used through the whole experiment and synthetic waste water was prepared
and used instead. The synthetic waste water was used in every part of the experiment except when it is
mentioned that real waste water was used. When different pH values were needed NaOH was used to
increase the pH in the waste water and HCl was used to decrease the pH.
3.1 COD analysis
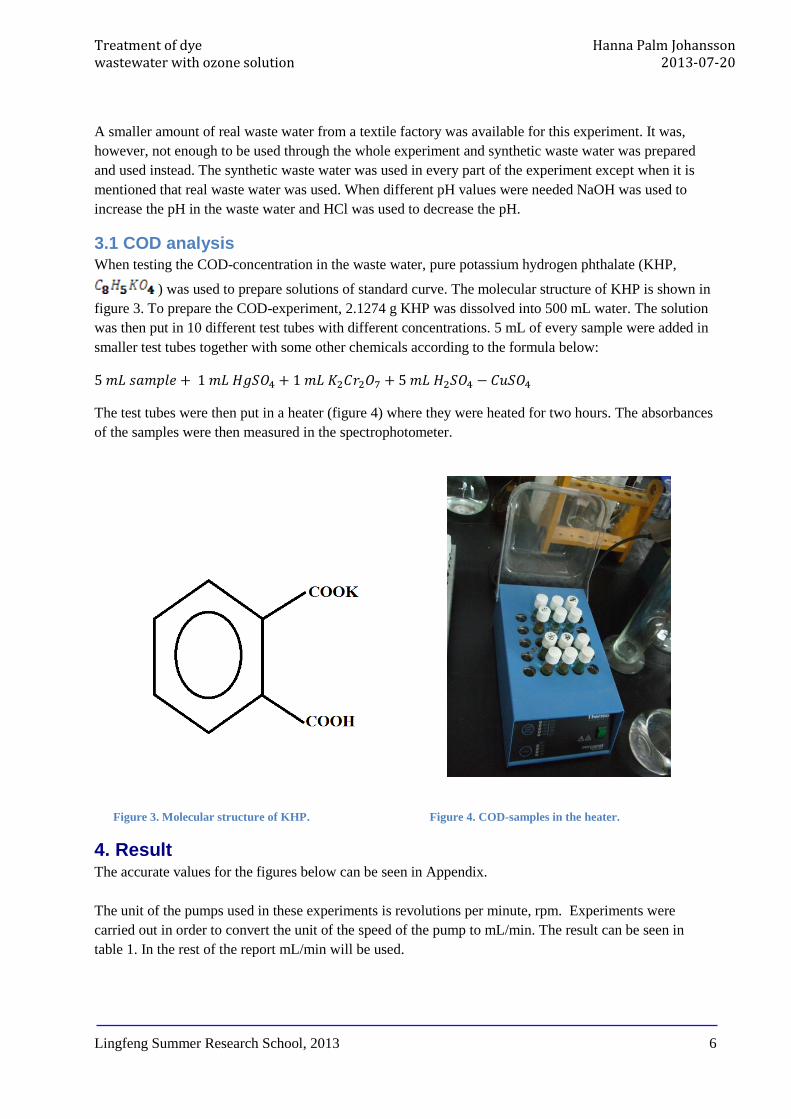
When testing the COD-concentration in the waste water, pure potassium hydrogen phthalate (KHP,
) was used to prepare solutions of standard curve. The molecular structure of KHP is shown in
figure 3. To prepare the COD-experiment, 2.1274 g KHP was dissolved into 500 mL water. The solution
was then put in 10 different test tubes with different concentrations. 5 mL of every sample were added in
smaller test tubes together with some other chemicals according to the formula below:
The test tubes were then put in a heater (figure 4) where they were heated for two hours. The absorbances
of the samples were then measured in the spectrophotometer.
Figure 3. Molecular structure of KHP. Figure 4. COD-samples in the heater.
4. Result The accurate values for the figures below can be seen in Appendix.
The unit of the pumps used in these experiments is revolutions per minute, rpm. Experiments were
carried out in order to convert the unit of the speed of the pump to mL/min. The result can be seen in
table 1. In the rest of the report mL/min will be used.
Treatment of dye Hanna Palm Johansson wastewater with ozone solution 2013-07-20
Lingfeng Summer Research School, 2013 7
Table 1 Convert table for the speed of the pump.
Speed of the pump
rpm mL/min
75 298
100 414
125 529
150 645
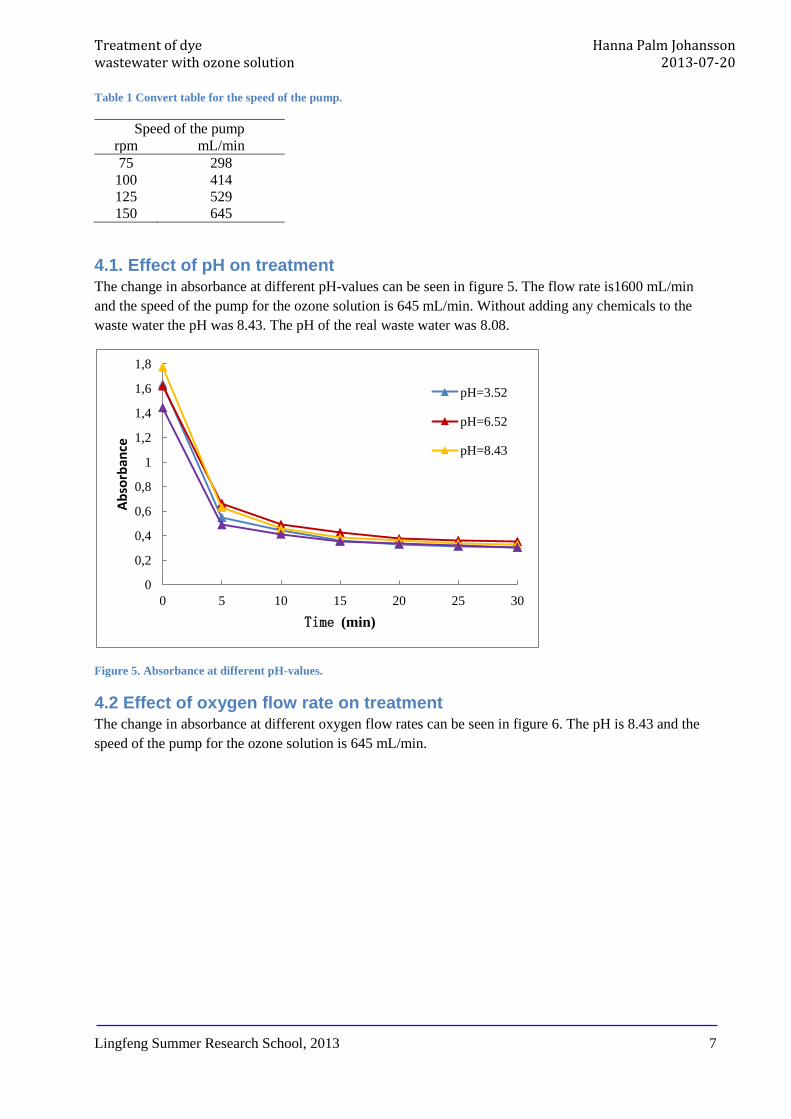
4.1. Effect of pH on treatment
The change in absorbance at different pH-values can be seen in figure 5. The flow rate is1600 mL/min
and the speed of the pump for the ozone solution is 645 mL/min. Without adding any chemicals to the
waste water the pH was 8.43. The pH of the real waste water was 8.08.
Figure 5. Absorbance at different pH-values.
4.2 Effect of oxygen flow rate on treatment The change in absorbance at different oxygen flow rates can be seen in figure 6. The pH is 8.43 and the
speed of the pump for the ozone solution is 645 mL/min.
0
0,2
0,4
0,6
0,8
1
1,2
1,4
1,6
1,8
0 5 10 15 20 25 30
Ab
sorb
ance
Time (min)
pH=3.52
pH=6.52
pH=8.43
Treatment of dye Hanna Palm Johansson wastewater with ozone solution 2013-07-20
Lingfeng Summer Research School, 2013 8
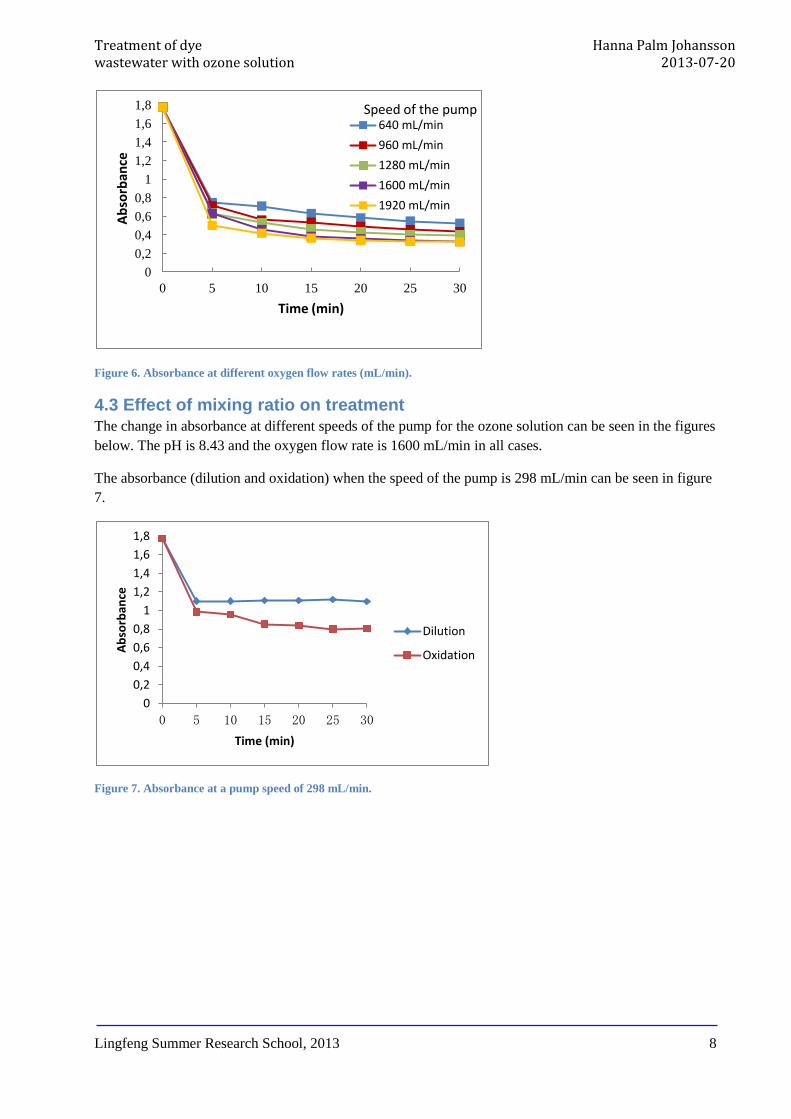
Figure 6. Absorbance at different oxygen flow rates (mL/min).
4.3 Effect of mixing ratio on treatment The change in absorbance at different speeds of the pump for the ozone solution can be seen in the figures
below. The pH is 8.43 and the oxygen flow rate is 1600 mL/min in all cases.
The absorbance (dilution and oxidation) when the speed of the pump is 298 mL/min can be seen in figure
7.
Figure 7. Absorbance at a pump speed of 298 mL/min.
0
0,2
0,4
0,6
0,8
1
1,2
1,4
1,6
1,8
0 5 10 15 20 25 30
Ab
sorb
ance
Time (min)
Speed of the pump 640 mL/min
960 mL/min
1280 mL/min
1600 mL/min
1920 mL/min
0
0,2
0,4
0,6
0,8
1
1,2
1,4
1,6
1,8
0 5 10 15 20 25 30
Ab
sorb
ance
Time (min)
Dilution
Oxidation
Treatment of dye Hanna Palm Johansson wastewater with ozone solution 2013-07-20
Lingfeng Summer Research School, 2013 9
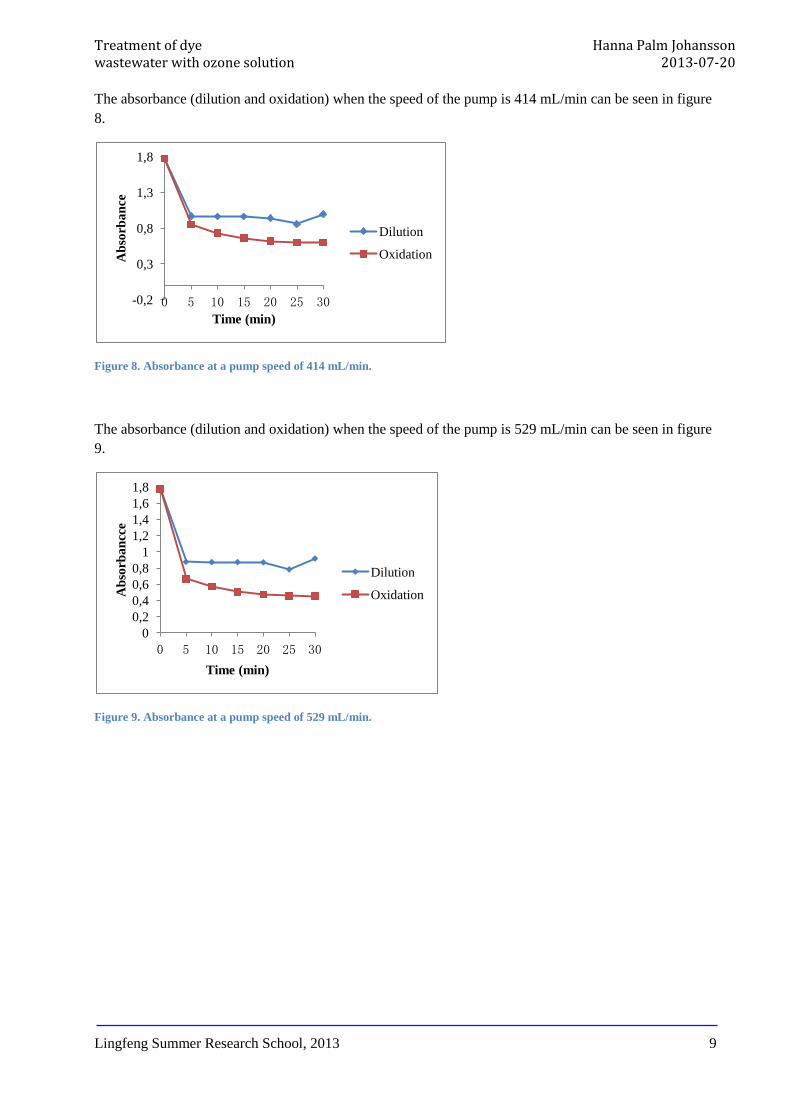
The absorbance (dilution and oxidation) when the speed of the pump is 414 mL/min can be seen in figure
8.
Figure 8. Absorbance at a pump speed of 414 mL/min.
The absorbance (dilution and oxidation) when the speed of the pump is 529 mL/min can be seen in figure
9.
Figure 9. Absorbance at a pump speed of 529 mL/min.
-0,2
0,3
0,8
1,3
1,8
0 5 10 15 20 25 30
Ab
sorb
an
ce
Time (min)
Dilution
Oxidation
0
0,2
0,4
0,6
0,8
1
1,2
1,4
1,6
1,8
0 5 10 15 20 25 30
Ab
sorb
an
cce
Time (min)
Dilution
Oxidation
Treatment of dye Hanna Palm Johansson wastewater with ozone solution 2013-07-20
Lingfeng Summer Research School, 2013 10
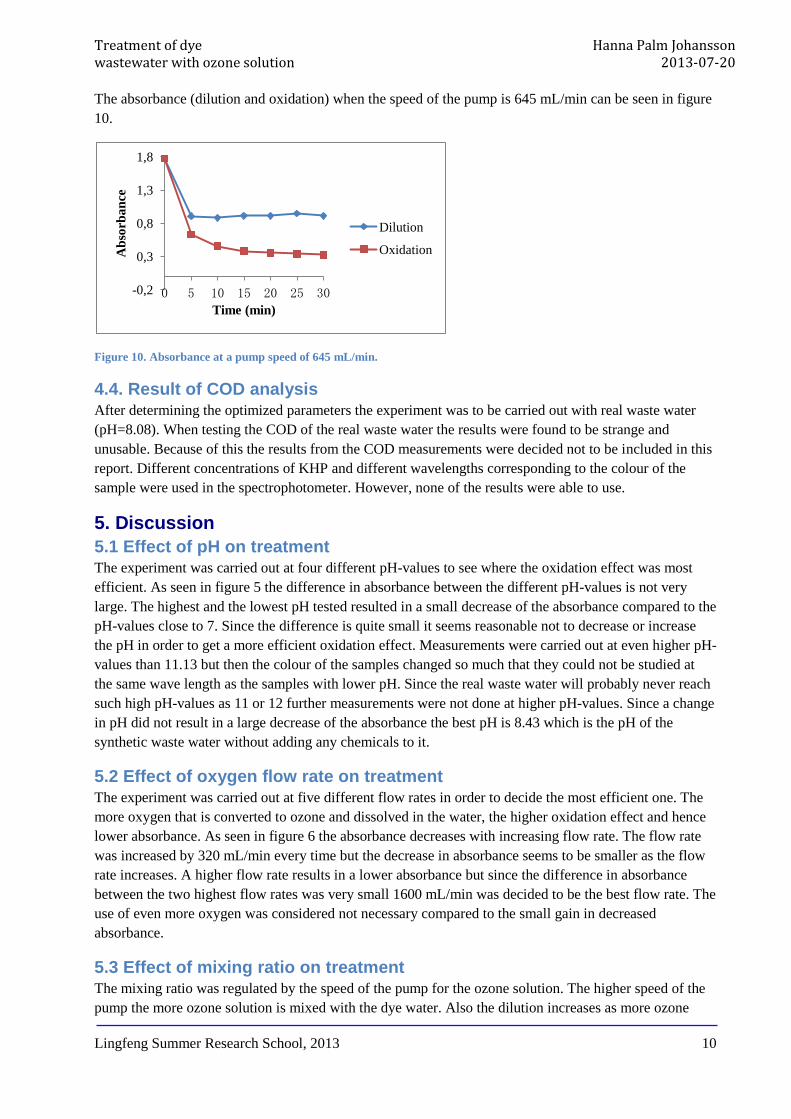
The absorbance (dilution and oxidation) when the speed of the pump is 645 mL/min can be seen in figure
10.
Figure 10. Absorbance at a pump speed of 645 mL/min.
4.4. Result of COD analysis
After determining the optimized parameters the experiment was to be carried out with real waste water
(pH=8.08). When testing the COD of the real waste water the results were found to be strange and
unusable. Because of this the results from the COD measurements were decided not to be included in this
report. Different concentrations of KHP and different wavelengths corresponding to the colour of the
sample were used in the spectrophotometer. However, none of the results were able to use.
5. Discussion
5.1 Effect of pH on treatment The experiment was carried out at four different pH-values to see where the oxidation effect was most
efficient. As seen in figure 5 the difference in absorbance between the different pH-values is not very
large. The highest and the lowest pH tested resulted in a small decrease of the absorbance compared to the
pH-values close to 7. Since the difference is quite small it seems reasonable not to decrease or increase
the pH in order to get a more efficient oxidation effect. Measurements were carried out at even higher pH-
values than 11.13 but then the colour of the samples changed so much that they could not be studied at
the same wave length as the samples with lower pH. Since the real waste water will probably never reach
such high pH-values as 11 or 12 further measurements were not done at higher pH-values. Since a change
in pH did not result in a large decrease of the absorbance the best pH is 8.43 which is the pH of the
synthetic waste water without adding any chemicals to it.
5.2 Effect of oxygen flow rate on treatment
The experiment was carried out at five different flow rates in order to decide the most efficient one. The
more oxygen that is converted to ozone and dissolved in the water, the higher oxidation effect and hence
lower absorbance. As seen in figure 6 the absorbance decreases with increasing flow rate. The flow rate
was increased by 320 mL/min every time but the decrease in absorbance seems to be smaller as the flow
rate increases. A higher flow rate results in a lower absorbance but since the difference in absorbance
between the two highest flow rates was very small 1600 mL/min was decided to be the best flow rate. The
use of even more oxygen was considered not necessary compared to the small gain in decreased
absorbance.
5.3 Effect of mixing ratio on treatment
The mixing ratio was regulated by the speed of the pump for the ozone solution. The higher speed of the
pump the more ozone solution is mixed with the dye water. Also the dilution increases as more ozone
-0,2
0,3
0,8
1,3
1,8
0 5 10 15 20 25 30
Ab
sorb
an
ce
Time (min)
Dilution
Oxidation
Treatment of dye Hanna Palm Johansson wastewater with ozone solution 2013-07-20
Lingfeng Summer Research School, 2013 11
solution is mixed with the dye water. As seen in figures 7-10 a higher speed of the pump leads to a
stronger oxidation effect which is shown as lower absorbance. Another aspect of the higher speed of the
pump is the amount of water needed in the process. A pump speed of 645 mL/min clearly results in a
stronger oxidation effect but the increased amount of water needed was regarded to be too large. Taking
both the oxidation effect and the necessary amount of water into consideration, the pump speed of 414
mL/min was regarded to be the most appropriate one. At every speed of the pump the oxidation gives
lower absorbance than the cases when only dilution was used. During the dilution only a certain amount
of water is mixed with the dye water. This decreases the absorbance since the amount of dye is lower per
volume unit. When the same amount of ozone solution is mixed with the dye water the absorbance
decreases significantly since the dye, to a certain extent, is oxidized. When the speed of the pump is
higher the amount of water mixed with the dye water is larger as well. The decrease in absorbance is
hence due to both oxidation and dilution to a larger extent when the speed of the pump is high. The steep
slope between 0 and 5 minutes in figure 7-10 is due to the dilution with the ozone solution. The first
value, at t=0 min, is the absorbance only for the waste water without any dilution and therefore this value
is large compared to the rest. The largest cause to the decrease in absorption is the dilution while the
oxidation is a smaller part.
As seen in figure 8 and 9 the absorbance at 30 min is higher than the values before. When the two pumps
were turned on, the one controlling the waste water was turned on first. Since the reaction tube was not
very efficient the waste water could have been transported in the tube without mixing with the ozone
solution. This would result in a higher absorbance. Further experiments were carried (without being a part
of the large experiment) when both pumps were turned on at the same time. This resulted in no increase
of the absorbance at the last measurement.
Some other ways to interpret the results from this part of the experiment were investigated as well. E.g.
the slope of the absorbance graphs was plotted in a diagram to see the difference between the different
speeds. However, these ways did not show a clear difference between the different speeds and were
excluded from the results.
5.4 COD
Unfortunately the results from the COD experiment were not able to be used. Probably the concentration
of KHP was too large to receive accurate values and the samples should be further diluted before tested.
Another reason is that the waste water was not completely mixed with the ozone solution in the reaction
tube. While testing the real waste water, the ozone solution probably broke the large carbon particles in
the water while smaller compounds were still in the water resulting in high absorbance. The time was not
enough to continue this part of the experiment.
5.5 Limitations
Experiments like this always have many limitations. The time reserved to this experiment was only four
weeks and the plan was to finish the experiment during this time. Some parts of it did not turn out well
and some of the results were not useful. The COD experiments did not give any good results and more
time would have been necessary to do those experiments again and find suitable concentration and
wavelength intervals. Another limitation was that the amount of real waste water available was only some
litres. It would perhaps have been more accurate to use real waste water throughout the whole
experiment. It would also have been interesting to consider more parameters like the components in the
water and the temperature at which the process is most efficient. Even here the time was limited.
Treatment of dye Hanna Palm Johansson wastewater with ozone solution 2013-07-20
Lingfeng Summer Research School, 2013 12
5.6 Sources of error
The results from these experiments can be inaccurate due to several different aspects. The experiments
should rather be carried out several times, not only once, to get more accurate values. Since the time was
limited it was not possible to do the experiments more than once. Parameters like the pH, the oxygen flow
rate and the mixing ration have been tested but it would also be interesting to consider the composition
and the temperature of the water. The temperature is for example determining for how much ozone that
could be dissolved in the water. To consider more parameters would give a broader view of the waste
water and how to optimize the treatment with ozone solution.
When all the parameters were decided the experiment was carried out with the real waste water. This
water was collected at a textile factory but it is not sure that the water is absolute waste water. The factory
could have treated it already in order to hide what compounds they actually add to their products and also
to the water. The results of this experiment could have been different if the waste water would not have
been treated at all. The real waste water was also stored for some weeks before it was used. It would
perhaps be more accurate to do the experiments with fresh waste water.
Using tap water for the experiment could be misleading since it contains chlorine which has to be
removed before the COD is to be tested. This could affect the water in such a way that it is inappropriate
to be used in this kid of experiment. In real waste water there are a lot of organic compounds and it is
difficult to specify which compounds it contains and compare the synthetic waste water to this. The
synthetic waste water was perhaps not as similar to the real waste water as expected.
5.7 Improvements
To improve a similar experiment in the future one suggestion is to use another reactor tank. The reaction
tank in the experimental setup was simply a plastic tube with a length of 10 m. In order to make the dye
water and the waste water to mix completely a tank with a box shape would preferably be used. Another
aspect is the time for the experiment. The dye water and the ozone solution were mixed for 30 minutes
but a longer reaction time could have increased the oxidation effect. In figure 5-10 it is though seen that
the absorbance levels out as the time increases. The oxidation decreases as the ozone concentration
decreases. To further optimize the process the reaction time would have to be considered further as well.
A more appropriate time would be around one hour. Another suggestion to increase the efficiency is to let
the ozone dissolve in the water for a longer time before mixing it with the waste water.
5.8 Conclusion Even though waste water treatment with ozone solution does not contribute to any secondary pollution it
needs large amount of water for the ozone to dissolve in. Also, the ozone has to be produced. The method
is, however, seen as an appropriate and environmental friendly way to handle the waste water. Due to the
time limitation it is difficult to draw any final conclusions from this experiment. Waste water treatment
with ozone solution is efficient and relatively environmental friendly. To increase the efficiency more
experiments have to be done and the process parameters further optimized. The final parameters that were
considered to be the most appropriate are pH=8.43, oxygen flow rate=1600 mL/min and the speed of the
pump of the ozone solution = 100 rpm.
6. Acknowledgement
The author would like to thank Professor Dongxing Yuan, the supervisor for this project, for nice
guidance and interesting discussions. A special thank to Rui Zhang, who have spent a lot of time on this
project, for explanations and discussions during the experiments. Also to my project colleagues Wenxin
Deng and Yuzhou Wang I would like to say thank you. Thank you for great discussions in the laboratory
Treatment of dye Hanna Palm Johansson wastewater with ozone solution 2013-07-20
Lingfeng Summer Research School, 2013 13
about cultural differences and many other interesting subjects.
Further I would like to thank everyone involved in this cooperation between Lund University and Xiamen
University that made the 7th Lingfeng Summer Research School possible. Finally I would like to thank
Sweco for their contribution to making this exchange possible.
7. References
Arlindo C. Gomesa, J. C. N. R. M. S., 2010. Determination of fast ozone oxidation rate for textile dyes by
using a continuous, Covilha: Journal of Hazardous Materials.
D. Glasser, D. H., 2010. Wastewater treatment of reactive dyestuffs by ozonation in a semi-batch reactor,
Johannesburg: Chemical Engineering Journal.
Elding, L. I., 2013. Nationalencyklopedin. [Online]
Available at: http://www.ne.se/lang/ozon
[Accessed 12 July 2013].
G. Tezcanli-G€uyer, N. I., 2004. Individual and combined effects of ultrasound, ozone, Istanbul: Elsevier.
Jiangning Wu, H. D. S. U., 2008. Decolorization of aqueous textile reactive dye by ozone, Toronto:
Chemical Engineering Journal.
Jiangning Wu, M. A. E. S. E. L., 1998. Evalutation of membrande filtration and ozonation processes for
treatment of reactive-dye wastewater, Georgia: Journal of environmental engineering.
LIU Jia-le, L. H.-j. W. C.-h., 2007. Degradation of anthraquinone dyes by ozone, Guangzhou: Elsevier.
Nationalecyklopedin, 2013. Nationalecyklopedin. [Online]
Available at: http://www.ne.se/lang/kemisk-syref%C3%B6rbrukning
[Accessed 15 July 2013].
Nationalencyklopedin, 2013. Nationalencyklopedin. [Online]
Available at: http://www.ne.se/ljusabsorptionsspektrometri
[Accessed 12 July 2013].
T.Y. Chen, C. K. A. H. C. L. S. L., 2009. Application of ozone on the decolorization of reactive dyes —
Orange-13 and Blue-19, Calt Lake City: Elsevier.
8. Appendix
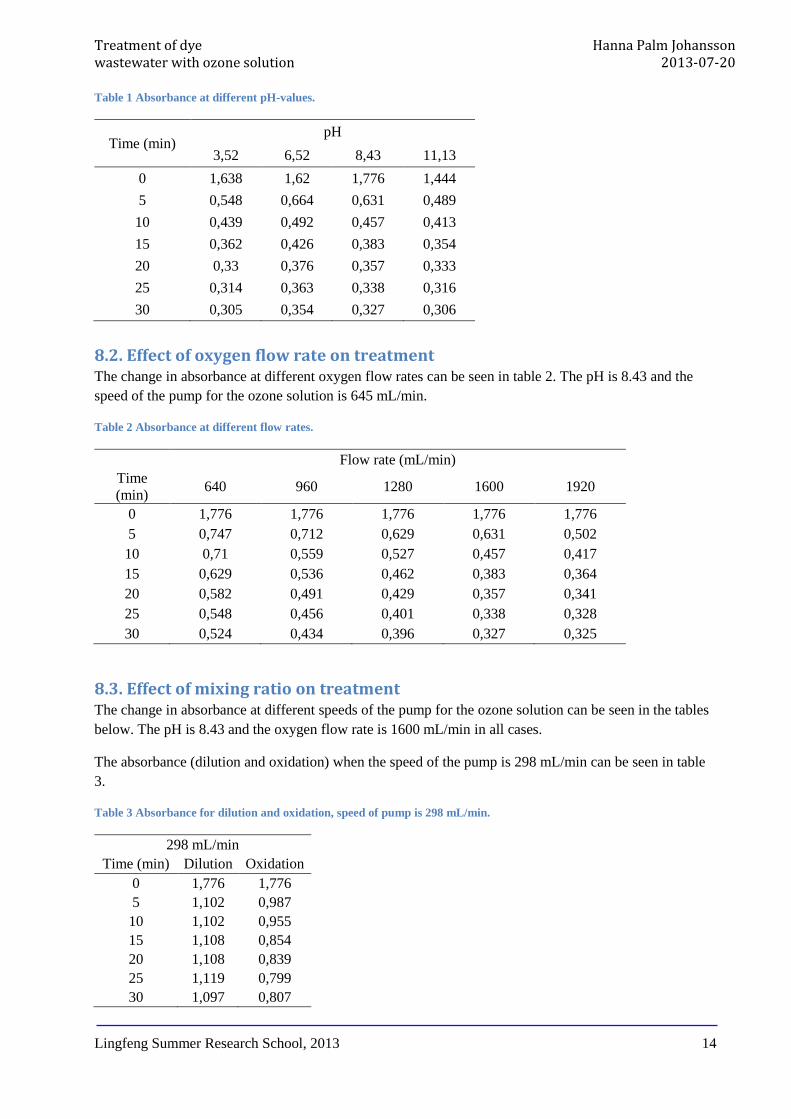
8.1. Effect of pH on treatment The change in absorbance at different pH-values can be seen in table 1. The flow rate is1600 mL/min and
the speed of the pump for the ozone solution is 645 mL/min.
Treatment of dye Hanna Palm Johansson wastewater with ozone solution 2013-07-20
Lingfeng Summer Research School, 2013 14
Table 1 Absorbance at different pH-values.
Time (min) pH
3,52 6,52 8,43 11,13
0 1,638 1,62 1,776 1,444
5 0,548 0,664 0,631 0,489
10 0,439 0,492 0,457 0,413
15 0,362 0,426 0,383 0,354
20 0,33 0,376 0,357 0,333
25 0,314 0,363 0,338 0,316
30 0,305 0,354 0,327 0,306
8.2. Effect of oxygen flow rate on treatment
The change in absorbance at different oxygen flow rates can be seen in table 2. The pH is 8.43 and the
speed of the pump for the ozone solution is 645 mL/min.
Table 2 Absorbance at different flow rates.
Flow rate (mL/min)
Time
(min) 640 960 1280 1600 1920
0 1,776 1,776 1,776 1,776 1,776
5 0,747 0,712 0,629 0,631 0,502
10 0,71 0,559 0,527 0,457 0,417
15 0,629 0,536 0,462 0,383 0,364
20 0,582 0,491 0,429 0,357 0,341
25 0,548 0,456 0,401 0,338 0,328
30 0,524 0,434 0,396 0,327 0,325
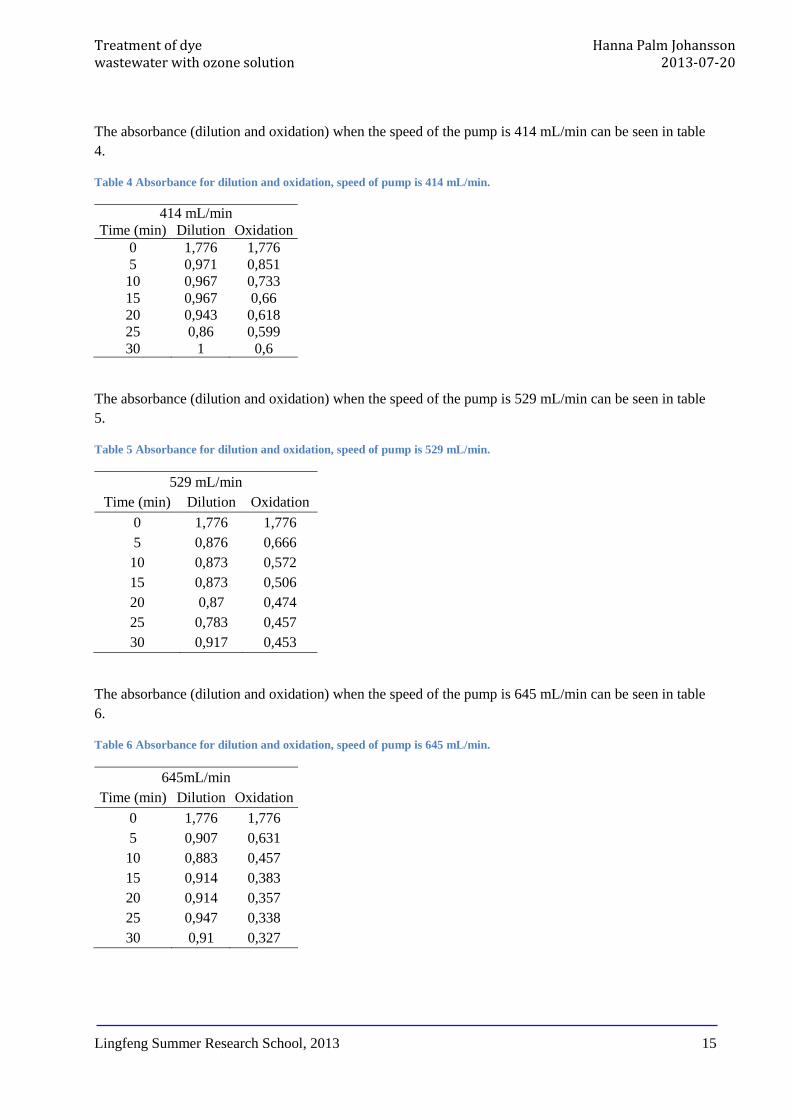
8.3. Effect of mixing ratio on treatment The change in absorbance at different speeds of the pump for the ozone solution can be seen in the tables
below. The pH is 8.43 and the oxygen flow rate is 1600 mL/min in all cases.
The absorbance (dilution and oxidation) when the speed of the pump is 298 mL/min can be seen in table
3.
Table 3 Absorbance for dilution and oxidation, speed of pump is 298 mL/min.
298 mL/min
Time (min) Dilution Oxidation
0 1,776 1,776
5 1,102 0,987
10 1,102 0,955
15 1,108 0,854
20 1,108 0,839
25 1,119 0,799
30 1,097 0,807
Treatment of dye Hanna Palm Johansson wastewater with ozone solution 2013-07-20
Lingfeng Summer Research School, 2013 15
The absorbance (dilution and oxidation) when the speed of the pump is 414 mL/min can be seen in table
4.
Table 4 Absorbance for dilution and oxidation, speed of pump is 414 mL/min.
414 mL/min
Time (min) Dilution Oxidation
0 1,776 1,776
5 0,971 0,851
10 0,967 0,733
15 0,967 0,66
20 0,943 0,618
25 0,86 0,599
30 1 0,6
The absorbance (dilution and oxidation) when the speed of the pump is 529 mL/min can be seen in table
5.
Table 5 Absorbance for dilution and oxidation, speed of pump is 529 mL/min.
529 mL/min
Time (min) Dilution Oxidation
0 1,776 1,776
5 0,876 0,666
10 0,873 0,572
15 0,873 0,506
20 0,87 0,474
25 0,783 0,457
30 0,917 0,453
The absorbance (dilution and oxidation) when the speed of the pump is 645 mL/min can be seen in table
6.
Table 6 Absorbance for dilution and oxidation, speed of pump is 645 mL/min.
645mL/min
Time (min) Dilution Oxidation
0 1,776 1,776
5 0,907 0,631
10 0,883 0,457
15 0,914 0,383
20 0,914 0,357
25 0,947 0,338
30 0,91 0,327