Embed Size (px)
Citation preview
MAGNITUDE AND FREQUENCY OF FLOODS IN RURAL AND
URBAN BASINS OF NORTH CAROLINA
By H. Curtis Gunter, Robert R. Mason, and Timothy C. Stamey
U.S. GEOLOGICAL SURVEY
Water-Resources Investigations Report 87-4096
Prepared in cooperation with the
THE NORTH CAROLINA DEPARTMENT OF TRANSPORTATION,
THE NORTH CAROLINA DEPARTMENT OF NATURAL RESOURCES
AND COMMUNITY DEVELOPMENT,
AND OTHER STATE AND FEDERAL AGENCIES
Raleigh, North Carolina
1987
DEPARTMENT OF THE INTERIOR
DONALD PAUL HODEL, Secretary
U.S. GEOLOGICAL SURVEY
Dallas L. Peck, Director
For additional information write to:
District ChiefU.S. Geological SurveyPost Office Box 2857Raleigh, North Carolina 27602
Copies of this report can be purchased from:
U.S. Geological Survey Books and Open-File Reports Box 25425, Federal Center Denver, Colorado 80225
U.S.
GE
OLOG
ICAL
SURVEY
Water-Resources
Inve
stig
atio
ns Re
port
87
-409
6
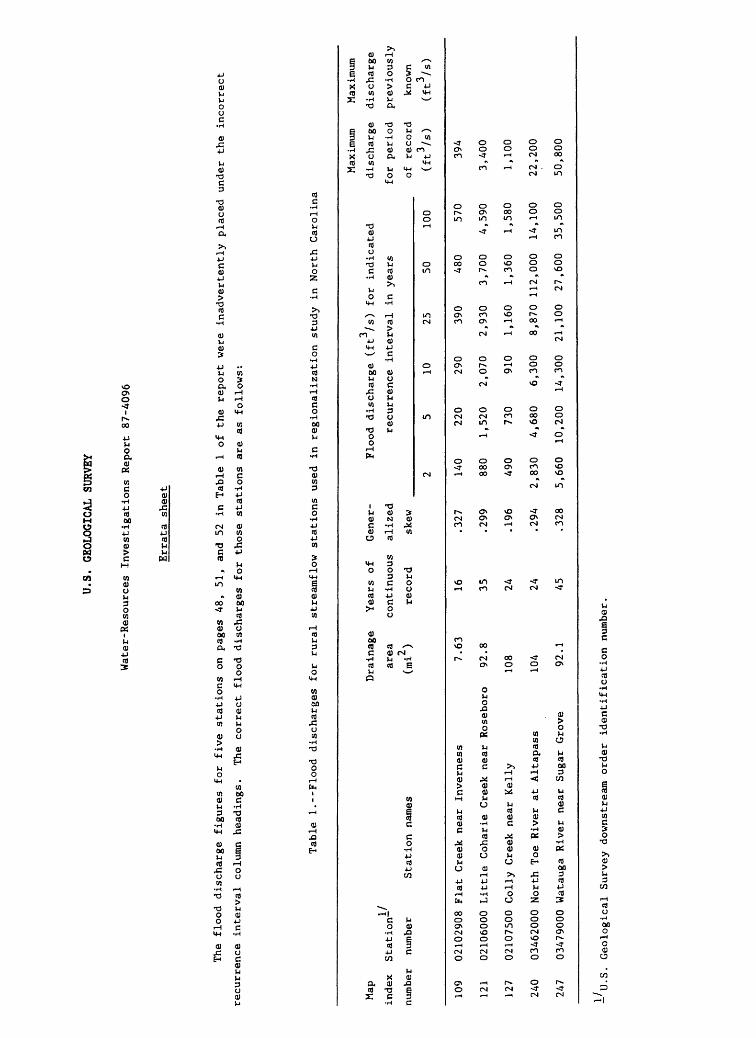
Erra
ta sh
eet
The
flood
discharge
figu
res
for
five
stations on
pa
ges
48,
51,
and
52 in
Table
1 of the
repo
rt we
re in
adve
rten
tly
plac
ed un
der
the
incorrect
recu
rren
ce in
terv
al co
lumn
headings.
The
corr
ect
floo
d discharges fo
r th
ose
stations are
as follows:
Tabl
e 1.
--Fl
ood
disc
harg
es fo
r rural
streamflow stations us
ed in regionalization
stud
y in North
Caro
lina
Map
Drainage
Years
of
Gene
r-
index
Station-
area
continuous
aliz
ed
2 nu
mber
nu
mber
St
atio
n names
(mi
) re
cord
skew
109
121
127
240
247
02102908 Fl
at Cr
eek
near In
vern
ess
0210
6000
Li
ttle
Co
hari
e Cr
eek
near
Ro
sebo
ro
0210
7500
Co
lly
Cree
k near Kelly
03462000 North
Toe
Rive
r at
Altapass
03479000 Watauga
Rive
r ne
ar Suga
r Grove
7.63
92.8
108
104 92.1
16 35 24 24 45
.327
.299
.196
.294
.328
Flood
discharge
(ft
/s)
for
indi
cate
d
recurrence in
terv
al in
ye
ars
2 140
880
490
2,83
0
5,66
0
5 220
1,52
0
730
4,68
0
10,2
00
10 290
2,07
0
910
6,30
0
14,300
25 390
2,930
1,160
8,87
0
21,1
00
50 480
3,70
0
1,360
112,
000
27,6
00
100 570
4,59
0
1,58
0
14,1
00
35,5
00
Maxi
mum
Maximum
disc
harg
e discharge
for
peri
od
prev
ious
ly
of re
cord
kn
own
(ft3/
s)
(ft3/
s)
394
3,40
0
1,100
22,2
00
50,8
00
-U.S. Geological Su
rvey
downstream or
der
iden
tifi
cati
on number.
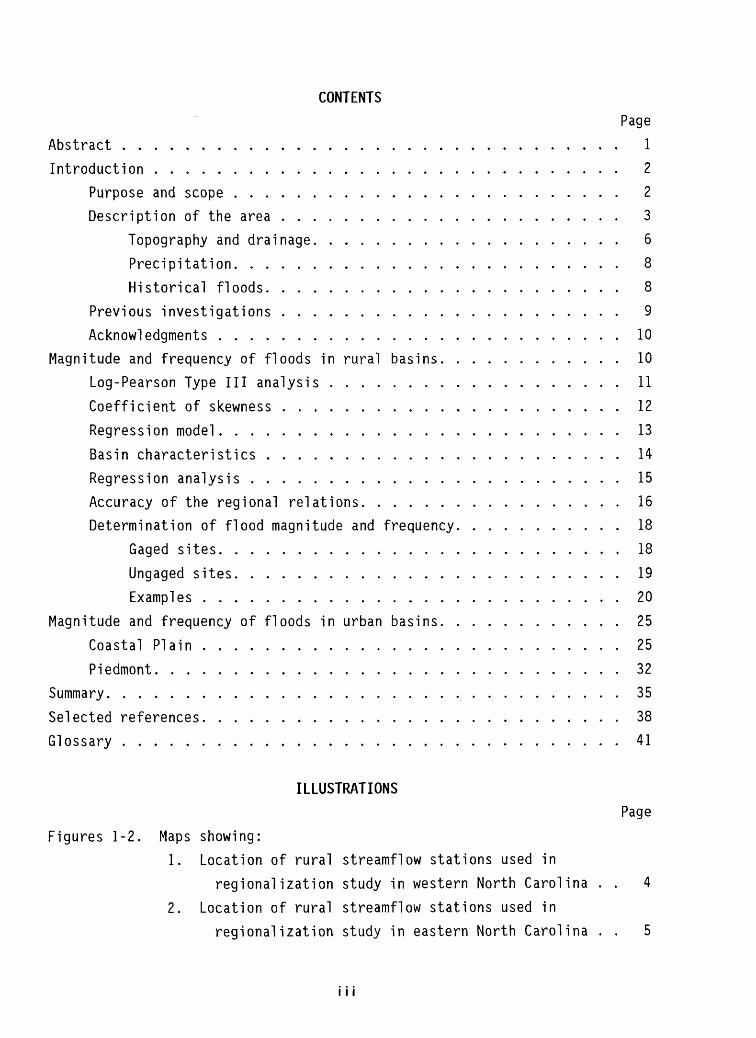
CONTENTS
PageAbstract ................................ 1Introduction .............................. 2
Purpose and scope ......................... 2Description of the area ...................... 3
Topography and drainage. ................... 6Precipitation. ........................ 8Historical floods. ...................... 8
Previous investigations ...................... 9Acknowledgments .......................... 10
Magnitude and frequency of floods in rural basins. ........... 10Log-Pearson Type III analysis ................... 11Coefficient of skewness ...................... 12Regression model. ......................... 13Basin characteristics ....................... 14Regression analysis ........................ 15Accuracy of the regional relations. ................ 16Determination of flood magnitude and frequency. .......... 18
Gaged sites. ......................... 18Ungaged sites. ........................ 19Examples ........................... 20
Magnitude and frequency of floods in urban basins. ........... 25Coastal Plain ........................... 25Piedmont. ............................. 32
Summary. ................................ 35Selected references. .......................... 38Glossary ................................ 41
ILLUSTRATIONS
Page
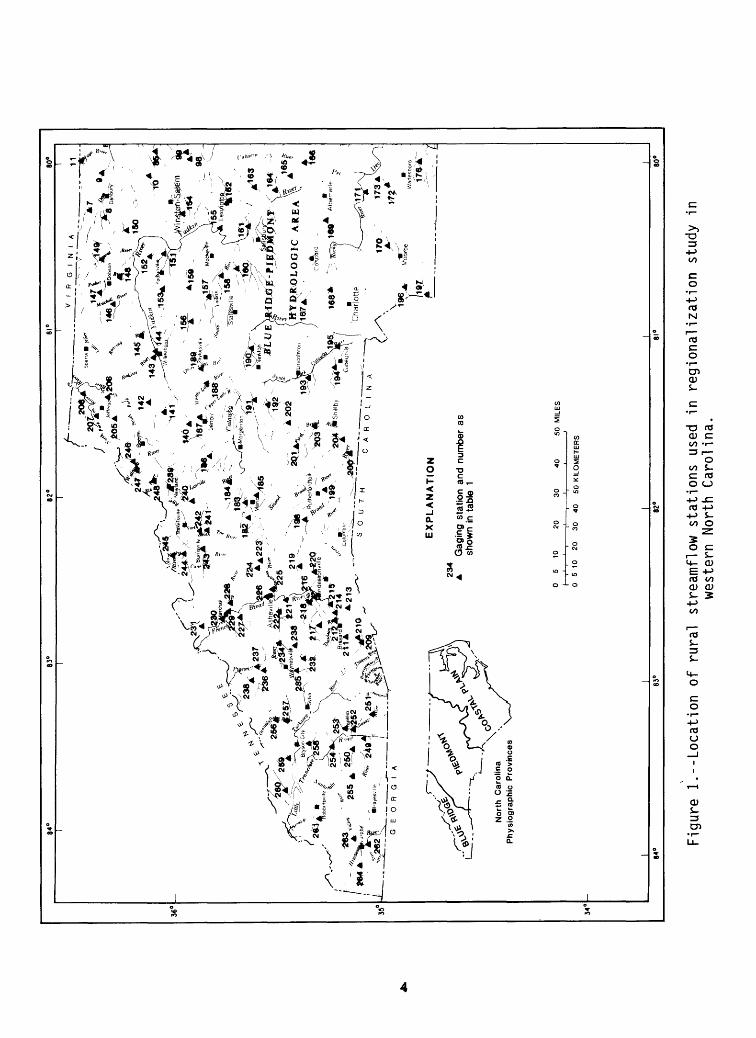
Figures 1-2. Maps showing:1. Location of rural streamflow stations used in
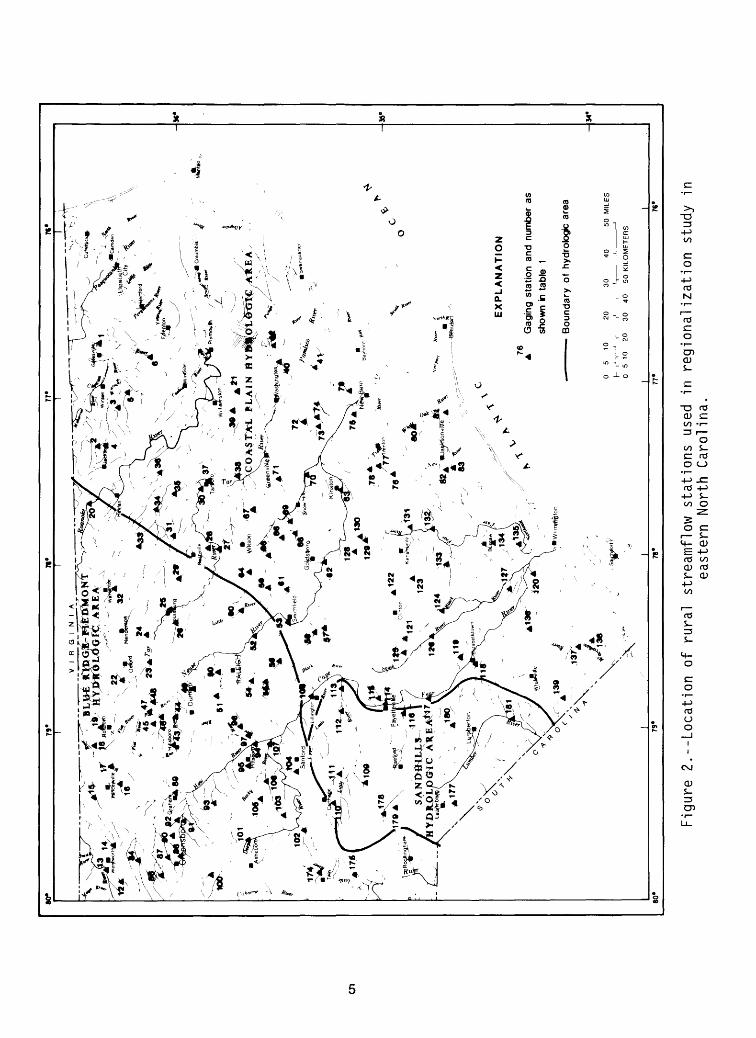
regionalization study in western North Carolina . . 42. Location of rural streamflow stations used in
regionalization study in eastern North Carolina . . 5
111
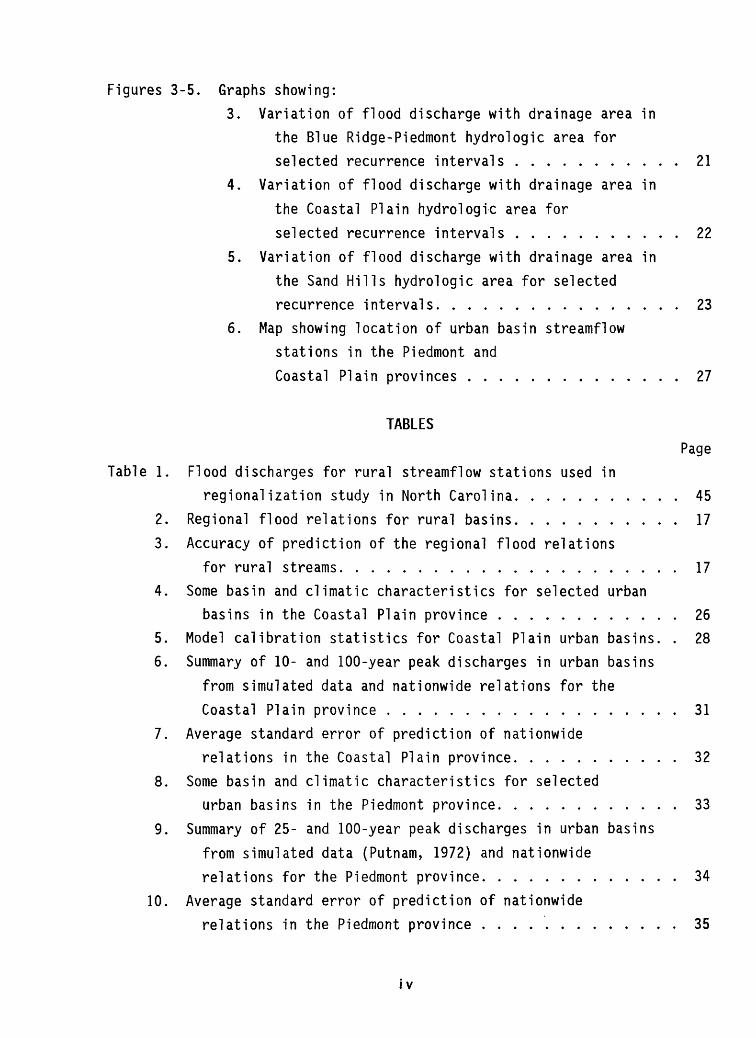
Figures 3-5. Graphs showing:3. Variation of flood discharge with drainage area in
the Blue Ridge-Piedmont hydrologic area for selected recurrence intervals ........... 21
4. Variation of flood discharge with drainage area in the Coastal Plain hydrologic area for selected recurrence intervals ........... 22
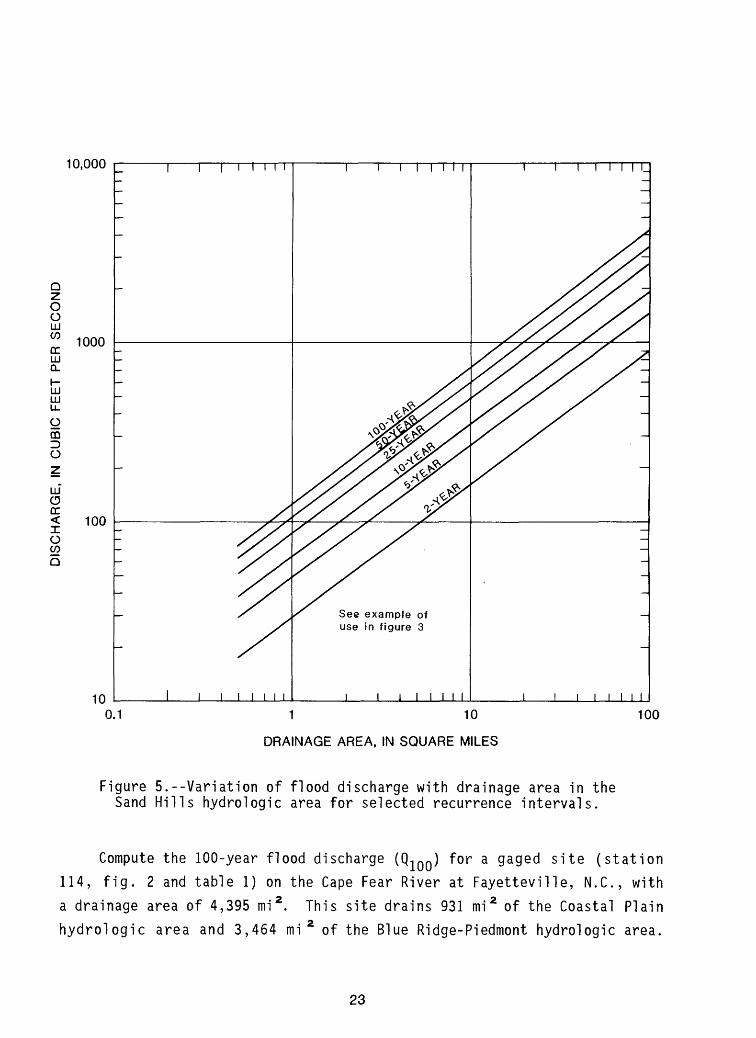
5. Variation of flood discharge with drainage area in the Sand Hills hydrologic area for selected recurrence intervals. ............... 23
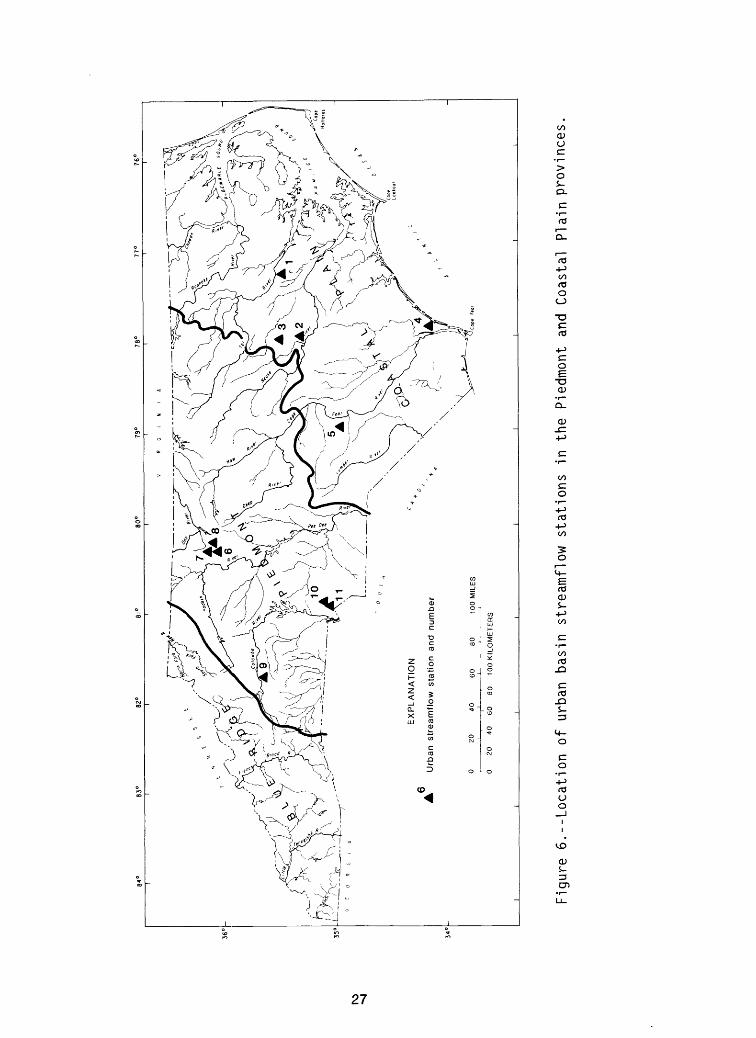
6. Map showing location of urban basin streamflow stations in the Piedmont and Coastal Plain provinces .............. 27
TABLES
Page Table 1. Flood discharges for rural streamflow stations used in
regionalization study in North Carolina. .......... 452. Regional flood relations for rural basins. .......... 173. Accuracy of prediction of the regional flood relations
for rural streams. ..................... 174. Some basin and climatic characteristics for selected urban
basins in the Coastal Plain province ............ 265. Model calibration statistics for Coastal Plain urban basins. . 286. Summary of 10- and 100-year peak discharges in urban basins
from simulated data and nationwide relations for the Coastal Plain province ................... 31
7. Average standard error of prediction of nationwiderelations in the Coastal Plain province. .......... 32
8. Some basin and climatic characteristics for selectedurban basins in the Piedmont province. ........... 33
9. Summary of 25- and 100-year peak discharges in urban basins from simulated data (Putnam, 1972) and nationwide relations for the Piedmont province. ............ 34
10. Average standard error of prediction of nationwiderelations in the Piedmont province ............. 35
IV
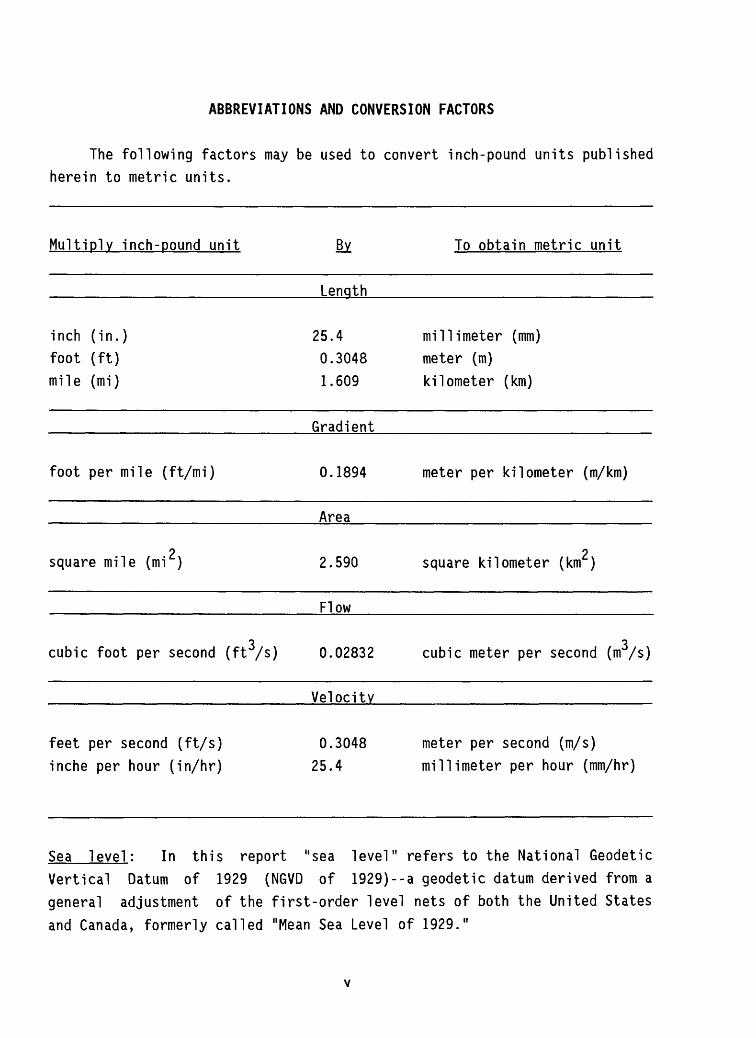
ABBREVIATIONS AND CONVERSION FACTORS
The following factors may be used to convert inch-pound units published herein to metric units.
Multiply inch-pound unit By To obtain metric unit
Lenqth
inch (in.) foot (ft) mile (mi)
25.4 millimeter (mm) 0.3048 meter (m) 1.609 kilometer (km)
Gradient
foot per mile (ft/mi) 0.1894 meter per kilometer (m/km)
Area
2 square mile (mi ) 2 2.590 square kilometer (km )
Flow
3 cubic foot per second (ft /s) 3 0.02832 cubic meter per second (m /s)
Velocity
feet per second (ft/s) inche per hour (in/hr)
Sea level: In this report
0.3048 meter per second (m/s) 25.4 millimeter per hour (mm/hr)
"sea level" refers to the National GeodeticVertical Datum of 1929 (NGVD of 1929)--a geodetic datum derived from a general adjustment of the first-order level nets of both the United States and Canada, formerly called "Mean Sea Level of 1929."
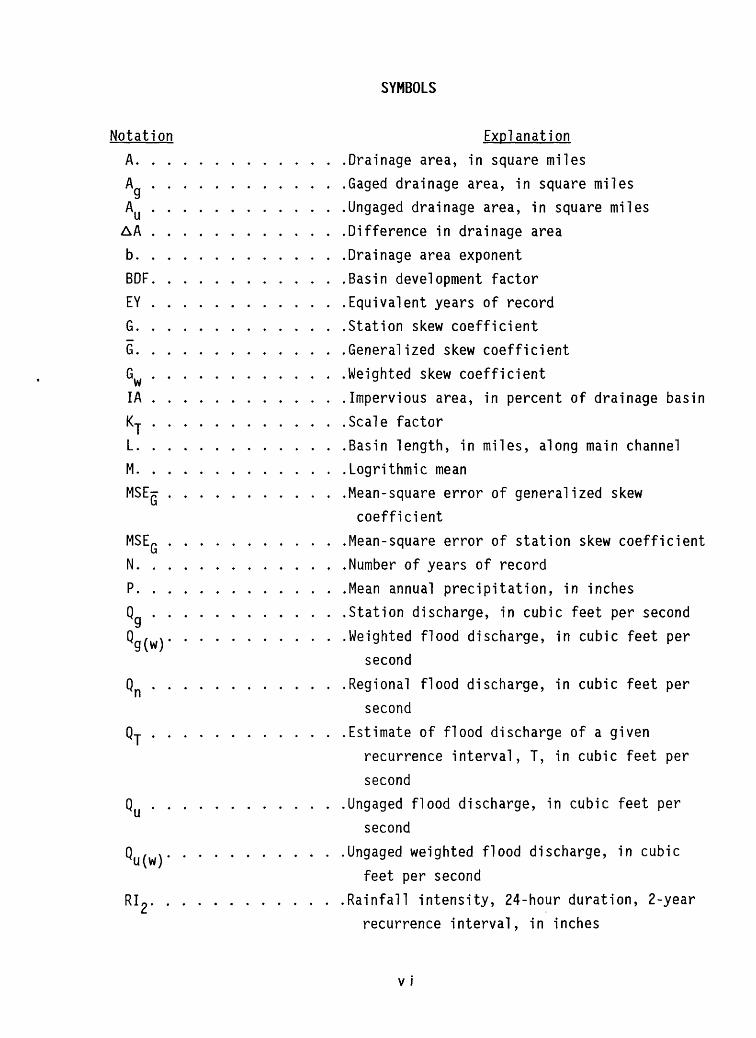
SYMBOLS
Notation ExplanationA. ............ .Drainage area, in square milesA ............ .Gaged drainage area, in square milesA ............ .Ungaged drainage area, in square milesAA ............ .Difference in drainage areab. ............ .Drainage area exponentBDF. ........... .Basin development factorEY ............ .Equivalent years of recordG. ............ .Station skew coefficientG. ............ .Generalized skew coefficientG ............ .Weighted skew coefficientIA ............ .Impervious area, in percent of drainage basinK-j- ............ .Scale factorL. ............ .Basin length, in miles, along main channelM. ............ .Logrithmic meanMSEpr ........... .Mean-square error of generalized skew
coefficient MSEG ........... .Mean-square error of station skew coefficientN. ............ .Number of years of recordP. ............ .Mean annual precipitation, in inchesQ ............ .Station discharge, in cubic feet per secondQ , x. .......... .Weighted flood discharge, in cubic feet per9vw J
secondQ ............ .Regional flood discharge, in cubic feet per
second Qj ............ .Estimate of flood discharge of a given
recurrence interval, T, in cubic feet persecond
Q ............ .Ungaged flood discharge, in cubic feet persecondigaged vfeet per secondlinfall intensityrecurrence interval, in inches
Q , v........... .Ungaged weighted flood discharge, in cubic
RI ? . ........... .Rainfall intensity, 24-hour duration, 2-year
v i
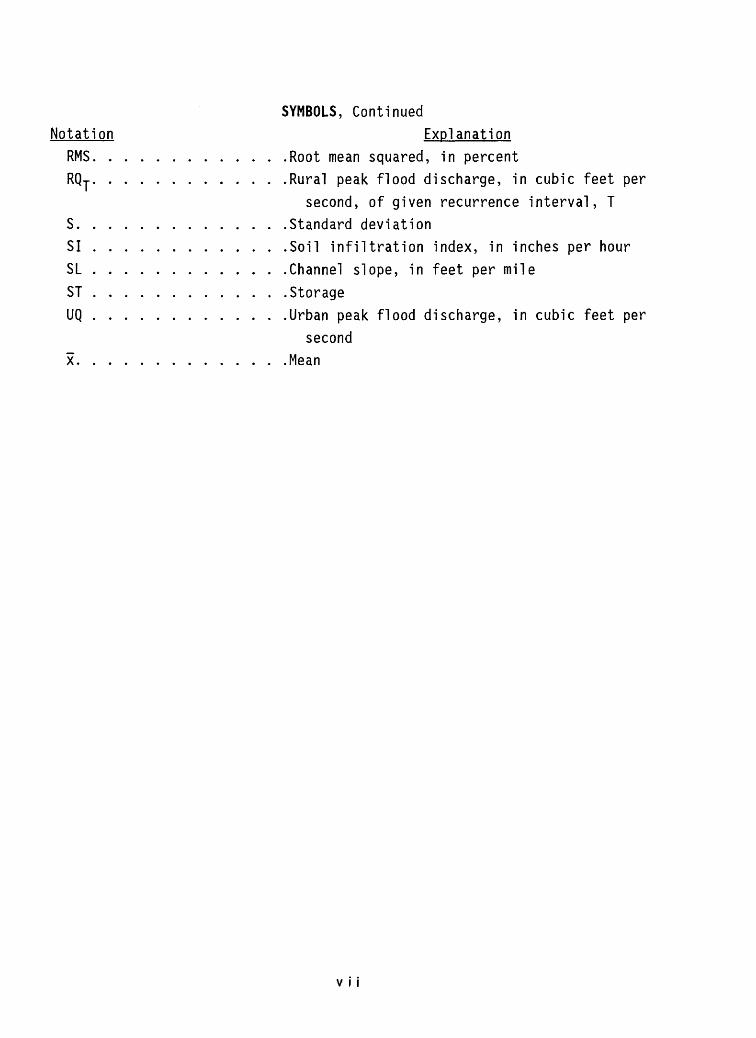
SYMBOLS, ContinuedNotation Explanation
RMS. ........... .Root mean squared, in percentRQj. ........... .Rural peak flood discharge, in cubic feet per
second, of given recurrence interval, T S. ............ .Standard deviationSI ............ .Soil infiltration index, in inches per hourSL ............ .Channel slope, in feet per mileST ............ .StorageUQ ............ .Urban peak flood discharge, in cubic feet per
second x. ............ .Mean
MAGNITUDE AND FREQUENCY OF FLOODS IN RURAL AND
URBAN BASINS OF NORTH CAROLINA
by
H. Curtis Gunter, Robert R. Mason, and Timothy C. Stamey
ABSTRACT
This report presents regional relations for estimating the magnitude and frequency of flood discharges of rural basins throughout North Carolina. Applicability of the nationwide urban flood relations in the Piedmont and Coastal Plain provinces is evaluated.
Data for 254 gaging stations on rural streams with 10 or more years of record were used in multiple linear-regression analyses with basin and climatic variables to derive regional relations for estimating flood discharges having recurrence intervals of 2- to 100-years. Rural relations are presented for three hydrologic areas: (1) Blue Ridge-Piedmont, (2) Coastal Plain, and (3) Sand Hills. Drainage area is the only basin characteristic in the relations. The average standard error of estimate of the relations for the Blue Ridge-Piedmont, Coastal Plain, and Sand Hills hydrologic areas is 44, 39, and 24 percent, respectively. Flood discharges for the 2-, 5-, 10-, 25-, 50-, and 100-year recurrence intervals for the 254 streamflow stations used in the regionalization study are also presented.
Flood-frequency distributions of simulated annual maximum discharges for four urban basins in the Coastal Plain indicate that the nationwide relations are applicable in that province. The root mean squared error for the 10- and 100-year flood discharges, using the nationwide relations, is 44 and 49 percent, respectively.
Simulated data for six sites in the Piedmont were used to analyze the applicability of the nationwide urban relations in that province. The root mean squared error is 64 percent for the 10-year flood and 42 percent for the 100-year flood. No recommendation is made concerning use of the nationwide relations in the Piedmont.
INTRODUCTION
Information on the magnitude and frequency of floods serves both economic and engineering needs in developments along streams and rivers. The information is an important criterion in bridge and culvert design, serves as a basis for flood plain regulation and establishment of equitable flood-insurance rates, and is useful in the design of flood control and drainage structures.
The U.S. Geological Survey, in cooperation with a number of State and local agencies, has conducted several studies to develop or improve procedures for estimating peak discharges on North Carolina streams that have predominately rural basins. Urbanization of a watershed can produce substantial changes in flood-runoff characteristics; therefore, regional relations for rural basins are not applicable to urban streams. Some method to account for, or estimate, the effects of urbanization is necessary. Putnam (1972) presented relations to estimate urban peak discharges in the Piedmont province. These equations were not recommended for use in other physiographic provinces of North Carolina because no data were available from those areas to test the applicability of the equations.
In 1976, the U.S. Geological Survey, in cooperation with the North Carolina Department of Transportation, began a study to determine urban flood relations for the Coastal Plain. The study was expanded in 1984 to test the applicability of nationwide flood relations (Sauer and others, 1983). The nationwide relations require an estimate of the rural flood discharges as input. Therefore, the study was further expanded to update regional flood relations for rural North Carolina streams (Jackson, 1976).
Purpose and Scope
The purpose of this report is to present and illustrate methods to estimate the magnitude and frequency of floods of rural streams throughout North Carolina and to verify flood relations for urban streams in the Piedmont and Coastal Plain. Data are not available to evaluate the applicability of flood relations for urban streams in the Blue Ridge province.
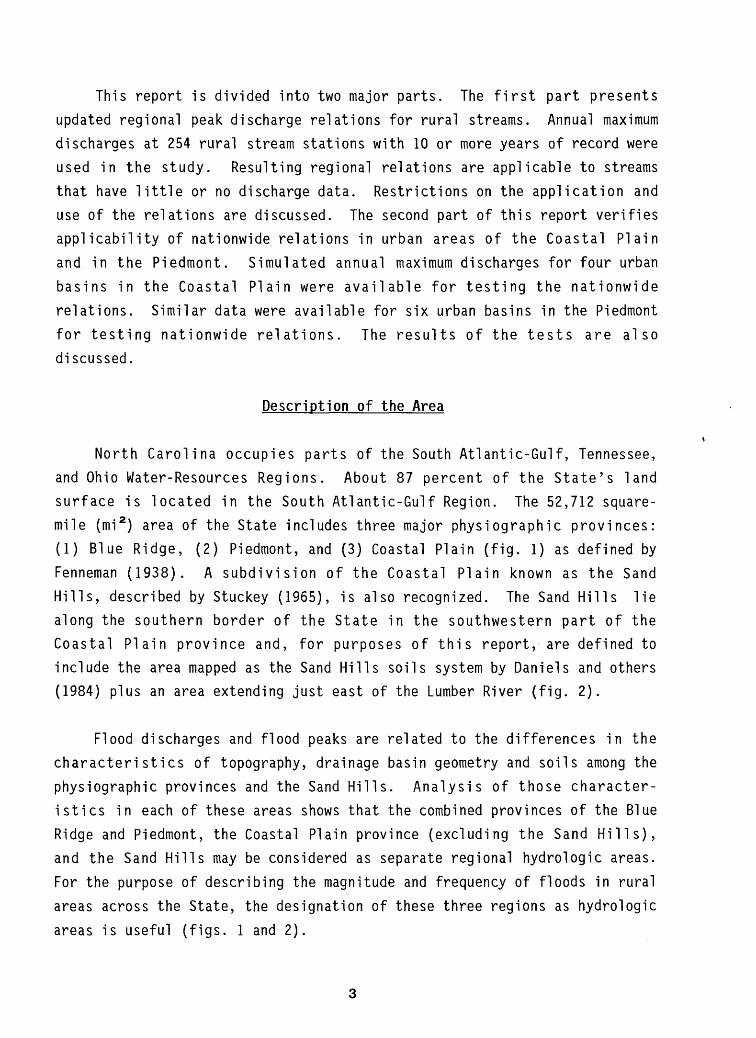
This report is divided into two major parts. The first part presents updated regional peak discharge relations for rural streams. Annual maximum discharges at 254 rural stream stations with 10 or more years of record were used in the study. Resulting regional relations are applicable to streams that have little or no discharge data. Restrictions on the application and use of the relations are discussed. The second part of this report verifies applicability of nationwide relations in urban areas of the Coastal Plain and in the Piedmont. Simulated annual maximum discharges for four urban basins in the Coastal Plain were available for testing the nationwide relations. Similar data were available for six urban basins in the Piedmont for testing nationwide relations. The results of the tests are also discussed.
Description of the Area
North Carolina occupies parts of the South Atlantic-Gulf, Tennessee, and Ohio Water-Resources Regions. About 87 percent of the State's land surface is located in the South Atlantic-Gulf Region. The 52,712 square- mile (mi 2 ) area of the State includes three major physiographic provinces: (1) Blue Ridge, (2) Piedmont, and (3) Coastal Plain (fig. 1) as defined by Fenneman (1938). A subdivision of the Coastal Plain known as the Sand Hills, described by Stuckey (1965), is also recognized. The Sand Hills lie along the southern border of the State in the southwestern part of the Coastal Plain province and, for purposes of this report, are defined to include the area mapped as the Sand Hills soils system by Daniels and others (1984) plus an area extending just east of the Lumber River (fig. 2).
Flood discharges and flood peaks are related to the differences in the characteristics of topography, drainage basin geometry and soils among the physiographic provinces and the Sand Hills. Analysis of those character istics in each of these areas shows that the combined provinces of the Blue Ridge and Piedmont, the Coastal Plain province (excluding the Sand Hills), and the Sand Hills may be considered as separate regional hydrologic areas. For the purpose of describing the magnitude and frequency of floods in rural areas across the State, the designation of these three regions as hydrologic areas is useful (figs. 1 and 2).
,
,
v* -*
v
/ /\
17
0-
17
3A
^
'' \
f
*}*'
\ 19
6
S^fr X
1*
Nor
th
Ca
rolin
a
Phys
iogra
phic
P
rovi
nce
s
EX
PL
AN
AT
ION
234
A G
agin
g st
atio
n an
d nu
mbe
r as
sh
own
in ta
ble
1
» ,>
A-
Moo
rtue
|1»
7_
,
W'a
desb
oro
f7^A
f_
^_
_^
0
5 10
20
30
40
50
MIL
ES
0510
20
30
40
50 K
ILO
ME
TE
RS
80°
Figu
re 1.--Location of
rur
al streamflow s
tati
ons
used
in
re
gion
aliz
atio
n study
inwe
ster
n No
rth
Carolina.
Gag
ing
stat
ion
and
num
ber
as
show
n in
tab
le
1
Bou
ndar
y of
hyd
roto
gic
area
Figu
re 2.
--Lo
cati
on of r
ural
stream-flow
stat
ions
us
ed in regional iza
tion
st
udy
in
east
ern
Nort
h Ca
roli
na.
Topography and Drainage
The North Carolina portion of the Blue Ridge province is bordered on the north and west by the States of Virginia and Tennessee; on the south by Georgia and South Carolina; and on the east by the Piedmont province (fig. 1). The eastern boundary of the Blue Ridge province is an abrupt scarp rising some 1,500 to 2,500 feet above the Piedmont. Rough mountainous terrain, rock outcrops, and clayey soils are characteristic of the province. Elevations range from 6,684 feet above sea level at Mount Mitchell, the highest peak in the United States east of the Mississippi River, to 3,000 feet above NGVD of 1929 along the eastern boundary of the province (Stuckey, 1965). River basins are narrow; tributaries are short and tend to be oriented perpendicular to receiving streams. Typical stream slopes are 30 to 100 feet per mile (ft/mi), but some slopes are as small as 4 ft/mi in basins greater than 500 mi 2 , and some are as large as 650 ft/mi in headwaters. Many mountain streams flow at velocities exceeding 10 feet per second (ft/sec) during floods. Even on the larger streams, floods hydrographs are sharp and pass quickly, usually within 24 hours.
The Piedmont province of North Carolina lies between the Blue Ridge and Coastal Plain provinces and is bounded by Virginia on the north and South Carolina to the south. The province is characterized by rolling to steep hills and ridges which trend northeast to southwest (Stuckey, 1965). Elevations in the Piedmont range from over 1,500 feet above sea level at many points along the western boundary to 300 feet above sea level along the eastern boundary. The soils are derived from the weathered rock beneath and are usually clayey or silty loams. Drainage patterns are mostly dendritic rectilinear. Stream slopes average about 20 ft/mi, ranging from 10 to several hundred feet per mile. Streamflow velocities of 5 to 10 ft/sec occasionally occur during floods. Depending on the size of the basin and intensity of the storm, flood waters may require a few hours to a few days to peak and pass the basin outlet.
The Coastal Plain is the easternmost province of North Carolina, bounded on the west by the Piedmont and by the Atlantic Ocean on the east. The Virginia and South Carolina State lines delineate the north and south extent of this province in North Carolina. Excluding the Sand Hills
hydrologic area, elevations range from 400 feet above sea level in the southwestern Coastal Plain to sea level at the Atlantic coast. The Coastal Plain is characterized by moderate to gentle land and stream slopes in the west to very flat slopes in the east. Typical surface slopes range from 10 to 20 ft/mi, and stream slopes rarely exceed 10 ft/mi. Soils are derived from marine sand and clay deposits; the sandy soils have a tendency to absorb much water.
Coastal Plain streams generally are braided near the coast, with many anabranches and distributaries meandering through swamps. Here, drainage divides are poorly defined or nonexistent. To increase drainage of low- lying lands, extensive networks of canals and cross-ditches have been constructed, which may alter runoff characteristics of entire basins. Many stream channels have been cleared of blockages or channelized. Vast areas along stream courses are susceptible to flooding. Streams that may be a few tens of feet wide during dry weather often inundate areas several thousand feet wide during floods of minor magnitude. Floods are attenuated and peaks build slowly; flood peaks on major Coastal Plain streams may not occur for a week or longer following the flood-producing rains.
The Sand Hills hydrologic area is part of the Coastal Plain province along the South Carolina border (fig. 2). The topography is characterized by broad and rolling uplands with highly directed, steep-sided valleys. Elevations range from about 500 to 700 feet above sea level. The soils are typically light-colored, loose, fine to coarse sandy loam that Daniels and others (1984, p. 14) describe as a "billowing, nearly white sea of sand." Drainage is dendritic with typical stream slopes of 20 ft/mi.
Hydrologically, the Sand Hills are unique in North Carolina; storm runoff is considerably less here than that associated with the other hydrologic areas because of the absorbent nature of the sandy soils. Consequently, streams respond slowly to all but the most extreme rainfall, and flood peaks are broad crested.
Precipitation
In North Carolina, most precipitation occurs as rain and is distributed fairly uniformly throughout the year, but area! variations are extreme. The highest annual precipitation found in the eastern United States, 82 inches, occurs in the State's Blue Ridge province as does the State's lowest precipitation of 40 inches only 50 mi (miles) away (Eder and others, 1983). This extreme difference is caused by the orographic effect of the mountains on precipitation in western North Carolina.
Eastward, across the Piedmont, annual precipitation decreases gradually reaching a low of approximately 43 inches near the central section of the province then gradually increases over the Coastal Plain to approximately 54 inches near the Atlantic Coast. Storm rainfall maps generally indicate similar patterns with rainfall intensity highest in the extreme southern portion of the Blue Ridge and along the Atlantic Ocean and lowest over the central section of the Piedmont (U.S. Weather Bureau, 1961).
Most floods in North Carolina result from either thunderstorms or tropical storms. Thunderstorms are mostly associated with the warm season but may occur any time during the year; they are frequently intense and generally affect small areas. More thunderstorms occur in the Blue Ridge than in any other area of the State, and the northeastern portion of the Coastal Plain receives the least number (Kopec and Clay, 1975).
Tropical storms and hurricanes are most frequent during late summer and fall. They can cover tens of thousands of square miles, last for days, and deliver enormous quantities of rain. Major floods, especially those on larger streams, are usually associated with these storms. It should be emphasized, however, that the State has no flood season and that major floods might occur during any season of the year.
Historical Floods
Since 1900, major floods have occurred in 1916, 1928, 1940, 1945, 1955, and 1977, but statewide flooding caused by a single storm or storm system is
8
a rarity. For instance, the 1955 flood occurred in eastern North Carolina and the floods of 1977 were limited to portions of western North Carolina. Of the preceding major floods, the one causing the most damage was that of August 1940 which also was the most widespread. Quite often, however, record floods on smaller headwater streams have resulted from locally intense rains which subsequently had little effect on the larger main stem. Because of the variability of rainfall during and between storms, differences in soil characteristics among basins, varying antecedent soil- moisture conditions, and a host of other variables, the same storm may produce a record flood in one basin and only moderate flooding in an adjacent basin. For these and other reasons, dates of occurrence of maximum floods are quite variable across the State and even within the same river basin.
Previous Investigations
Three previous reports by Speer and Gamble (1964a, 1964b, 1965), each covering a portion of North Carolina, have presented methods for estimating flood magnitudes for various recurrence intervals. However, the methods are applicable only to rural basins more than about 150 mi 2 in size. Beginning in 1952, 120 crest-stage stations were established in rural basins generally less than 50 mi 2 in size. Records for these and other gaging stations through 1963 were used by Hinson (1965) to develop statewide flood relations for rural basins less than 150 mi 2 in size. Jackson (1976), using 10 additional years of record, better defined statewide flood relations, especially for basins less than 50 mi 2 in size. Generally, results of previous studies were applicable to rural basins in North Carolina with the exception of streams subject to regulation, tide effect, urbanization, channel improvement, and those streams with basins covering less than 0.5 mi 2 .
Nationwide, numerous reports are available which describe the effects of urban development on floods; however, relatively few include predictive techniques which are applicable to North Carolina streams. Putnam (1972) determined that urban development in the State's Piedmont province significantly affected flood flows and presented relations including indices
of lag time and impervious cover to account for the increase in peak discharge caused by urbanization. Sauer and others (1983) developed relations for nationwide application. Their technique uses the flood magnitude for rural streams as a base; parameters reflective of the degree of urban development are used to adjust the flood magnitude from rural to urban conditions. This report presents an analysis of the applicability of these nationwide relations to the Coastal Plain and Piedmont provinces of North Carolina.
Acknowledgments
The authors thank the many persons who have given time, information, and guidance during this study. Particular thanks are given to personnel of the National Climatic Data Center, U.S. Department of Commerce, Asheville, North Carolina, and to Roy H. Bingham, Hydro!ogist, and other persons in the Geological Survey who assisted in the data collection and in the preparation of this report.
This report, which supercedes all previous U.S. Geological Survey flood-frequency reports for North Carolina, is the result of a cooperative agreement between the North Carolina Department of Transportation and the U.S. Geological Survey. Most of the flood records used in this study were collected in cooperation with the North Carolina Department of Natural Resources and Community Development, the U.S. Army Corps of Engineers, the Tennessee Valley Authority, and other State and local governmental agencies.
MAGNITUDE AND FREQUENCY OF FLOODS IN RURAL BASINS
Streamflow data for 254 predominately rural streamflow stations having records of at least ten annual maximum discharges not significantly affected by tides, regulation, diversion, or channelization were used in this study (figs. 1 and 2). Of these stations, 177 were in the Blue Ridge-Piedmont hydrologic area, 69 were in the Coastal Plain hydrologic area, and eight were in the Sand Hills hydrologic area. Drainage areas of the stations in the Blue Ridge hydrologic area range in size from 0.25 to 8,384 mi 2 , in the
10
Coastal Plain hydrologic area from 0.63 to 2,692 mi 2 , and in the Sand Hills hydro!ogic area from 7.57 to 1,228 mi 2 .
The relation of annual maximum discharges to their probability of exceedence, or recurrence interval, is referred to as a flood-frequency distribution. Recurrence interval is the average interval of time within which the given flood will be exceeded once. Flood-frequency distributions (table 1) were determined for each station using U.S. Geological Survey guidelines and procedures outlined by the Water Resources Council. The "Guidelines for Determining Flood Flow Frequency," Bulletin 17B of the U.S. Water Resources Council (1981), is a major extension of the work previously completed by the Council to promote a consistent approach to flood frequency determination. Suggested procedures are provided in Bulletin 17B for defining flood-frequency distributions for streamflow stations. These procedures form the basis for the station data analysis methods incorporated in this report. A brief summary of the procedures used is outlined below:
1. A Pearson Type III distribution was fitted to logarithms of observed annual maximum discharges for each station;
2. The generalized skew and station skew coefficients were weighted to form an estimate of skew for each basin; and
3. Frequency distributions were adjusted for outliers and historic peaks.
Loq-Pearson Type III Analysis
, The Pearson Type III distribution with base 10 logarithmic transformation of annual maximum discharges was used to define station flood-frequency distributions. For this distribution, the peak discharge at selected T-year (2-, 5-, 10-, 25-, 50-, and 100-year) recurrence intervals can be computed using the following equation:
log QT = M + KTS (1)
11
where: Qj = Estimate of the T-year flood from log-Pearson Type III
distribution, in cubic feet per second;
M = Mean of the logarithms of the annual maximum discharges;
Ky = A scale factor that is a function of the skew coefficient
and recurrence interval; and
S = Standard deviation of the logarithms of the annual
maximum discharges.
U.S. Geological Survey computer program J407, described by Kirby (1979), was used to fit the log-Pearson Type III distribution to annual maximum discharges for each station. Program J407 includes many of the features described in Bulletin 17B (U.S. Water Resources Council, 1981) but requires the user to use judgement when providing data on historic peaks, specifying screening levels for outliers, and interpreting the frequency distribution.
Coefficient of Skewness
As defined in the previous section, the scale factor (K-r) of the log- Pearson Type III analysis is a function of the recurrence interval and the skew coefficient. The accuracy of the station skew coefficient, as an estimate of the true skew of the frequency distribution, is generally a function of the length of record. The station skew is a measure of the past history of annual floods, and may be extremely unreliable when computed from short periods (less than 10 years) of record. The generalized skew coefficient is the average of the station skew coeficients in a given area having at least 25 years of record. The generalized skew coefficient can be averaged with the individual station skew coefficients to dampen the effects of extreme floods. Bulletin 17B (U.S. Water Resources Council, 1981) recommends that the station and the generalized skew coefficients be weighted inversely to their respective mean-square errors as follows:
12
MSEG (G)
MSE
(2)
where: G = Weighted skew coefficient;
g = Mean-square error of generalized skew coefficient;
G = Station skew coefficient;
MSE« = Mean-square error of station skew coefficient; and
G = Generalized skew coefficient.
Flood discharges determined from the estimated flood-frequency distribution that were used in the regression analysis are listed in table 1 at the end of this report with exception of the deletions listed below. Locations of the streamflow stations are shown in figures 1 and 2.
Station map index number Reason for deletion
53, 110, 111, 114, 117, 179134141, 216
155
Basin in two hydro!ogic areas Indeterminate drainage area Short term flood record with
one high annual flood discharge (high outlier)
Regulated discharge
Regression Model
Regional flood relations were developed in this study by using multiple linear-regression analysis to relate flood discharges of selected recurrence intervals to selected basin and climatic characteristics. Resulting regional flood relations are statistical expressions of flood discharge as a function of significant basin and climatic characteristics; indices of accuracy and reliability are also provided.
13
Flood discharges (dependent variables) were related to the basin and climatic factors (independent variables) by step-backward and step-forward multiple-regression analysis. In step-backward multiple regression, a set of equations is developed relating the dependent variable to all independent variables then proceeding step-wise where, at each step, the least significant independent variable, as indicated by the Student's t-test, is deleted from the equation. Step-forward multiple-regression differs in that at each step all variables are tested, and the one making the greatest reduction in standard error is added to the equation. This procedure continues, retaining the next most significant variable at each step, until all variables that are significant are retained in the equation. Results were the same for both methods.
The hydro!ogic model sought has the form:
QT = BQ Xj B l X 2 B2 X3 B3 ... (3)
where QT represents the T-year flood discharge or dependent regression
variable;
BQ, B,, B«, Bo are regression coefficients; and
Xp X«, Xo are the basin characteristics or independent variables.
The hydro!ogic model has a linear form as follows:
log QT = log BQ + Bj log Xj + B2 log X 2 + B3 log X3 +... (4)
This logarithmic relation is the form that was used in this study.
Basin Characteristics
The basin characteristics used in the regionalization study are described below. The variables were chosen because they are most likely to influence flood discharge. Not all variables tested were statistically significant. Consequently, insignificant characteristics do not appear in the final regional relations. All basin characteristics with zero values were changed to 1 percent so that logarithmic transformations could be made.
14
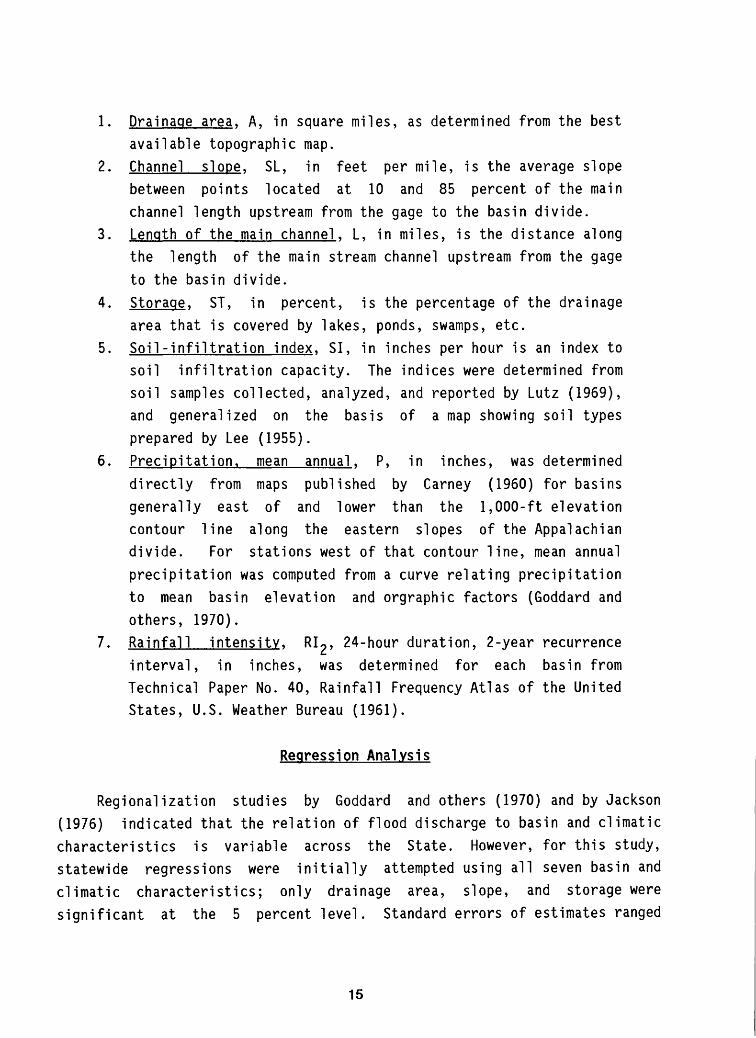
1. Drainage area. A, in square miles, as determined from the best available topographic map.
2. Channel slope, SL, in feet per mile, is the average slope between points located at 10 and 85 percent of the main channel length upstream from the gage to the basin divide.
3. Length of the main channel, L, in miles, is the distance along the length of the main stream channel upstream from the gage to the basin divide.
4. Storage, ST, in percent, is the percentage of the drainage area that is covered by lakes, ponds, swamps, etc.
5. Soil-infiltration index, SI, in inches per hour is an index to soil infiltration capacity. The indices were determined from soil samples collected, analyzed, and reported by Lutz (1969), and generalized on the basis of a map showing soil types prepared by Lee (1955).
6. Precipitation, mean annual, P, in inches, was determined directly from maps published by Carney (1960) for basins generally east of and lower than the 1,000-ft elevation contour line along the eastern slopes of the Appalachian divide. For stations west of that contour line, mean annual precipitation was computed from a curve relating precipitation to mean basin elevation and orgraphic factors (Goddard and others, 1970).
7. Rainfall intensity, Rip, 24-hour duration, 2-year recurrence interval, in inches, was determined for each basin from Technical Paper No. 40, Rainfall Frequency Atlas of the United States, U.S. Weather Bureau (1961).
Regression Analysis
Regionalization studies by Goddard and others (1970) and by Jackson (1976) indicated that the relation of flood discharge to basin and climatic characteristics is variable across the State. However, for this study, statewide regressions were initially attempted using all seven basin and climatic characteristics; only drainage area, slope, and storage were significant at the 5 percent level. Standard errors of estimates ranged
15
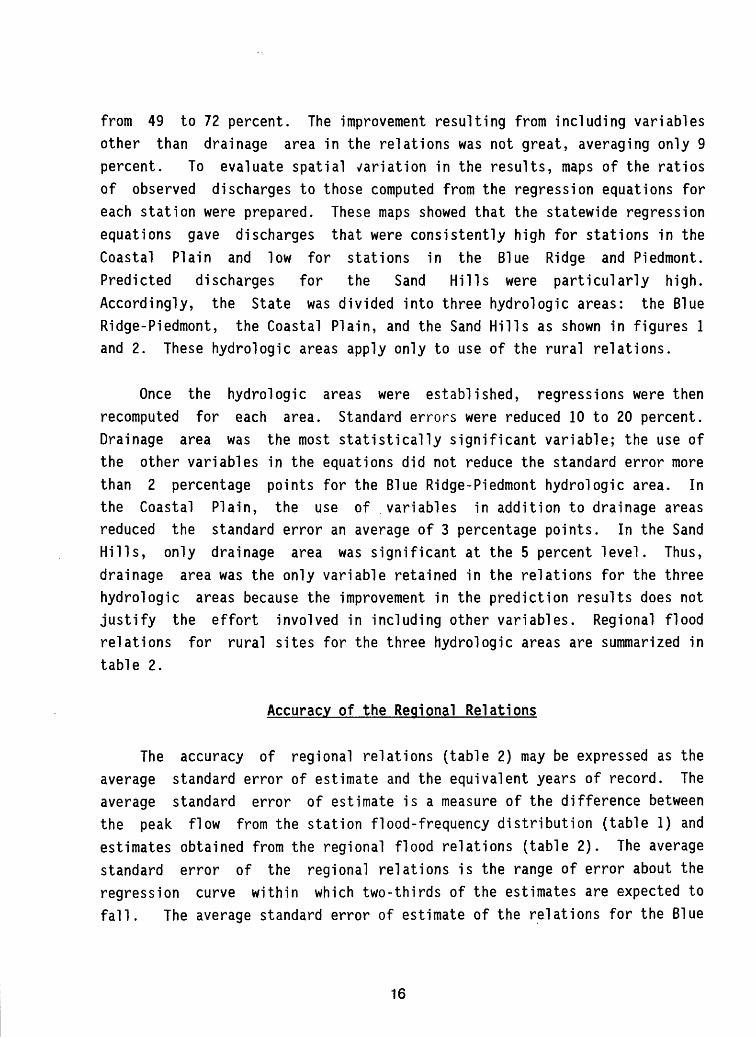
from 49 to 72 percent. The improvement resulting from including variables other than drainage area in the relations was not great, averaging only 9 percent. To evaluate spatial variation in the results, maps of the ratios of observed discharges to those computed from the regression equations for each station were prepared. These maps showed that the statewide regression equations gave discharges that were consistently high for stations in the Coastal Plain and low for stations in the Blue Ridge and Piedmont. Predicted discharges for the Sand Hills were particularly high. Accordingly, the State was divided into three hydrologic areas: the Blue Ridge-Piedmont, the Coastal Plain, and the Sand Hills as shown in figures 1 and 2. These hydrologic areas apply only to use of the rural relations.
Once the hydrologic areas were established, regressions were then recomputed for each area. Standard errors were reduced 10 to 20 percent. Drainage area was the most statistically significant variable; the use of the other variables in the equations did not reduce the standard error more than 2 percentage points for the Blue Ridge-Piedmont hydrologic area. In the Coastal Plain, the use of variables in addition to drainage areas reduced the standard error an average of 3 percentage points. In the Sand Hills, only drainage area was significant at the 5 percent level. Thus, drainage area was the only variable retained in the relations for the three hydrologic areas because the improvement in the prediction results does not justify the effort involved in including other variables. Regional flood relations for rural sites for the three hydrologic areas are summarized in table 2.
Accuracy of the Regional Relations
The accuracy of regional relations (table 2) may be expressed as the average standard error of estimate and the equivalent years of record. The average standard error of estimate is a measure of the difference between the peak flow from the station flood-frequency distribution (table 1) and estimates obtained from the regional flood relations (table 2). The average standard error of the regional relations is the range of error about the regression curve within which two-thirds of the estimates are expected to fall. The average standard error of estimate of the relations for the Blue
16
Ridge-Piedmont, Coastal Plain, and Sand Hills hydrologic areas is 44, 39, and 26 percent, respectively.
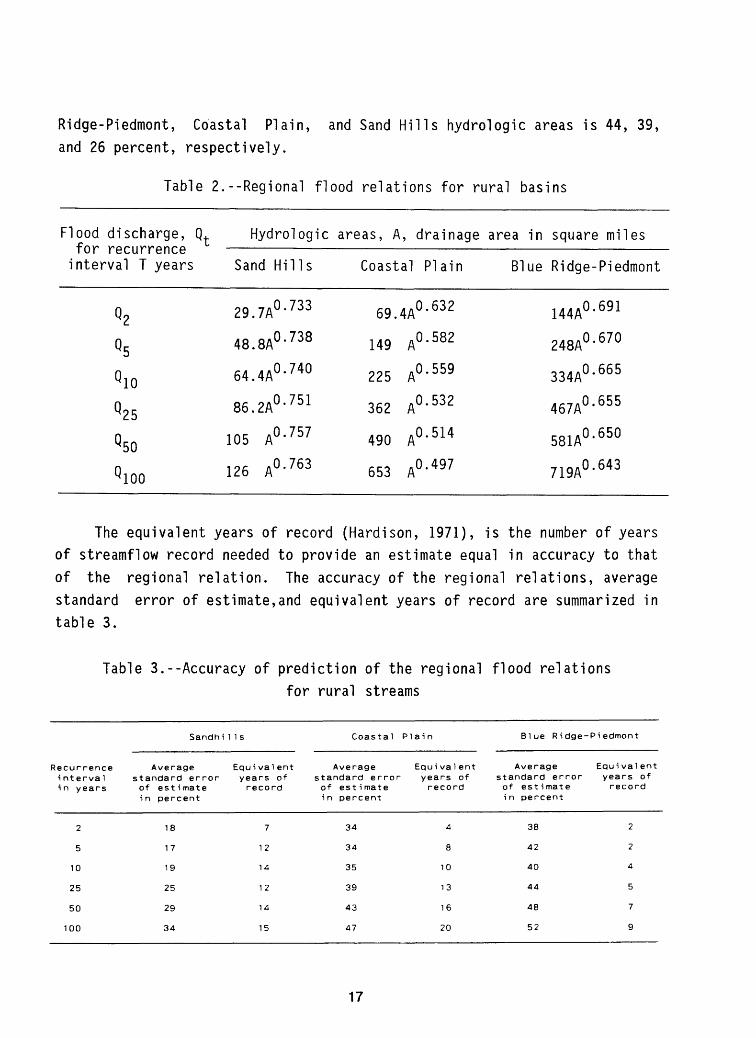
Table 2.--Regional flood relations for rural basins
Flood discharge, for recurrence
't Hydrologic areas,
interval T years Sand
Q
Q
Q
Q
Q
Q
2
5
10
25
50
100
29
48
64
86
105
126
.7A
.8A
.4A
.2A
A
A
Hills
0
0
0
0
0
0
.733
.738
.740
.751
.757
.763
A, drainage area in square miles
Coastal
69
149
225
362
490
653
.4A
A
A
A
A
A
0
0
0
0
0
0
Plain
.632
.582
.559
.532
.514
.497
Blue Ridge-Piedmont
144A°
248A°
334A°
467A°
581A°
719A°
.691
.670
.665
.655
.650
.643
The equivalent years of record (Hardison, 1971), is the number of years of streamflow record needed to provide an estimate equal in accuracy to that of the regional relation. The accuracy of the regional relations, average standard error of estimate,and equivalent years of record are summarized in table 3.
Table 3.--Accuracy of prediction of the regional flood relationsfor rural streams
Recurrence i nt erva 1 in years
2
5
10
25
50
100
Sandhi
Average standard error of estimate in percent
18
1 7
19
25
29
34
1 Is
Equi va 1 ent years of record
7
12
14
12
14
15
Coastal
Average standard error of estimate in percent
34
34
35
39
43
47
Plain
Equi val ent years of record
4
8
10
13
16
20
Blue Ridge
Average standard error of estimate in percent
38
42
40
44
48
52
-Pi edmont
Equi val ent years of record
2
2
4
5
7
9
17
Determination of Flood Magnitude and Frequency
Regional relations can be used to estimate flood discharges for ungaged sites and improve estimates for gaged sites. For gaged sites, the best estimate of the T-year flood is determined by weighting the regional and station estimates. The station estimate is from a log-Pearson Type III frequency distribution of the observed annual maximum discharges and the Water Resources Council (WRC) weighted skew coefficient. Accuracy, in equivalent years, for the weighted estimate is equivalent to the sum of the accuracy of each estimate, assuming the two estimates are independent.
For ungaged sites, the regional estimate can be improved if the site is located near a site on the same stream having at least 10 years of record. Accuracy of the weighted estimate depends on the relative proximity of the ungaged site to the gaged site. Sites with less than 10 years of record are treated as ungaged sites.
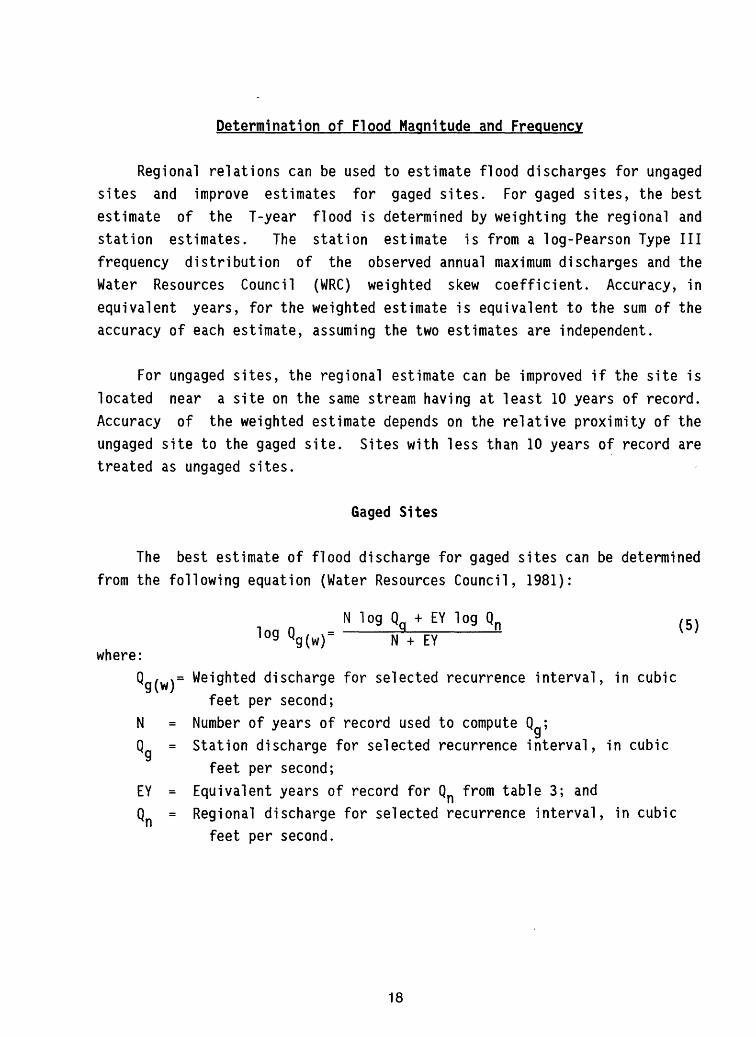
Gaged Sites
The best estimate of flood discharge for gaged sites can be determined from the following equation (Water Resources Council, 1981):
log Q,N log Qn + EY log Qg T Ll IU* ^n (5)
<g(w)~ N + EY where:
Q / »= Weighted discharge for selected recurrence interval, in cubicfeet per second;
N = Number of years of record used to compute Q ; Q = Station discharge for selected recurrence interval, in cubic
feet per second;EY = Equivalent years of record for Qn from table 3; and Q = Regional discharge for selected recurrence interval, in cubic
feet per second.
18
The accuracy of the weighted estimate, Qa ( w \> in equivalent years of record, is equal to N plus EY. Regional and station estimates tend to be independent when the area covered by the regionalization has a radius greater than 100 miles, and the periods of record of the data used in regionalization are long in comparison with that of the station for which the weighted estimate is sought (Water Resources Council, 1981). When estimates are not independent, accuracy is reduced in proportion to the degree of correlation of the estimates. The weighting techniques described in this report assume that regional and station estimates are independant.
Station flood discharges for selected recurrence intervals (2, 5, 10, 25, 50, and 100 years) are presented in table 1 for 264 stations, of which 254 were used for regression analysis. The flood values shown were computed using all available records through 1984 and, thus, supercede values published previously by Jackson (1976).
Ungaged Sites
Flood discharges for ungaged sites are determined by using the value of drainage area in the appropriate regional relation (table 2). Inspection of figures 1 and 2 is also required to determine the correct hydrologic area.
The regional estimate can be improved if the site is located on the same stream as a station with at least 10 years of record. This procedure should only be used to transfer flood discharges if the drainage area of the site is within 50 percent (either greater or less) of that at a gaging station on the same stream. Otherwise, the regional estimate at the ungaged site is the best estimate.
The adjusted estimate, Qu , for an ungaged site can be determined as follows:
19
and a weighted value can be computed by the equation:
0 _ 2M 0 fl _ g u(w) " A gn + (L A
where: Q = Flood discharge at the ungaged site transferred fromthe gaging station by the drainage area ratio, in cubic
feet per second;A = Drainage area of the ungaged site, in square miles; A = Drainage area of the gaging station, in square miles; b = Drainage area exponent of the regional relation for
the applicable hydrologic area and the selected recurrence interval;
Q , % = Weighted flood discharge from the gaging station, incubic feet per second;
Q , % = Weighted flood discharge at the ungaged site, in cubicfeet per second;
AA = Difference in drainage areas of the gaging station andungaged site, in square miles; and
Q = Regional flood discharge at the ungaged site, in cubic feet per second.
Exampi es
Numerical and graphical examples are presented for determining the 100- year flood discharges for an ungaged rural site. The numerical example requires the following steps:
(1) Determine that the site is not significantly affected by artificial regulation or urbanization, channel improvement, diversion, or tide;
(2) Determine the drainage area, A, in square miles, using the best available map (for example, 7.5 minute U. S. Geological Survey topographic maps);
(3) Determine the hydrologic areas (fig. 1 or 2) in which the drainage basin of the site is located; and
(4) Use appropriate equation (table 2) or graphs (figs. 3, 4, and 5).
20
1,000,000
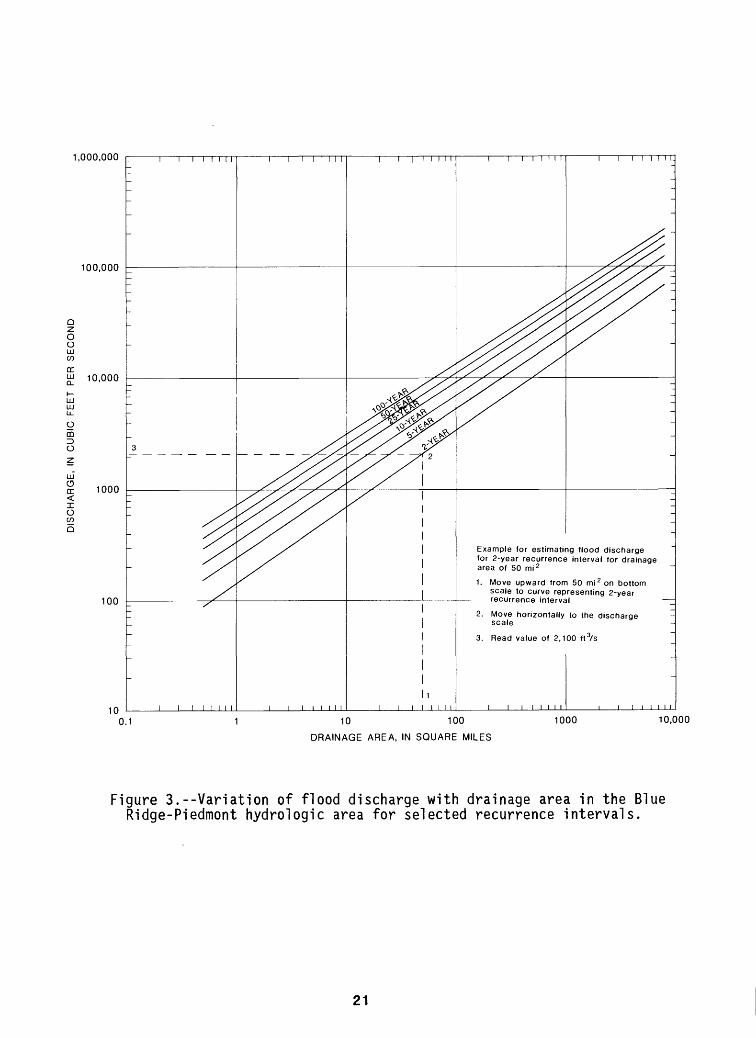
Example for estimating flood discharge for 2-year recurrence interval for drainage area of 50 mi 2
1. Move upward from 50 mi 2 on bottom scale to curve representing 2-year recurrence interval
2. Move horizontally to the discharge scale
3. Read value of 2,100 ftvs
10 100
DRAINAGE AREA, IN SQUARE MILES
1000 10,000
Figure 3.--Variation of flood discharge with drainage area in the Blue Ridge-Piedmont hydrologic area for selected recurrence intervals.
21
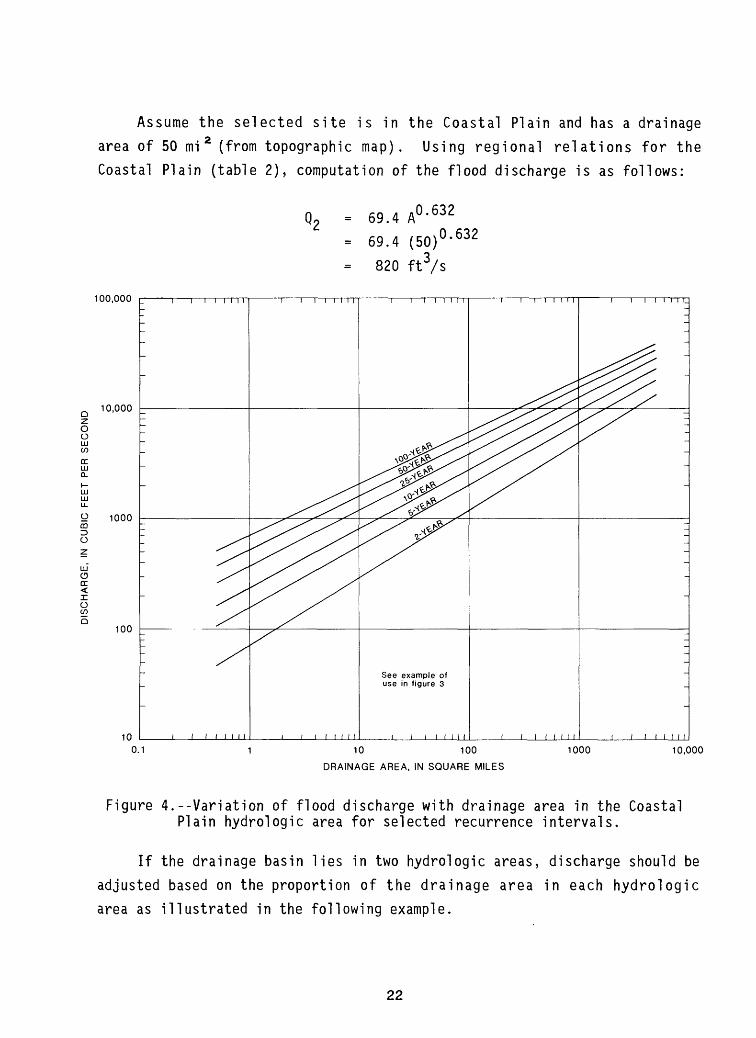
Assume the selected site is in the Coastal Plain and has a drainage
area of 50 mi 2 (from topographic map). Using regional relations for the
Coastal Plain (table 2), computation of the flood discharge is as follows:
100,000
0.632= 69.4 A
= 69.4 (50)
= 820 ft 3/s
0.632
10 100
DRAINAGE AREA, IN SQUARE MILES
1000 10,000
Figure 4.--Variation of flood discharge with drainage area in the Coastal Plain hydrologic area for selected recurrence intervals.
If the drainage basin lies in two hydrologic areas, discharge should be adjusted based on the proportion of the drainage area in each hydrologic area as illustrated in the following example.
22
10,000
o oLLJ CO
a:LD Q.
H LD LU U_
O 00D O
LD Oa: <x oCO
Q
1000
See example of use in figure 3
100
1 10
DRAINAGE AREA, IN SQUARE MILES
100
Figure 5.--Variation of flood discharge with drainage area in the Sand Hills hydrologic area for selected recurrence intervals.
Compute the 100-year flood discharge (Q 100 ) for a gaged site (station
114, fig. 2 and table 1) on the Cape Fear River at Fayetteville, N.C., with
a drainage area of 4,395 mi 2 . This site drains 931 mi 2 of the Coastal Plain
hydrologic area and 3,464 mi 2 of the Blue Ridge-Piedmont hydrologic area.
23
First compute QJQQ assuming that the drainage area is totally within the Blue Ridge-Piedmont and then compute Q 1QO assuming that the drainage area is totally within the Coastal Plain:
Blue Ridge-Piedmont: ,0.643= 719 Av
= 719 (4395)
= 158,000 ft
0.643
Coastal Plain:
- 653 A0 ' 497
= 653 (4395)
= 42,200 ft3
0.497
Adjust QJQQ based on the percentage of the drainage area in each hydrologic area.
Q 100 (adjusted) = Q 10Q Blue Ridge-Piedmont x
- 58,000 x + 42, 200 x
= 125,000 + 8,940
= 134,000 ft3/s (rounded)
+ Q 10Q Coastal Plain
The adjusted Q for this site in which the drainage area is within more than one hydrologic area is 134,000 ft 3/s. This compares to a station discharge (Q ) of a 100-year flood of 122,000 ft 3/s for the site, or within
the standard error of estimate of + 47 percent for the Coastal Plain hydrologic area (table 3).
The regional flood relations for rural streams in the Blue Ridge- Piedmont, Coastal Plain, and Sand Hills hydrologic areas (table 2) are shown in graphical form in figures 3, 4, and 5, respectively. The following example is given to illustrate use of the curves in figure 3 for a hypothetical stream in the Blue Ridge-Piedmont hydrologic area. Steps 1-3 outlined for the preceding numerical examples are also required. The dashed lines in figure 3 indicate the procedure to follow:
24
Assume a drainage area of 50 mi 2 and locate the value on figure 3 on the drainage area scale. For a 2-year flood, move upward to the curve representing the 2-year recurrence interval, then move horizontally to the discharge scale and read a value of about 2100 ft 3/s.
MAGNITUDE AND FREQUENCY OF FLOODS IN URBAN BASINS
This section of the report provides verification of methods for estimating the magnitude and frequency of floods along urban streams only in the Coastal Plain and Piedmont provinces of North Carolina. Applicability of the nationwide relations (Sauer and others, 1983) to the Coastal Plain and Piedmont is of principal interest.
Coastal Plain
Applicability of the nationwide urban flood relations for estimating flood discharges in the Coastal Plain was determined by comparing synthesized flood flows for five urban basins with corresponding nationwide relation estimates. Synthesized flood flows were obtained from a calibrated rainfall-runoff model with historical rainfall data for input.
Five selected basins and some of their characteristics are listed intable 4, and their locations are shown in figure 6. Drainage areas range in
2 size from 1.98 to 9.10 mi , and impervious cover varies from 2 to 30percent. The systematic collection of flood discharge and concurrent rainfall data in these basins began in 1976. Although the length of record at each station varies from 3 to 4 years, from 25 to 35 flood peaks were recorded for each basin. The U.S. Geological Survey rainfall-runoff model developed by Dawdy and others (1972) and as reported by Carrigan (1973) was used to extend the peak discharge records for study sites to a longer, more representative time period.
The general structure of the model is explained in the following paragraph taken from Lichty and Liscum (1978, p. 4):
25
The rainfall-runoff model used in this study is a simplified, conceptual, bulk-parameter, mathematical model of the surface-runoff component of fiood-hydrograph response to storm rainfall (Dawdy, and others, 1972). The model deals with three components of the hydro!ogic cycle antecedent soil moisture, storm infiltration, and surface-runoff routing. The first component simulates soil-moisture conditions at the onset of a storm period through the application of moisture-accounting techniques on a daily cycle. Estimates of daily rainfall, evaporation, and initial values of the moisture-storage variables are elements used in this component. The second component involves an infiltration equation ... and certain assumptions by which rainfall excess is determined on a 5-minute accounting cycle from storm- period rainfall. Storm rainfall may be defined at 5-, 10-, 15-, 30-, or 60-minute intervals, but loss rates and rainfall excess amounts are computed at 5-minute intervals. The third component transforms the simulated time pattern of rainfall excess into a flood hydrograph by translation and linear storage attenuation (Clark, 1945)... For a more complete description of the model, see Dawdy and others (1972).
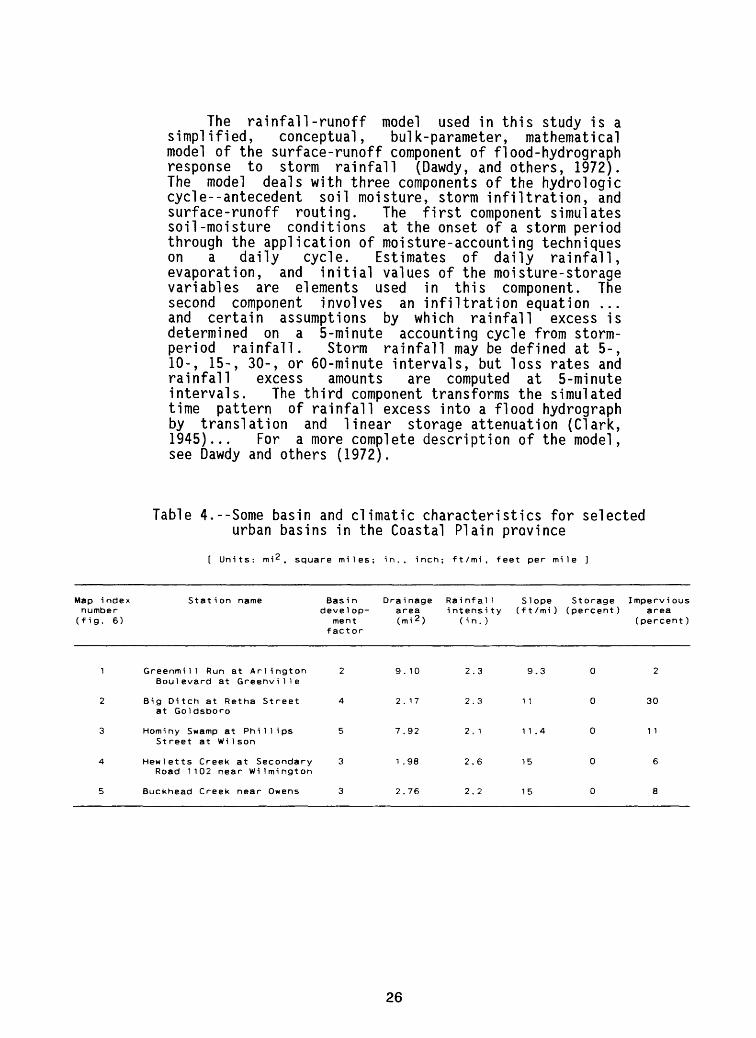
Table 4.--Some basin and climatic characteristics for selected urban basins in the Coastal Plain province
[ Units: mi 2 , square miles; in., inch; ft/mi, feet per mile ]
Map index Station name Basin Drainage Rainfall Slope Storage Imperviousnumber develop- area intensity (ft/mi) (percent) area (fig. 6) ment (mi 2 ) (in.) (percent)
factor
Greenmi11 Run at Arlington 2 9.10 2.3 9.3 0 2 Boulevard at Greenville
Big Ditch at Retha Street 4 2.17 2.3 11 0 30 at Goldsboro
Hominy Swamp at Phillips 5 7.92 2.1 11.4 0 11 Street at Wi1 son
Hewletts Creek at Secondary 3 1.98 2.6 15 0 6 Road 1102 near Wilmington
Buckhead Creek near Owens 3 2.76 2.2 15 0 8
26
ro
EX
PL
AN
AT
ION
6A
U
rban
str
eam
flo
w
stat
ion
and
num
ber
0 20
40
60
80
100 MILES
0 20
40
60
80
100 KILOMETERS
____________I__________________L_
Figure 6
.--L
ocat
ion
of u
rban ba
sin
streamflow s
tations
in th
e Pi
edmo
nt and
Coas
tal
Plain
prov
ince
s.
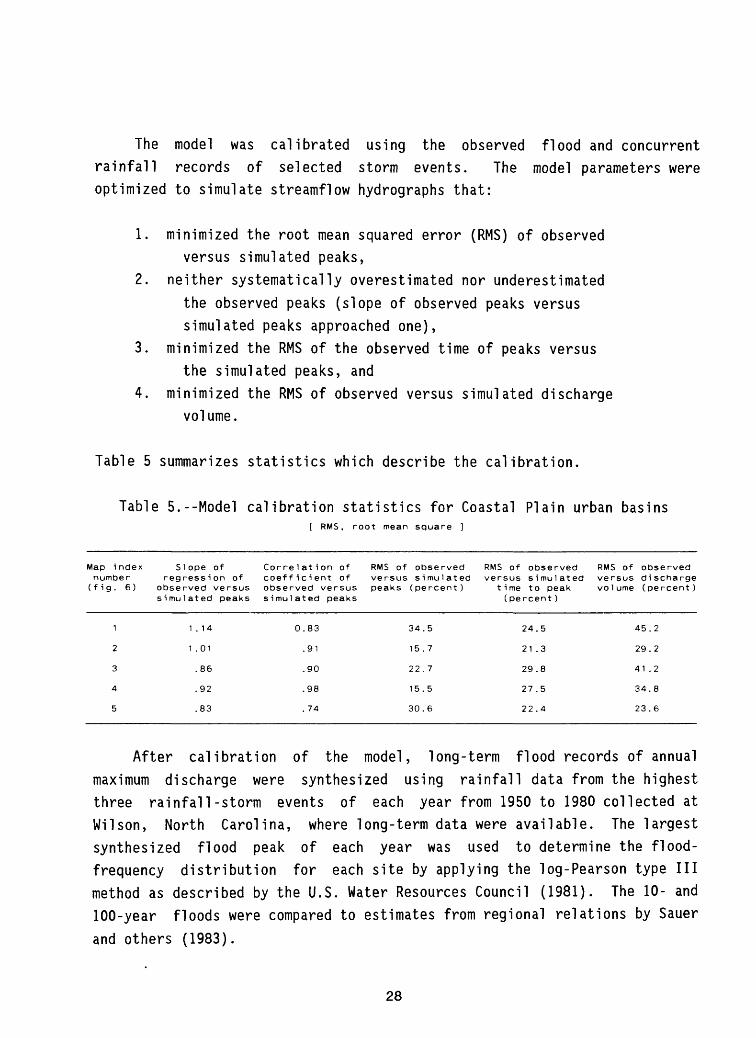
The model was calibrated using the observed flood and concurrent rainfall records of selected storm events. The model parameters were optimized to simulate streamflow hydrographs that:
1. minimized the root mean squared error (RMS) of observed versus simulated peaks,
2. neither systematically overestimated nor underestimated the observed peaks (slope of observed peaks versus simulated peaks approached one),
3. minimized the RMS of the observed time of peaks versus the simulated peaks, and
4. minimized the RMS of observed versus simulated discharge volume.
Table 5 summarizes statistics which describe the calibration.
Table 5.--Model calibration statistics for Coastal Plain urban basins[ RMS, root mean square ]
Map index Slope of Correlation of RMS of observed RMS of observed RMS of observednumber regression of coefficient of versus simulated versus simulated versus discharge(fig. 6) observed versus observed versus peaks (percent) time to peak volume (percent)
simulated peaks simulated peaks (percent)
1
2
3
4
5
1 . 14
1 .01
.86
.92
.83
0.83
.91
.90
.98
. 74
34,
15.
22.
15.
30.
.5
.7
.7
.5
.6
24
21
29,
27,
22.
.5
.3
.8
.5
.4
45.
29.
41 .
34.
23.
.2
.2
.2
,8
,6
After calibration of the model, long-term flood records of annual maximum discharge were synthesized using rainfall data from the highest three rainfall-storm events of each year from 1950 to 1980 collected at Wilson, North Carolina, where long-term data were available. The largest synthesized flood peak of each year was used to determine the flood- frequency distribution for each site by applying the log-Pearson type III method as described by the U.S. Water Resources Council (1981). The 10- and 100-year floods were compared to estimates from regional relations by Sauer and others (1983).
28
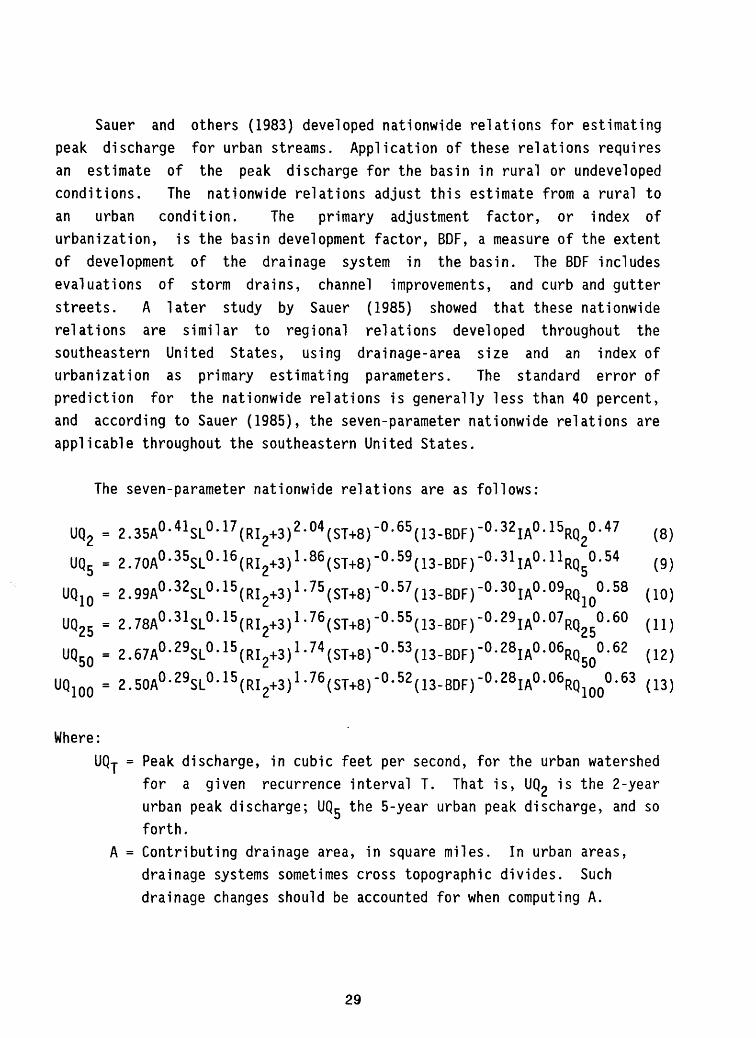
Sauer and others (1983) developed nationwide relations for estimating peak discharge for urban streams. Application of these relations requires an estimate of the peak discharge for the basin in rural or undeveloped conditions. The nationwide relations adjust this estimate from a rural to an urban condition. The primary adjustment factor, or index of urbanization, is the basin development factor, BDF, a measure of the extent of development of the drainage system in the basin. The BDF includes evaluations of storm drains, channel improvements, and curb and gutter streets. A later study by Sauer (1985) showed that these nationwide relations are similar to regional relations developed throughout the southeastern United States, using drainage-area size and an index of urbanization as primary estimating parameters. The standard error of prediction for the nationwide relations is generally less than 40 percent, and according to Sauer (1985), the seven-parameter nationwide relations are applicable throughout the southeastern United States.
The seven-parameter nationwide relations are as follows:
UQ2 = 2.35A°- 41 SL0 - 17 (RI 2+3) 2 - 04 (ST+8)- 0 - 65 (13-BDF)-0 - 32 IA0 - 15RQ2°- 47
UQ5 = 2.70A°- 35SL0 - 16 (RI2+3) 1 - 86 (ST+8)- 0 - 59 (13-BDF)- 0 - 31 IA°- nRQ50 - 54 (9)
UQ1Q = 2.99A0 - 32SL0 - 15 (RI 2+3) 1 - 75 (ST+8)-0 - 57 (13-BDF)-0 - 30 IA0 - 09RQ 1 o°' 58 < 10)
UQ25 = 2.78A0 - 31 SL0 - 15 (RI2+3) 1 - 76 (ST+8)-°- 55 (13-BDF)- 0 - 29 IA0 - 07RQ250 - 60 (11)
UQ50 = 2.67A0 - 29SL0 - 15 (RI2+3) 1 - 74 (ST+8)-°- 53 (13-BDF)-0 - 28IA0 - 06RQ5o0-62 < 12 )
UQ100 = 2.50A0 - 29SL0 - 15 (RI 2+3) 1 - 76 (ST+8)- 0 - 52 (13-BDF)-°- 28 IA0 - 06RQ1000 - 63 (13)
Where:UQj = Peak discharge, in cubic feet per second, for the urban watershed
for a given recurrence interval T. That is, UQ« is the 2-year urban peak discharge; UQr the 5-year urban peak discharge, and so forth.
A = Contributing drainage area, in square miles. In urban areas, drainage systems sometimes cross topographic divides. Such drainage changes should be accounted for when computing A.
29
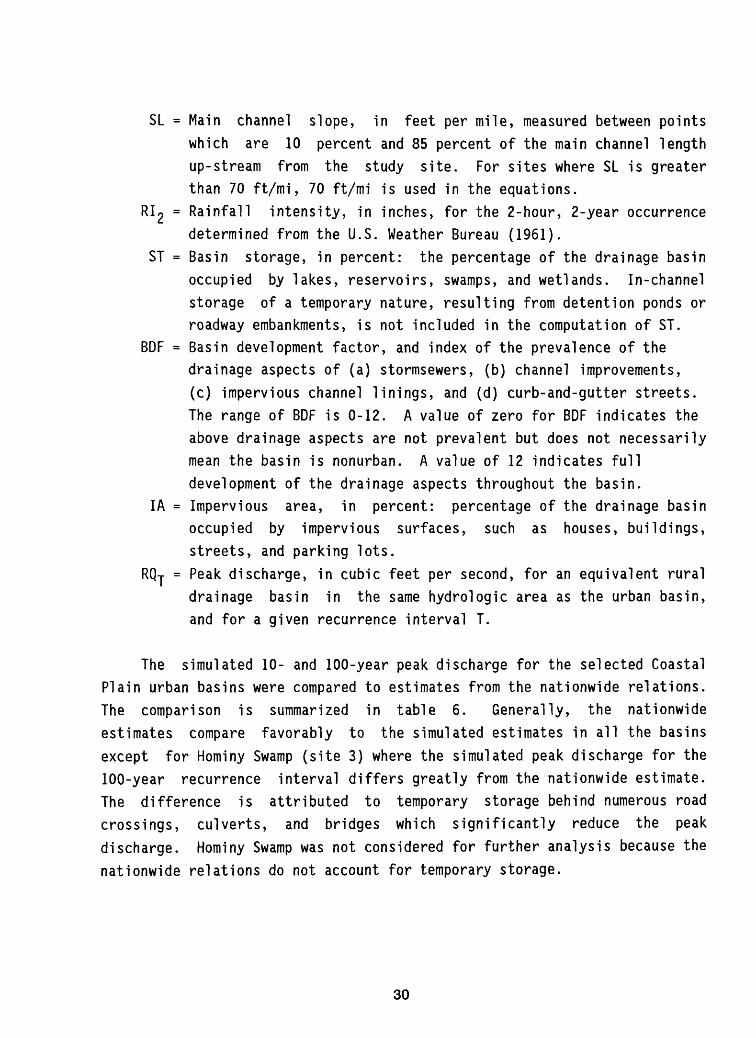
SL = Main channel slope, in feet per mile, measured between points which are 10 percent and 85 percent of the main channel length up-stream from the study site. For sites where SL is greater than 70 ft/mi, 70 ft/mi is used in the equations.
RI2 = Rainfall intensity, in inches, for the 2-hour, 2-year occurrencedetermined from the U.S. Weather Bureau (1961).
ST = Basin storage, in percent: the percentage of the drainage basin occupied by lakes, reservoirs, swamps, and wetlands. In-channel storage of a temporary nature, resulting from detention ponds or roadway embankments, is not included in the computation of ST.
BDF = Basin development factor, and index of the prevalence of the drainage aspects of (a) stormsewers, (b) channel improvements, (c) impervious channel linings, and (d) curb-and-gutter streets. The range of BDF is 0-12. A value of zero for BDF indicates the above drainage aspects are not prevalent but does not necessarily mean the basin is nonurban. A value of 12 indicates full development of the drainage aspects throughout the basin.
IA = Impervious area, in percent: percentage of the drainage basin occupied by impervious surfaces, such as houses, buildings, streets, and parking lots.
RQj = Peak discharge, in cubic feet per second, for an equivalent rural drainage basin in the same hydro!ogic area as the urban basin, and for a given recurrence interval T.
The simulated 10- and 100-year peak discharge for the selected Coastal Plain urban basins were compared to estimates from the nationwide relations. The comparison is summarized in table 6. Generally, the nationwide estimates compare favorably to the simulated estimates in all the basins except for Hominy Swamp (site 3) where the simulated peak discharge for the 100-year recurrence interval differs greatly from the nationwide estimate. The difference is attributed to temporary storage behind numerous road crossings, culverts, and bridges which significantly reduce the peak discharge. Hominy Swamp was not considered for further analysis because the nationwide relations do not account for temporary storage.
30
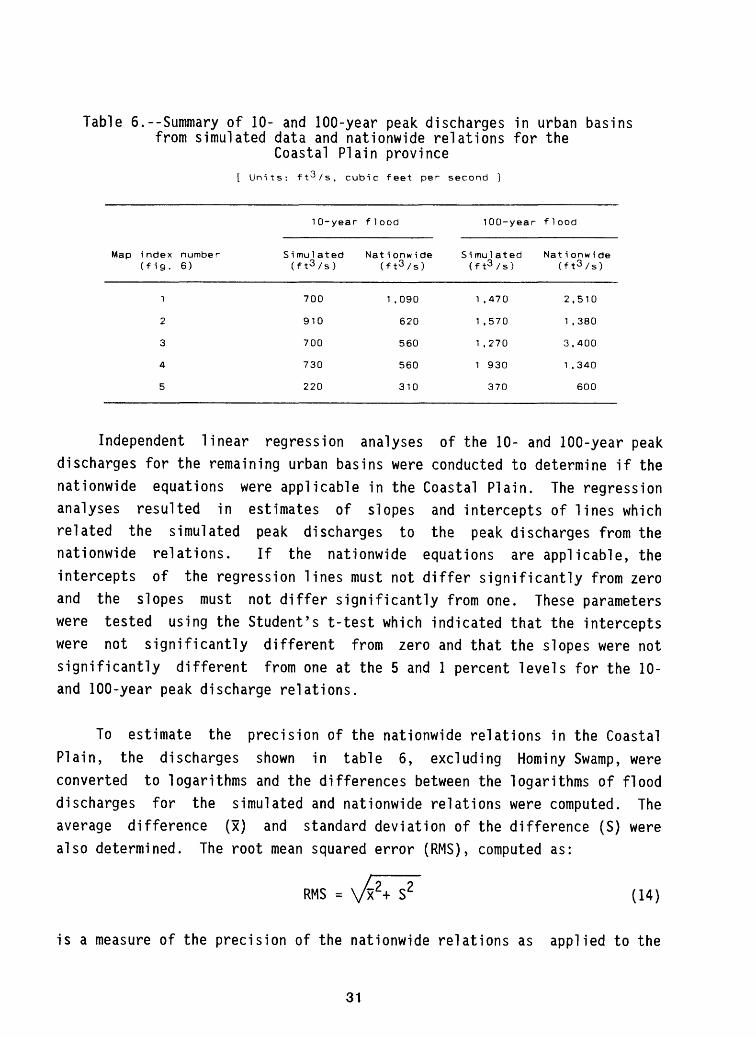
Table 6.--Summary of 10- and 100-year peak discharges in urban basins from simulated data and nationwide relations for the
Coastal Plain province[ Units: ft 3 /s, cubic feet per second ]
Map index number (fig. 6)
1
2
3
4
5
1 0-year
Simul ated (ft3 /s)
700
910
700
730
220
flood
Nat i onwi de (ft3 /s)
1 ,090
620
560
560
310
1 00-year
Si mu 1 ated (f t3 /s)
1 ,470
1 ,570
1 ,270
1 930
370
flood
Nat i onw i de (ft3 /s)
2,510
1 ,380
3,400
1 .340
600
Independent linear regression analyses of the 10- and 100-year peak discharges for the remaining urban basins were conducted to determine if the nationwide equations were applicable in the Coastal Plain. The regression analyses resulted in estimates of slopes and intercepts of lines which related the simulated peak discharges to the peak discharges from the nationwide relations. If the nationwide equations are applicable, the intercepts of the regression lines must not differ significantly from zero and the slopes must not differ significantly from one. These parameters were tested using the Student's t-test which indicated that the intercepts were not significantly different from zero and that the slopes were not significantly different from one at the 5 and 1 percent levels for the 10- and 100-year peak discharge relations.
To estimate the precision of the nationwide relations in the Coastal Plain, the discharges shown in table 6, excluding Hominy Swamp, were converted to logarithms and the differences between the logarithms of flood discharges for the simulated and nationwide relations were computed. The average difference (x) and standard deviation of the difference (S) were also determined. The root mean squared error (RMS), computed as:
RMS = (14)
is a measure of the precision of the nationwide relations as applied to the
31
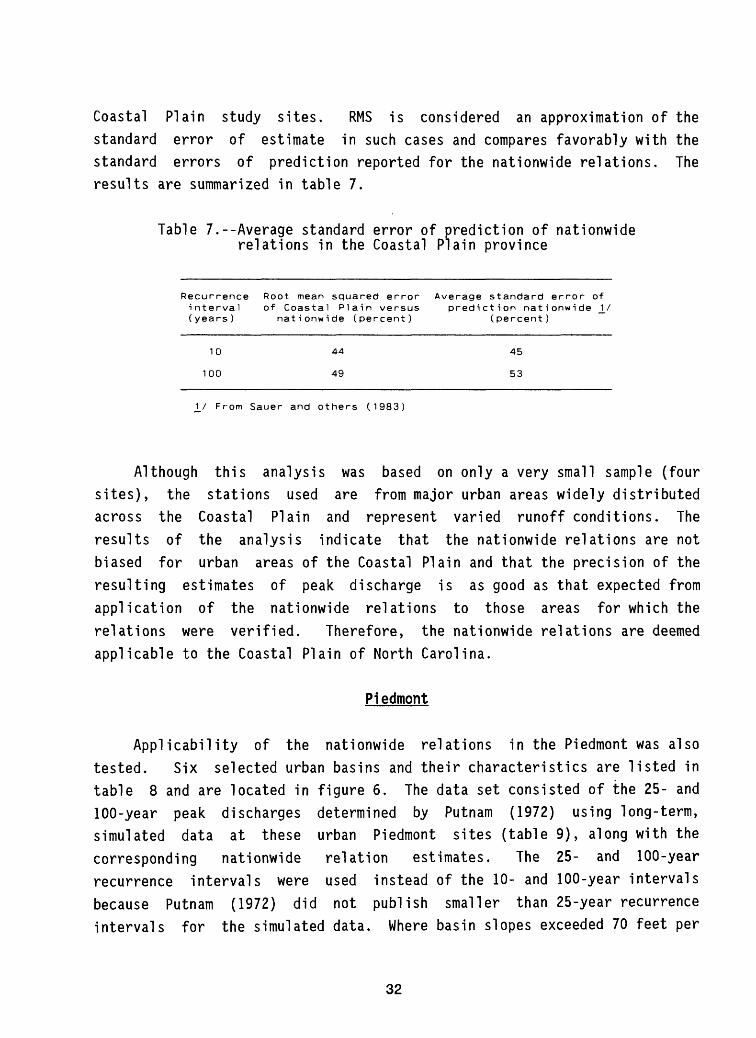
Coastal Plain study sites. RMS is considered an approximation of the standard error of estimate in such cases and compares favorably with the standard errors of prediction reported for the nationwide relations. The results are summarized in table 7.
Table /.--Average standard error of prediction of nationwide relations in the Coastal Plain province
Recurrence Root mean squared error Average standard error ofinterval of Coastal Plain versus prediction nationwide J_/(years) nationwide (percent) (percent)
10
100
44
49
45
53
1/ From Sauer and others (1983)
Although this analysis was based on only a very small sample (four sites), the stations used are from major urban areas widely distributed across the Coastal Plain and represent varied runoff conditions. The results of the analysis indicate that the nationwide relations are not biased for urban areas of the Coastal Plain and that the precision of the resulting estimates of peak discharge is as good as that expected from application of the nationwide relations to those areas for which the relations were verified. Therefore, the nationwide relations are deemed applicable to the Coastal Plain of North Carolina.
Piedmont
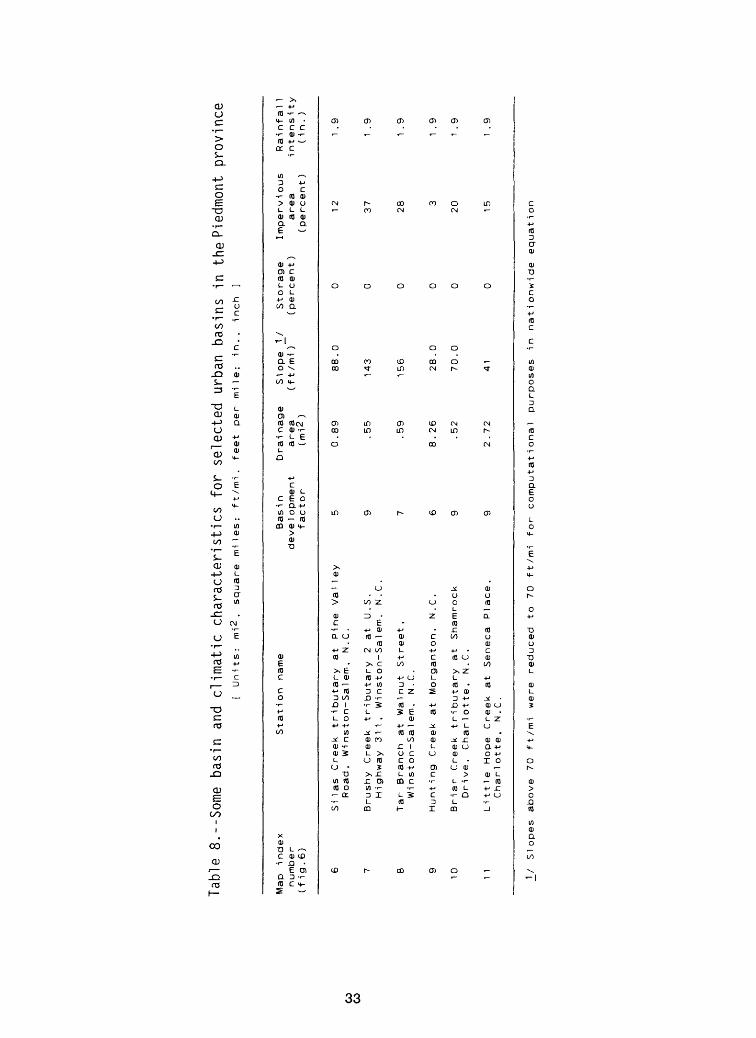
Applicability of the nationwide relations in the Piedmont was also tested. Six selected urban basins and their characteristics are listed in table 8 and are located in figure 6. The data set consisted of the 25- and 100-year peak discharges determined by Putnam (1972) using long-term, simulated data at these urban Piedmont sites (table 9), along with the corresponding nationwide relation estimates. The 25- and 100-year recurrence intervals were used instead of the 10- and 100-year intervals because Putnam (1972) did not publish smaller than 25-year recurrence intervals for the simulated data. Where basin slopes exceeded 70 feet per
32
CO
Tabl
e 8.
--So
me ba
sin
and
climatic characteristics
for
sele
cted
urban
basi
ns in
th
e Piedmont pr
ovin
ce[ Units: mi^, square miles; ft/mi, feet per mile; in., inch
]
Map index
Station name
Basin
Drainage
Slope 1/
Storage
number
development
area
(ft/mi)
(percent)
(fig. 6)
factor
(mi2 )
6 Silas Creek tributary at Pine Valley
5 0.89
88.0
0 Road, Wi
nston-Sal em, N.C.
7 Brushy Creek tributary
2 at U.S.
9 .55
143
0 Highway 311, Wi nston-Sa 1 em
, N.C.
8 Tar Branch at Walnut Street,
7 .59
156
0 Wi
nston-Sa 1 em, N.C.
9 Hunting Creek at Morganton. N.C.
6 8.26
28.0
0
10
Briar Creek tributary at Shamrock
9 .52
70.0
0 Drive ,
Charl otte ,
N.C.
11
Little Hope Creek at Seneca Place,
9 2.72
41
0 Charl otte ,
N.C.
Impervious
Rainfall
area
i ntens i ty
(percent )
(in.)
12
1.9
37
1.9
28
1 .9
3 1 .9
20
1.9
15
1.9
_]_/
Slopes above 70 ft/mi were reduced to 70 ft/mi for computational purposes in nationwide equation
mile, the slope was set at 70 feet per mile for calculations, which is consistant with the usage recommended by Sauer and others (1983).
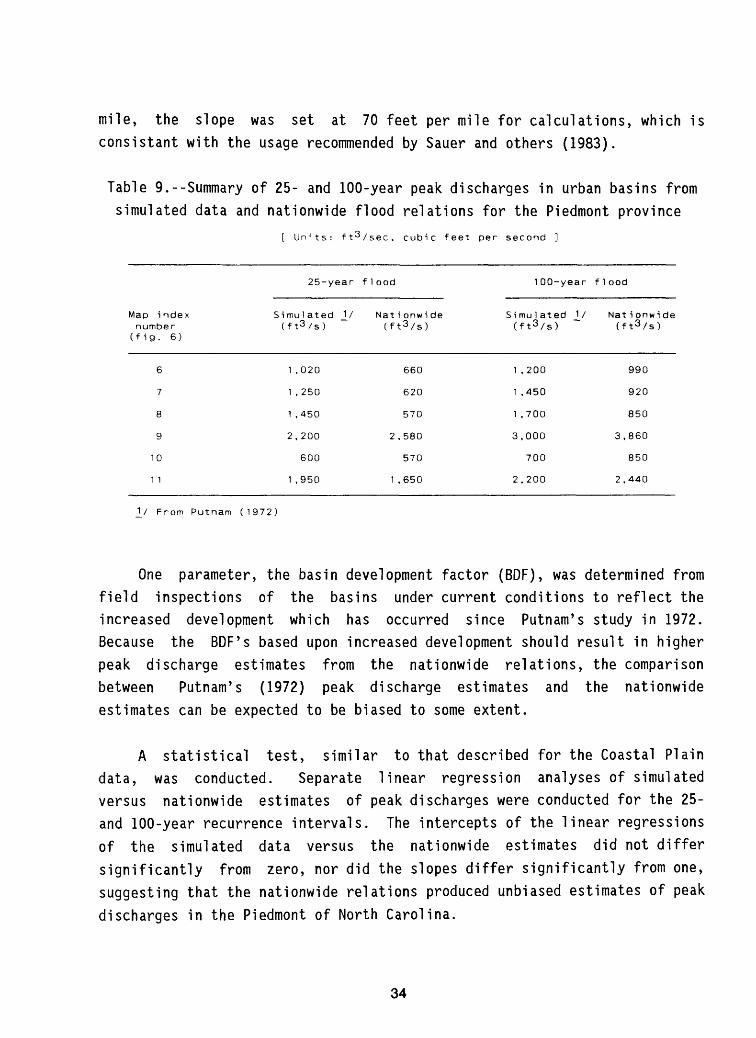
Table 9.--Summary of 25- and 100-year peak discharges in urban basins from simulated data and nationwide flood relations for the Piedmont province
[ Units: ft 3 /sec, cubic feet per second ]
Map index number (fig. 6)
6
7
8
9
10
1 1
25-year
Si mu 1 ated 1 / (f t 3 /s)
1 ,020
1 ,250
1 ,450
2, 200
600
1 ,950
flood
Nat i onw i de (ft 3 /s)
660
620
570
2,580
570
1 .650
100-year
Si mu 1 ated 1 / (ft3/ s )
1 ,200
1 ,450
1 ,700
3,000
700
2,200
flood
Nat i onw i de (ft 3 /s)
990
920
850
3,860
850
2,440
1/ From Putnam ( 1972)
One parameter, the basin development factor (BDF), was determined from field inspections of the basins under current conditions to reflect the increased development which has occurred since Putnam's study in 1972. Because the BDF's based upon increased development should result in higher peak discharge estimates from the nationwide relations, the comparison between Putnam*s (1972) peak discharge estimates and the nationwide estimates can be expected to be biased to some extent.
A statistical test, similar to that described for the Coastal Plain data, was conducted. Separate linear regression analyses of simulated versus nationwide estimates of peak discharges were conducted for the 25- and 100-year recurrence intervals. The intercepts of the linear regressions of the simulated data versus the nationwide estimates did not differ significantly from zero, nor did the slopes differ significantly from one, suggesting that the nationwide relations produced unbiased estimates of peak discharges in the Piedmont of North Carolina.
34
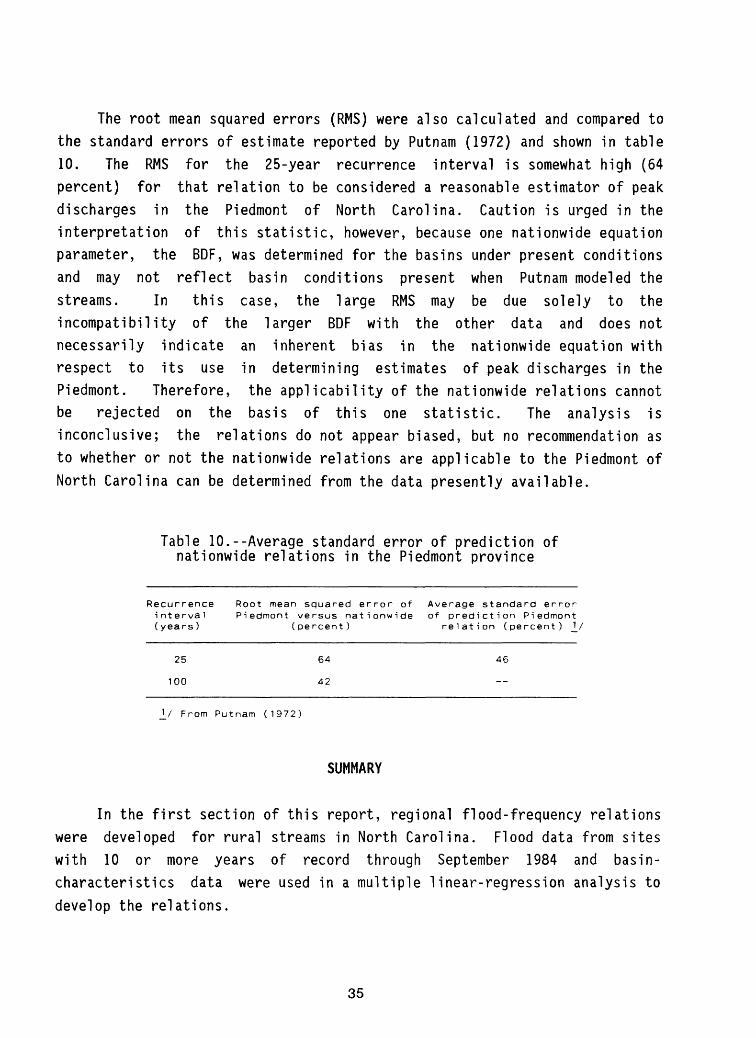
The root mean squared errors (RMS) were also calculated and compared to the standard errors of estimate reported by Putnam (1972) and shown in table 10. The RMS for the 25-year recurrence interval is somewhat high (64 percent) for that relation to be considered a reasonable estimator of peak discharges in the Piedmont of North Carolina. Caution is urged in the interpretation of this statistic, however, because one nationwide equation parameter, the BDF, was determined for the basins under present conditions and may not reflect basin conditions present when Putnam modeled the streams. In this case, the large RMS may be due solely to the incompatibility of the larger BDF with the other data and does not necessarily indicate an inherent bias in the nationwide equation with respect to its use in determining estimates of peak discharges in the Piedmont. Therefore, the applicability of the nationwide relations cannot be rejected on the basis of this one statistic. The analysis is inconclusive; the relations do not appear biased, but no recommendation as to whether or not the nationwide relations are applicable to the Piedmont of North Carolina can be determined from the data presently available.
Table 10.--Average standard error of prediction of nationwide relations in the Piedmont province
Recurrence Root mean squared error of Average standard errorinterval Piedmont versus nationwide of prediction Piedmont(years) (percent) relation (percent) ]_/
25 64 46
100 42
_J_/ From Putnam (1972)
SUMMARY
In the first section of this report, regional flood-frequency relations were developed for rural streams in North Carolina. Flood data from sites with 10 or more years of record through September 1984 and basin- characteristics data were used in a multiple linear-regression analysis to develop the relations.
35
Guidelines and procedures recommended by the U.S. Water Resources Council (1981) were used in the flood-frequency analysis. The Pearson Type III distribution with log transformation of the annual maximum discharges was used as the basic distribution. Multiple regressions were first run on a statewide basis by using flood discharges and basin characteristics; plots of residual errors showed regional patterns in three hydrologic areas: (1) Blue Ridge-Piedmont, (2) Coastal Plain, and (3) Sand Hills. Regional flood relations were developed for each of these areas.
Regional relations showed peak discharges as a function of drainage area. The inclusion of other basin and climatic characteristics in the relations reduced the average standard error of estimate only about 2 percent for all hydrologic areas. Average standard error of estimate of the regional relations was 24 percent for the Sand Hill hydrologic area, 39 percent for the Coastal Plain hydrologic area, and 44 percent for the Blue Ridge-Piedmont hydrologic area. Accuracy of the estimates in terms of equivalent years of record is provided. Methods were described to adjust peak discharge estimates at gaged and ungaged sites based on the weighting of regional and station estimates. Rural flood relations provided in this report are applicable to streams that are not significantly affected by tide or by development effects such as regulation or urbanization.
In the second section of this report, test of the applicability of nationwide relations by Sauer and others (1983) to Coastal Plain andPiedmont areas in North Carolina were described. Rainfall-runoff data for
2 basins in the Coastal Plain, ranging in size from 1.98 to 9.10 mi and inimpervious area from 2 to 30 percent, were used to calibrate rainfall-runoff models for each basin. Long-term rainfall data (1950-80) for the National Weather Service station in Wilson, North Carolina, were used to synthesize annual peak discharges for each basin. Synthesized peak discharges were used in developing a flood-frequency distribution for each site.
The flood-frequency distribution was compared to the nationwide relations (Sauer and others, 1983). The standard error of estimate was 44 percent for the 10-year flood and 49 percent for the 100-year flood.
36
Although the data base used in this comparison was limited, the nationwide relations are deemed applicable to urban areas of the Coastal Plain within reasonable limits of accuracy.
The nationwide relations were also compared with observed data from six sites from Putnam (1972) in the Piedmont. The standard error of estimate for the comparison was 64 and 42 percent for the 25- and 100-year floods, respectively. No recommendation as to the applicability of the nationwide relations can be determined from the data presently available.
37
SELECTED REFERENCES
Carney, C.B., 1960, Climates of the states North Carolina: U.S. Weather Bureau, Climatography of the United States no. 60-31, 20 p.
Carrigan, P.M., Jr., 1973, Calibration of U. S. Geological Survey rainfall- runoff model for peak flow synthesis natural basins: U.S. Geological Survey Open-File Report, Reston, Virginia, 109 p.
Clark, C.O., 1945, Storage and the unit hydrograph: American Society of Civil Engineers Transactions, v. 110, p. 1419-1488.
Dalrymple, T., 1960, Flood-frequency analysis: U.S. Geological Survey Water-Supply Paper 1543-A, 80 p.
Daniels, R.B., Kleiss, H.J., Buol, S.W., Byrd, H.J., and Phillips, J.A., 1984, Soil systems in North Carolina: North Carolina State University, North Carolina Agricultural Research Service, Bulletin 467, p. 14.
Dawdy, D.R., Lichty, R.W., and Bergmann, J.M., 1972, A rainfall-runoff simulation model for estimation of flood peaks for small drainage basins: U.S. Geological Survey Professional Paper 506-B, 28 p.
Eder, B.K., Davis, J.M., and Robinson, P.J., 1983, Variations in monthly precipitation over North Carolina: University of North Carolina, Water Resources Research Institute, Report no. 185, 50 p.
Fenneman, N.M., 1938, Physiography of eastern United States: New York, McGraw-Hill Book Company, Inc., 714 p.
Goddard, G.C., Jr., Jackson, N.M., Jr., Hubbard, E.F., and Hinson, H.G., 1970, A proposed streamflow data program for North Carolina: U.S. Geological Survey Open-File Report.
Hardison, C.H., 1971, Prediction error of regression estimates of streamflow characteristics at ungaged sites: U.S. Geological Survey Professional Paper 750-C, p. C228-C236.
38
Hinson, H.G., 1965, Floods on small streams in North Carolina, Probable magnitude and frequency: U.S. Geological Survey Circular 517, 7 p.
Jackson, N.M., Jr., 1976, Magnitude and frequency of floods in North Carolina: U.S. Geological Survey Water-Resources Investigations Report 76-17.
Kirby, W., 1979, Log-Pearson Type III flood-frequency analysis using guidelines of Water Resources Council (Program J407): U.S. Geological Survey WATSTORE user's guide, v. 4, chap. I-C.
Kopec, R.J., and Clay, J.W., 1975, Climate and air quality (chap. 5) in North Carolina atlas, Portrait of a changing southern state: The University of North Carolina Press, Chapel Hill, p. 92-111.
Langbein, W.B., and Iseri, K.T., 1960, General introduction and hydrologic definitions: U.S. Geological Survey Water-Supply Paper 1541-A, 29 p.
Lee, W.D., 1955, The soils of North Carolina, their formation, identification, and use: North Carolina Agricultural Experiment Station, Technical Bulletin no 115, pi. 1.
Lichty, R.W., and Liscum, Fred, 1978, A rainfall-runoff modeling procedure for improving estimates of T-year annual floods for small drainage basins: U.S. Geological Survey Water-Resources Investigations 78-7, 44 p.
Lutz, J.F., 1969, The movement and storage of water in North Carolina soils and the role of the soil in determining water quality: University of North Carolina, Water Resources Research Institute Report no. 24, 43 p.
Putnam, A.L., 1972, Effects of urban development on floods in the Piedmont province of North Carolina: U.S. Geological Survey Open-File Report.
Sauer, V.B., 1985, New studies of urban flood frequency in the southeastern U. S., paper presented at 1985 International Symposium on Urban Hydrology at Lexington, Kentucky.
39
Sauer, V.B., Thomas, W.O., Jr., Stricker, V.A., and Wilson, K.V., 1983, Flood characteristics of urban watersheds in the United States- Techniques for estimating magnitude and frequency of urban floods: U.S. Geological Survey Water-Supply Paper 2207, 103 p.
Speer, P.R., and Gamble, C.R., 1964a, Magnitude and frequency of floods in the United States, Part 2-A, South Atlantic Slope basins, James River to Savannah River: U.S. Geological Survey Water-Supply Paper 1673, 329 p.
___1964b, Magnitude and frequency of floods in the United States, Part 3-B, Cumberland and Tennessee River basins: U.S. Geological Survey Water-Supply Paper 1676, 339 p.
___1965, Magnitude and frequency of floods in the United States, Part3-A, Ohio River basin except Cumberland and Tennessee River basins:U.S. Geological Survey Water-Supply Paper 1675, 630 p.
Stuckey, J.L., 1965, North Carolina--its geology and mineral resources: North Carolina Department of Conservation and Development, North Carolina State University Print Shop, Raleigh, N.C., 550 p.
U.S. Water Resources Council, 1981, Guidelines for determining flood flow frequency: U.S. Water Resources Council Bulletin 17B, 183 p.
U.S. Weather Bureau, 1961, Rainfall frequency atlas of the United States: Technical Paper no. 40, p. 39.
40
GLOSSARY
Some of the technical terms used in this report are defined here for convenience. See Dalrymple (1960) and Langbein and Iseri (1960) for additional information regarding flood-frequency analyses and associated hydrologic terminology. Statistical terms are defined with respect to flood analysis applications described in this report.
Annual peak discharge: The highest peak discharge in a water year, in cubic feet per second.
Basin characteristics: Parameters that describe the physical and climatic factors of a drainage basin. Parameters used in this study include drainage area, channel length and slope, storage, soil-infiltration index, mean annual precipitation, and rainfall intensity.
Basin development factor (BDF): An index of the prevalence of the drainage aspects of (a) storm sewers, (b) channel improvements, (c) impervious channel linings, and (d) curb-and-gutter streets. The range of BDF is 0-12. A value of zero for BDF indicates the above drainage aspects are not prevalent but does not necessarily mean the basin is nonurban. A value of 12 indicates full development of the drainage aspects throughout the basin.
Basin length (L): The length, in miles, measured on topographic maps along the main channel from the gaging station to the basin divide.
Bias: Systematic error or tendency to either over- or underestimate the true value.
Channel slope (SL): The main channel slope, in feet per mile, measuredbetween points which are 10 percent and 85 percent of the main channellength upstream from the study site. For urban sites where SL is greaterthan 70 ft/mi, 70 ft/mi is used in the equations.
Crest-stage gage: A device for recording the elevation of the flood crest or peak of a stream.
41
Pi stri bution: Function describing the relative frequency with which events of various magnitudes occur.
Drainage area (A): The drainage area of a stream, in square miles, at a specified location is that area, measured in a horizontal plane, which is enclosed by a drainage divide. In urban areas, drainage systems sometimes cross topographic divides. Such drainage changes should be accounted for when computing A.
Equivalent years of record: Number of years of stream-flow record that would be necessary to produce a flood-frequency estimate with accuracy equal to that of the regression analysis.
Exceedence probability: Probability that a random event will exceed a specified magnitude in a given time period, usually one year unless otherwise indicated. Recurrence interval is computed as the inverse of exceedence probability.
F1 ood: An overflow or inundation that comes from a river or other body of water and causes or threatens damage. Any relatively high streamflow overtopping the natural or artificial banks in any reach of a stream.
Generalized skew coefficient (G): A skew coefficient of logarithms of annual maximum discharges derived by a procedure which integrates values obtained at many locations.
Impervious area (IA): The percentage of the drainage basin occupied by impervious surfaces, such as houses, buildings, streets, and parking lots.
Lag time: Time, in hours, computed as the time from center-of-mass of rainfall excess to the center-of-mass of the corresponding runoff. Computed only for stations having continuous rainfall and runoff data.
Logarithmic mean (M): The mean of logarithms of annual maximum discharges
for a gaging station.
42
Mean (x): The value obtained by dividing the sum of a series of values by the number of values in the series.
Multiple correlation coefficient: A measure of the explanatory power of a regression involving three or more hydrologic variables.
Outlier: A nonrepresentative annual peak discharge event.
Rainfall intensity (RU): Rainfall intensity, in inches, for the 2-hour, 2-
year occurrence. Determined from U.S. Weather Bureau (1961).
Recurrence interval (return period): The average interval of time within which the given flood will be exceeded at least once.
Residual: The difference between a station value and a value predicted by a regression equation.
Root mean squared (RMS): An approximation of the standard error of prediction resulting from application of a regression equation to an independent data set not used to develop the regression.
Rural maximum discharge (RQj): The maximum discharge, in cubic feet per
second, for an equivalent rural drainage basin in the same hydrologic area as the urban basin and for recurrence interval T . For this study equivalent
rural discharges were computed from applicable Geological Survey regional flood-frequency reports, as indicated in table 1.
Skew coefficient: Relative measure of the asymmetry of a flood-frequency distribution.
Soil infiltration index (SI): An index to soil infiltration capacity in inches per hour. The soil indices were determined from soil samples collected, analyzed, and reported by Lutz (1969), and generalized on the basis of a map showing soil types throughout the State, prepared by Lee (1955).
43
Standard deviation (S); A measure of the amount of variation in a sample. The standard deviation is determined by taking the square root of the average squared deviations of the observations from the mean.
Standard error of estimate: A measure of the reliability of a regression equation. In this report, the standard error is given as an average percent value representing the average range about the regression equation that includes about 68 percent of all regression data points. More technically, the standard error is the standard deviation of the residuals about the regression equation.
Standard error of prediction: A measure of how well the regression equation will estimate the dependent variables at locations other than calibration sites.
Station skew coefficient (G): A numerical measure or index of the lack of symmetry in a distribution of the logarithms of the annual maximum discharges for a gaging station.
Streamflow station: A gaging station where a record of discharge of a stream is obtained. Within the Geological Survey, this term is used only for those gaging stations where a continuous record of discharge is obtained.
Stream length: Distance in miles measured on topographic maps along the main channel from the gaging station to the basin divide.
Student's "t" test: A standard statistical test frequently used to determine the significance of a deviation of an individual parameter from a
specified value.
Water year: The 12-month period beginning October 1 and ending September 30 and designated by the calender year in which it ends.
Weighted means: A value obtained by multiplying each of a series of values by its assigned weight and dividing the sum of those products by the sum of
weights.
44
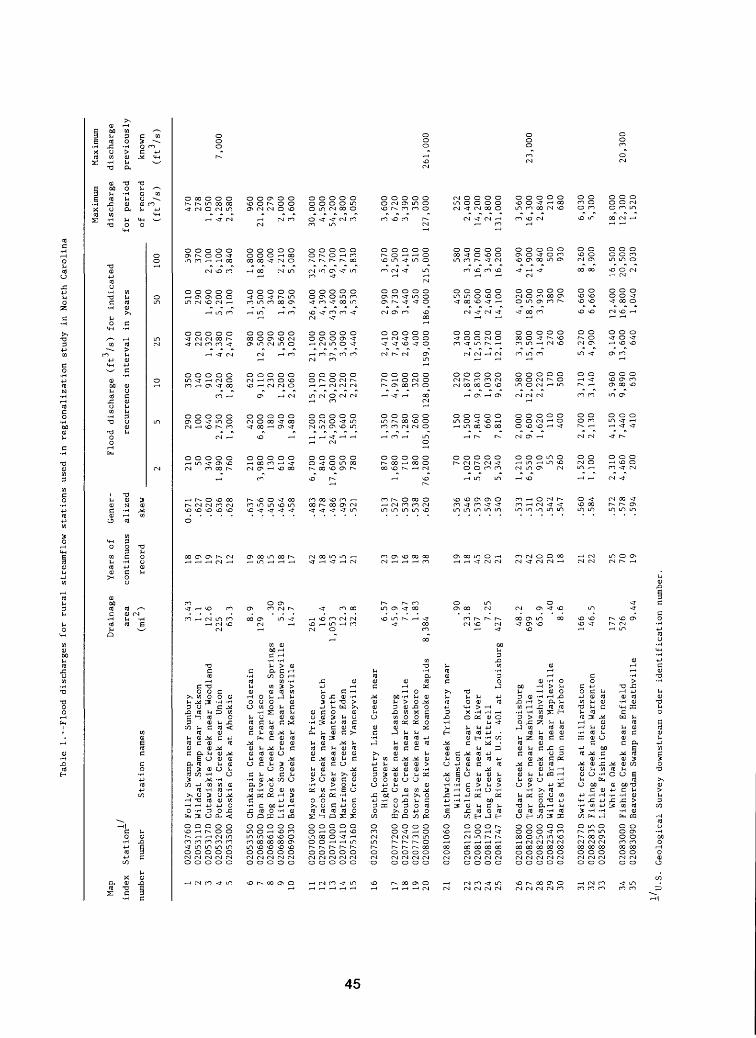
Table 1.--Flood discharges for
rural streamflow stations used in regionalization study in North Carolina
Ol
Map
Drainage
Years of
Gener-
index
Station
area
continuous
alized
number
number
Station names
(mi
) record
skew
1 2 3 4 5 6 7 8 9 10 11 12 13 14 15 16 17 18 19 20 21 22 23 24 25 26 27 28 29 30 31 32 33 34 35
02043760
02053110
02053170
0205
3200
0205
3500
02053550
0206
8500
0206
8610
02068660
02069030
02070500
02070810
02071000
02071410
02075160
02075230
02077200
02077240
0207
7310
02080500
02081060
02081210
0208
1500
02081710
02081747
0208
1800
02082000
02082500
02082540
02082630
02082770
0208
2835
02082950
0208
3000
0208
3090
Folly Swamp near Sunbury
Wildcat Swamp near Jackson
Cutawiskie Creek near Woodland
Potecasi Creek near Union
Ahoskie Creek at
Ahoskie
Chinkapin Creek near Colerain
Dan River near Francisco
Hog Rock Creek near Moores Springs
Little Snow Creek near Lawsonville
Belews Creek near Kernersville
Mayo River near Price
Jacobs Creek near Wentworth
Dan River near Wentworth
1Matrimony Creek near Eden
Moon Creek near Yanceyville
South Country Line Creek near
Hightowers
Hyco Creek near Leasburg
Double Creek near Roseville
Storys Creek near Roxboro
Roanoke River at Roanoke Rapids
8
Smithwick Creek Tributary near
Williamston
Shelton Creek near Oxford
Tar River near Tar River
Long Creek at Kittrell
Tar
River at
U.S. 40
1 at Louisburg
Cedar Creek near Louisburg
Tar
River near Nashville
Sapony Creek near Nashville
Wild
cat
Branch ne
ar Ma
plev
ille
Harts Mill Run near Tarboro
Swift Creek at Hillardston
Fishing Creek near Warrenton
Little Fishing Creek near
White Oa
kFishing Creek near Enfield
Beaverdam Swamp near Heathville
3.43
1.1
12.6
225 63.3 8.9
129.3
05.
2914
.7
261 16.4
,053 12
.332.8 6.57
45.9 7.47
1.83
,384
.90
23.8
167 7.
2542
7 48.2
699 65.9 .4
08.
6
166 46.5
177
526 9.
44
18 19 19 27 12 19 58 15 18 17 42 18 45 15 21 23 19 16 18 38 19 18 45 20 21 23 42 20 20 18 21 22 25 70 19
0.671
.627
.620
.636
.628
.637
.456
.450
.464
.458
.483
.478
.486
.493
.521
.513
.527
.530
.538
.620
.536
.546
.539
.549
.540
.533
.511
.520
.542
.547
.560
.584
.572
.578
.594
3 Flood discharge (ft
/s)
for
indicated
recurrence interval in
years
2 210 50 340
1,890
760
210
3,980
130
610
840
6,700
840
17,6
00 950
780
870
1,680
710
180
76,200 70
1,020
5,070
320
5,340
1,210
6,550
910 55 260
1,520
1,100
2,310
4,460
200
5 290
100
640
2,750
1,300
420
6,800
180
940
1,480
11,2
001,520
24,9
001,640
1,550
1,350
3,370
1,280
260
105,000
150
1,500
7,840
660
7,810
2,000
9,600
1,620
110
400
2,700
2,130
4,150
7,440
410
10 350
140
910
3,420
1,800
620
9,110
230
1,200
2,060
15,1
002,170
30,2
002,220
2,27
0
1,770
4,910
1,800
320
128,000
220
1,870
9,830
1,030
9,620
2,580
12,0
002,220
170
500
3,710
3,140
5,960
9,890
630
25 440
220
1,320
4,380
2,470
980
12,5
00 290
1,560
3,020
21,100
3,290
37,500
3,090
3,440
2,410
7,420
2,640
400
159,
000
340
2,400
12,5
001,720
12,1
00
3,380
15,5
003,140
270
660
5,270
4,900
9,140
13,6
00 640
50 510
290
1,690
5,200
3,100
1,340
15,5
00 340
1,870
3,950
26,400
4,390
43,4
003,850
4,530
2,990
9,730
3,440
450
186,
000
450
2,850
14,6
002,460
14,1
00
4,020
18,5
003,930
380
790
6,660
6,660
12,4
0016
,800
1,040
100 590
370
2,100
6,100
3,840
1,800
18,800 400
2,210
5,080
32,7
005,770
49,700
4,710
5,830
3,670
12,500
4,410
510
215,
000
580
3,340
16,7
003,460
16,2
00
4,690
21,9
004,840
500
930
8,260
8,900
16,5
0020
,500
2,030
Maximum
Maximum
discharge
discharge
for
period
previously
of record
known
(ft3/s)
470
278
1,050
4,280
2,580
960
21,200 279
2,000
3,600
30,000
4,500
54,2
002,800
3,050
3,600
6,720
3,390
350
127,
000
252
2,400
14,2
002,800
131,
000
3,560
16,3
002,840
210
680
6,030
5,300
18,0
0012
,300
1,520
(ft3/s)
7,000
261,000
23,000
20,300
U.S. Geological Survey downstream order identification number.
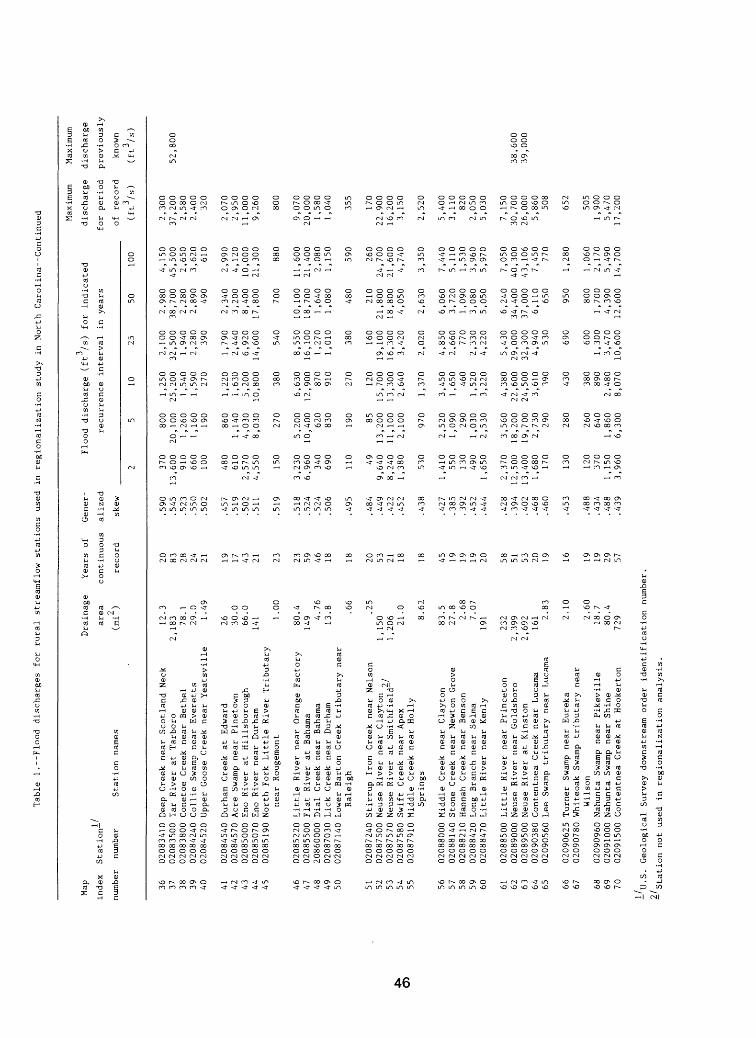
Table 1.--Flood discharges for
rural streamflow stations used in regionalization study in
North Carolina Continued
Map
index
Station-
number
number
Station names
36 37 38 39 40 41 42 43 44 45 46 47 48 49 50 51 52 53 54 55 56 57 58 59 60 61 62 63 64 65 66 67 68 69 70
02083410
02083500
02083800
02084240
02084520
02084540
02084570
02085000
02085070
02085190
02085220
02085500
20860000
02087030
02087140
02087240
02087500
02087570
02087580
02087910
02088000
02088140
02088210
02088420
02088470
02088500
02089000
02089500
02090380
02090560
02090625
02090780
02090960
02091000
02091500
Deep Creek near Scotland Neck
Tar
River at Tarboro
Conetoe Creek near Bethel
Collie Swamp near Everetts
Upper Goose Creek near Yeatsville
Durham Creek at Edward
Acre Swamp near Pinetown
Eno
River at Hillsborough
Eno
River near Durham
North Fork Little River Tributary
near Rougemont
Little River near Orange Factory
Flat River at Bahama
Dial
Creek near Bahama
Lick Creek near Durham
Lower Barton Creek tributary near
Raleigh
Stirrup Iron Creek near Nelson
Neuse River near Clayton _,
Neuse River at Smithfield
Swift
Creek near Apex
Middle Creek near Holly
Springs
Middle Creek near Clayton
Stone Creek near Newton Grove
Hannah Creek near Benson
Long Branch near Selma
Little River near Kenly
Little River near Princeton
Neuse River near Goldsboro
Neuse River at Kinston
Contentnea Creek near Lucama
Lee
Swamp tributary near Lucama
Turner Swamp near Eureka
Whiteoak Swamp tributary near
Wilson
Nahunta Swamp near Pikeville
Nahunta Swamp near Shine
Contentnea Creek at Hookerton
Drainage
Years of
area
continuous
( -2x
(.mi
) record
12.3
2,183 78.1
29.0 1.49
26 30.0
66.0
141 1.
00
80.4
149 4.
7613
.8 .66
.25
1,15
01,206 21.0 8.62
83.5
27.8 2.68
7.07
191
232
2,399
2,692
161 2.
83
2.10
2.60
18.7
80.4
729
20 83 28 24 21 19 17 43 21 23 23 59 46 18 18 20 53 21 18 18 45 19 19 19 20 58 51 53 20 19 16 19 19 29 57
Gener
alized
skew
.590
.545
.523
.550
.502
.457
.519
.502
.511
.519
.518
.524
.524
.506
.495
.484
.449
.422
.452
.438
.427
.385
.392
.452
.444
.428
.394
.402
.468
.460
.453
.488
.434
.488
.439
3 Flood discharge (ft
/s)
for
indicated
recurrence interval in
years
2 370
13,600 910
660
100
480
610
2,570
4,550
150
3,23
06,960
340
690
110 49
9,640
8,240
1,38
0
530
1,41
055
013
049
01,
650
2,370
12,5
0013
,400
1,680
170
130
120
370
1,15
03,960
5
800
20,100
1,26
01,
160
190
860
1,14
04,030
8,030
270
5,200
10,4
00 620
830
190 85
13,200
11,100
2,100
970
2,520
1,09
0290
1,03
02,530
3,560
18,200
19,7
002,730
290
280
260
640
1,860
6,300
10
1,250
25,200
1,540
1,590
270
1,220
1,63
05,200
10,8
00 380
6,63
012,900 870
910
270
120
15,700
13,300
2,640
1,370
3,450
1,650
460
1,520
3,22
0
4,380
22,600
24,500
3,610
390
430
380
890
2,480
8,070
25
2,100
32,500
1,94
02,280
390
1,79
02,440
6,920
14,6
00 540
8,550
16,1
001,
270
1,01
0
380
160
19,1
0016
,300
3,420
2,020
4,850
2,660
770
2,330
4,220
5,430
29,000
32,300
4,940
530
690
600
1,300
3,470
10,600
50
2,980
38,700
2,280
2,890
490
2,340
3,200
8,400
17,800 700
10,100
18,700
1,64
01,
080
480
210
21,800
18,800
4,050
2,630
6,060
3,720
1,090
3,080
5,050
6,240
34,400
37,000
6,110
650
950
800
1,700
4,390
12,6
00
100
4,150
45,500
2,650
3,620
610
2,990
4,120
10,0
0021,300
880
11,6
0021,400
2,080
1,150
590
260
24,700
21,600
4,740
3,350
7,440
5,110
1,53
03,960
5,970
7,050
40,300
43,106
7,450
770
1,280
1,06
02,170
5,490
14,700
Maximum
Maximum
discharge
discharge
for
period
previously
of record
known
(ft3/s)
(ft3/s)
2,30
037,200
52,800
2,58
02,400
320
2,070
2,950
11,0
009,260
800
9,070
20,000
1,580
1,040
355
170
22,900
16,200
3,15
0
2,520
5,400
3,110
820
2,050
5,03
0
7,150
30,700
38,600
26,000
39,000
5,860
508
652
505
1,900
5,470
17,2
00
U.S. Geological Survey downstream order
identification number.
21 Station not used in
regionalization an
alys
is.
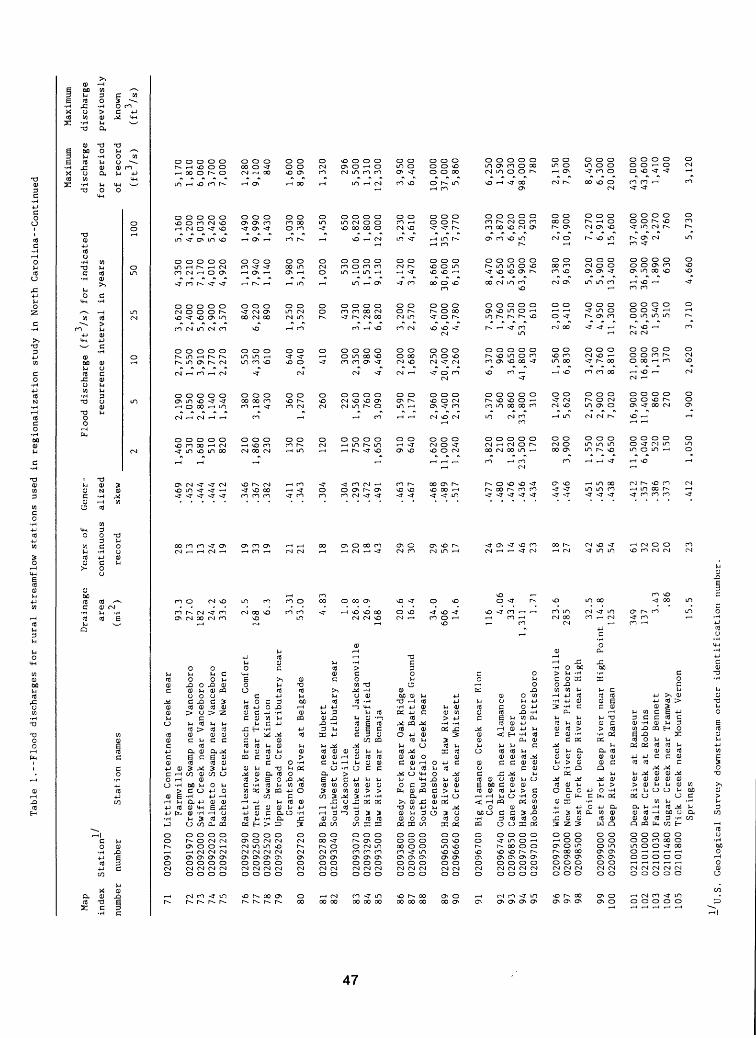
Table 1.--Flood discharges fo
r rural streamflow stations used in
regionalization study in
North Carolina--Continued
Map
Drainage
Years of
index
Station
area
continuous
2 number
number
Station names
(mi
) record
71 72 73 7A 75 76 77 78 79 80 81 82 83 84 85 86 87 88 89 90 91 92 93 9A 95 96 97 98 99 100
101
102
103
104
105
02091700 Little Contentnea Creek near
Farmville
02091970 Creeping Swamp near Vanceboro
02092000 Swift Creek near Vanceboro
02092020 Palmetto Swamp near Vanceboro
02092120 Bachelor Creek near New Bern
02092290 Rattlesnake Branch near Comfort
02092500 Trent River near Trenton
02092520 Vine Swamp near Kinston
02092620 Upper Broad Creek tributary near
Grantsboro
02092720 White Oak River at Belgrade
02092780 Bell Swamp near Hubert
02093040 Southwest Creek tributary ne
arJacksonville
02093070 Southwest Creek near Jacksonville
02093290 Haw River near Summerfield
02093500 Haw River near Benaja
02093800 Reedy Fork near Oak Ridge
02094000 Horsepen Creek at
Battle Ground
02095000 South Buffalo Creek near
Greensboro
02096500 Haw River at Haw River
02096660 Rock Creek near Whitsett
02096700 Bi
g Alamance Creek near El
onCollege
02096740 Gun Branch near Alamance
02096850 Cane Creek near Teer
02097000 Haw River near Pittsboro
1,02097010 Robeson Creek near Pittsboro
02097910 White Oak Creek near Wilsonville
02098000 New Hope River near Pittsboro
02098500 West Fork Deep River near High
Point
02099000 East Fork Deep River near High Point
02099500 Deep River near Randleman
02100500 Deep River at
Ramseur
02101000 Bear Creek at
Robbins
02101030 Falls Creek near Bennett
02101480 Sugar Creek near Tramway
02101800 Tick Creek near Mount Vernon
Springs
93.3
27.0
182 24.2
33.6 2.5
168 6.
3
3.31
53.0 4.83
1.0
26.8
26.9
168 20.6
16.4
34.0
606 14.6
116 4.06
33.4
311 1.
71
23.6
285 32.5
14.8
125
349
137 3.
43 .86
15.5
28 13 13 24 19 19 33 19 21 21 18 19 20 18 43 29 30 29 56 17 24 19 14 46 23 18 27 42 56 54 61 32 20 20 23
Gener
alized
skew
.469
.452
.444
.444
.412
.346
.367
.382
.411
.343
.304
.304
.293
.472
.491
.463
.467
.468
.489
.517
.477
.480
.476
.436
.434
.449
.446
.451
.455
.438
.412
.357
.386
.373
.412
Flood discharge (f
t /s)
for indicated
recurrence interval in years
2
1,46
053
01,
680
510
820
210
1,86
023
0
130
570
120
110
750
470
1,65
0
910
640
1,62
011,000
1,24
0
3,820
210
1,82
023,500
170
820
3,900
1,55
01,750
4,650
11,500
6,040
520
150
1,05
0
5
2,19
01,050
2,86
01,
140
1,54
0
380
3,18
0430
360
1,270
260
220
1,56
0760
3,09
0
1,590
1,17
0
2,96
016,400
2,32
0
5,37
0560
2,86
033,800 310
1,24
05,
620
2,57
02,
900
7,02
0
16,900
11,400 860
270
1,90
0
10
2,770
1,550
3,91
01,
770
2,270
550
4,350
610
640
2,040
410
300
2,350
980
4,460
2,200
1,68
0
4,250
20,400
3,260
6,370
960
3,650
41,800
430
1,560
6,830
3,42
03,760
8,810
21,000
16,800
1,130
370
2,620
25
3,620
2,400
5,600
2,900
3,570
840
6,220
890
1,25
03,
520
700
430
3,730
1,28
06,820
3,200
2,570
6,470
26,000
4,780
7,590
1,760
4,750
53,700
610
2,010
8,410
4,740
4,950
11,3
00
27,000
26,500
1,54
051
0
3,710
50
4,350
3,21
07,
170
4,010
4,920
1,13
07,940
1,140
1,980
5,150
1,020
530
5,100
1,53
09,130
4,120
3,47
0
8,660
30,600
6,150
8,47
02,
650
5,650
63,900
760
2,380
9,63
0
5,920
5,900
13,400
31,900
36,500
1,890
630
4,660
100
5,16
04,200
9,030
5,420
6,660
1,490
9,990
1,430
3,03
07,
380
1,450
650
6,820
1,80
012
,000
5,23
04,610
11,400
35,400
7,77
0
9,330
3,87
06,620
75,200
930
2,78
010,900
7,27
06,910
15,600
37,400
49,500
2,270
760
5,730
Maximum
Maximum
discharge
discharge
for
period
previously
of record
known
(ft3/s)
(ft3/s
)
5,170
1,81
06,060
3,700
7,000
1,28
09,100
840
1,60
08,900
1,320
296
5,500
1,31
012,300
3,950
6,400
10,000
37,000
5,860
6,250
1,59
04,030
98,000
780
2,150
7,900
8,450
6,300
20,000
43,000
43,600
1,41
0400
3,120
U.S. Geological Survey downstream order identification nu
mber
.
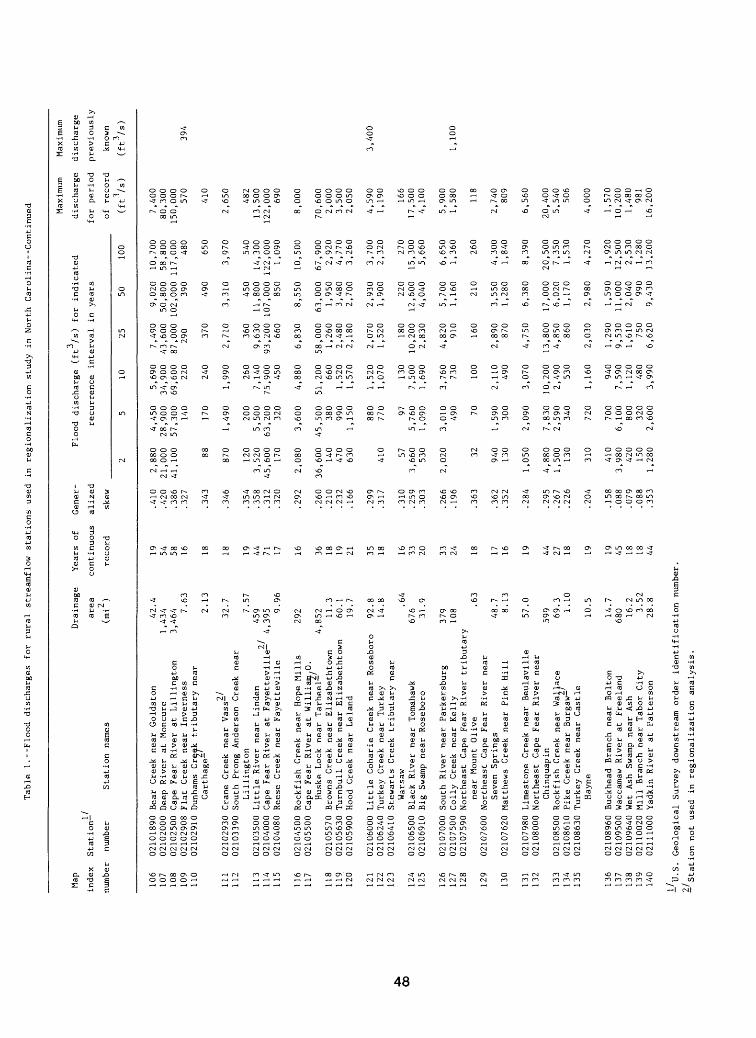
Table 1.--Flood discharges fo
r rural streamflow stations used in regionalization study in North Carolina Continued
-U
00
Map
index
Station-
number
number
Station names
106
107
108
109
110
111
112
113
114
115
116
117
118
119
120
121
122
123
124
125
126
127
128
129
130
131
132
133
134
135
136
137
138
139
140
02101890
02102000
02102500
02102908
02102910
02102930
02103390
02103500
02104000
02104080
02104500
02105500
02105570
02105630
02105900
02106000
02106240
02106410
02106500
02106910
02107000
02107500
02107590
02107600
02107620
02107980
02108000
02108500
02108610
02108630
02108960
02109500
02109640
02110020
02111000
Bear Creek near Goldston
Deep River at Moncure
1Cape Fear River at Lillington
3Flat Creek near Inverness
Dunhams Creak tributary near
Carthage-
Crane Creek near Vass-
South Prong Anderson Creek
near
Lillington
Little River near Linden
_/Ca
pe Fear River at Fayetteville
4Reese Creek near Fayetteville
Rockfish Creek near Hope Mills
Cape Fear River at
William, 0.
Huske Lock near Tarheel
4Browns Creek near Elizabethtown
Turnbull Creek near Elizabethtown
Hood Creek near Leland
Little Coharie Creek ne
ar Roseboro
Turkey Creek near Turkey
Stewarts Creek tributary near
Warsaw
Black River near Tomahawk
Big
Swamp near Roseboro
South River near Parkersburg
Colly Creek near Kelly
Northeast Cape Fear River tributary
near Mount Olive
Northeast Cape Fear River near
Seven Springs
Matthews Creek near Pi
nk Hill
Limestone Creek near Beulaville
Northeast Cape Fear River near
Chinquapin
Rockfish Creek near Wallace
Pike Creek near Burgaw
Turkey Creek near Castle
Hayne
Buckhead Branch near Bolton
Waccamaw River at Freeland
Wet
Ash Swamp near Ash
Mill Branch near Tabor City
Yadkin River at Patterson
Drainage
Years of
area
continuous
2 (mi
) record
42.
,434
,4647, 2.
32. 7.
459
,3959.
292
,852 11
.60.
19,
92.
14.
676 31.
379
108 48, 8,
57,
599 69, 1,
10,
14,
680 16, 3,
28,.4 ,6
3
,13
.7 .57
,96
.3 .1 ,7 .8 .8 ,64
,9 ,63
.7 ,13
.0 .3 .10
.5 .7 .2 .52
.8
19 54 58 16 18 18 19 44 71 17 16 36 18 19 21 35 18 16 33 20 33 24 18 17 16 19 44 27 18 19 19 45 18 18 44
Gener
alized
skew
.410
.420
.386
.327
.343
.346
.354
.358
.312
.320
.292
.260
.210
.232
.166
.299
.317
.310
.259
.303
.266
.196
.363
.362
.352
.284
.295
.267
.226
.204
.158
.088
.079
.088
.353
Flood discharge (ft
/s)
for
indicated
recurrence interval in years
2
2,880
21,000
41,100 88
870
120
3,520
45,600
170
2,080
36,600
140
470
630
410 57
3,660
530
2,020 32
940
130
1,050
4,880
1,500
130
310
410
3,980
420
150
1,280
5
4,450
28,900
57,300
140
170
1,490
200
5,500
63,200
320
3,600
45,500
380
990
1,150
880
770 97
5,760
1,09
0
3,010
490 70
1,590
300
2,090
7,830
2,590
340
720
700
6,100
800
320
2,600
10
5,690
34,900
69,600
220
240
1,99
0
260
7,140
75,900 450
4,880
51,200
660
1,520
1,570
1,520
1,070
130
7,50
01,
690
3,760
730
100
2,110
490
3,07
0
10,200
2,490
530
1,160
940
7,590
1,120
480
3,990
25
7,49
043,600
87,000
290 370
2,710
360
9,630
93,200
660
6,830
58,000
1,260
2,480
2,180
2,070
1,52
0
180
10,2
002,830
4,820
910
160
2,890
870
4,750
13,800
4,850
860
2,030
1,29
09,530
1,61
0750
6,620
50
9,020
50,800
102,000
390
490
3,310
450
11,800
107,000
850
8,550
63,000
1,950
3,480
2,700
2,930
1,90
0
220
12,600
4,040
5,700
1,160
210
3,550
1,28
0
6,380
17,000
6,020
1,170
2,980
1,590
11,000
2,040
990
9,430
100
10,7
0058,800
117,000
480
650
3,970
540
14,3
00122,000
1,090
10,5
00
67,900
2,920
4,770
3,260
3,700
2,320
270
15,300
5,660
6,650
1,36
0
260
4,300
1,84
0
8,390
20,500
7,350
1,530
4,270
1,920
12,500
2,530
1,280
13,200
Maximum
Maximum
discharge
discharge
for
period
previously
of record
known
(ft3/s)
(ft3/s)
7,400
80,300
150,
000
570
394
410
2,650
482
13,5
0012
2,00
0690
8,000
70,600
2,000
3,500
2,050
4,590
3,400
1,19
0
166
17,5
004,100
5,900
1,58
0 1,100
118
2,740
809
6,560
20,400
5,540
506
4,000
1,57
010,200
1,48
0981
16,200
U.S. Geological Survey downstream order identification number.
2/ - Station no
t used in
regionalization an
alys
is.
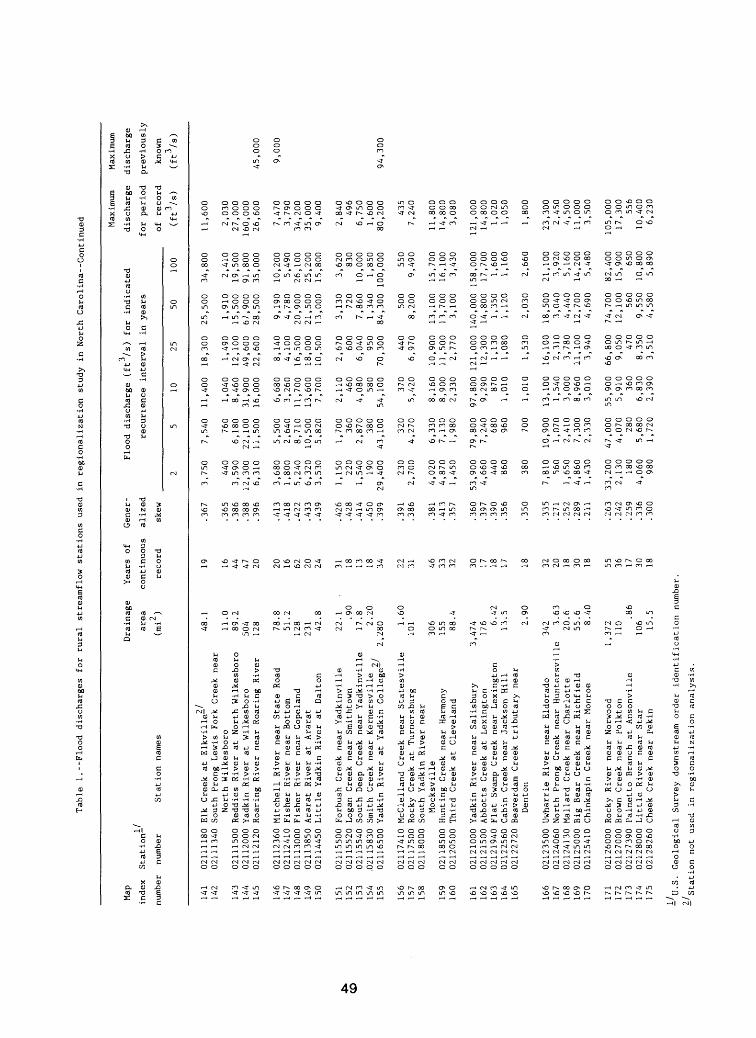
Table
1.--Flood
disc
harges
fo
r rural
streamflow st
atio
ns used in regionalization
study
in No
rth
Carolina Continued
(0
Map
Drai
nage
Ye
ars
of
inde
x St
atio
n
area
continuous
2 number
number
Station
names
(mi
) record
141
142
143
144
145
146
147
148
149
150
151
152
153
154
155
156
157
158
159
160
161
162
163
164
165
166
167
168
169
170
171
172
173
174
175
0211
1180
0211
1340
0211
1500
0211
2000
0211
2120
0211
2360
02112410
0211
3000
0211
3850
0211
4450
0211
5500
0211
5520
0211
5540
.021
1583
002
116500
0211
7410
0211
7500
02118000
0211
8500
0212
0500
0212
1000
0212
1500
0212
1940
02122560
0212
2720
02123500
0212
4060
0212
4130
0212
5000
02125410
0212
6000
0212
7000
02127390
02128000
02128260
Elk
Creek
at Elkville-/
South
Pron
g Le
wis
Fork
Cr
eek
near
Nort
h Wilkesboro
Reddies
River
at North
Wilkesboro
Yadk
in River
at Wilkesboro
Roaring
River
near Roaring
River
Mitchell River
near
St
ate
Road
Fisher River
near
Bottom
Fisher River
near Co
pela
ndArarat River
at Ar
arat
Litt
le Ya
dkin
River
at Da
lton
Forb
ush
Creek
near Yadkin
ville
Logan
Cree
k near Sm
itht
own
South
Deep Creek
near
Yadkinville
Smith
Creek
near
Kernersvil
le _,
Yadkin Ri
ver
at Yadkin Co
lleg
e-
2
McCl
ella
nd Creek
near
Stat
esville
Rocky
Cree
k at
Turnersburg
South
Yadkin Ri
ver
near
Mocksville
Hunt
ing
Creek
near
Ha
rmony
Third
Cree
k at Cleveland
Yadk
in River
near
Salisbur
y 3
Abbo
tts
Creek
at Lexingto
nFl
at Swamp
Creek
near
Lexington
Cabin
Creek
near Ja
ckso
n Hill
Beaverdam
Creek
trib
utar
y near
Dent
on
Uwharrie River
near El
dorado
North
Prong
Creek
near
Hu
ntersville
Mallard
Creek
near
Ch
arlott
eBi
g Bear Creek
near
Richfi
eld
Chinkapin
Cree
k ne
ar Mo
nroe
Rocky
River
near
No
rwoo
d 1
Brown
Creek
near Polkton
Palmetto Branch at
Ansonv
ille
Little River
near
St
arCh
eek
Creek
near Pe
kin
48.
11.
89.
504
128 78.
51.
128
231 42.
22.
17. 2.
,280
1.101
306
155 88.
,474 176 6. 13. 2,
342 3.
20,
55. 8,
,372 110
106 15
,1 ,0 2 ,8 .2 ,8 1 ,90 8 ,20
,60
.4 .42
,5 ,90
,63
.6 .6 .40
.86
.5
19 16 44 47 20 20 16 62 20 24 31 18 13 18 34 22 31 46 33 32 30 17 18 17 18 32 20 18 30 18 55 36 17 30 18
Gene
r
alized
skew
.367
.365
.386
.388
.396
.413
.418
.422
.433
.439
.426
.428
.414
.450
.399
.391
.386
.381
.413
.357
.360
.397
.390
.356
.350
.335
.271
.252
.289
.211
.263
.242
.259
.336
.300
Floo
d di
scha
rge
(ft
/s)
for
indi
cate
d
recu
rren
ce interv
al in
ye
ars
2
3,750
440
3,59
012
,300
6,310
3,680
1,800
5,24
06,320
3,530
1,150
220
1,54
019
029,400 230
2,70
0
4,020
4,870
1,450
53,9
004,660
440
860
380
7,81
0560
1,650
4,860
1,430
33,2
002,130
180
4,06
098
0
5
7,540
760
6,180
22,100
11,5
00
5,50
02,640
8,71
010
,500
5,82
0
1,700
360
2,870
380
43,100 320
4,270
6,33
07,130
1,98
0
79,800
7,24
068
096
0
700
10,900
1,07
02,410
7,300
2,330
47,000
4,070
280
5,68
01,720
10
11,4
00
1,04
08,460
31,9
0016
,000
6,680
3,260
11,7
0013
,600
7,700
2,110
460
4,080
580
54,100 370
5,420
8,16
08,900
2,330
97,8
009,
290
870
1,010
1,01
0
13,1
001,540
3,000
8,960
3,01
0
55,9
005,910
360
6,830
2,390
25
18,3
00
1,490
12,1
0049
,600
22,6
00
8,14
04,
100
16,5
0018
,000
10,5
00
2,67
060
06,
040
950
70,300 440
6,97
0
10,9
0011
,500
2,77
0
121,
000
12,300
1,130
1,080
1,530
16,1
002,31
03,
780
11,1
003,94
0
66,800
9,05
0470
8,350
3,510
50
25,500
1,910
15,5
0067,900
28,500
9,19
04,
780
20,900
21,500
13,0
00
3,13
072
07,
860
1,340
84,3
00 500
8,20
0
13,1
0013
,700
3,10
0
140,000
14,8
001,350
1,12
0
2,03
0
18,500
3,040
4,44
012
,700
4,69
0
74,700
12,1
00 560
9,55
04,
580
100
34,8
00
2,410
19,5
0091,800
35,0
00
10,200
5,490
26,100
25,2
0015
,800
3,620
830
10,000
1,850
100,000
550
9,490
15,7
0016,100
3,430
158,
000
17,700
1,60
01,160
2,660
21,100
3,920
5,160
14,200
5,48
0
82,4
0015,900 650
10,800
5,890
Maxi
mum
Maxi
mum
disc
harg
e di
scha
rge
for
peri
od
previously
of re
cord
known
(ft3/s
) (f
t3/s)
11,6
00
2,030
27,000
160,
000
26,600
45,0
00
7,47
0 9,
000
3,79
034,200
35,0
009,
400
2,84
049
66,
750
1,600
80,200
94,3
00
435
7,24
0
11,8
0014
,800
3,08
0
121,000
14,8
001,020
1,050
1,800
23,300
2,45
04,
500
11,0
003,
500
105,000
17,300 556
10,4
006,
230
U.
S. Geological Survey do
wnst
ream
order
identification number.
21 Station
not
used in
regionalization
anal
ysis
.
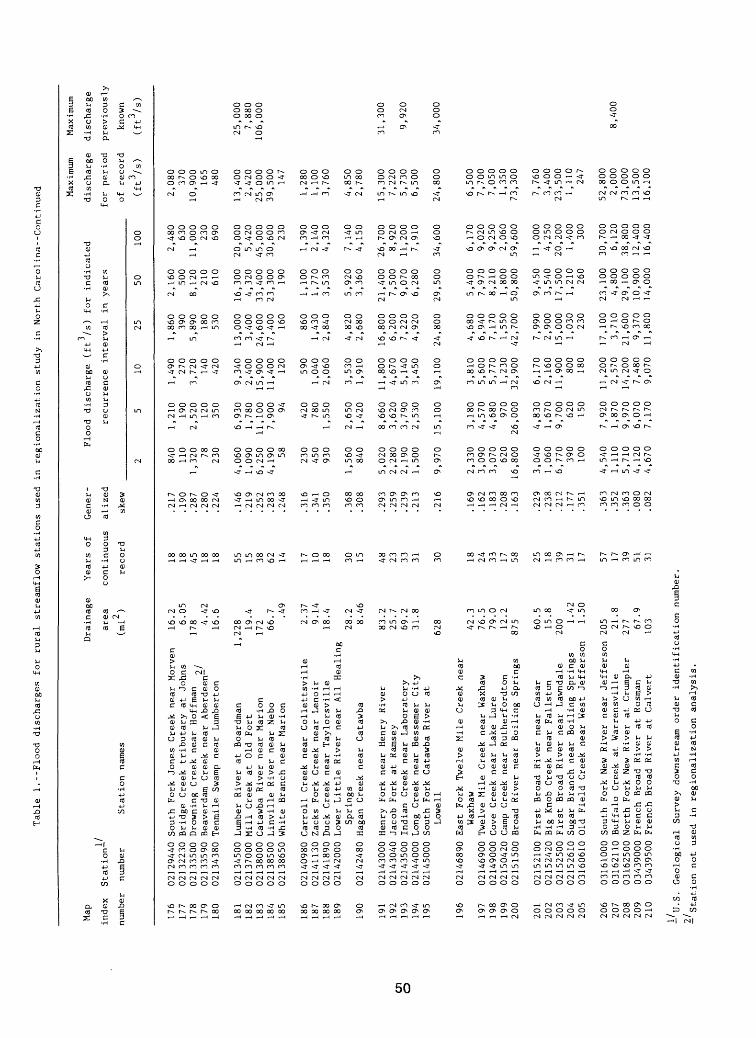
Table 1.--Flood discharges fo
r rural streamflow stations used in
regionalization study in North Carolina Continued
Ol O
Map
Drainage
Years of
index
Station-
area
continuous
2 number
number
Station names
(mi
) record
176
177
178
179
180
181
182
183
184
185
186
187
188
189
190
191
192
193
194
195
196
197
198
199
200
201
202
203
204
205
206
207
208
209
210
02129440 South Fork Jones Creek near Morven
02132230 Bridge Creek tributary at
Johns
02133500 Drowning Creek near Hoffman
_,02133590 Beaverdam Creek near Aberdeen-
02134380 Tenmile Swamp near Lumberton
02134500 Lumber River at Boardman
1,02137000 Mill Creek at Old Fort
02138000 Catawba River near Marion
02138500 Linville River near Nebo
02138650 White Branch near Marion
02140980 Carroll Creek near Collettsville
02141130 Zacks Fork Creek near Lenoir
02141890 Duck Creek near Taylorsville
02142000 Lower Little River near All
Healing
Springs
02142480 Hagan Creek near Catawba
02143000 Henry Fork near Henry River
02143040 Jacob Fork at
Ramsey
02143500 Indian Creek near Laboratory
02144000 Long Creek near Bessemer City
02145000 South Fork Catawba River at
Lowe 1 1
02146890 East Fork Twelve Mile Creek near
Waxhaw
02146900 Twelve Mile Creek near Waxhaw
02149000 Cove Creek near Lake Lure
02150420 Camp Creek near Rutherfordton
02151500 Broad River near Boiling Springs
02152100 First Broad River near Casar
02152420 Big Knob Creek near Fallston
02152500 First Broad River near Lawndale
02152610 Sugar Branch near Boiling Springs
03160610 Old Field Creek near West Jefferson
03161000 South Fork New River near Jefferson
03162110 Buffalo Creek at Warrensville
03162500 North Fork New River at
Grumpier
03439000 French Broad River at Rosman
03439500 French Broad River at
Calvert
16.2 6.05
178 4.42
16.6
228 19.4
172 66.7 .4
9
2.37
9.14
18.4
28.2 8.46
83.2
25.7
69.2
31.8
628 42.3
76.5
79.0
12.2
875 60.5
15.8
200 1.
421.50
205 21.8
277 67.9
103
18 18 45 18 18 55 15 38 62 14 17 10 18 30 15 48 23 33 31 30 18 24 33 17 58 25 18 39 31 17 57 17 39 51 31
Gener
alized
skew
.217
.190
.287
.280
.224
.146
.219
.252
.283
.248
.316
.341
.350
.368
.308
.293
.259
.239
.213
.216
.169
.162
.183
.208
.163
.229
.238
.212
.177
.351
.363
.352
.363
.080
.082
Flood discharge (f
t /s)
for
indicated
recurrence interval in
years
2 840
110
1,320 78
230
4,060
1,09
06,250
4,190 58
230
450
930
1,560
840
5,020
2,280
2,190
1,50
0
9,970
2,330
3,090
3,070
620
16,800
3,040
1,06
06,770
390
100
4,540
1,11
05,710
4,120
4,670
5
1,21
0190
2,520
120
350
6,930
1,78
011,100
7,900 94
420
780
1,55
0
2,650
1,420
8,660
3,620
3,790
2,530
15,100
3,180
4,570
4,680
970
26,000
4,830
1,670
9,700
620
150
7,920
1,870
9,970
6,070
7,170
10
1,490
270
3,72
0140
420
9,34
02,
400
15,900
11,400 120
590
1,040
2,060
3,530
1,910
11,800
4,670
5,140
3,45
0
19,100
3,81
05,600
5,770
1,23
032,900
6,170
2,160
11,900 800
180
11,200
2,570
14,200
7,48
09,
070
25
1,860
390
5,890
180
530
13,0
003,
400
24,600
17,4
00 160
860
1,43
02,840
4,820
2,680
16,800
6,200
7,220
4,920
24,800
4,680
6,940
7,170
1,55
042,700
7,99
02,900
15,0
001,030
230
17,100
3,71
021,600
9,370
11,800
50
2,160
500
8,120
210
610
16,300
4,320
33,400
23,300
190
1,100
1,770
3,530
5,920
3,360
21,400
7,500
9,070
6,280
29,500
5,400
7,970
8,210
1,80
050,800
9,450
3,540
17,500
1,210
260
23,100
4,800
29,100
10,900
14,000
100
2,48
063
011
,000 230
690
20,000
5,42
045,000
30,600
230
1,39
02,140
4,320
7,14
04,150
26,700
8,920
11,200
7,910
34,600
6,170
9,020
9,250
2,060
59,600
11,0
004,250
20,200
1,40
030
0
30,700
6,120
38,800
12,4
0016,400
Maximum
Maximum
discharge
discharge
for
period
previously
of record
known
(ft3/s
)
2,080
370
10,9
00 165
480
13,400
2,420
25,000
39,500
147
1,28
01,
100
3,760
4,850
2,780
15,300
7,220
5,730
6,500
24,800
6,500
7,700
7,050
1,35
073,300
7,760
3,400
23,500
1,110
247
52,800
2,000
73,000
13,5
0016,100
(ft3/s
)
25,000
7,880
106,000
31,300
9,920
34,000
8,400
U.
S. Geological Survey downstream order identification number.
Station not used in
regionalization an
alysis.
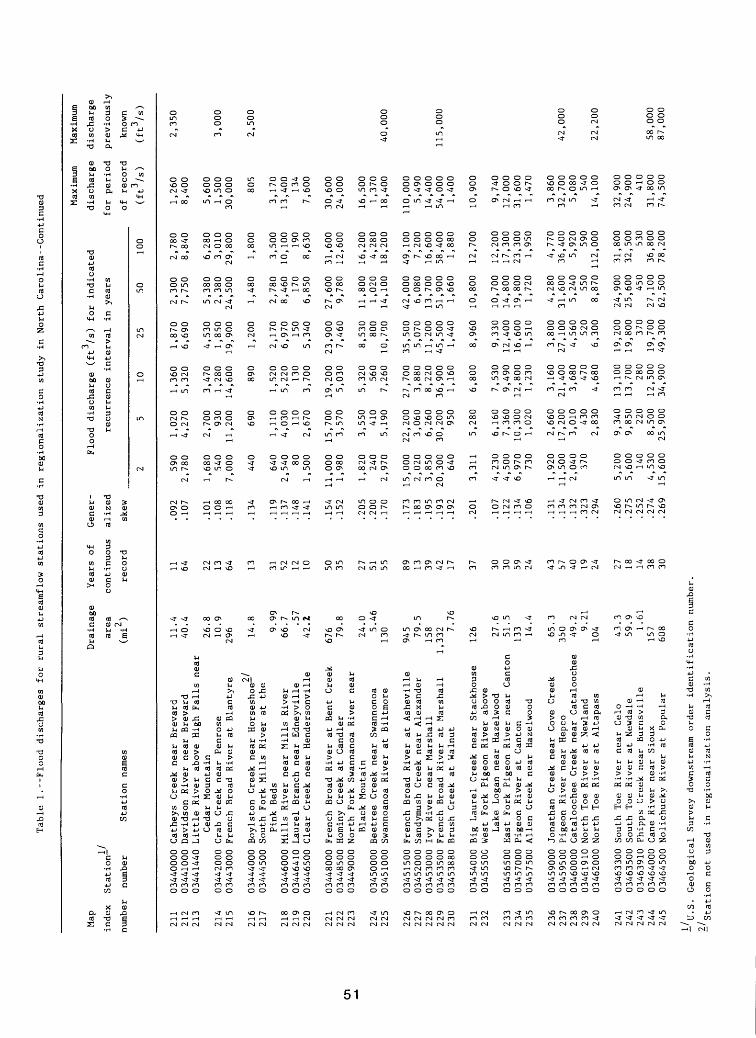
Table 1.--Flood discharges for
rural streamflow stations used in
regionalization study in
North Carolina Continued
Map
Drainage
Years of
index
Station
area
continuous
2 number
number
Station names
(mi
) record
211
212
213
214
215
216
217
218
219
220
221
222
223
224
225
226
227
228
229
230
231
232
233
234
235
236
237
238
239
240
241
242
243
244
245
03440000 Catheys Creek near Brevard
03441000 Davidson River near Brevard
03441440 Little River above High Falls near
Cedar Mountain
03442000 Crab Creek near Penrose
03443000 French Broad River at Blantyre 2/
03444000 Boylston Creek near Horseshoe-
03444500 South Fork Mills River at
the
Pink Beds
03446000 Mills River near Mills River
03446410 Laurel Branch near Edneyville
03446500 Clear Creek near Hendersonville
03448000 French Broad River at Bent Creek
03448500 Hominy Creek at Candler
03449000 North Fork Swannanoa River near
Black Moutain
03450000 Beetree Creek near Swannonoa
03451000 Swannoanoa River at Biltmore
03451500 French Broad River at
Asheville
03452000 Sandymush Creek near Alexander
03453000 Ivy River near Marshall
03453500 French Broad River at
Marshall
103453880 Brush Creek at Walnut
03454000 Big Laurel Creek near Stackhouse
0345550G West Fork Pigeon River above
Lake Logan near Hazelwood
03456500 East Fork Pigeon River near Canton
03457000 Pigeon River at Canton
03457500 Alien Creek near Hazelwood
03459000 Jonathan Creek near Cove Creek
03459500 Pigeon River near Hepco
03460000 Cataloochee Creek near Cataloochee
03461910 North Toe River at
Newland
03462000 North Toe River at Altapass
03463300 South Toe River near Celo
03463500 South Toe River at Newdale
03463910 Phipps Creek near Burnsville
03464000 Cane River near Sioux
03464500 Nolichucky River at Popular
11.4
40. A
26.8
10.9
296 14.8 9.99
66.7 .5
742.2
676 79.8
24.0 5.46
130
945 79.5
158
,3327.
76
126 27.6
51.5
133 14.4
65.3
350 49.2
9.21
104 43.3
59.9
1.61
157
608
11 64 22 13 64 13 31 52 12 10 50 35 27 51 55 89 13 39 42 17 37 30 30 59 24 43 57 40 19 24 27 18 14 38 30
Gener
alized
skew
.092
.107
.101
.108
.118
.134
.119
.137
.148
.141
.154
.152
.205
.200
.170
.173
.183
.195
.193
.192
.201
.107
.122
.134
.106
.131
.134
.132
.323
.294
.260
.275
.252
.274
.269
Flood discharge (f
t /s)
for
indicated
recurrence interval in years
2 590
2,780
1,68
0540
7,000
440
640
2,540 80
1,50
0
11,000
1,98
0
1,82
0240
2,970
15,000
2,020
3,850
20,300
640
3,31
1
4,230
4,500
6,970
730
1,92
011,500
2,040
370
5,200
5,600
140
4,530
15,600
5
1,02
04,270
2,700
930
11,200 690
1,11
04,030
110
2,670
15,700
3,57
0
3,55
041
05,
190
22,200
3,06
06,260
30,200 950
5,28
0
6,16
07,
360
10,300
1,020
2,66
017,200
3,01
043
02,830
9,340
9,850
220
8,50
025,900
10
1,36
05,320
3,47
01,
280
14,600 890
1,52
05,220
130
3,700
19,200
5,030
5,320
560
7,26
0
27,700
3,88
08,220
36,900
1,16
0
6,800
7,53
09,490
12,800
1,230
3,16
021,400
3,68
047
04,680
13,100
13,700 280
12,500
34,900
25
1,87
06,690
4,530
1,85
019,900
1,20
0
2,170
6,970
150
5,340
23,900
7,460
8,530
800
10,7
00
35,500
5,070
11,200
45,500
1,440
8,960
9,330
12,400
16,600
1,51
0
3,800
27,100
4,560
520
6,300
19,200
19,800
370
19,700
49,300
50
2,300
7,750
5,380
2,380
24,500
1,480
2,780
8,460
170
6,850
27,600
9,780
11,800
1,02
014,100
42,000
6,080
13,700
51,900
1,66
0
10,800
10,700
14,800
19,800
1,72
0
4,280
31,600
5,240
550
8,870
24,900
25,600
450
27,100
62,500
100
2,780
8,840
6,280
3,01
029,800
1,80
0
3,50
010
,100 190
8,630
31,600
12,600
16,2
004,280
18,2
00
49,100
7,20
016,600
58,400
1,880
12,7
00
12,2
0017,300
23,300
1,95
0
4,770
36,400
5,920
590
112,000
31,800
32,500
530
36,800
78,200
Maximum
discharge
for
period
of record
(ft3/s)
1,26
08,400
5,600
1,50
030,000
805
3,170
13,400
134
7,600
30,600
24,000
16,500
1,37
018,400
110,000
5,490
14,400
54,000
1,40
0
10,900
9,740
12,000
31,600
1,47
0
3,860
32,700
5,080
540
14,100
32,900
24,900
410
31,800
74,500
Maximum
discharge
previously
known
(ft3/s
)
2,350
3,000
2,500
40,000
115,000
42,000
22,200
58,000
87,000
U.S. Geological Survey downstream order identification number.
2/ Station not
used in
regionalization analysis.
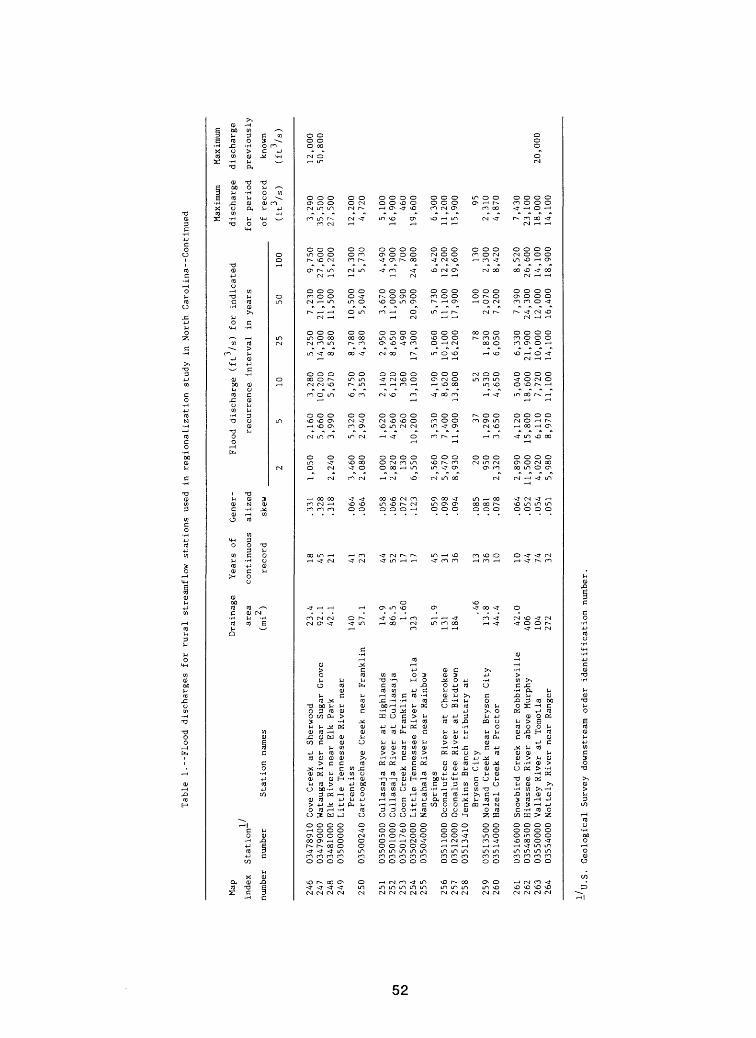
Table 1.--Flood discharges fo
r rural streamflow stations used in regionaLization study in
North Carolina Continued
Ol ro
Map
inde
x Station-
number
number
Station names
246
247
248
249
250
251
252
253
254
255
256
257
258
259
260
261
262
263
264
0347
8910
0347
9000
0348
1000
0350
0000
03500240
0350
0500
03501000
03501760
03502000
0350
4000
0351
1000
0351
2000
0351
3410
0351
3500
0351
4000
0351
6000
0354
8500
0355
0000
0355
4000
Cove
Creek
at Sherwood
Watauga River near Sugar Grove
Elk
River near Elk
Park
Little Tennessee
River
near
Prentiss
Cartoogechaye Creek ne
ar Franklin
Cullasaja River at
Highlands
Cullasaja River at
Cullasaja
Coon Creek near Franklin
Little Tennessee River at lotla
Nantahala River near Rainbow
Springs
Oconaluftee
River
at Ch
erok
eeOconaluftee River at
Birdtown
Jenkins Branch tributary at
Bryson City
Noland Creek near Bryson City
Hazel
Creek
at Pr
octo
r
Snowbird Creek near Robbinsville
Hiwassee River above Murphy
Vall
ey River
at To
motl
aNottely River near Ranger
Drainage
Years of
area
continuous
(mi
) record
23.4
92.1
42.1
140 57.1
14.9
86.5 1.60
323 51.9
131
184
.46
13.8
44.4
42.0
406
104
272
18 45 21 41 23 44 52 17 17 45 31 36 13 36 10 10 44 74 32
Gene
r
alized
skew
.331
.328
.318
.064
.064
.058
.066
.072
.123
.059
.098
.094
.085
.081
.078
.064
.052
.054
.051
Flood discharge (ft
/s)
for
indicated
recurrence interval in
years
2
1,050
2,240
3,460
2,080
1,000
2,820
130
6,550
2,560
5,470
8,930 20
950
2,320
2,890
11,5
004,020
5,980
5
2,160
5,660
3,990
5,320
2,940
1,620
4,560
260
10,200
3,530
7,400
11,9
00 371,290
3,650
4,120
15,8
006,110
8,970
10
3,280
10,200
5,670
6,750
3,550
2,140
6,120
360
13,1
00
4,190
8,620
13,8
00 521,530
4,650
5,040
18,6
007,720
11,1
00
25
5,250
14,3
008,580
8,780
4,380
2,950
8,650
490
17,3
00
5,060
10,1
0016
,200 78
1,830
6,050
6,330
21,9
0010
,000
14,1
00
50
7,230
21,100
11,5
00
10,5
005,040
3,670
11,0
00 590
20,900
5,730
11,1
0017
,900 100
2,070
7,200
7,390
24,300
12,0
0016
,400
100
9,750
27,6
0015
,200
12,3
005,730
4,490
13,9
00 700
24,800
6,420
12,2
0019
,600 130
2,300
8,420
8,520
26,600
14,1
0018
,900
Maximum
discharge
for
period
of record
(ft3/s)
3,290
35,5
0027,500
12,2
004,720
5,100
16,9
00 460
19,600
6,300
11,2
0015
,900 95
2,310
4,870
7,430
23,100
18,0
0014
,100
Maximum
discharge
previously
known
(ft3/s)
12,0
0050,800
20,000
U.
S. Geological Survey downstream order identification number.


![[Gunter G. Seip] Electrical Installations Handbook](https://img.pdfslide.us/doc/110x75/577c78351a28abe0548f1810/gunter-g-seip-electrical-installations-handbook.jpg)