Embed Size (px)
Citation preview

bile duct
diet
Intestine
Blood
bileacid
feces
ABC G5/G8
ABCG5/G8
NPC1L1
Apo-A1
Tangier disease
HDL VLDL LDL
modifiedLDL
LDLreceptor
ABCA1
basolateralABCA1
ABCA1
scavengerreceptors
Lymphatics
CE Chylomicron
CETG
(ACAT)
Hepatocyte
CE
CE
(ACAT)
acetate
PL
C
C
C
C
C
C
C
C
C CCC
CC
CC
CC
C
C
CCC
CC
C C
C
CC
C
CC
C
C
C
C
C
Enterocytes
PL
Macrophage
apical
apicalCCCC C
Scientific Illustrations 101 2007by H. Adam Steinberg
116 ITMC | Department of Biochemistry | UW–Madison ITMC | Department of Biochemistry | UW–Madison 1
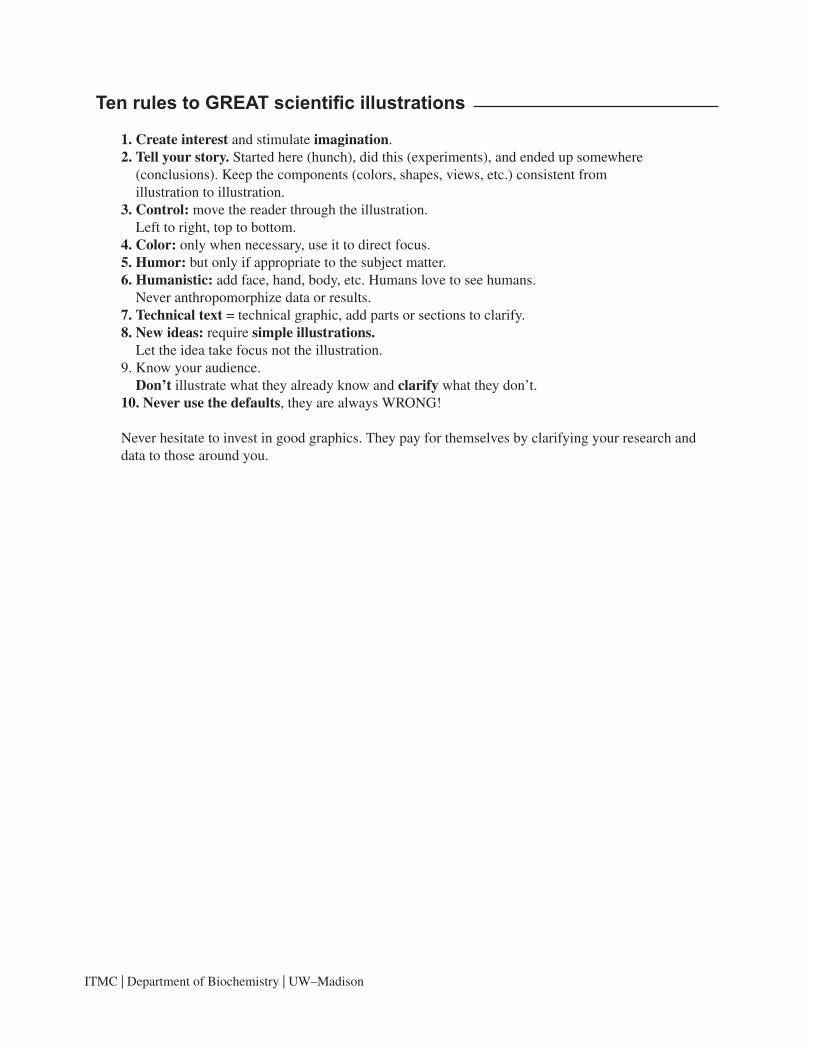
Ten rules to GREAT scientific illustrations
1. Create interest and stimulate imagination.2. Tell your story. Started here (hunch), did this (experiments), and ended up somewhere (conclusions). Keep the components (colors, shapes, views, etc.) consistent from illustration to illustration.3. Control: move the reader through the illustration. Left to right, top to bottom.4. Color: only when necessary, use it to direct focus.5. Humor: but only if appropriate to the subject matter.6. Humanistic: add face, hand, body, etc. Humans love to see humans. Never anthropomorphize data or results. 7. Technical text = technical graphic, add parts or sections to clarify.8. New ideas: require simple illustrations. Let the idea take focus not the illustration.9. Know your audience. Don’t illustrate what they already know and clarify what they don’t.10. Never use the defaults, they are always WRONG!
Never hesitate to invest in good graphics. They pay for themselves by clarifying your research and data to those around you.

6 ITMC | Department of Biochemistry | UW–Madison ITMC | Department of Biochemistry | UW–Madison 7
Basic Adobe Illustrator
You will learn the following:
RGB vs. CMYKPlacing images or textZoom tool and View menuCharacter paletteParagraph paletteText tool
RGB vs. CMYK1. Open Adobe Illustrator.2. Choose File–New.
You will be presented with a New Document dialog box. Choose RGB for the Color Mode. Almost all of the files you create with Adobe Illustrator will be done as RGB files. RGB files are used in PowerPoint presentations, Posters and on the web, CMYK files are used for journal printing only.
Place command3. From the File menu choose Place. Use the Place
command to insert text from Microsoft Word or bit-mapped image files such as PICT, TIF, JPEG, GIF, PSD, EPS, etc. into Adobe Illustrator. Do not use the Place to insert Vector image files such as PRN, PS, EPS, PDF, and TXT (ASCII & binary) from programs such as Adobe Illustrator, Macromedia Freehand, Deneba Canvas, CorelDraw, ClarisWorks, etc or from "Print to File" commands. Simply use File Open for Vector illustrations and images. For your convenience, Adobe Illustrator will open or place almost any file format!
4. In the directory window choose the file ARGs1.tif from the Photoshop exercise.
Constrain and copy shortcutsTransform and DuplicationMoving objects with the Arrow keysBlack vs White selection toolsMarquee toolFill and StrokeBasic Graphing

8 ITMC | Department of Biochemistry | UW–Madison ITMC | Department of Biochemistry | UW–Madison 9
Zoom tool and View Menu5. Click on the zoom tool. The zoom tool works in
three different ways:1). You can click on an image and zoom in.2). You can hold down the option or alt key and click
to zoom out. Notice when you do this the plus sign in the middle of the magnifying lens turns to a minus sign (to show you zoom out).
3). You can click and drag a zoom window over a space and it will zoom into exactly that space.
Try all three. You can also Zoom in an out of an Illustrator window by using the options in the View menu (below left). Try Zoom In, Zoom Out, Fit in Window, and Actual Size from the View menu. When you are finished, choose Actual Size from the View Menu and drag a box over the ARG with the zoom tool (see example at right).
Drag
Zoom tool

8 ITMC | Department of Biochemistry | UW–Madison ITMC | Department of Biochemistry | UW–Madison 9
Basic labeling with Adobe Illustrator
Character palette6. From the Window menu, choose Type, then
Character (image right). The Character Palette will open. Note: If the Character palette is already open, the word Character will have a check mark next to its name in the window menu. If this is the case, you only need to find the palette on your desktop. Click on the little black triangle in the upper right corner of the palette and choose Show Options. Also notice the options for Superscript and Subscript hidden under this triangle.
Paragraph palette7. From the Window menu choose Type and
then Paragraph. The Paragraph Palette will open. Click on the little black triangle in the upper right corner of the palette and choose Show Options.
10 ITMC | Department of Biochemistry | UW–Madison ITMC | Department of Biochemistry | UW–Madison 11
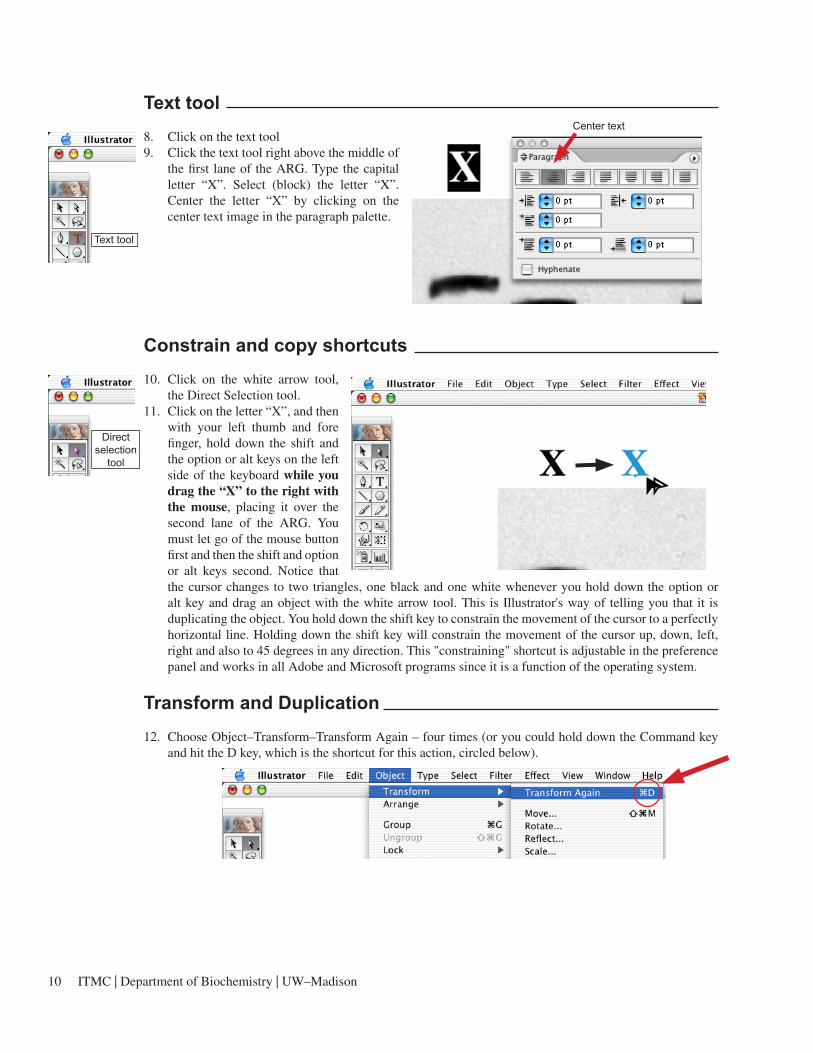
Text tool8. Click on the text tool9. Click the text tool right above the middle of
the first lane of the ARG. Type the capital letter “X”. Select (block) the letter “X”. Center the letter “X” by clicking on the center text image in the paragraph palette.
Constrain and copy shortcuts10. Click on the white arrow tool,
the Direct Selection tool.11. Click on the letter “X”, and then
with your left thumb and fore finger, hold down the shift and the option or alt keys on the left side of the keyboard while you drag the “X” to the right with the mouse, placing it over the second lane of the ARG. You must let go of the mouse button first and then the shift and option or alt keys second. Notice that the cursor changes to two triangles, one black and one white whenever you hold down the option or alt key and drag an object with the white arrow tool. This is Illustrator's way of telling you that it is duplicating the object. You hold down the shift key to constrain the movement of the cursor to a perfectly horizontal line. Holding down the shift key will constrain the movement of the cursor up, down, left, right and also to 45 degrees in any direction. This "constraining" shortcut is adjustable in the preference panel and works in all Adobe and Microsoft programs since it is a function of the operating system.
Transform and Duplication12. Choose Object–Transform–Transform Again – four times (or you could hold down the Command key
and hit the D key, which is the shortcut for this action, circled below).
Center text
Text tool
Directselection
tool

10 ITMC | Department of Biochemistry | UW–Madison ITMC | Department of Biochemistry | UW–Madison 11
The letter X will move to the right and duplicate itself four times! By duplicating your text this way you will get the same size and style font for all of your text. You may notice that you didn't exactly duplicate the text over the second lane of the ARG when you option or alt dragged it, so when you duplicated the text three more times it didn't exactly line up with the other lanes of the gel. We will now fix the alignment!
Move objects via the Arrow keys13. Take the white arrow tool and click on one of the misaligned “X's”. Using the Arrow keys on the
keyboard you can make the text move a small distance to the left or the right. If you hold down the shift key and then click on the arrow keys on the keyboard the text will move ten times as far. Do this to get your “X's” in visual alignment with the lanes of the ARG. This shortcut is adjustable in the preference panel and works in all Adobe and Microsoft programs.
14. With the type tool change the “X's” to "1", "2" , "3", etc.
Black vs. White selection tools15. With the white arrow tool drag a box over all the lane numbers exactly as you see below. Note: Do not
include any of the ARG image below the numbers.
Notice that all of the numbers will be selected. The White arrow tool selects parts of objects in three different ways.1). If you click on any part of an object, that part will be selected.2). If you option or alt click on any part of an object the entire object will be selected.3). If you drag a box over any part(s) of an object that/those part(s) will be selected. The Black arrow
tool, the Selection tool, selects whole objects in the same way. The black arrow tool will also allow you to rotate and scale selections while the white arrow tool will not.
Drag
12 ITMC | Department of Biochemistry | UW–Madison ITMC | Department of Biochemistry | UW–Madison 13
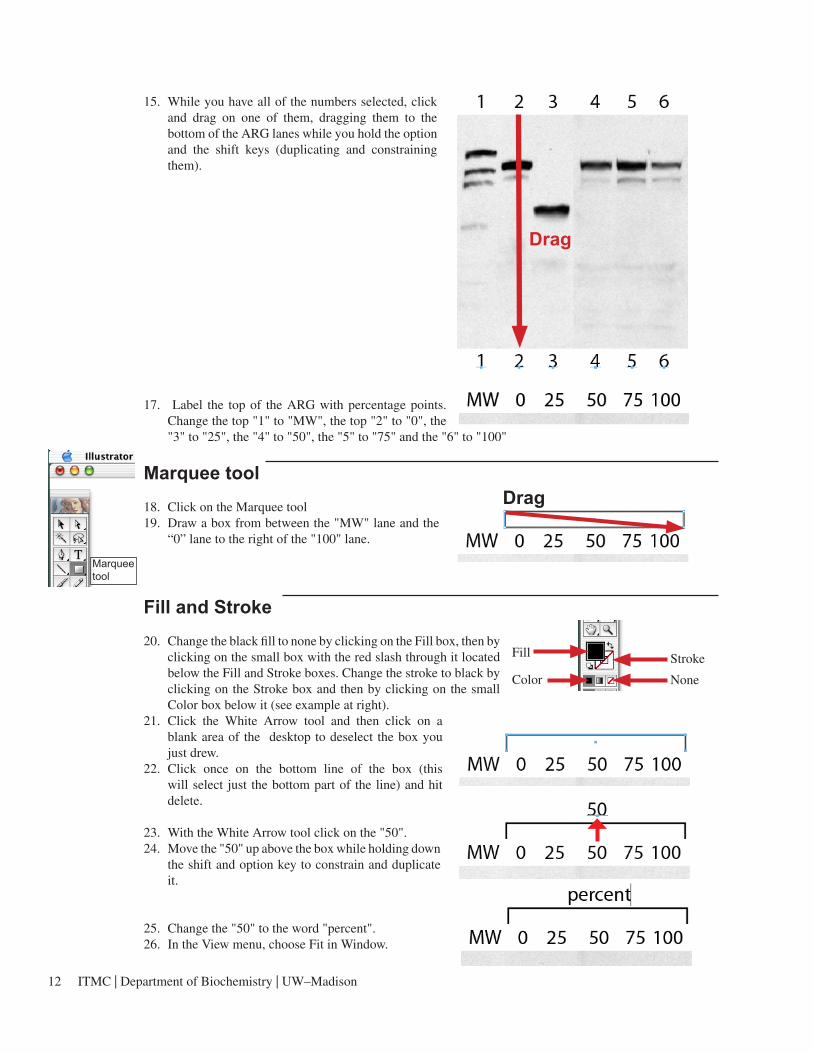
15. While you have all of the numbers selected, click and drag on one of them, dragging them to the bottom of the ARG lanes while you hold the option and the shift keys (duplicating and constraining them).
17. Label the top of the ARG with percentage points. Change the top "1" to "MW", the top "2" to "0", the "3" to "25", the "4" to "50", the "5" to "75" and the "6" to "100"
Marquee tool18. Click on the Marquee tool19. Draw a box from between the "MW" lane and the
“0” lane to the right of the "100" lane.
Fill and Stroke 20. Change the black fill to none by clicking on the Fill box, then by
clicking on the small box with the red slash through it located below the Fill and Stroke boxes. Change the stroke to black by clicking on the Stroke box and then by clicking on the small Color box below it (see example at right).
21. Click the White Arrow tool and then click on a blank area of the desktop to deselect the box you just drew.
22. Click once on the bottom line of the box (this will select just the bottom part of the line) and hit delete.
23. With the White Arrow tool click on the "50".24. Move the "50" up above the box while holding down
the shift and option key to constrain and duplicate it.
25. Change the "50" to the word "percent".26. In the View menu, choose Fit in Window.
Fill Stroke
NoneColor
Drag
Drag
Marqueetool

12 ITMC | Department of Biochemistry | UW–Madison ITMC | Department of Biochemistry | UW–Madison 13
Basic graphing with Adobe Illustrator
27. Click on the Graph tool in the toolbox. Notice that some of the tools in the toolbox have a tiny black triangle in the lower right corner. Tools with this triangle are called nested tools. If you click and hold down on one of these tools it will expand out and show you all of the options for that tool. Expand out the Graph tool and choose the Scatter Graph tool.
28. Drag a big square box (like the example below) with the Graph tool above the labeled ARG from "0" to "100" percent. Notice that a data entry window will automatically open.
29. Adobe Illustrator requires you enter data with the Y values in the first column and the X values in the second column, etc. Enter the following data in column 1: 90, 0, 70, 80, 30 and the following data in column 2: 1, 2, 3, 4, 5. Then click on the Check mark in the upper right of the data window to apply the data.
Y X Y X Y X Y
Drag
Data entry window
14 ITMC | Department of Biochemistry | UW–Madison ITMC | Department of Biochemistry | UW–Madison 15
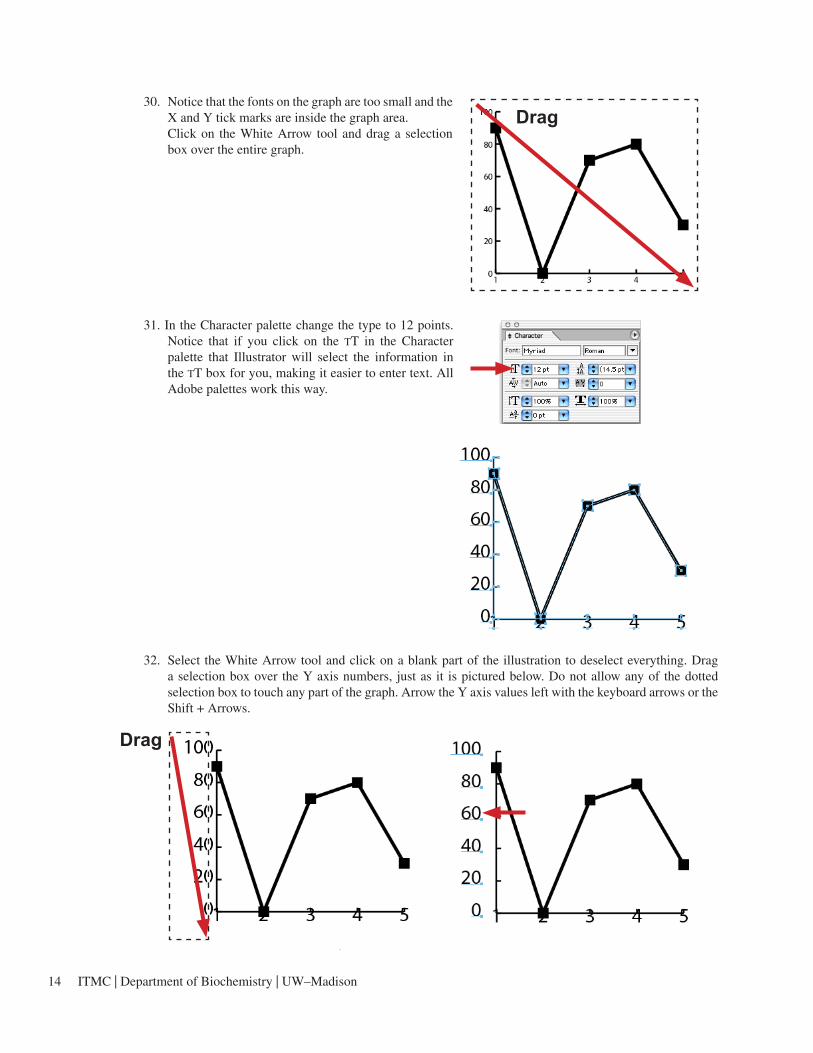
30. Notice that the fonts on the graph are too small and the X and Y tick marks are inside the graph area.
Click on the White Arrow tool and drag a selection box over the entire graph.
31. In the Character palette change the type to 12 points. Notice that if you click on the TT in the Character palette that Illustrator will select the information in the TT box for you, making it easier to enter text. All Adobe palettes work this way.
32. Select the White Arrow tool and click on a blank part of the illustration to deselect everything. Drag a selection box over the Y axis numbers, just as it is pictured below. Do not allow any of the dotted selection box to touch any part of the graph. Arrow the Y axis values left with the keyboard arrows or the Shift + Arrows.
Drag
Drag

14 ITMC | Department of Biochemistry | UW–Madison ITMC | Department of Biochemistry | UW–Madison 15
33. Do the same thing for the X axis. Notice that the selection box does not touch any part of the graph.
34. Using the White Arrow tool, option double-click on the Y axis tick marks, this will select all of them as a group. Arrow them left with the keyboard arrows or the Shift + Arrows.
35. Do the same for the X value tick marks.
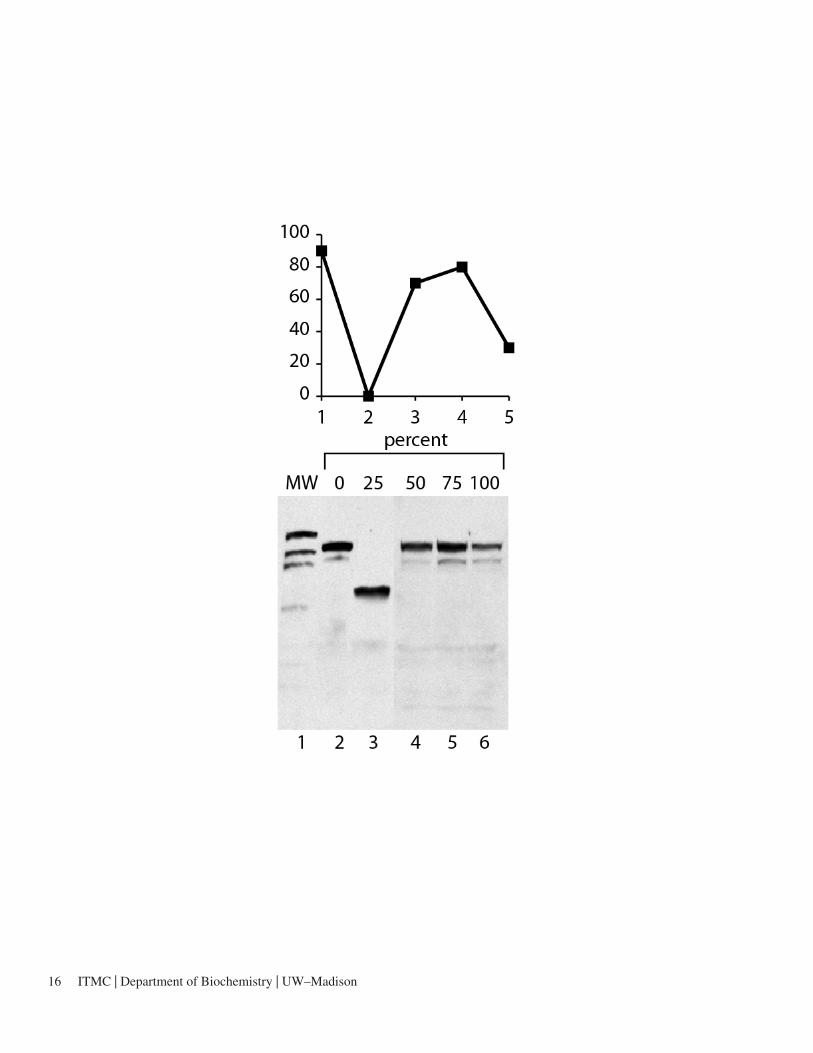
You are finished, your labeled ARG should look similar to the image on the next page.
Drag
16 ITMC | Department of Biochemistry | UW–Madison ITMC | Department of Biochemistry | UW–Madison 17