Embed Size (px)
Citation preview
By
Glenn R. Mueller, Ph.D. – Professor
Kyle Cascioli – Adjunct Professor
U.S. Commercial Debt Markets
Evolution
&
Dislocation
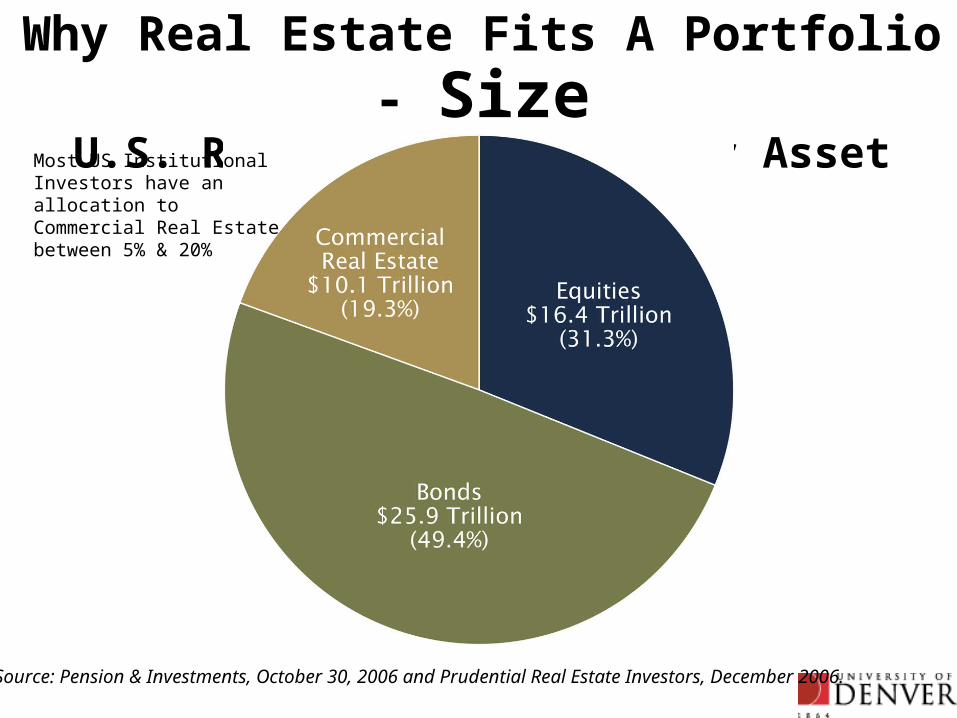
Why Real Estate Fits A Portfolio - SizeU.S. Real Estate vs. Other Asset Classes - 12/06
Source: Pension & Investments, October 30, 2006 and Prudential Real Estate Investors, December 2006.
Most US Institutional Investors have an allocation to Commercial Real Estate between 5% & 20%
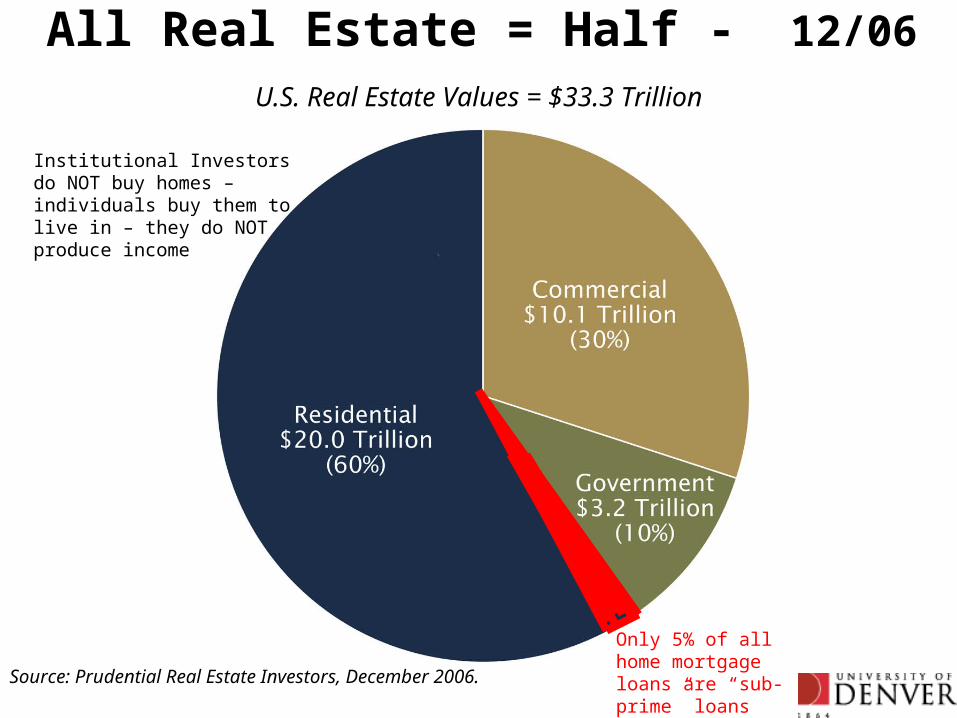
All Real Estate = Half - 12/06
Source: Prudential Real Estate Investors, December 2006.
U.S. Real Estate Values = $33.3 Trillion
Institutional Investors do NOT buy homes – individuals buy them to live in – they do NOT produce income
Only 5% of all home mortgage loans are “sub-prime” loans
$ CAPITAL $•DEBT is Major component of Real Estate
•Historically private loan sources (Banks, Ins Co’s)
•Major access to public CMBS markets in 1990s
•Cross boarder investing grows in 2000s
•Size and health of markets drives future values
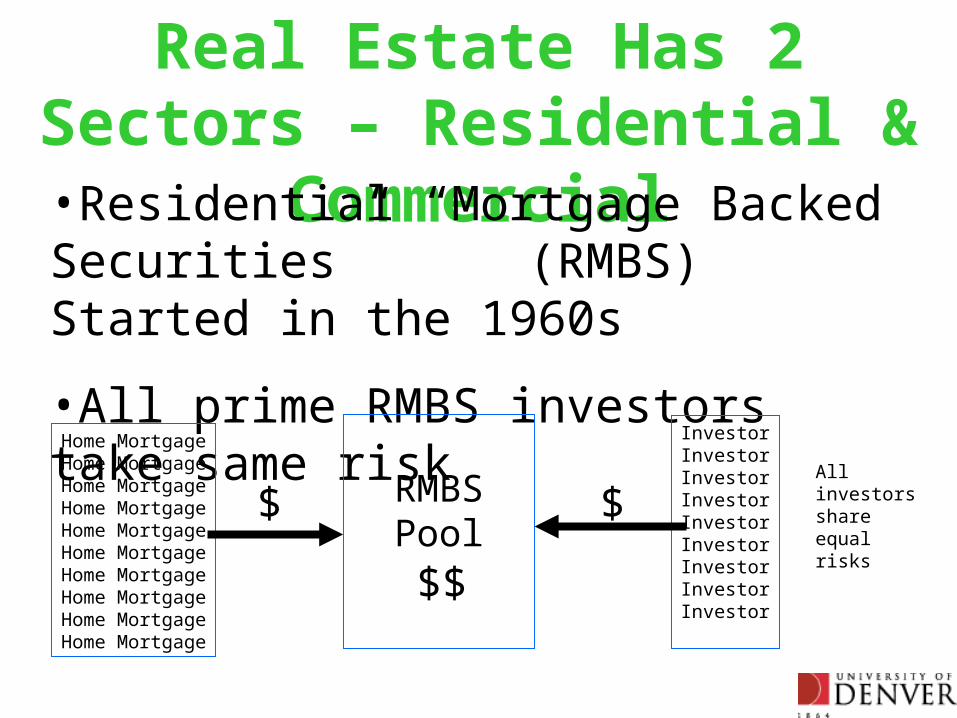
Real Estate Has 2 Sectors – Residential & Commercial
•Residential “Mortgage Backed Securities” (RMBS) Started in the 1960s
•All prime RMBS investors take same risk
Home MortgageHome MortgageHome MortgageHome MortgageHome MortgageHome MortgageHome MortgageHome MortgageHome MortgageHome Mortgage
RMBSPool
InvestorInvestorInvestorInvestorInvestorInvestorInvestorInvestorInvestor
$$
$$
All investors share equal risks
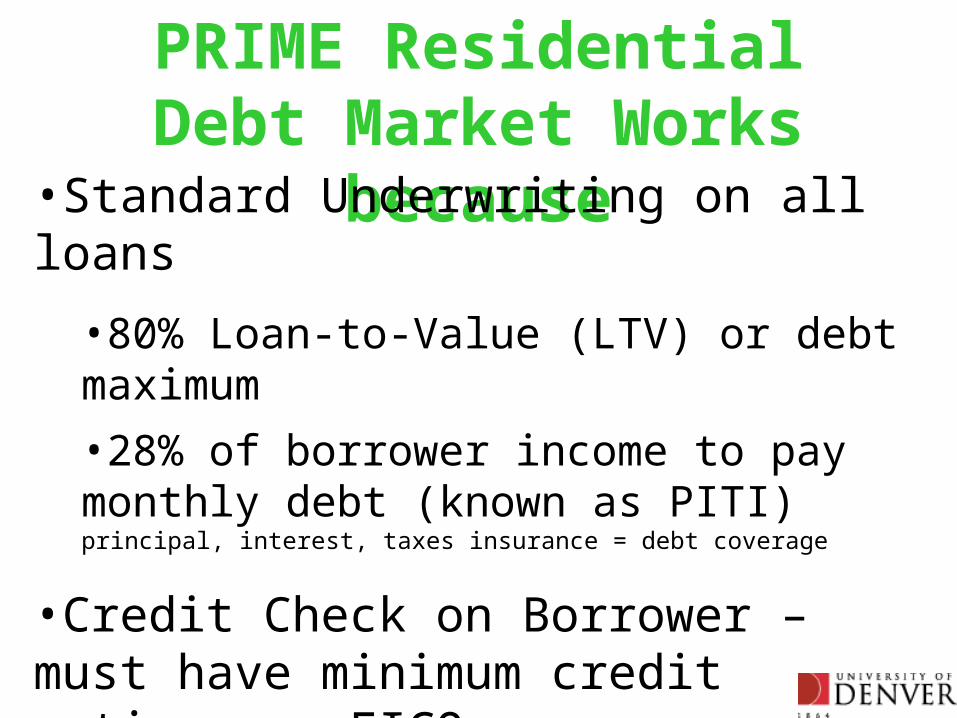
PRIME ResidentialDebt Market Works because
•Standard Underwriting on all loans
•80% Loan-to-Value (LTV) or debt maximum
•28% of borrower income to pay monthly debt (known as PITI) principal, interest, taxes insurance = debt coverage
•Credit Check on Borrower – must have minimum credit rating- or FICO score
•64% of U.S. population meets prime criteria

US Government “Enhances” Credit & Reduces Risk through
The Fairy Godmothers of the Residential Mortgage Market
(Quasi-Government Agencies) – they do NOTNOT make sub-prime loans
Freddie Mac
Fannie MaeGinnie Mae
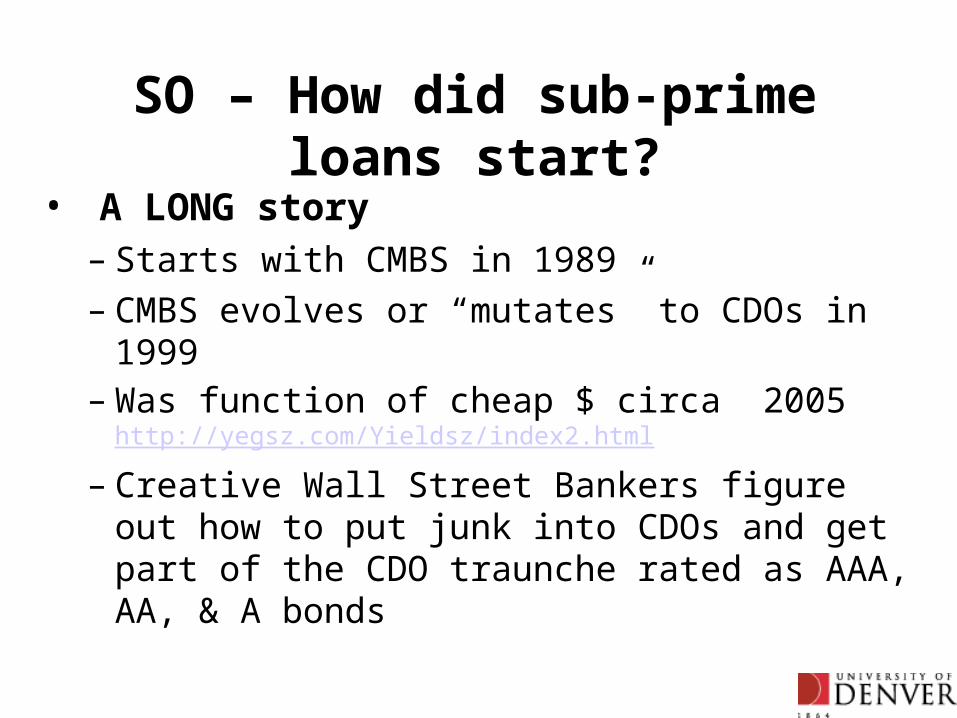
SO – How did sub-prime loans start?
• A LONG story– Starts with CMBS in 1989– CMBS evolves or “mutates” to CDOs in 1999– Was function of cheap $ circa 2005
http://yegsz.com/Yieldsz/index2.html
– Creative Wall Street Bankers figure out how to put junk into CDOs and get part of the CDO traunche rated as AAA, AA, & A bonds
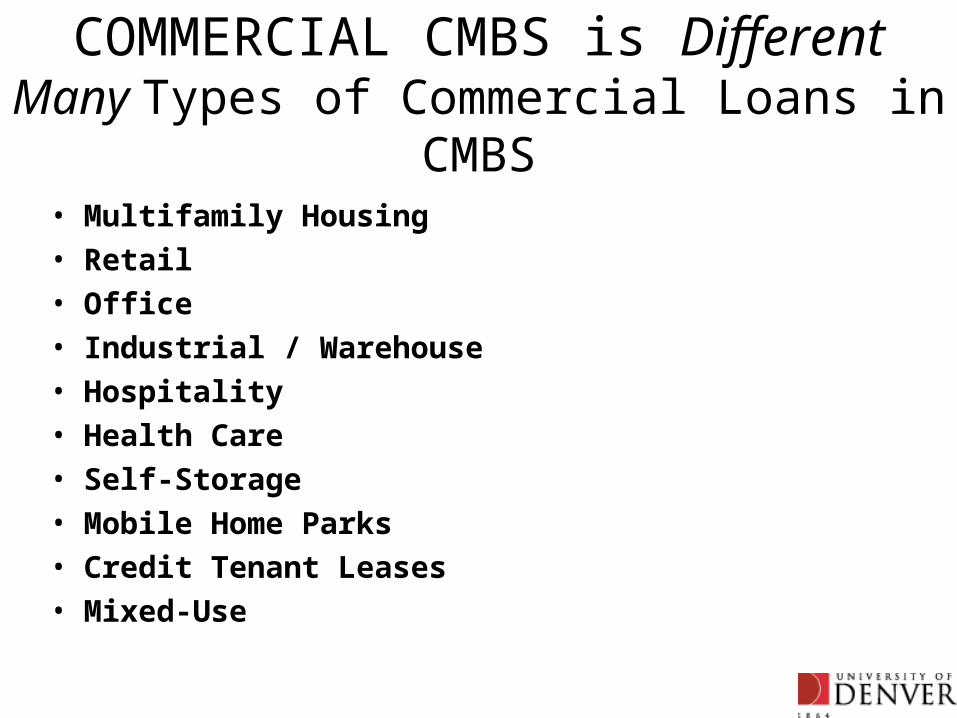
COMMERCIAL CMBS is DifferentMany Types of Commercial Loans in CMBS
• Multifamily Housing
• Retail
• Office
• Industrial / Warehouse
• Hospitality
• Health Care
• Self-Storage
• Mobile Home Parks
• Credit Tenant Leases
• Mixed-Use
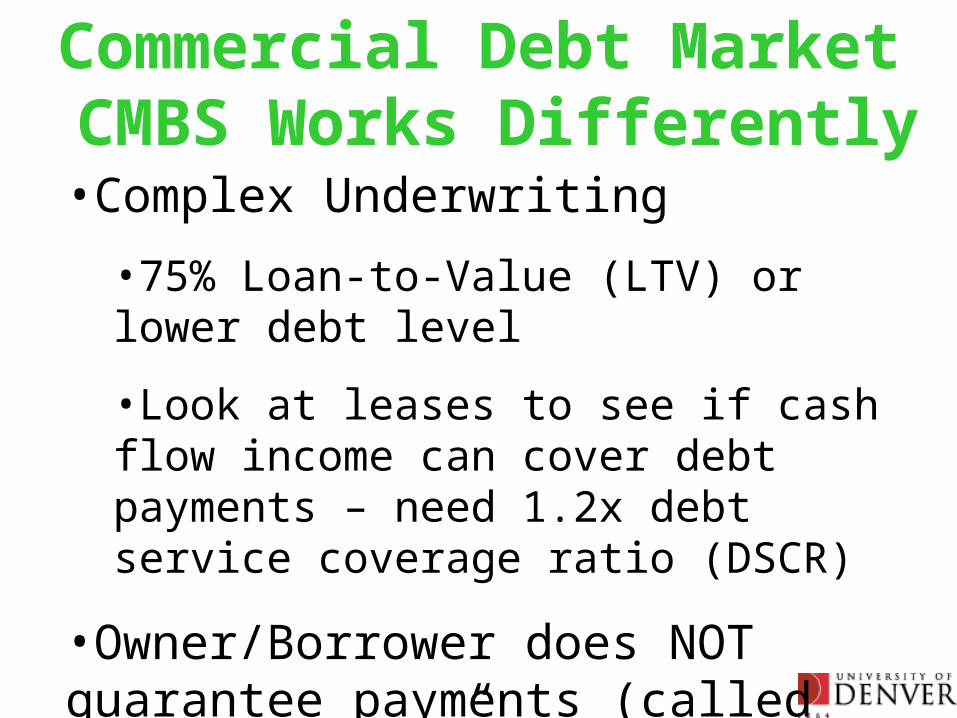
Commercial Debt Market CMBS Works Differently
•Complex Underwriting
•75% Loan-to-Value (LTV) or lower debt level
•Look at leases to see if cash flow income can cover debt payments – need 1.2x debt service coverage ratio (DSCR)
•Owner/Borrower does NOT guarantee payments (called “non-recourse” lending)
•Local market knowledge important
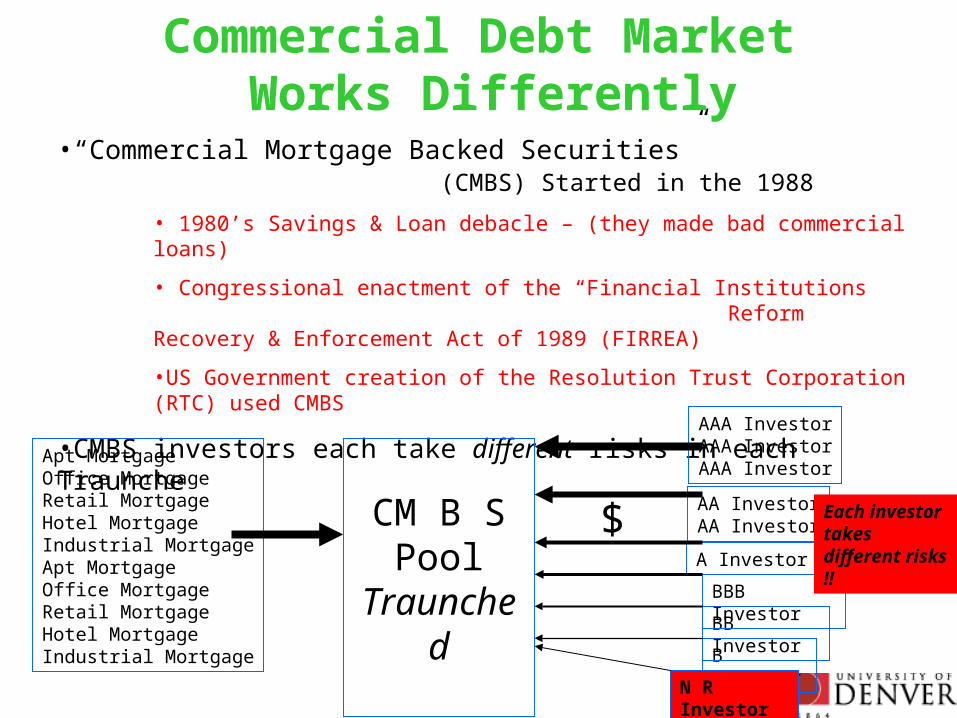
•“Commercial Mortgage Backed Securities” (CMBS) Started in the 1988
• 1980’s Savings & Loan debacle – (they made bad commercial loans)
• Congressional enactment of the “Financial Institutions Reform Recovery & Enforcement Act of 1989 (FIRREA)
•US Government creation of the Resolution Trust Corporation (RTC) used CMBS
•CMBS investors each take different risks in each Traunche
Apt MortgageOffice MortgageRetail MortgageHotel MortgageIndustrial MortgageApt MortgageOffice MortgageRetail MortgageHotel MortgageIndustrial Mortgage
CM B SPool
Traunched
AAA InvestorAAA InvestorAAA Investor
$AA InvestorAA Investor
A Investor
B Investor
N R Investor
BB Investor
BBB Investor
Commercial Debt Market Works Differently
Each investor takes different risks !!
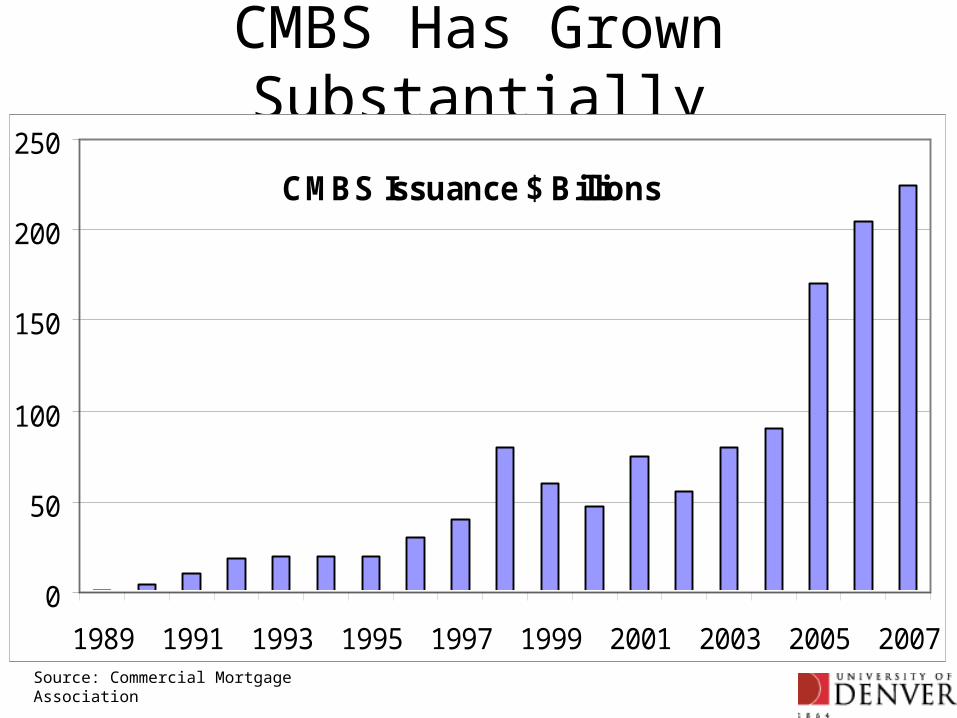
CMBS Has Grown Substantially
CMBS Issuance $ Billions
0
50
100
150
200
250
1989 1991 1993 1995 1997 1999 2001 2003 2005 2007Source: Commercial Mortgage Association
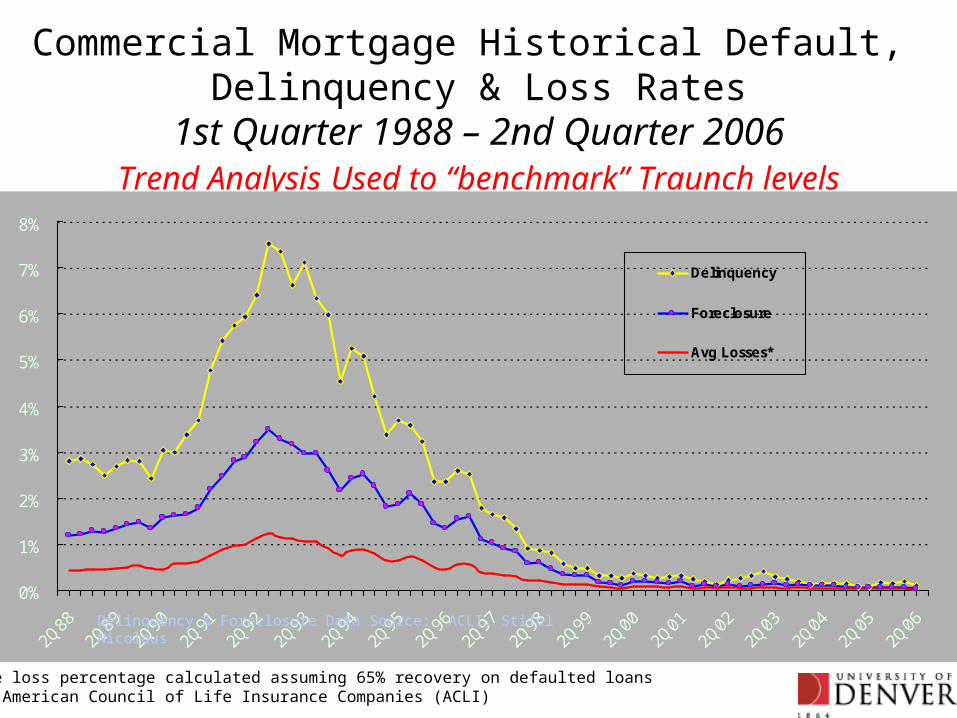
Commercial Mortgage Historical Default, Delinquency & Loss Rates
1st Quarter 1988 – 2nd Quarter 2006Trend Analysis Used to “benchmark” Traunch levels
0%
1%
2%
3%
4%
5%
6%
7%
8%
Delinquency
Foreclosure
Avg Losses*
Delinquency & Foreclosure Data Source: ACLI, Stifel Nicolaus
*Average loss percentage calculated assuming 65% recovery on defaulted loansSource: American Council of Life Insurance Companies (ACLI)
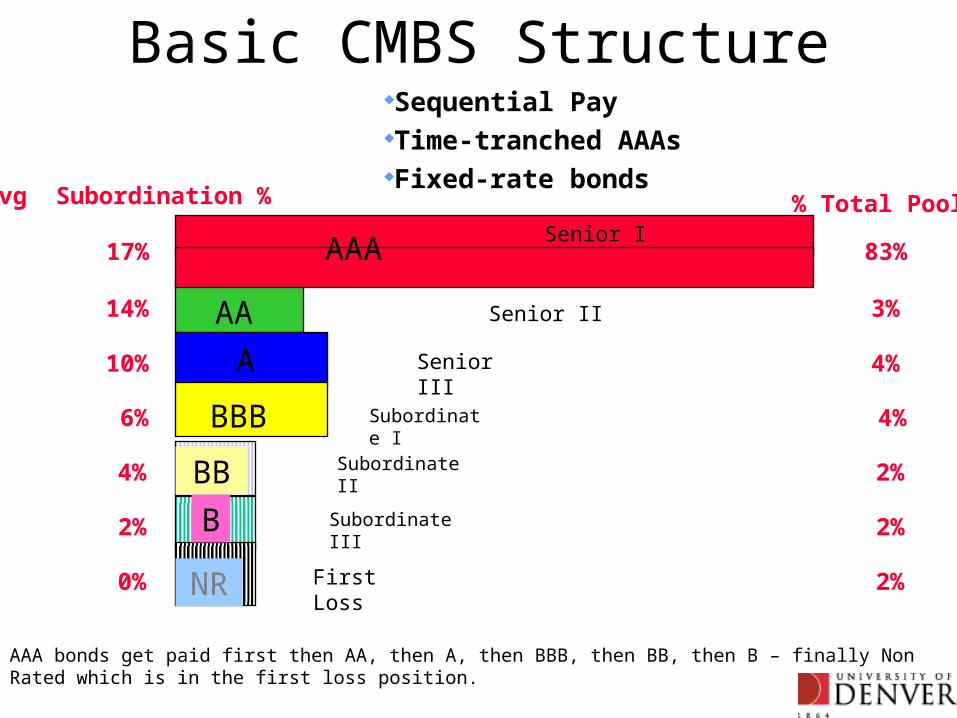
Basic CMBS StructureSequential PayTime-tranched
AAAs Fixed-rate bonds
AAA
A
BBB
BB
B
NR
IO
Avg Subordination %
17%
14%
10%
6%
4%
2%
0%
Senior I
Senior II
Senior III
Subordinate I
Subordinate II
Subordinate III
First Loss
AA
AAA
AAA bonds get paid first then AA, then A, then BBB, then BB, then B – finally Non Rated which is in the first loss position.
% Total Pool
83%
3%
4%
4%
2%
2%
2%
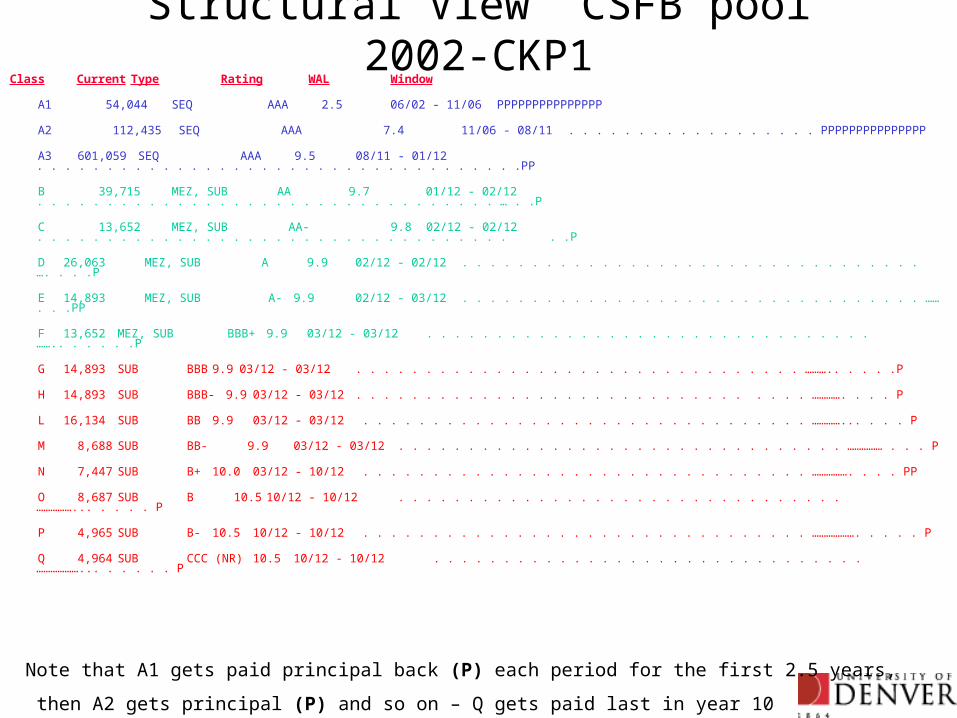
Structural View CSFB pool 2002-CKP1Class Current Type Rating WAL Window A1 54,044 SEQ AAA 2.5 06/02 - 11/06 PPPPPPPPPPPPPPP A2 112,435 SEQ AAA 7.4 11/06 - 08/11 . . . . . . . . . . . . . . . . . . PPPPPPPPPPPPPPP A3 601,059 SEQ AAA 9.5 08/11 - 01/12 . . . . . . . . . . . . . . . . . . . . . . . . . . . . . . . . . . .PP B 39,715 MEZ, SUB AA 9.7 01/12 - 02/12 . . . . . . . . . . . . . . . . . . . . . . . . . . . . . . . . . … . .P C 13,652 MEZ, SUB AA- 9.8 02/12 - 02/12 . . . . . . . . . . . . . . . . . . . . . . . . . . . . . . . . . . . .P D 26,063 MEZ, SUB A 9.9 02/12 - 02/12 . . . . . . . . . . . . . . . . . . . . . . . . . . . . . . . . . …. . . .P
E 14,893 MEZ, SUB A- 9.9 02/12 - 03/12 . . . . . . . . . . . . . . . . . . . . . . . . . . . . . . . . . …… . . .PP F 13,652 MEZ, SUB BBB+ 9.9 03/12 - 03/12 . . . . . . . . . . . . . . . . . . . . . . . . . . . . . . . . …….. . . . . .P G 14,893 SUB BBB 9.9 03/12 - 03/12 . . . . . . . . . . . . . . . . . . . . . . . . . . . . . . . . ……….. . . . .P H 14,893 SUB BBB- 9.9 03/12 - 03/12 . . . . . . . . . . . . . . . . . . . . . . . . . . . . . . . . …………. . . . P L 16,134 SUB BB 9.9 03/12 - 03/12 . . . . . . . . . . . . . . . . . . . . . . . . . . . . . . . . …………... . . . P M 8,688 SUB BB- 9.9 03/12 - 03/12 . . . . . . . . . . . . . . . . . . . . . . . . . . . . . . . . …………… . . . P N 7,447 SUB B+ 10.0 03/12 - 10/12 . . . . . . . . . . . . . . . . . . . . . . . . . . . . . . . . ……………. . . . PP O 8,687 SUB B 10.5 10/12 - 10/12 . . . . . . . . . . . . . . . . . . . . . . . . . . . . . . . . ……………... . . . . P P 4,965 SUB B- 10.5 10/12 - 10/12 . . . . . . . . . . . . . . . . . . . . . . . . . . . . . . . . ………………. . . . .
P
Q 4,964 SUB CCC (NR) 10.5 10/12 - 10/12 . . . . . . . . . . . . . . . . . . . . . . . . . . . . . . . ………………... . . . . . P
Note that A1 gets paid principal back (P) each period for the first 2.5 years,
then A2 gets principal (P) and so on – Q gets paid last in year 10
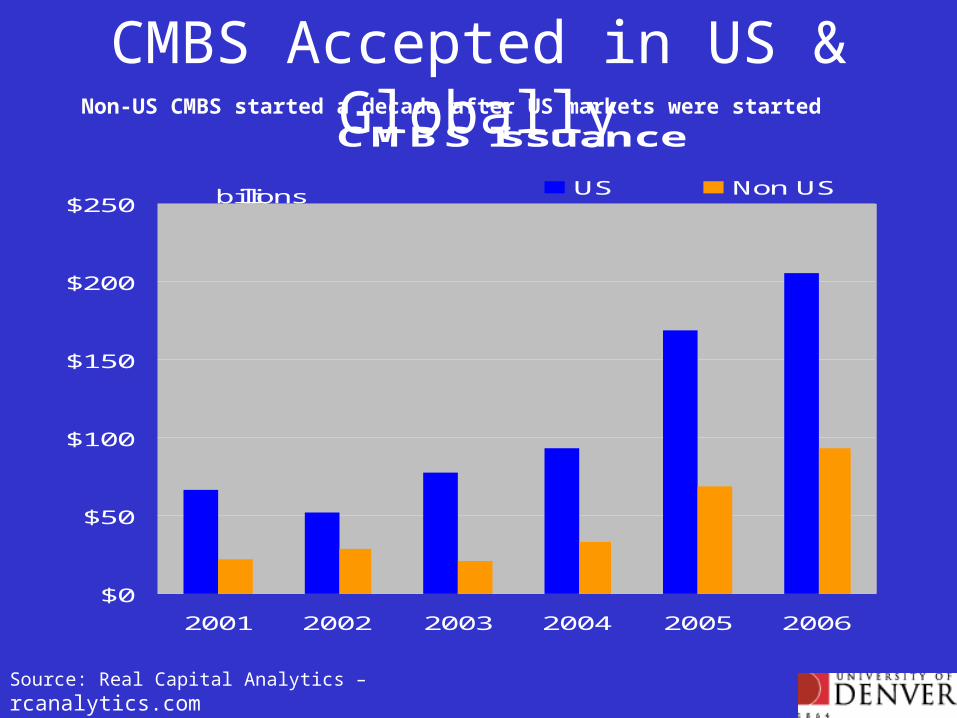
CMBS Issuance
$0
$50
$100
$150
$200
$250
2001 2002 2003 2004 2005 2006
billions US Non US
CMBS Accepted in US & Globally
Source: Real Capital Analytics – rcanalytics.com
Non-US CMBS started a decade after US markets were started
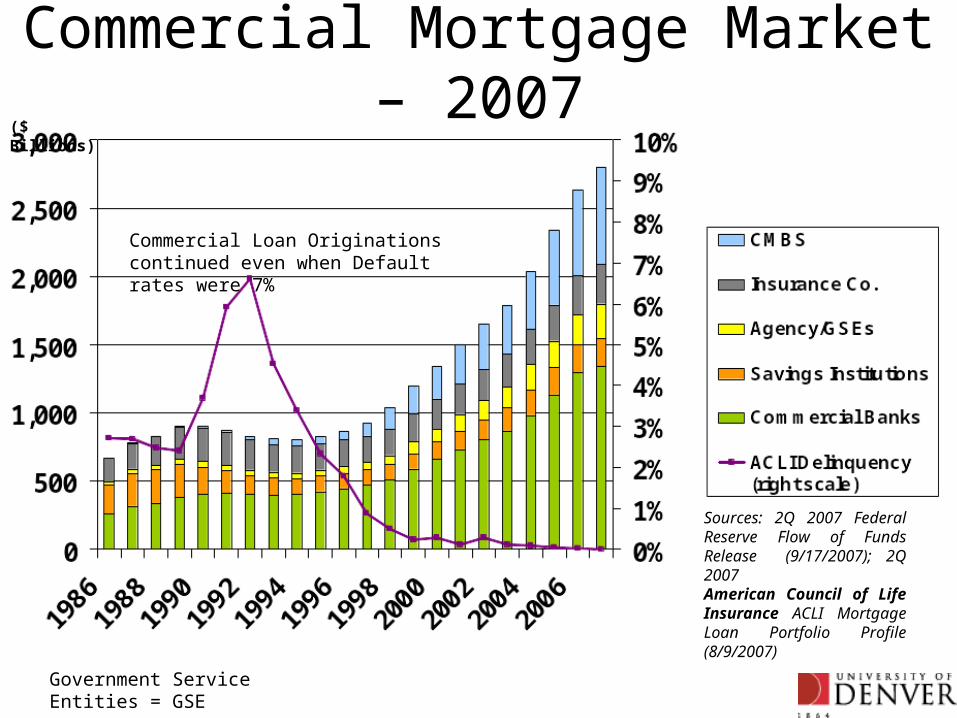
Commercial Mortgage Market – 2007
Sources: 2Q 2007 Federal Reserve Flow of Funds Release (9/17/2007); 2Q 2007American Council of Life Insurance ACLI Mortgage Loan Portfolio Profile (8/9/2007)
($ Billions)
Commercial Loan Originations continued even when Default rates were 7%
Government Service Entities = GSE
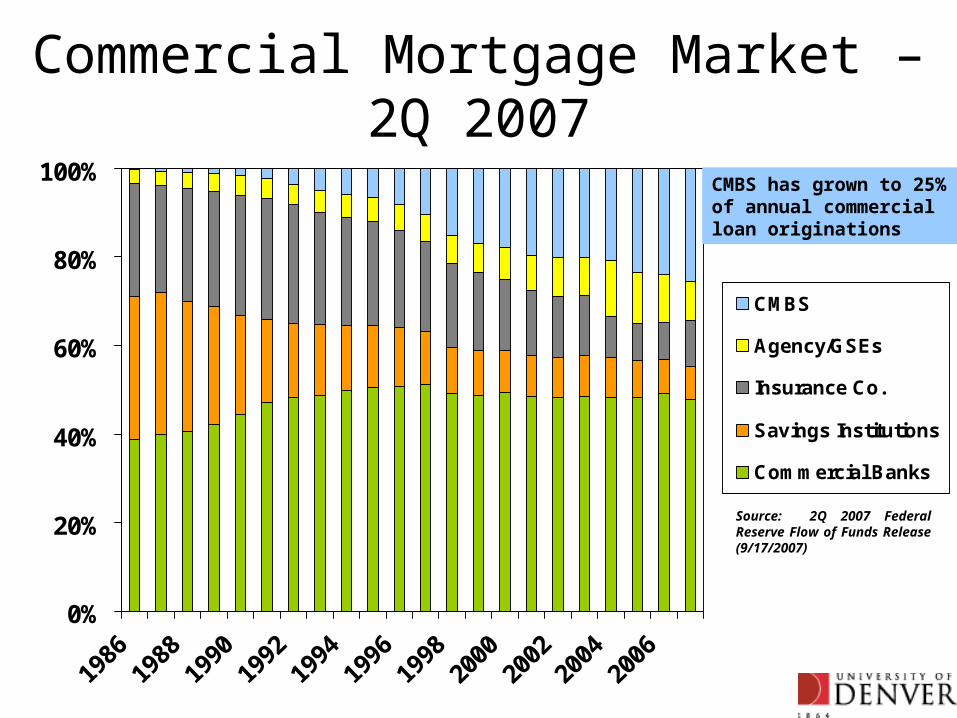
Commercial Mortgage Market – 2Q 2007
0%
20%
40%
60%
80%
100%
1986
1988
1990
1992
1994
1996
1998
2000
2002
2004
2006
CMBS
Agency/GSEs
Insurance Co.
Savings Institutions
Commercial Banks
Source: 2Q 2007 Federal Reserve Flow of Funds Release (9/17/2007)
CMBS has grown to 25% of annual commercial loan originations
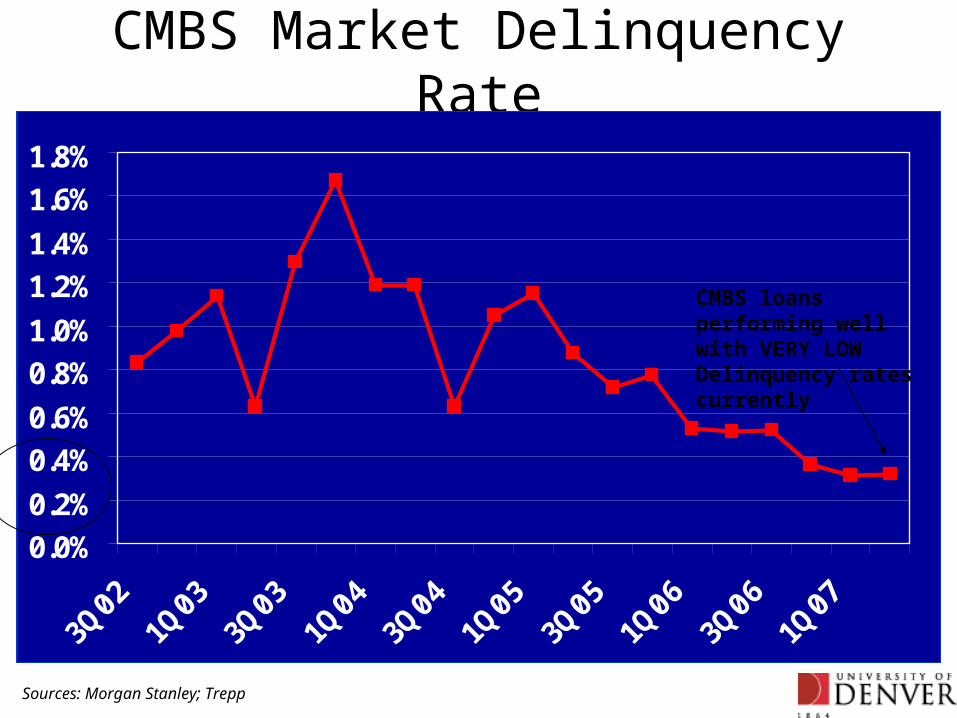
CMBS Market Delinquency Rate
Sources: Morgan Stanley; Trepp
0.0%
0.2%
0.4%
0.6%
0.8%
1.0%
1.2%
1.4%
1.6%
1.8%
3Q02
1Q03
3Q03
1Q04
3Q04
1Q05
3Q05
1Q06
3Q06
1Q07
CMBS loans performing well with VERY LOW Delinquency rates currently
0%
5%
10%
15%
20%
25%
30%
35%
1997
1998
1999
2000
2001
2002
2003
2004
2005
2006
1Q20
07
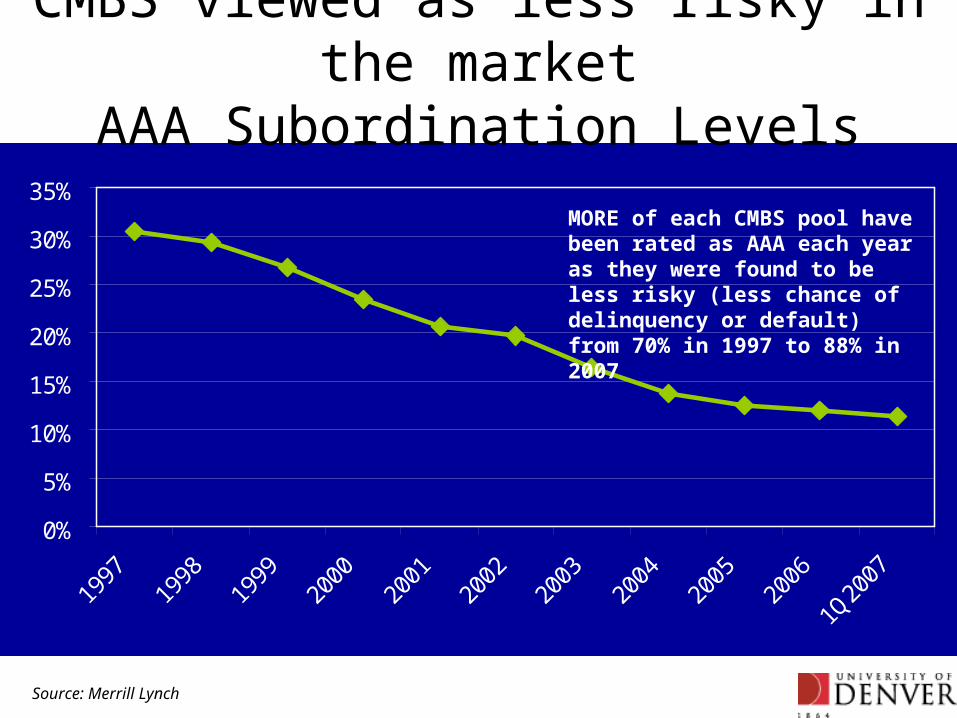
Source: Merrill Lynch
CMBS viewed as less risky in the marketAAA Subordination Levels
MORE of each CMBS pool have been rated as AAA each year as they were found to be less risky (less chance of delinquency or default) from 70% in 1997 to 88% in 2007
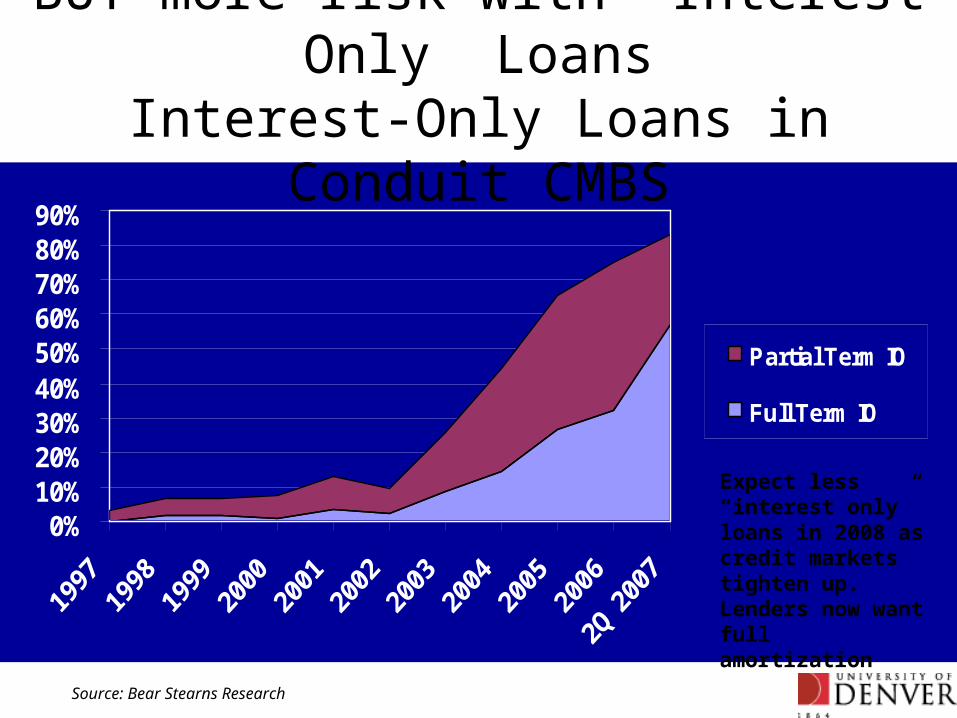
0%10%20%30%40%50%60%70%80%90%
Partial Term IO
Full Term IO
BUT more risk with “Interest Only” LoansInterest-Only Loans in Conduit CMBS
Source: Bear Stearns Research
Expect less “interest only” loans in 2008 as credit markets tighten up. Lenders now want full amortization
0
100
200
300
400
500
600
1997
1998
1999
2000
2001
2002
2003
2004
2005
2006
2007
AAA - 10Yr
BBB
BBB-
Sub-Prim
e
Mel
tdown!
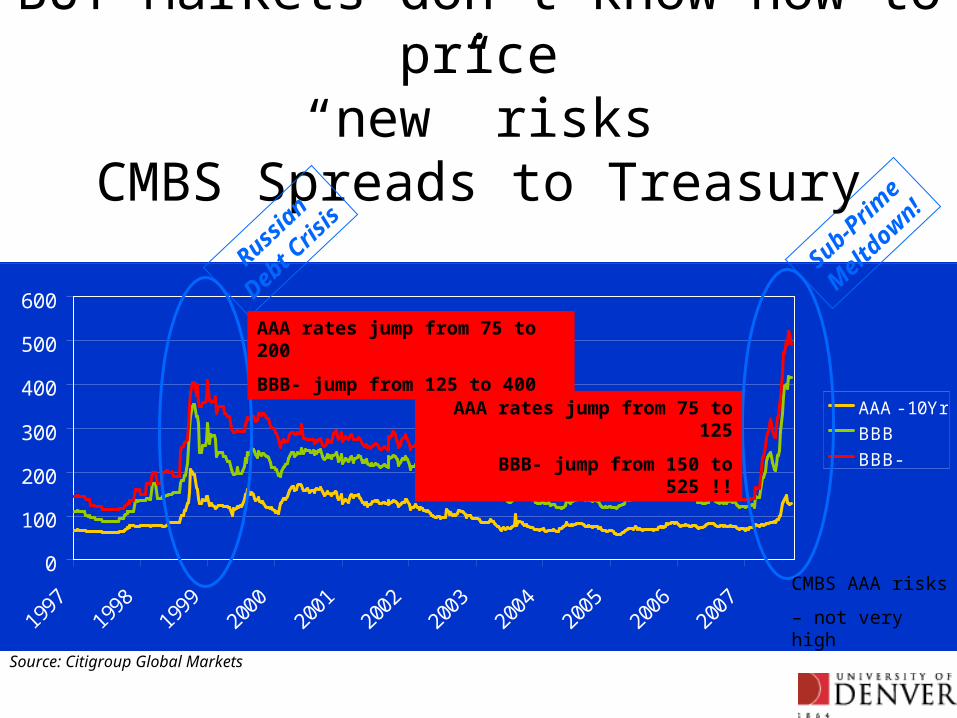
BUT Markets don’t know how to price“new” risks
CMBS Spreads to Treasury
Source: Citigroup Global Markets
Russia
n
Debt C
risis
CMBS AAA risks
– not very high
AAA rates jump from 75 to 200
BBB- jump from 125 to 400
AAA rates jump from 75 to 125
BBB- jump from 150 to 525 !!
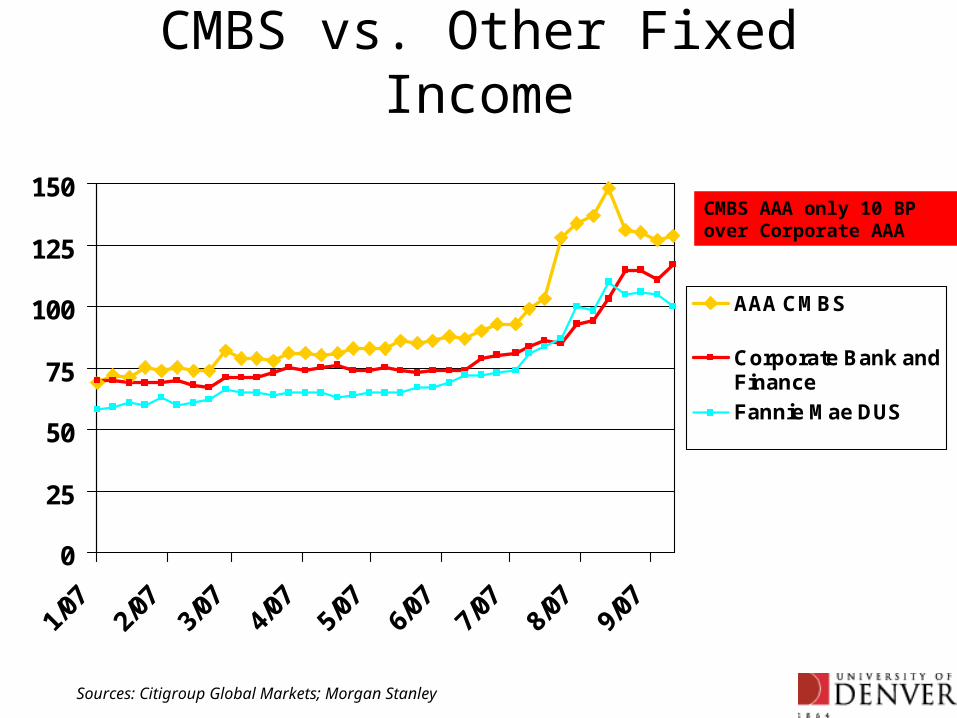
CMBS vs. Other Fixed Income
0
25
50
75
100
125
150
1/07
2/07
3/07
4/07
5/07
6/07
7/07
8/07
9/07
AAA CMBS
Corporate Bank andFinance
Fannie Mae DUS
Sources: Citigroup Global Markets; Morgan Stanley
CMBS AAA only 10 BP over Corporate AAA
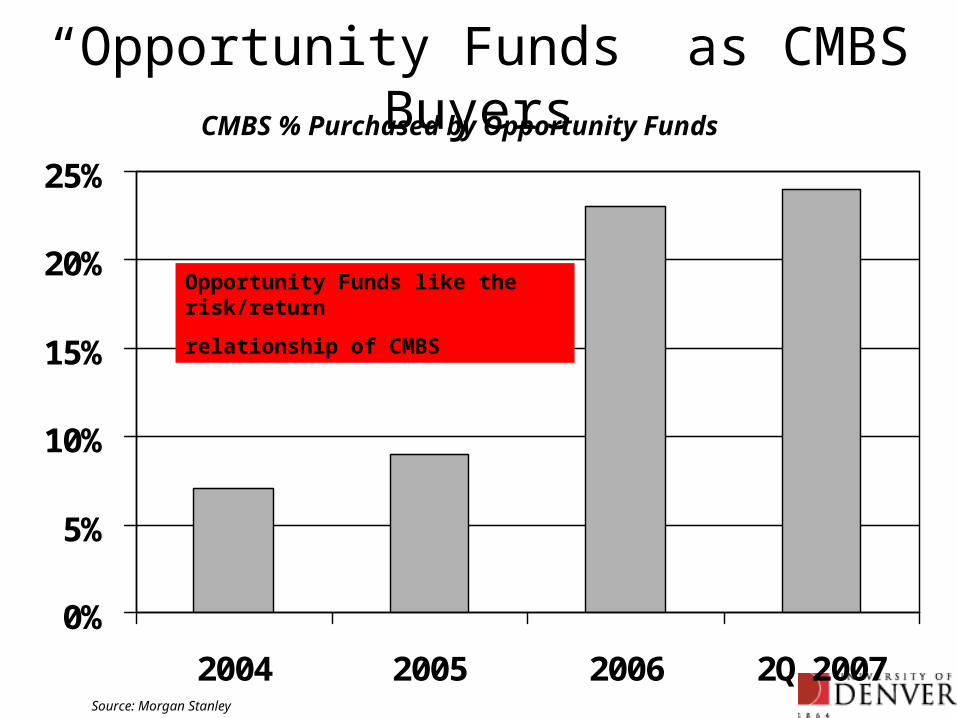
“Opportunity Funds” as CMBS Buyers
0%
5%
10%
15%
20%
25%
2004 2005 2006 2Q 2007Source: Morgan Stanley
CMBS % Purchased by Opportunity Funds
Opportunity Funds like the risk/return
relationship of CMBS
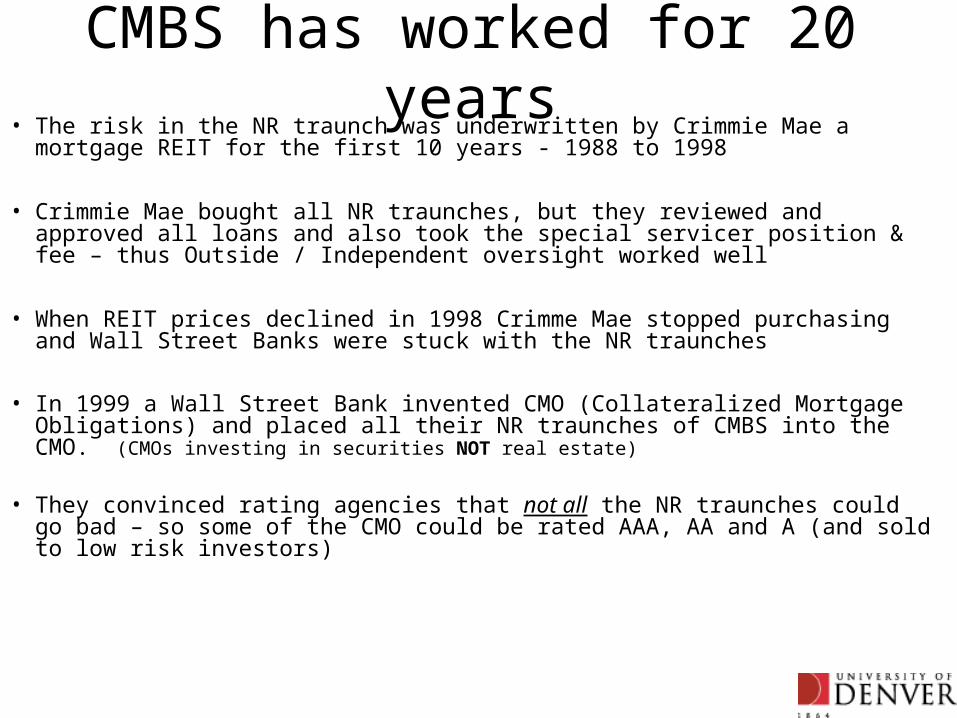
CMBS has worked for 20 years• The risk in the NR traunch was underwritten by Crimmie Mae a mortgage REIT for
the first 10 years - 1988 to 1998
• Crimmie Mae bought all NR traunches, but they reviewed and approved all loans and also took the special servicer position & fee – thus Outside / Independent oversight worked well
• When REIT prices declined in 1998 Crimme Mae stopped purchasing and Wall Street Banks were stuck with the NR traunches
• In 1999 a Wall Street Bank invented CMO (Collateralized Mortgage Obligations) and placed all their NR traunches of CMBS into the CMO. (CMOs investing in securities NOT real estate)
• They convinced rating agencies that not all the NR traunches could go bad – so some of the CMO could be rated AAA, AA and A (and sold to low risk investors)
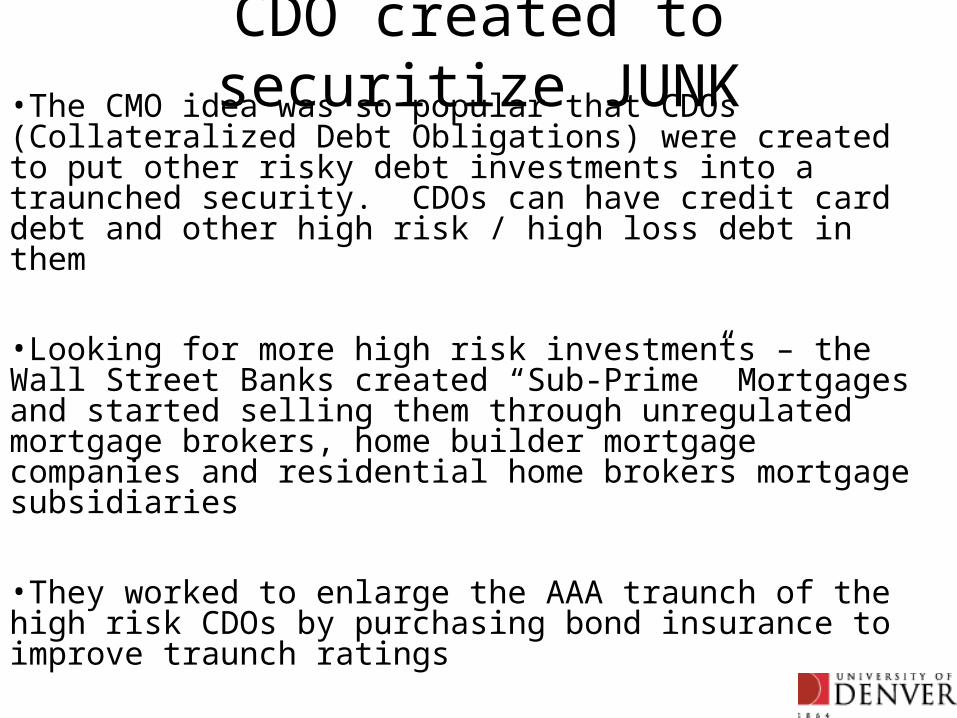
•The CMO idea was so popular that CDOs (Collateralized Debt Obligations) were created to put other risky debt investments into a traunched security. CDOs can have credit card debt and other high risk / high loss debt in them
•Looking for more high risk investments – the Wall Street Banks created “Sub-Prime” Mortgages and started selling them through unregulated mortgage brokers, home builder mortgage companies and residential home brokers mortgage subsidiaries
•They worked to enlarge the AAA traunch of the high risk CDOs by purchasing bond insurance to improve traunch ratings
•Without a NR traunche buyer – the Wall Steet Banks kept the NR traunche on their books – Banks currently taking all their losses
•NO PROBLEMS while the residential market was going UP – but bad now that the market is going down
CDO created to securitize JUNK
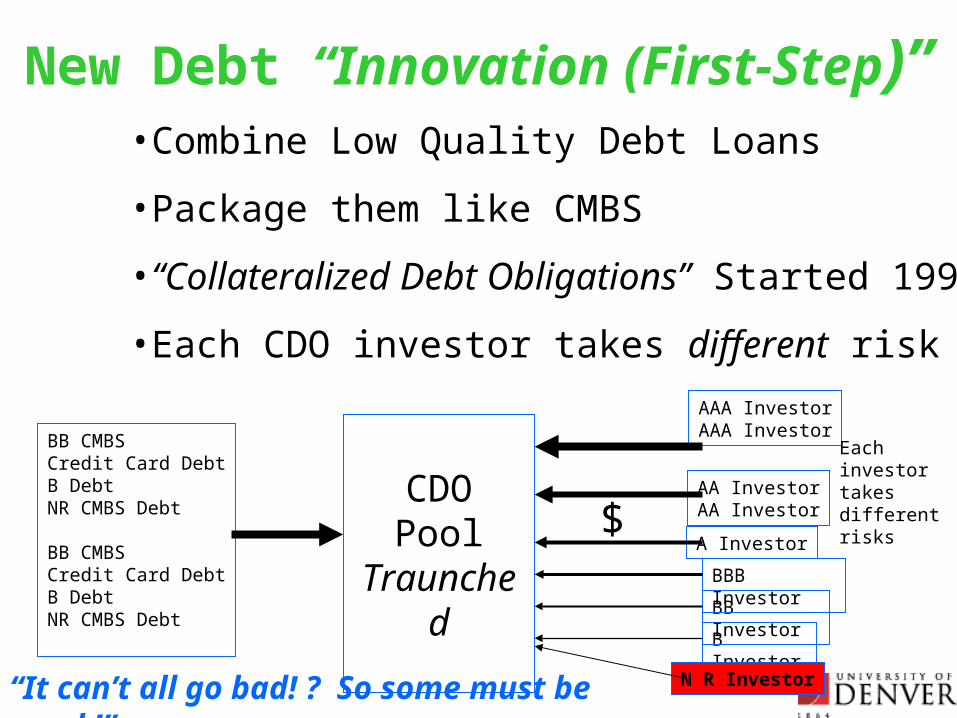
New Debt “Innovation (First-Step)”•Combine Low Quality Debt Loans
•Package them like CMBS
•“Collateralized Debt Obligations” Started 1999
•Each CDO investor takes different risk
BB CMBSCredit Card DebtB DebtNR CMBS Debt
BB CMBSCredit Card DebtB DebtNR CMBS Debt
CDOPool
Traunched
AAA InvestorAAA Investor
$AA InvestorAA Investor
A Investor
B Investor
N R Investor
BB Investor
BBB Investor
“It can’t all go bad! ? So some must be good !”
Each investor takes different risks
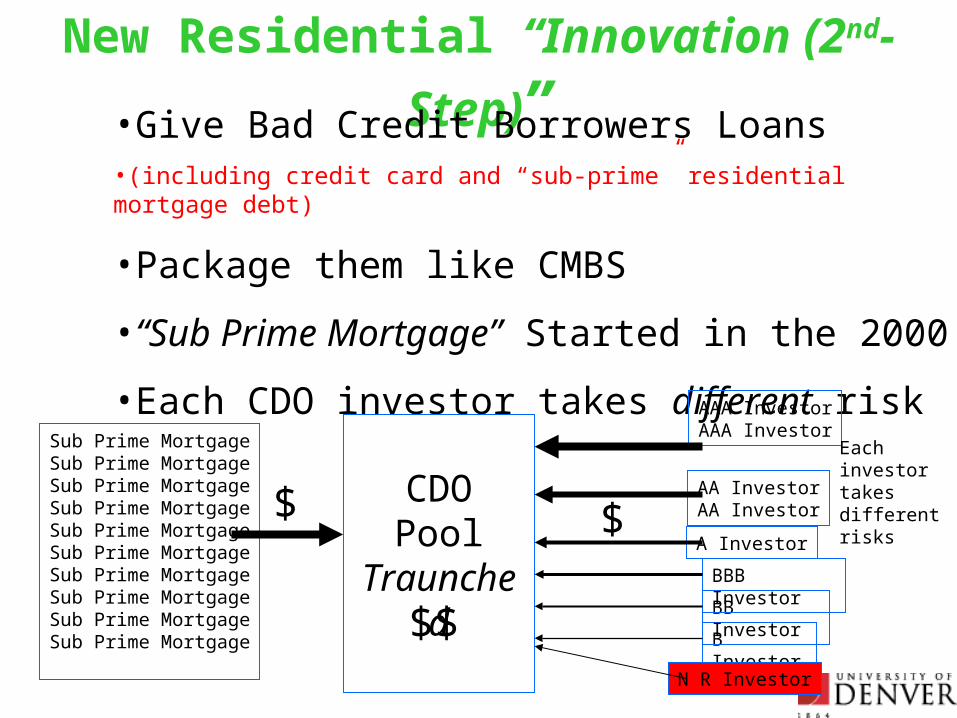
New Residential “Innovation (2nd-Step)”•Give Bad Credit Borrowers Loans•(including credit card and “sub-prime” residential mortgage debt)
•Package them like CMBS
•“Sub Prime Mortgage” Started in the 2000
•Each CDO investor takes different risk
Sub Prime MortgageSub Prime MortgageSub Prime MortgageSub Prime MortgageSub Prime MortgageSub Prime MortgageSub Prime MortgageSub Prime MortgageSub Prime MortgageSub Prime Mortgage
CDOPool
Traunched
AAA InvestorAAA Investor
$AA InvestorAA Investor
A Investor
B Investor
N R Investor
BB Investor
BBB Investor
$$
$
Each investor takes different risks
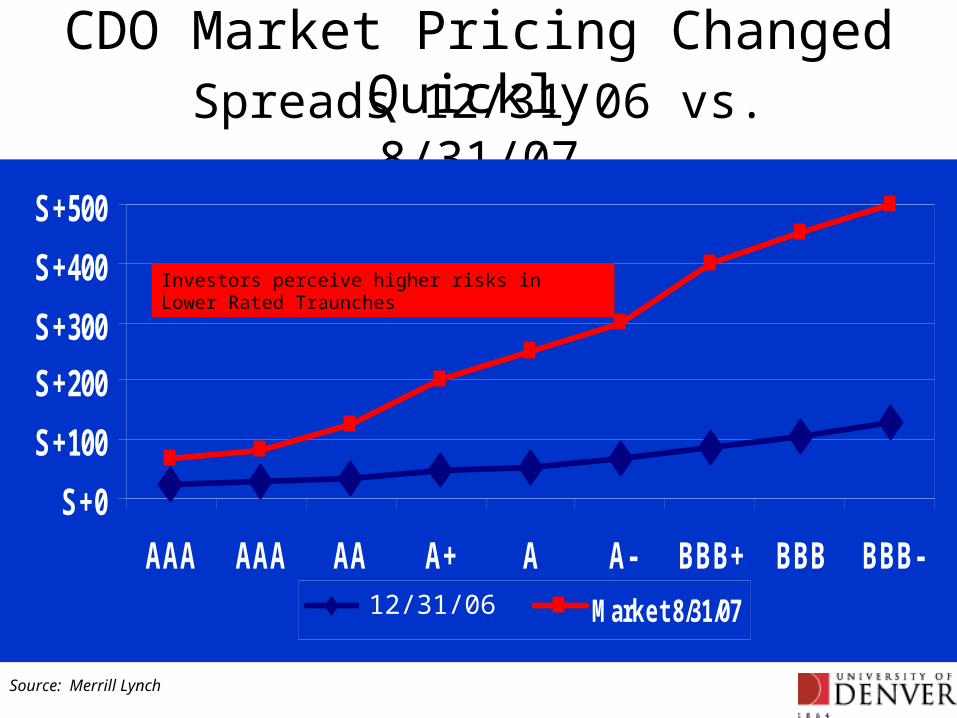
CDO Market Pricing Changed QuicklySpreads 12/31/06 vs. 8/31/07
S+0
S+100
S+200
S+300
S+400
S+500
AAA AAA AA A+ A A- BBB+ BBB BBB-
Market 12/31/07 Market 8/31/07
Source: Merrill Lynch
12/31/06
Investors perceive higher risks in Lower Rated Traunches
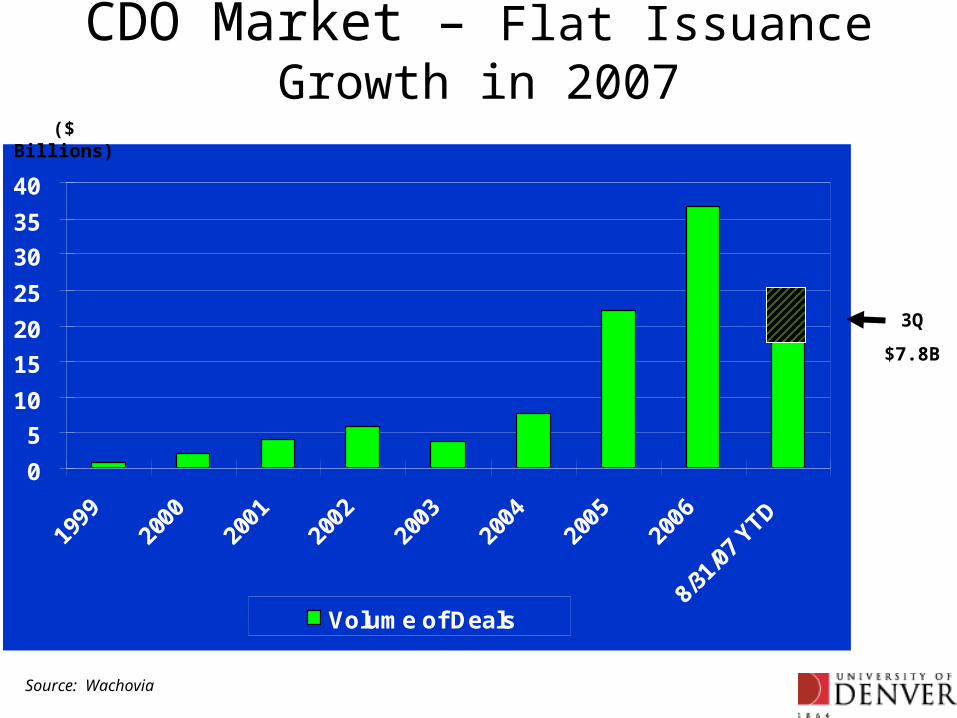
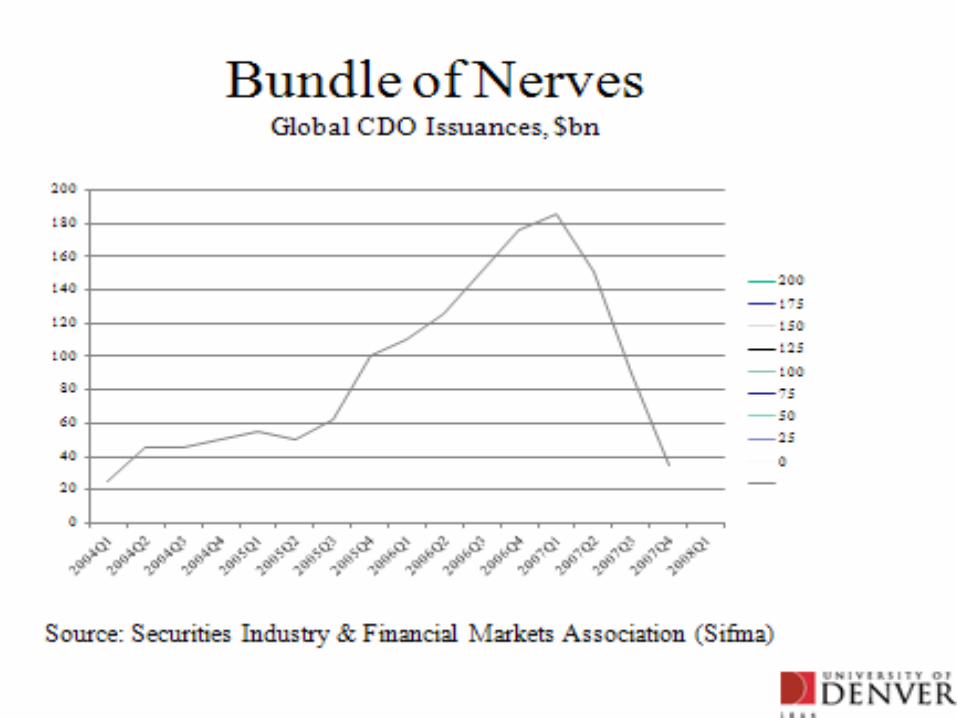
CDO Market – Flat Issuance Growth in 2007
0
5
10
15
20
25
30
35
40
1999
2000
2001
2002
2003
2004
2005
2006
8/31
/07
YTD
Volume of Deals
Source: Wachovia
3Q
$7.8B
($ Billions)
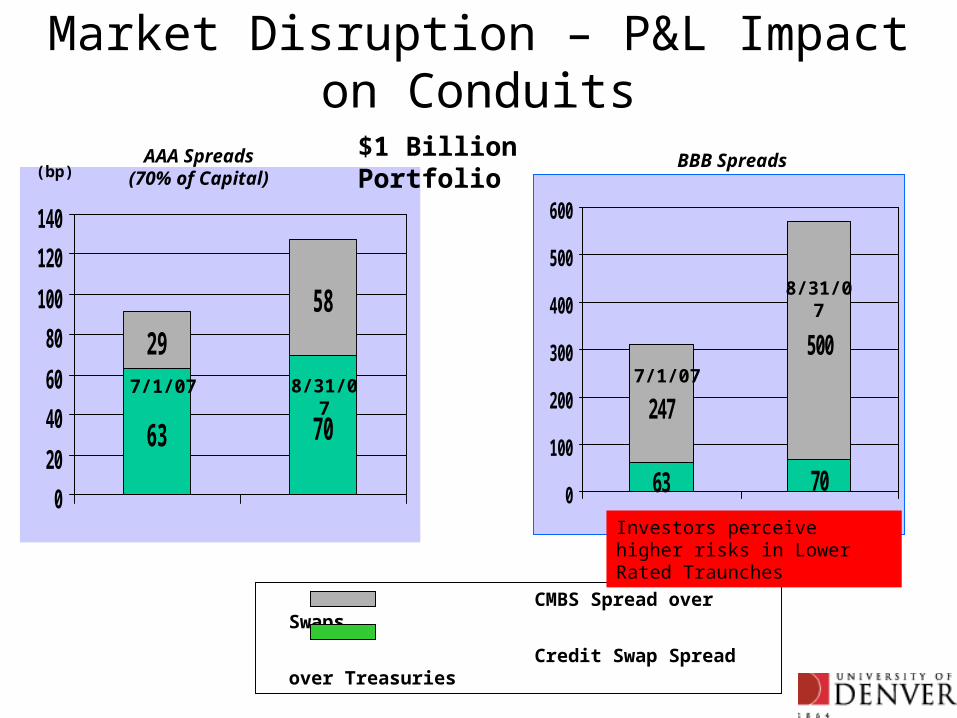
Market Disruption – P&L Impact on Conduits
63 70
2958
0
20
40
60
80
100
120
140
AAA Spreads(70% of Capital)
63 70
247
500
0
100
200
300
400
500
600
BBB Spreads
CMBS Spread over Swaps
Credit Swap Spread over Treasuries
7/1/07 8/31/07 7/1/07
8/31/07
$1 Billion Portfolio(bp)
Investors perceive higher risks in Lower Rated Traunches
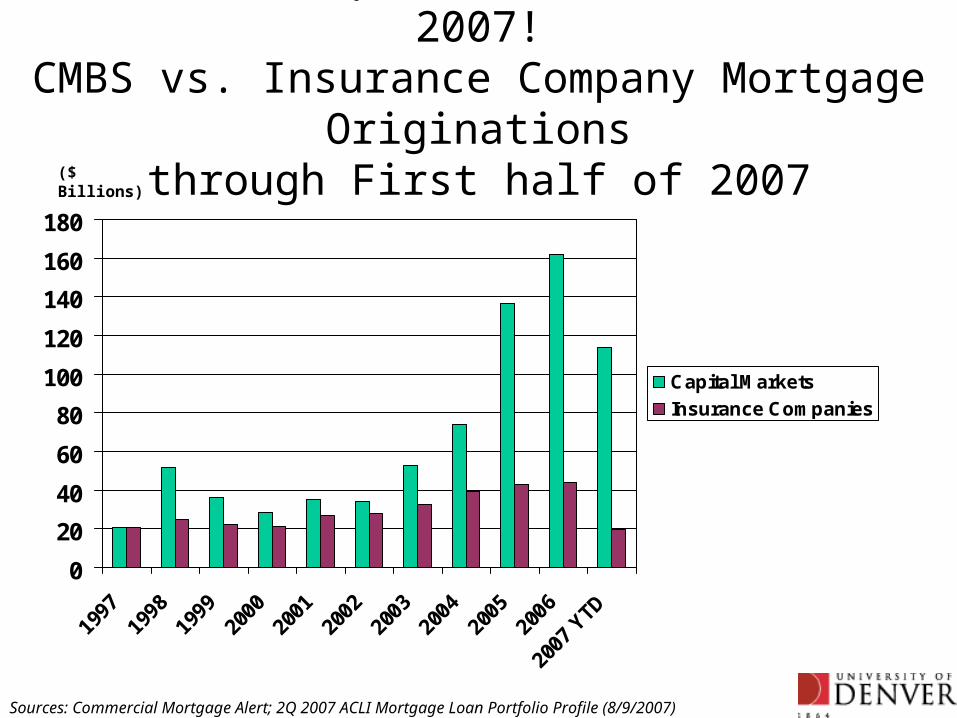
Insurance Companies saw more Risk in 2007!CMBS vs. Insurance Company Mortgage Originations
through First half of 2007
0
20
40
60
80
100
120
140
160
180
1997
1998
1999
2000
2001
2002
2003
2004
2005
2006
2007
YTD
Capital Markets
Insurance Companies
($ Billions)
Sources: Commercial Mortgage Alert; 2Q 2007 ACLI Mortgage Loan Portfolio Profile (8/9/2007)
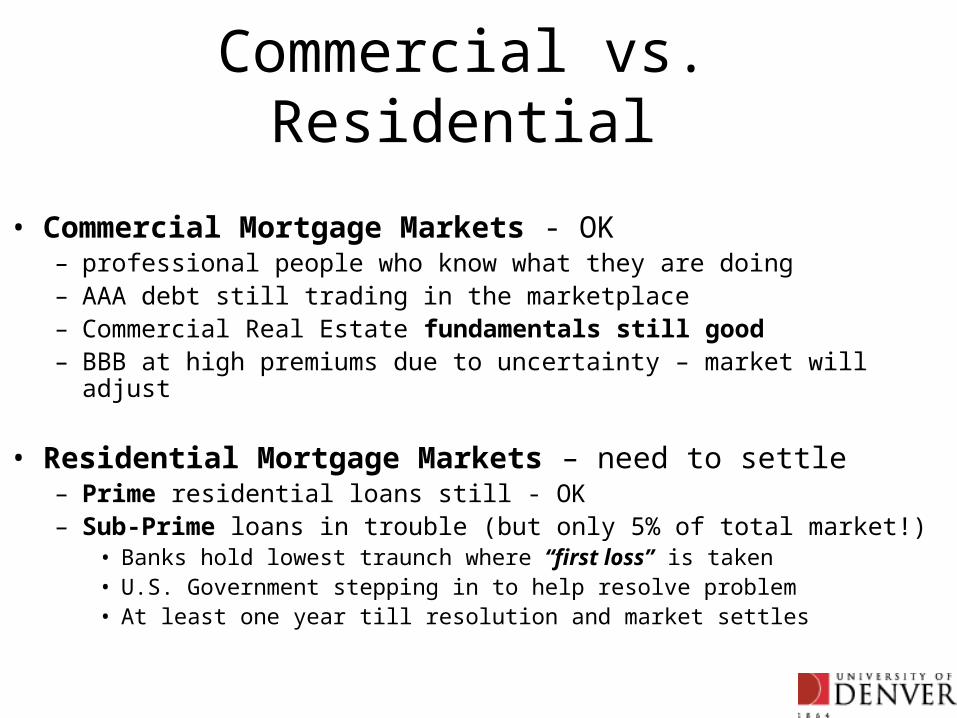
Commercial vs. Residential
• Commercial Mortgage Markets - OK – professional people who know what they are doing– AAA debt still trading in the marketplace– Commercial Real Estate fundamentals still good– BBB at high premiums due to uncertainty – market will adjust
• Residential Mortgage Markets – need to settle– Prime residential loans still - OK– Sub-Prime loans in trouble (but only 5% of total market!)
• Banks hold lowest traunch where “first loss” is taken• U.S. Government stepping in to help resolve problem• At least one year till resolution and market settles
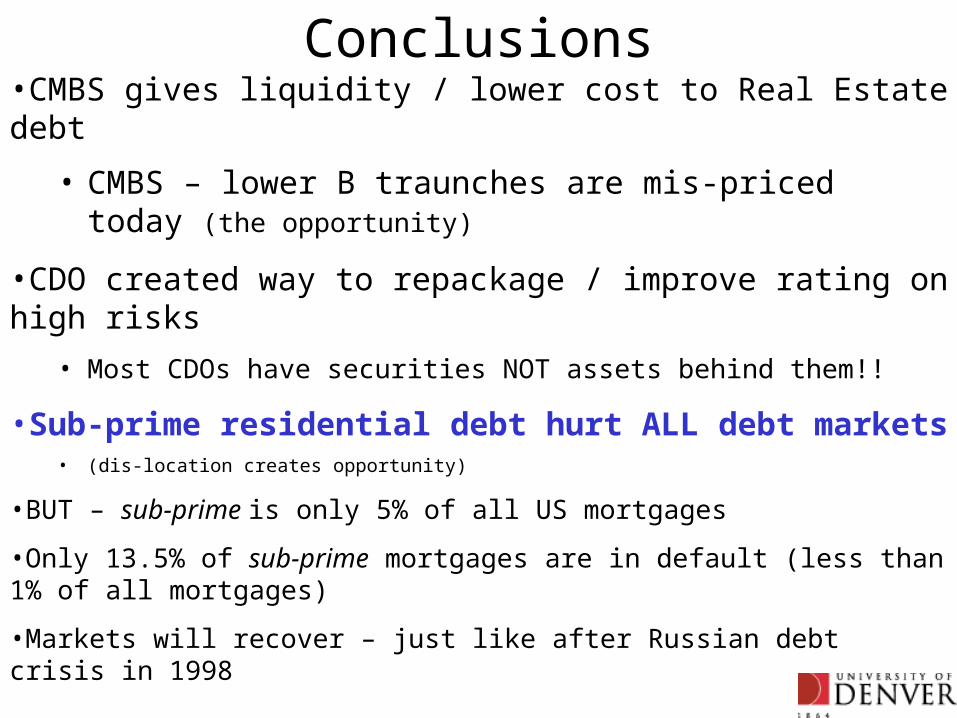
Conclusions•CMBS gives liquidity / lower cost to Real Estate debt
• CMBS – lower B traunches are mis-priced today (the opportunity)
•CDO created way to repackage / improve rating on high risks
• Most CDOs have securities NOT assets behind them!!
•Sub-prime residential debt hurt ALL debt markets • (dis-location creates opportunity)
•BUT – sub-prime is only 5% of all US mortgages
•Only 13.5% of sub-prime mortgages are in default (less than 1% of all mortgages)
•Markets will recover – just like after Russian debt crisis in 1998
• Rational long term investment focus can take advantage of dislocation!
• Markets are TRANSPARENT – lots of information available – good decisions can be made