Embed Size (px)
Citation preview
A
DEFECT DETECTION EQUALIZATION OF HARD DISK DRIVE MEDIA
TEST PROCESS USING VARIABLE BIAS IMPLEMENTATION IN
TOUCH DOWN SENSOR RESPONSE
by
GANESALINGAM RAMACHANDRAN
A Dissertation submitted as partial fulfilment of the requirement
for the degree of Master of Science in Electronic System Design
Engineering
June 2017

ii
ACKNOWLEDGEMENT
First and foremost, I would like to thank God almighty for blessing me with this
opportunity to challenge myself and acquire this priceless knowledge. I would also
like to express my deepest gratitude to Dr. Mohd Khairunaz Bin Mat Desa for his
unrelenting guidance and motivation during the course of this dissertation. Special
thanks to Universiti Sains Malaysia and all my lecturers for their invaluable support
and knowledge imparted to me during the course of my master’s programme. The
completion of my research paper would not have been possible without the support
from Western Digital Media (Malaysia) Sdn., my supervisor, Ms. Suan Phaik Siah,
my Director, Mr. Lim Cheng Hai, my Technical Director, Mr. Tom Odell, my team
and the WD Publication Approval Board. I would also like to place on record my
sincere and deepest gratitude to my beloved wife, Dr. Anuradha Thiagarajan, my
loving children, my parents, all my beloved family members and special friends whom
have supported and motivated me throughout this undertaking, for whom without, I
would have never been what I am today.

iii
TABLE OF CONTENTS
Acknowledgement ...................................................................................................... ii
Table of Contents ....................................................................................................... iii
List of Tables ............................................................................................................. vi
List of Figures ............................................................................................................ vii
Abstract ....................................................................................................................... x
Abstrak ...................................................................................................................... xi
CHAPTER 1 : INTRODUCTION .......................................................................... 1
1.1 Project Overview ................................................................................................... 1
1.2 Problem Statement ............................................................................................... 5
1.3 Research Objectives ............................................................................................ 6
1.4 Scope of Research ................................................................................................. 6
1.5 Dissertation Outline ............................................................................................... 7
CHAPTER 2 : LITERATURE REVIEW ............................................................... 9
2.1 Introduction ........................................................................................................... 9
2.2 Magnetic Media Platter ......................................................................................... 9
2.3 Read/Write Heads ................................................................................................ 12
2.4 Dynamic Fly Height ............................................................................................ 14
2.5 Slider Flying Height ............................................................................................ 18
2.6 Magnetic Media Defects ...................................................................................... 22
2.7 Protrusion Defect Detection ................................................................................ 27
2.8 Touch Down Sensor Biasing .............................................................................. 36
2.9 Touch Down Sensor Defect Detection ................................................................ 38

iv
2.10 Summary ........................................................................................................... 42
CHAPTER 3 : METHODOLOGY ........................................................................ 44
3.1 Introduction ......................................................................................................... 44
3.2 Identification of Key Variables .......................................................................... 48
3.2.1 General Variations ............................................................................................ 48
3.2.2 Process Specific Variations .............................................................................. 49
3.2.3 Proposed Control Range ................................................................................... 50
3.2.4 Exclusions ......................................................................................................... 52
3.3 Design of Experiment .......................................................................................... 53
3.3.1 Full Factorial DOE ........................................................................................... 55
3.3.2 Sampling and Sample Size ............................................................................... 56
3.3.3 Data Collection and Results Analysis .............................................................. 59
3.4 Validation of Results ........................................................................................... 62
3.5 Limitations .......................................................................................................... 63
CHAPTER 4 : RESULTS AND DISCUSSION .................................................... 65
4.1 Introduction ........................................................................................................ 65
4.2 Fixed Bias Variation ............................................................................................ 66
4.3 Design of Experiment .......................................................................................... 68
4.4 Variable Bias Variation ....................................................................................... 71
4.4.1 Response Curve ................................................................................................ 74
4.4.2 New Bias Value Determination ........................................................................ 75
4.4.3 Results Validation ............................................................................................ 76
4.4.4 Other Indicators Verification ........................................................................... 78

v
CHAPTER 5 : CONCLUSION AND FUTURE WORK ..................................... 79
5.1 Conclusion of Findings ....................................................................................... 79
5.2 Future Work ......................................................................................................... 81
REFERENCES ....................................................................................................... 82

vi
LIST OF TABLES
Table 3.1 : Nominal, lower and upper limit values for the Key Input Variables……..51
Table 3.2 : Minitab (R17) software window showing Full Factorial Table ………..55
generated for this experiment.
Table 4.1 : Minimum, Maximum and Range values for the Fixed Bias Touch……..66
Down Sensor (TDS) Response.
Table 4.2 : Full Factorial Touch Down Sensor (TDS) Response amplitude in……..69
Minitab (R17).
Table 4.3 : Minimum, Maximum and Range values for the Variable Bias Touch…. 72
Down Sensor (TDS) Response and improvement percentage.
Table 4.4 : Touch Down Sensor (TDS) Response amplitude curve slope and………76
intercept values used to generate new bias value.

vii
LIST OF FIGURES
Figure 1.1 : Anatomy of a typical Hard Disk Drive (HDD) showing key.…….……2
components.
Figure 1.2 : Thermal or Dynamic Fly Height Control showing thermal …………….3
expansion of the Dynamic Fly Height.
Figure 2.1 : Areal density trend of the HDD Magnetic Media from year 1950….….10
to 2015.
Figure 2.2 : Hard disk platters under a scanning electron microscope showing.…...11
the surface of an aluminum alloy platter (left) and a glass
platter (right).
Figure 2.3 : Components of a Head Stack Assembly (HSA)………………………..12
Figure 2.4 : Slider mounted on a Head Gimbal Assembly (HGA) showing……..…13
the electrical connections and the Read/Write Element position.
Figure 2.5 : Slider with the thermal protrusion of the slider flying above the ……..16
Magnetic Disk/Media.
Figure 2.6 : Slider Air Bearing Surface showing the Read and Write Elements…….17
on the Trailing Edge of the slider.
Figure 2.7 : Touch Down Sensor voltage response versus heater input power……..18
Figure 2.8 : Read/Write Head slider’s original Fly Height, adjusted Fly Height.…..19
and the Actuated Fly Height.
Figure 2.9 : Typical Femto Slider air-bearing slider surface design…………………21
Figure 2.10 : Process flow for manufacturing of Magnetic Recording Media………23
Figure 2.11 : Layers of a magnetic recording media of hard disk…………………..24
Figure 2.12 : Embedded Foreign particle on the substrate causing the magnetic…..25
layers to bulge and create a large defect.
viii
Figure 2.13 : Magnetic media with detected defect mapped and blocked..…………28
tracked or “Padding”.
Figure 2.14 : Air Bearing Slider with extended body to house the attached …………30
Piezoelectric Sensor.
Figure 2.15 : Air Bearing Slider with a flat plate Piezoelectric Sensor that is.……..30
placed between the slider body and head suspension arm.
Figure 2.16 : Touch Down Sensor position on a Read/Write Head Slider………….33
Figure 2.17 (a) : Touch Down contact of the Head Slider to the Magnetic…………35
media.
Figure 2.17 (b) : Head Slider with new flying height after Back-Off from contact..…35
point is applied.
Figure 2.18 : Touch Down Sensor biasing in the hard disk drive for surface.……...37
testing.
Figure 2.19 : AFM images and the corresponding scope traces of an Asperity…….41
and a Pit defect.
Figure 3.1 : Conventional media Glide test setup…………………………………..45
Figure 3.2 : Proposed Touch Down Sensor (TDS) setup…………………….……..46
Figure 3.3 : Overall experiment process flow……………………………………….47
Figure 3.4 : Relationship between the controllable factors, uncontrollable.………..53
factors and response of a system.
Figure 3.5 : Minitab (R17) software window with Full Factorial DOE design.……54
parameters selection.
Figure 3.6 : Minitab (R17) software window Full Factorial DOE design analysis.….56
option selection.
Figure 3.7 : Summary Report for the Defect Amplitude Response………………….58

ix
Figure 3.8 : Power and Sample Size for 1-Sample-T variable input window in…….59
Minitab (R17).
Figure 3.9 : Results of sample size calculation showing sample size requirement.…59
of 18 in Minitab (R17).
Figure 3.10 : Response amplitude of a sample Touch Down Sensor as measured.….61
using a digital oscilloscope for the individual bias values.
Figure 4.1 : Summary Report for Fixed Bias Touch Down Sensor (TDS) …………67
response amplitude.
Figure 4.2 : Minitab (R17) Descriptive statistics showing coefficient of……...........68
variation.
Figure 4.3 : Minitab (R17) Pareto Chart of the Effects showing the impact………..70
significance of the tested factors.
Figure 4.4 : Summary Report for Variable Bias Touch Down Sensor (TDS).………73
response amplitude.
Figure 4.5 : Minitab (R17) Descriptive statistics showing coefficient of..…………73
variation for the Variable Bias Touch Down Sensor (TDS)
response amplitude.
Figure 4.6 : Touch Down Sensor (TDS) response curves for individual..………….75
samples.
Figure 4.7 : Confidence Interval for two variance test………………………………77
Figure 4.8 : Chart showing TDS Response Amplitude measurements versus…..…..78
TDS resistance and TD Power.

x
DEFECT DETECTION EQUALIZATION OF HARD DISK DRIVE MEDIA
TEST PROCESS USING VARIABLE BIAS IMPLEMENTATION IN
TOUCH DOWN SENSOR RESPONSE
ABSTRACT
The drive to satisfy the ever increasing need for digital storage capacity today has
brought about various advances from a technological stand point in the design and
manufacture of high speed and high capacity hard disk drives. Efforts to increase the
areal density of the magnetic media disk within the hard disk drive forced designers
to push the envelope of the read/write head’s flying height clearance using Thermal
or Dynamic Fly Height Control (DFH) down to the sub–nanometer region, thus giving
birth to the need for improved magnetic media disk manufacturing processes. In order
to fly the heads ever closer to the magnetic media surface, the media needed to be free
of any protrusion or asperity type defects that could prove fatal to the drive, which in
turn, was achieved through the use of the Touch Down Sensor. This research paper
aims to address the variation that is present within the Touch Down Sensor application
that employs the fixed bias implementation in the magnetic media test environment
through the use of a variable bias solution. The amplitude response variation within
the current implementation is scrutinized, and an alternative technique using a
variable bias solution that is derived using an extrapolation of the amplitude response
curve is discussed. The variable bias solution demonstrated that the variation of the
Touch Down Sensor could be significantly be reduced by 36.7% and established a
foundation where future research into this implementation could be explored further.

xi
Penyamaan isyarat pengesanan kecacatan di dalam proses pemeriksaan media
pemacu cakera keras melalui implementasi pincangan bolehubah terhadap
tindak balas sensor “Touch Down”
ABSTRAK
Keperluan yang kian meningkat untuk kapasiti penyimpanan data digital telah
mendorong pelbagai kemajuan dari segi teknologi serta reka bentuk pemacu cakera
keras berkelajuan dan berkapasiti tinggi. Usaha untuk meningkatkan ketumpatan
permukaan media magnet dalam pemacu cakera keras telah memacu pereka untuk
merekabentuk peranti membaca/menulis data yang mampu untuk terbang hanya
beberapa nanometer dari permukaan media cakera keras tersebut dengan
menggunakan kawalan suhu “Thermal / Dynamic Fly Control (DFH)” pada peranti
tersebut. Ini telah melahirkan keperluan yang nyata bagi proses pembuatan media
magnet yang bebas dari sebarang kecacatan yang timbul dari permukaan media
tersebut yang boleh secara langsung merosakkan cakera keras itu sekaligus.
Kebolehan pengesanan kecacatan ini dicapai dengan penggunaan sensor “Touch
Down” bagi memastikan bahawa permukaan media bebas dari sebarang kecacatan
yang timbul pada permukaan media. Fokus kertas penyelidikan ini adalah untuk
menangani variasi isyarat yang tinggi dalam pengunaan sensor “Touch Down” yang
menggunakan pelaksanaan pincangan tetap dalam akitivi pemeriksaan cakera magnet.
Penyelesaian terhadap variasi ini dicapai melalui perlaksanaan pincangan bolehubah.
Kadar perubahan tindakbalas amplitud yang didapati menerusi pelaksanaan
pincangan tetap diteliti dan disiasat, dan dibandingkan dengan teknik pincangan

xii
bolehubah. Data yang diperolehi menggunakan kaedah ekstrapolasi daripada
lengkungan amplitud digunakan untuk memperolehi nilai pincangan baru.
Penyelesaian menggunakan pincangan bolehubah menunjukkan bahawa variasi
isyarat sensor “Touch Down” menurun sebanyak 36.7%. Kajian ini juga membuka
peluang untuk penerokaan applikasi pincangan bolehubah pada sensor “Touch Down”
yang lebih mendalam pada masa akan datang.

1
CHAPTER 1
INTRODUCTION
1.1 Project Overview
In this digital age, digital media storage has become a vital element that helps both
individuals and organizations store various vital digital content, which as a result has
caused an exponential growth in the need for high capacity, high speed and highly
reliable storage solutions. This requirement has been the primary driver in Hard Disk
Drive (HDD) capacity and density technology where the 3.5inch desktop drives has
been the industrial standard since the early 1980s until now. The key components and
the layout of a standard HDD is shown in Figure 1.1. An essential enabler to a high
areal density drive is the Head Media Spacing (HMS), which is basically the distance
from the bottom of the read element on the flying head to the top of the magnetic
medium on the rotating disk in the drive [1]. This increase in the areal density has
been duly achieved by decreasing the Head Media Spacing which in turn allows for
the size of the bits on the magnetic media to be also significantly reduced.

2
Figure 1.1 : Anatomy of a typical Hard Disk Drive (HDD) showing key
components [2].
In the early 1990s, Head Media Spacing in a typical HDD was at around
200nm, today this space has shrunk to a mere 2nm only. This extremely narrow gap
has a major impact on the physics of the drive reliability, failure and usage metrics
[3]. A key challenge for the HDD industry resulting from the advent of smaller
Read/Write (RW) Heads and the narrowed spacing is to ensure that the magnetic
media surface doesn’t have any asperities, mounds or imperfections that protrude
from the surface of the media which can grossly damage the heads. This in turn has
led to the requirement of magnetic media suppliers having to test and verify the
magnetic media so that it is assembled into a HDD with no high asperities that could
potentially damage the Read/Write Head.
Read/Write Heads in the HDD today have the ability to change the spacing
between the heads and magnetic media through the implementation of Thermal Fly
3
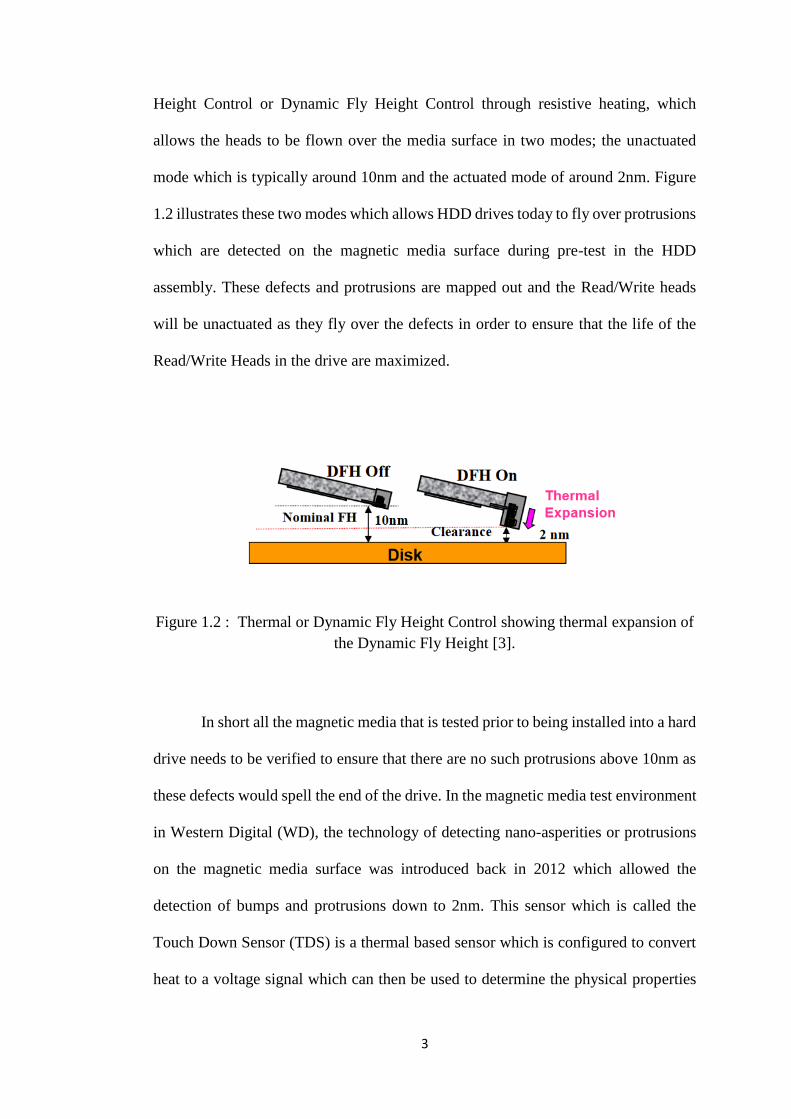
Height Control or Dynamic Fly Height Control through resistive heating, which
allows the heads to be flown over the media surface in two modes; the unactuated
mode which is typically around 10nm and the actuated mode of around 2nm. Figure
1.2 illustrates these two modes which allows HDD drives today to fly over protrusions
which are detected on the magnetic media surface during pre-test in the HDD
assembly. These defects and protrusions are mapped out and the Read/Write heads
will be unactuated as they fly over the defects in order to ensure that the life of the
Read/Write Heads in the drive are maximized.
Figure 1.2 : Thermal or Dynamic Fly Height Control showing thermal expansion of
the Dynamic Fly Height [3].
In short all the magnetic media that is tested prior to being installed into a hard
drive needs to be verified to ensure that there are no such protrusions above 10nm as
these defects would spell the end of the drive. In the magnetic media test environment
in Western Digital (WD), the technology of detecting nano-asperities or protrusions
on the magnetic media surface was introduced back in 2012 which allowed the
detection of bumps and protrusions down to 2nm. This sensor which is called the
Touch Down Sensor (TDS) is a thermal based sensor which is configured to convert
heat to a voltage signal which can then be used to determine the physical properties
4
of the defect detected [4], this in turn allows the magnetic media test process to detect
and screen out the defects that would be detrimental to the drive.
In the real world variation is evident in any process and it cannot be eliminated
completely, however, variation can be controlled and minimized in order to mitigate
the effects of variation that can seriously affect the quality or reliability of the product.
Similarly, variation between drive heads is common and is naturally anticipated in the
magnetic media test process as there will always be head to head variation amongst
HDD drives. In order to control this, the heads are calibrated and normalized to
minimize the variation effects to produce a reliable test process. Likewise, in any
similar Test process using TDS sensors, head detection variation has been found to be
evident and can potentially be a serious problem to the drive reliability, thus,
highlighting the need to have a better control of the detection variation in the test
process itself.
The TDS sensor which is basically a sensitive resistive thermal based contact
sensor is located between the read and write elements of a head [5]. The sensor relies
on the bias voltage or current that is used to drive the sensor, whereby, the resultant
sensor resistance changes proportionately with the change in the sensor temperature.
Utilizing this varying change in the resistance of the sensor, the consequential voltage
change is then captured and processed in order to decipher the detected defect.
Variation in the voltage change across a defect amongst different heads has proven to
be a serious challenge in ensuring that the detected defect is reported out accurately.
5
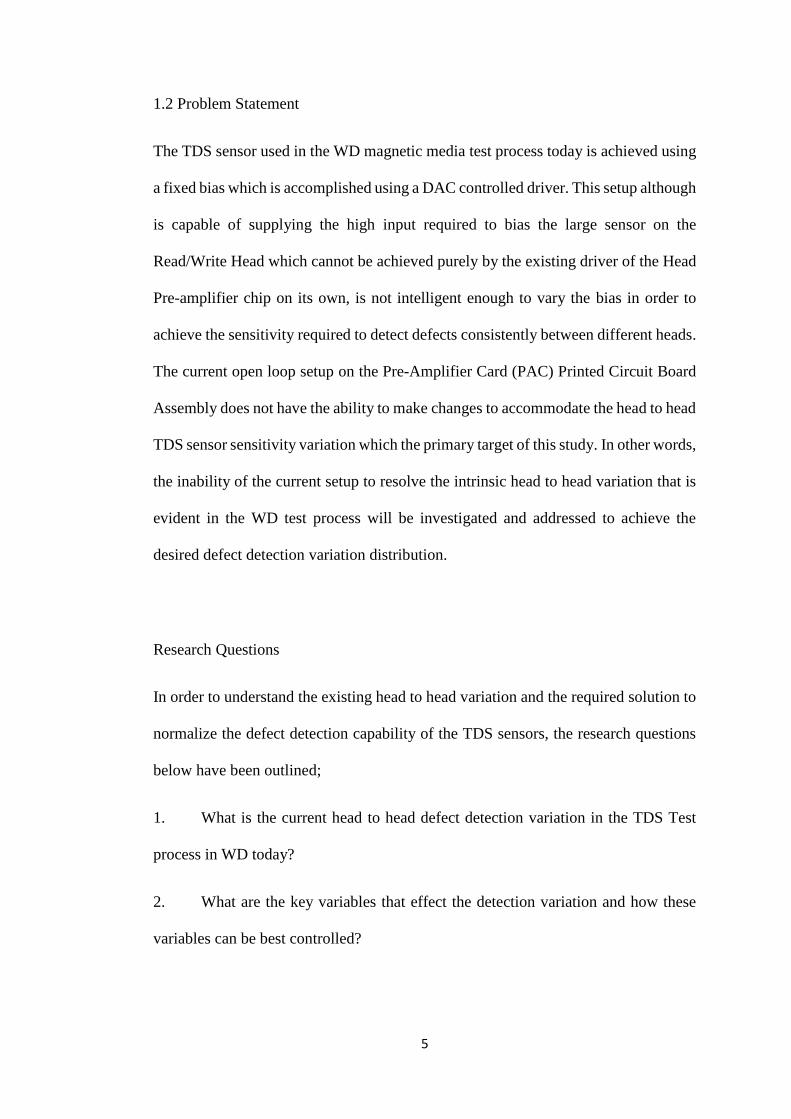
1.2 Problem Statement
The TDS sensor used in the WD magnetic media test process today is achieved using
a fixed bias which is accomplished using a DAC controlled driver. This setup although
is capable of supplying the high input required to bias the large sensor on the
Read/Write Head which cannot be achieved purely by the existing driver of the Head
Pre-amplifier chip on its own, is not intelligent enough to vary the bias in order to
achieve the sensitivity required to detect defects consistently between different heads.
The current open loop setup on the Pre-Amplifier Card (PAC) Printed Circuit Board
Assembly does not have the ability to make changes to accommodate the head to head
TDS sensor sensitivity variation which the primary target of this study. In other words,
the inability of the current setup to resolve the intrinsic head to head variation that is
evident in the WD test process will be investigated and addressed to achieve the
desired defect detection variation distribution.
Research Questions
In order to understand the existing head to head variation and the required solution to
normalize the defect detection capability of the TDS sensors, the research questions
below have been outlined;
1. What is the current head to head defect detection variation in the TDS Test
process in WD today?
2. What are the key variables that effect the detection variation and how these
variables can be best controlled?
6
3. How effective is the Bias control in normalizing the defect detection capability
of multiple heads?
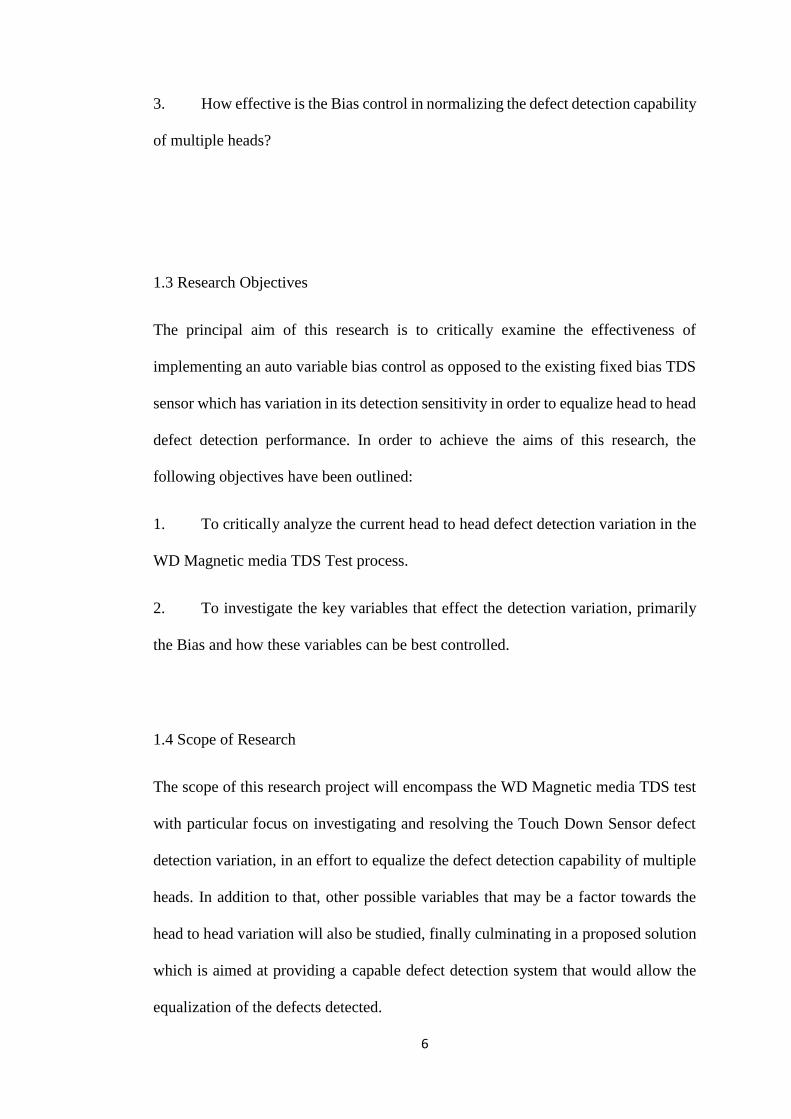
1.3 Research Objectives
The principal aim of this research is to critically examine the effectiveness of
implementing an auto variable bias control as opposed to the existing fixed bias TDS
sensor which has variation in its detection sensitivity in order to equalize head to head
defect detection performance. In order to achieve the aims of this research, the
following objectives have been outlined:
1. To critically analyze the current head to head defect detection variation in the
WD Magnetic media TDS Test process.
2. To investigate the key variables that effect the detection variation, primarily
the Bias and how these variables can be best controlled.
1.4 Scope of Research
The scope of this research project will encompass the WD Magnetic media TDS test
with particular focus on investigating and resolving the Touch Down Sensor defect
detection variation, in an effort to equalize the defect detection capability of multiple
heads. In addition to that, other possible variables that may be a factor towards the
head to head variation will also be studied, finally culminating in a proposed solution
which is aimed at providing a capable defect detection system that would allow the
equalization of the defects detected.
7
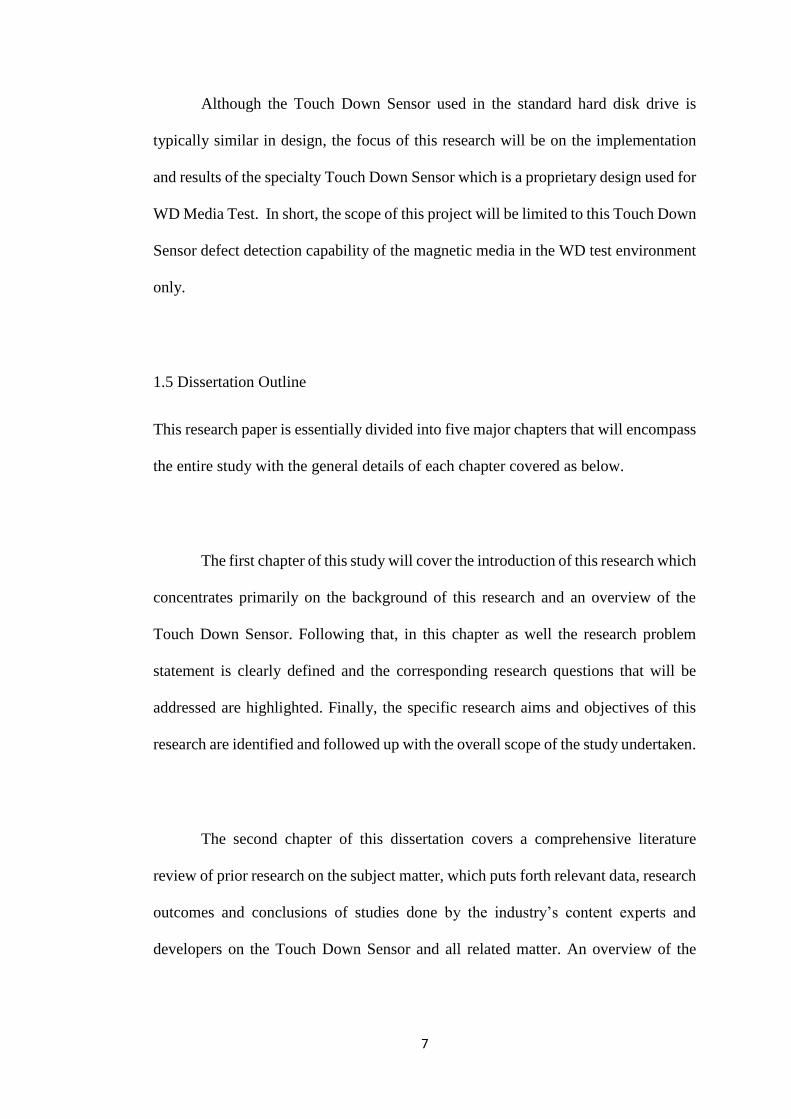
Although the Touch Down Sensor used in the standard hard disk drive is
typically similar in design, the focus of this research will be on the implementation
and results of the specialty Touch Down Sensor which is a proprietary design used for
WD Media Test. In short, the scope of this project will be limited to this Touch Down
Sensor defect detection capability of the magnetic media in the WD test environment
only.
1.5 Dissertation Outline
This research paper is essentially divided into five major chapters that will encompass
the entire study with the general details of each chapter covered as below.
The first chapter of this study will cover the introduction of this research which
concentrates primarily on the background of this research and an overview of the
Touch Down Sensor. Following that, in this chapter as well the research problem
statement is clearly defined and the corresponding research questions that will be
addressed are highlighted. Finally, the specific research aims and objectives of this
research are identified and followed up with the overall scope of the study undertaken.
The second chapter of this dissertation covers a comprehensive literature
review of prior research on the subject matter, which puts forth relevant data, research
outcomes and conclusions of studies done by the industry’s content experts and
developers on the Touch Down Sensor and all related matter. An overview of the

8
Touch Down Sensor test process together with a detailed review of the factors that
contribute to the detection variation will be presented and discussed as well.
Chapter three will focus on the research methodology, where the research
questions and objectives identified will be addressed in terms of the proposed
experiments and tests. A clear framework of the how the data will be acquired and the
measurement techniques used in the analyses of the compiled data is detailed in this
chapter. Additionally, the research limitations and any other potential issues that may
be encountered during this study will be discussed. Following this, a clear plan on the
proposed solution to normalize the head variation and equalization of the detected
defects will be put forth.
Chapter four will draw attention to the analysis of the various data collected
and how the proposed solution or design together with any proposed algorithm for the
new test process will be implemented, where it includes the discussion of the research
observations and its relevance to the objectives, the validity of the research and the
results of the proposed solution in order to improve the test process.
Lastly, the final chapter of this study will emphasize the conclusions that have
been derived from the outcome of this research, and the proposed new solution in
achieving the target objective of having a solid variation free test process for the
detection of defects on magnetic media for HDD drives. This will be then followed
by a comprehensive set of design recommendations that may be utilized by WD Media
management in their effort to resolve this test head to head detection variation.
9
CHAPTER 2
LITERATURE REVIEW
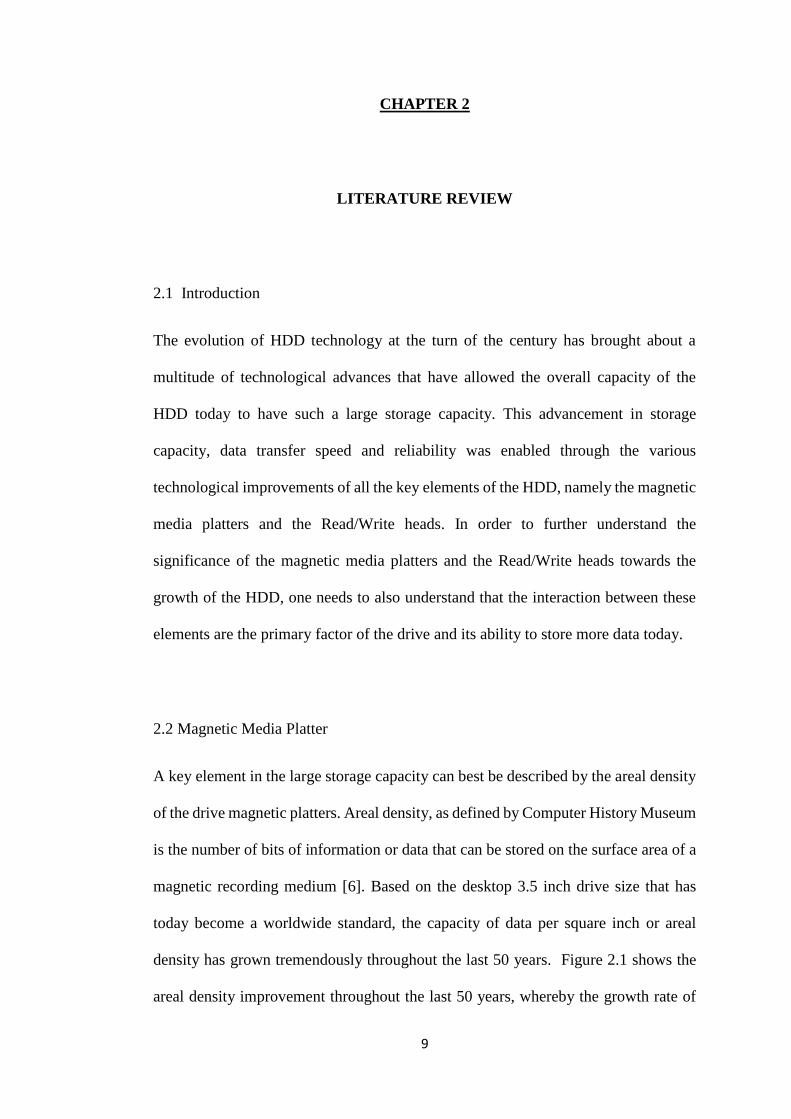
2.1 Introduction
The evolution of HDD technology at the turn of the century has brought about a
multitude of technological advances that have allowed the overall capacity of the
HDD today to have such a large storage capacity. This advancement in storage
capacity, data transfer speed and reliability was enabled through the various
technological improvements of all the key elements of the HDD, namely the magnetic
media platters and the Read/Write heads. In order to further understand the
significance of the magnetic media platters and the Read/Write heads towards the
growth of the HDD, one needs to also understand that the interaction between these
elements are the primary factor of the drive and its ability to store more data today.
2.2 Magnetic Media Platter
A key element in the large storage capacity can best be described by the areal density
of the drive magnetic platters. Areal density, as defined by Computer History Museum
is the number of bits of information or data that can be stored on the surface area of a
magnetic recording medium [6]. Based on the desktop 3.5 inch drive size that has
today become a worldwide standard, the capacity of data per square inch or areal
density has grown tremendously throughout the last 50 years. Figure 2.1 shows the
areal density improvement throughout the last 50 years, whereby the growth rate of
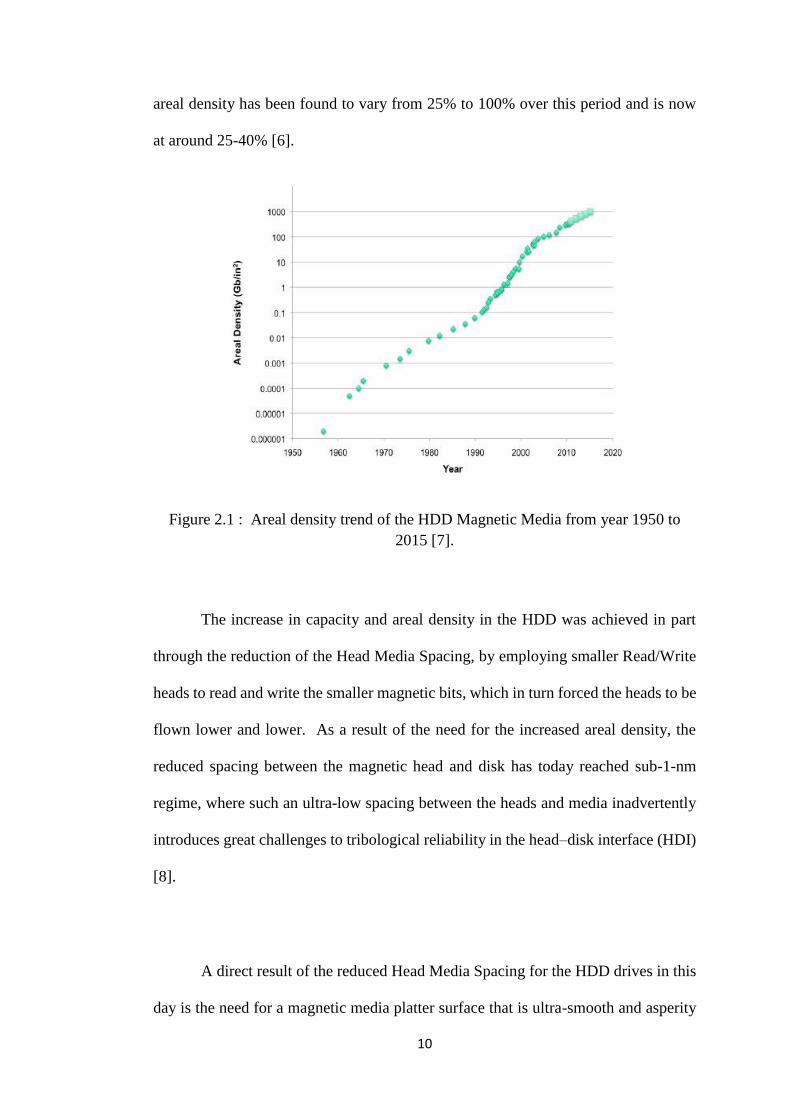
10
areal density has been found to vary from 25% to 100% over this period and is now
at around 25-40% [6].
Figure 2.1 : Areal density trend of the HDD Magnetic Media from year 1950 to
2015 [7].
The increase in capacity and areal density in the HDD was achieved in part
through the reduction of the Head Media Spacing, by employing smaller Read/Write
heads to read and write the smaller magnetic bits, which in turn forced the heads to be
flown lower and lower. As a result of the need for the increased areal density, the
reduced spacing between the magnetic head and disk has today reached sub-1-nm
regime, where such an ultra-low spacing between the heads and media inadvertently
introduces great challenges to tribological reliability in the head–disk interface (HDI)
[8].
A direct result of the reduced Head Media Spacing for the HDD drives in this
day is the need for a magnetic media platter surface that is ultra-smooth and asperity

11
or protrusion free. Figure 2.2 gives us an insight to what the actual drive surface looks
like under an electron microscope. In short, with the Read/Write heads flying at 1nm
spacing from the media surface, the standards and requirements for media that is
defect free, smooth and flat cannot be overemphasized, thus warranting the need for
better defect detection of the defects and protrusions on a high end drive media platter.
Figure 2.2 : Hard disk platters under a scanning electron microscope showing the
surface of an aluminum alloy platter (left) and a glass platter (right) [9].

12
2.3 Read/Write Heads
HDD Read/Write Heads constitute the joint top most critical element in a hard drive
besides the magnetic media platter. The improvements over time in HDD to bring the
Head Media Spacing lower could not have been achieved with just a smoother
magnetic media platter, but through the technological advances in head slider design
which allows for the ability of the heads to fly in a stable and consistent manner in
order for the reader and writer elements to effectively store and retrieve data from the
media. Read/Write heads in the HDD are mounted on a Head Stack Assembly (HSA),
as shown in Figure 2.3, where one head is allocated per media surface in order to fully
utilize both magnetic surfaces in the drive.
Figure 2.3 : Components of a Head Stack Assembly (HSA) [10].
The Read/Write Head is also known as the Head Gimbal Assembly (HGA)
which consists of the Head Suspension and the Slider which houses the Read and
Write elements, and since the read and write elements are extremely small, the

13
elements are built into the center of the Slider. It is common for people to be fooled
into thinking that the slider is the actual HDD head, on the contrary, a slider in fact is
not a head, but it's a wing which helps read and write elements fly over the magnetic
media platter, whereby the slider's surface is designed with aero dynamical grooves
that allow it to fly at a certain height above the media surface in a stable manner [11].
As the media is spun at a high velocity, air flowing at high speed under the slider
forms an Air Bearing Surface (ABS), and it is this Air Bearing Surface that allows the
slider to fly almost parallel to the magnetic media platter's surface [11]. Figure 2.4
shows the slider position on a Read/Write Head.
Figure 2.4 : Slider mounted on a Head Gimbal Assembly (HGA) showing the
electrical connections and the Read/Write Element position [11].
The Read/Write elements which are basically coils that generate a magnetic field
are built into the slider which allows for the reading and writing of data through the
change in the polarity of the magnetic bit on the media platter. This control over the

14
read and write elements is achieved through a Pre-Amplifier chip located at the end
of the Head Stack Assembly arm. In recent years the addition of a Touch Down Sensor
element has also been incorporated into the slider, thus giving the HDD designers an
option to detect the flying height of the slider in the drive in an effort to control the
Head Media Spacing requirement of high density HDD drives today.
2.4 Dynamic Fly Height
One of the two key technologies in the effort to achieve higher areal density in hard
drives is the reduction of the clearance between the read/write element on the head
and the magnetic recording media; while the other being the minimization of flying
height variations to maintain a low bit error rate in the drive [12]. Hard Drive heads
need to be flying consistently above the spinning magnetic media in order to be able
to read and write the data transmitted to and from the hard disk drive. The
advancement of technology today and the need for higher capacity hard drives has
brought about the need to fly the heads lower and lower, thus presenting head
designers the challenge of not only flying the heads in a stable manner, but also to be
able to do so with high precision. The Read/Write elements in the heads of the hard
drives today fly only nanometers from the surface, it is only through this close
proximity can the bit sizes of the magnetic media be reduced to meet the areal density
requirements of the drives today.

15
The need to fly closer to the magnetic media gave birth to the idea of actively
controlling the fly height way back in 1990, whereby the proposed design was based
on a piezo element that allowed for the dynamic adjustment of the head to media
spacing in the hard drives. This technique however was found to be cumbersome and
not cost effective if mass produced, thus leading to the design and implementation of
using thin-film micro-heaters embedded within the slider that was first introduced by
Machtle et al in 2001 [13]. These micro-heaters that are built-in into the sliders
transfer thermal energy into the sliders which causes the sliders to expand non-
uniformly and results in the deformation of the air-bearing surface on the slider which
allows the slider to fly closer to the magnetic media surface [14].
The high precision control of the flying height of the slider from the magnetic
media surface is also known as the Dynamic Flying Height (DFH) of the heads. This
precision control of the flying height or clearance from the magnetic media surface is
achieved through a series of incremental power applied to a heater coil within the head
slider to a small region around the read/write transducer that will cause it to thermally
expand towards the disk, thus achieving the spacing gap desired. This technique of
thermal expansion and retraction of the protrusion on the slider allows for the flying
height or gap of the head’s Read/Write elements from the magnetic media to be
adjusted flexibly [8]. Figure 2.5 shows the relative position of the micro-heater
element embedded within the slider, and the resultant expansion of the slider towards
the magnetic media surface.

16
Figure 2.5 : Slider with the thermal protrusion of the slider flying above the
Magnetic Disk/Media [15].
An important second reason for dynamic fly height control stems from the
write element and write function on the head itself. The write element on the head also
causes some degree of pole tip protrusion during write cycles to happen which is
inevitable but undesirable nonetheless. In order to mitigate this effect during separate
read and write cycles, the micro-heater is positioned in close proximity to the read and
write elements on the slider, typically in the trailing edge of the slider where the read,
write and also Touch Down Sensor (TDS) elements are located [12]. Additionally,
positioning the micro-heater, read, write and TDS elements at the trailing edge of the
slider provides the closest possible position for the read and write elements to have a
consistent interaction with the magnetic media surface during the read and write
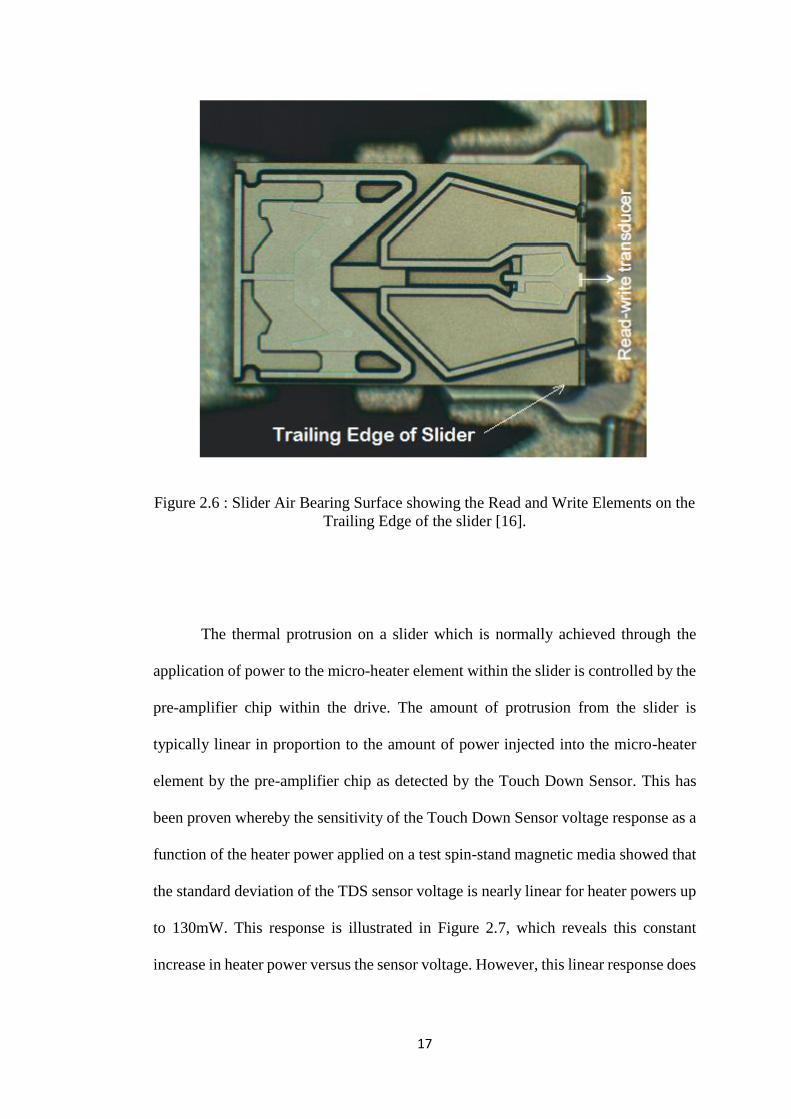
process. Figure 2.6 shows the location of the read and write elements on a slider air
bearing surface and the trailing edge of the slider.
17
Figure 2.6 : Slider Air Bearing Surface showing the Read and Write Elements on the
Trailing Edge of the slider [16].
The thermal protrusion on a slider which is normally achieved through the
application of power to the micro-heater element within the slider is controlled by the
pre-amplifier chip within the drive. The amount of protrusion from the slider is
typically linear in proportion to the amount of power injected into the micro-heater
element by the pre-amplifier chip as detected by the Touch Down Sensor. This has
been proven whereby the sensitivity of the Touch Down Sensor voltage response as a
function of the heater power applied on a test spin-stand magnetic media showed that
the standard deviation of the TDS sensor voltage is nearly linear for heater powers up
to 130mW. This response is illustrated in Figure 2.7, which reveals this constant
increase in heater power versus the sensor voltage. However, this linear response does

18
not hold true to heater powers beyond 130mW, where a sudden increase in the sensor
standard deviation is observed [5].
Figure 2.7 : Touch Down Sensor voltage response versus heater input power [5].
2.5 Slider Flying Height
The read/Write heads in the drive are designed to behave like an airfoil that uses the
high speed wind generated by a spinning magnetic media in order to achieve lift and
practically glide over the disk surface. The Air Bearing Surface of the slider is
designed to allow the air travelling below it to lift the slider and maintain its fly height
as the head moves across the magnetic media during the read and write cycles of the
hard disk drive.

19
The flying height of the slider of the read/write heads from the magnetic media
surface has significantly reduced over the years as the areal density requirements of
the hard drive has forced the industry to design the heads to fly closer to the magnetic
media in order to read and write the smaller magnetic bits. The original Fly Height of
a slider is defined as the slider’s flying-height with the micro-heater element turned
off, and the adjusted Fly Height is the slider’s flying-height with the micro-heater
element turned on. The actuated Fly Height of the slider on the other hand is defined
as the delta between the original Fly Height and the adjusted Fly Height of the slider
[17]. Figure 2.8 shows these two conditions with the micro-heater element on and off,
and the delta between these two conditions known as the Actuated Fly Height.
Figure 2.8 : Read/Write Head slider’s original Fly Height, adjusted Fly Height and
the Actuated Fly Height [17].

20
The sliders used in the hard disk drives today are distinctly designed to not
only provide lift which allows the slider to glide across the magnetic media, but also
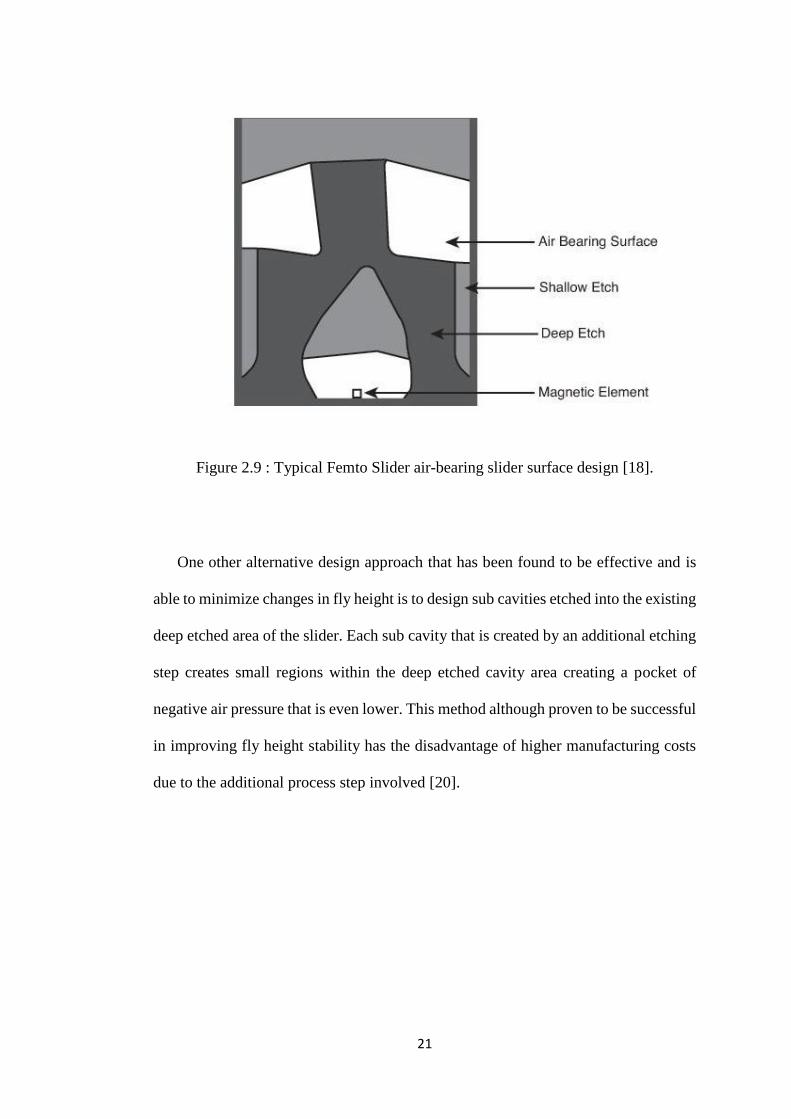
fly in a stable manner with minimal or almost zero flying height variations. A typical
slider today has three distinct areas with intricate cut outs and shapes that allows the
slider to achieve a consistent head to media spacing across the entire disk, as well as
minimal height variations under various types of conditions. The first of these three
areas is the Shallow Etch area which generally is a stepped air inlet allowing airflow
which creates the positive air pressure under the second area, which is the Air Bearing
Surface that lifts the slider higher as the air flow increases underneath the slider, as
shown in Figure 2.9. The third area known as the Deep Etch area on the other hand
creates a negative pressure pocket of vacuum which is designed to pull the slider
closer to the disk [18].
This special combination of both positive and negative air pressures on the
slider is aimed at balancing the two opposing forces generated by the air flow against
that of the Read/Write Head suspension arm pushing the slider toward the disk, while
keeping the slider flying at the preferred height from the magnetic media surface. This
intricate balance of both the positive and negative air pressures on the slider helps to
stabilize the slider fly height variations which was a serious issue found in older slider
designs [18]. This fact was also concurred by Yang Juan et al., who highlighted that
it takes both the negative and positive air pressure distribution balance coupled with
the applied down force load of the head suspension arm to determine the flying
attitude of the slider which includes the overall height, pitch and roll, and other
important characteristics, including air bearing stiffness and damping [19].
21
Figure 2.9 : Typical Femto Slider air-bearing slider surface design [18].
One other alternative design approach that has been found to be effective and is
able to minimize changes in fly height is to design sub cavities etched into the existing
deep etched area of the slider. Each sub cavity that is created by an additional etching
step creates small regions within the deep etched cavity area creating a pocket of
negative air pressure that is even lower. This method although proven to be successful
in improving fly height stability has the disadvantage of higher manufacturing costs
due to the additional process step involved [20].
22
2.6 Magnetic Media Defects
Understanding the types of defects and the morphology of these defects that are
inherent process variations in the magnetic media manufacturing process is vital,
where this insight will be key in order to have a clear idea on what type of detection
is necessary to detect and reject these defects which are potentially fatal to the Hard
disk drive. In order to identify the potential defects that can be created from the
manufacturing process of the magnetic media, the manufacturing steps of the
magnetic media needs to be understood. The general magnetic media manufacturing
process starts with the base substrate material, followed by media texture, wash,
sputtering, lubrication, tape burnishing and the final testing to ensure the magnetic
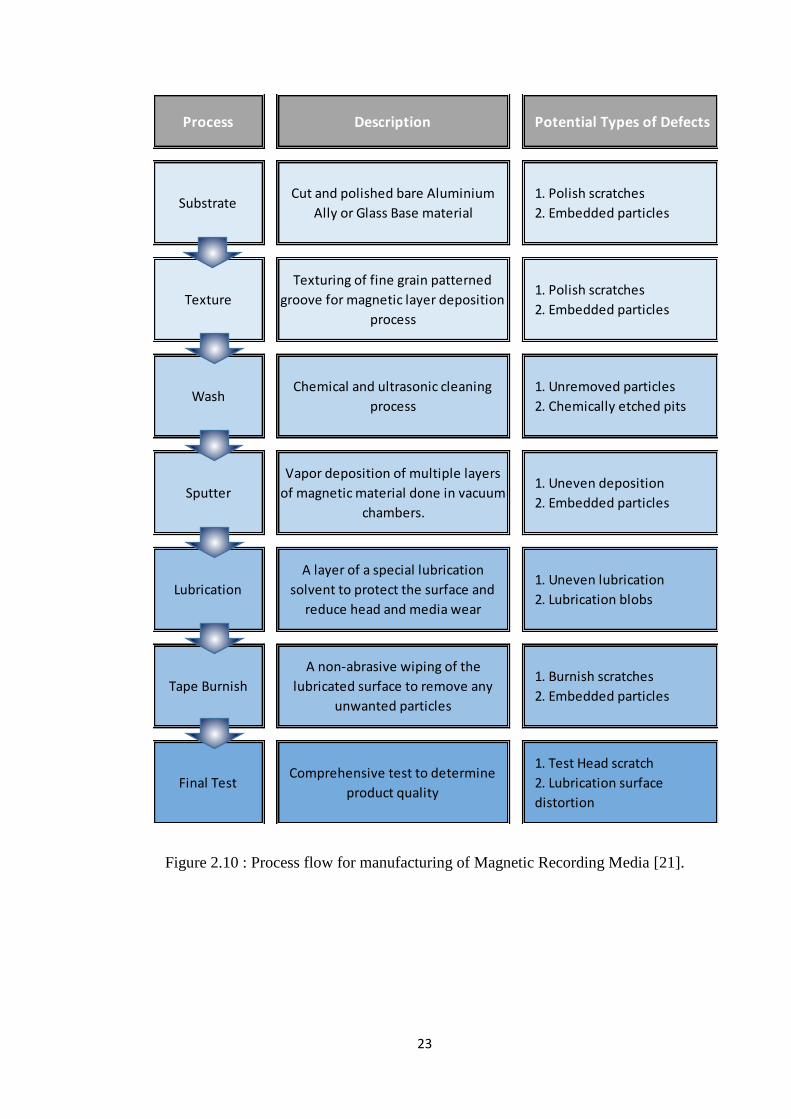
media is manufactured to the required specifications for the drive. Figure 2.10 shows
the process flow of the magnetic media manufacturing process and the potential
defects that can be generated from those individual processes [21].
23
Figure 2.10 : Process flow for manufacturing of Magnetic Recording Media [21].
Process Description Potential Types of Defects
SubstrateCut and polished bare Aluminium
Ally or Glass Base material
1. Polish scratches
2. Embedded particles
Texture
Texturing of fine grain patterned
groove for magnetic layer deposition
process
1. Polish scratches
2. Embedded particles
WashChemical and ultrasonic cleaning
process
1. Unremoved particles
2. Chemically etched pits
Sputter
Vapor deposition of multiple layers
of magnetic material done in vacuum
chambers.
1. Uneven deposition
2. Embedded particles
Lubrication
A layer of a special lubrication
solvent to protect the surface and
reduce head and media wear
1. Uneven lubrication
2. Lubrication blobs
Tape Burnish
A non-abrasive wiping of the
lubricated surface to remove any
unwanted particles
1. Burnish scratches
2. Embedded particles
Final TestComprehensive test to determine
product quality
1. Test Head scratch
2. Lubrication surface
distortion

24
The magnetic media disk is in fact a rigid disk or platter that is made from a
base material which typically consists of an Al-Mg alloy or glass substrate at the core,
whereby providing a sturdy, light and stable foundation for the magnetic media. This
base substrate has several layers of material deposited on it, namely the undercoat
layer, Soft Underlayer, a magnetic multilayer and it is topped off with a carbon
overcoat that is protected by a very thin layer of specialized lubrication material [22].
Figure 2.11 shows the layering of a general magnetic recording media disk used in the
hard disk drives today.
Figure 2.11 : Layers of a magnetic recording media of hard disk [23].
Magnetic media defects can be generated or encountered on every single
process step of the magnetic media manufacturing process. Once these defects are
encountered in a process, it may get covered by the various layers of magnetic material