Embed Size (px)
Citation preview
1
EFFECTS OF HURRICANE FORCE WINDS ON MODULAR GREEN ROOF SYSTEMS
By
DUANE ANDRE ELLIS
A THESIS PRESENTED TO THE GRADUATE SCHOOL OF THE UNIVERSITY OF FLORIDA IN PARTIAL FULFILLMENT
OF THE REQUIREMENTS FOR THE DEGREE OF MASTER OF SCIENCE IN BUILDING CONSTRUCTION
UNIVERSITY OF FLORIDA
2010
2
© 2010 Duane Andre Ellis
3
To Patricia and Clifford Ellis
4
ACKNOWLEDGMENTS
I thank my committee members, Dr. Charles Kibert, Dr. Raymond Issa, and Dr.
James Sullivan for their guidance and expertise. I especially want to thank Dr. Ronald
Cook in the Department of Civil Engineering at the University of Florida for providing me
with a copy of the ASCE 7-05 standard and information on how to calculate wind forces
on structures. Dr. Cook provided invaluable guidance as to how to use the standards
and how to best apply it to my research. I want to thank Patrick Bynum and Patrick
Ayala for their encouragement and support during these past two semesters. I would
like to thank Gregory Harper, at Weston Solutions GreenGrid® for his interest this
research. Last, but certainly not least, I want to thank my parents and my sisters for
their continued love and support.
.
5
TABLE OF CONTENTS page
ACKNOWLEDGMENTS .................................................................................................. 4
LIST OF TABLES ............................................................................................................ 7
LIST OF FIGURES .......................................................................................................... 8
LIST OF ABBREVIATIONS ........................................................................................... 10
ABSTRACT ................................................................................................................... 11
CHAPTER
1 INTRODUCTION TO THE STUDY ......................................................................... 13
Introduction to the Problem ..................................................................................... 13 Background to the Problem .............................................................................. 14 Problem Statement ........................................................................................... 15
Statement of Purpose ............................................................................................. 16 Rationale ................................................................................................................. 16
Aims and Objective of Study ............................................................................ 18 Research Method ............................................................................................. 18 Assumptions and Limitations ............................................................................ 19
Description of Research Organization .................................................................... 19 Conclusion .............................................................................................................. 20
2 LITERATURE REVIEW .......................................................................................... 21
Introduction ............................................................................................................. 21 Making the Case for this Study ............................................................................... 21 SUI Research ......................................................................................................... 23 Hurricanes Winds ................................................................................................... 24
Category 1 ........................................................................................................ 26 Category 2 ........................................................................................................ 26 Category 3 ........................................................................................................ 26 Category 4 ........................................................................................................ 26 Category 5 ........................................................................................................ 27 Eastern and Gulf Coast Hurricane Frequency .................................................. 27
Wind Design ........................................................................................................... 27 Green Roof Design Considerations ........................................................................ 31
The Vegetation Component .............................................................................. 33 Plant Root Structure ......................................................................................... 33 Wind Loading ................................................................................................... 38 Growth Media ................................................................................................... 38
Conclusion .............................................................................................................. 41
6
3 METHODOLOGY ................................................................................................... 42
Introduction ............................................................................................................. 42 Developing the Model ............................................................................................. 42
Building............................................................................................................. 42 Florida Building Code ....................................................................................... 42 Modular Trays .................................................................................................. 44 ASCE 7-05/10, Wind Load Calculation ............................................................. 45 Root Structure and Growth Media .................................................................... 51
Summary ................................................................................................................ 51
4 RESULTS ............................................................................................................... 53
Introduction ............................................................................................................. 53 Extensive Modular Trays ........................................................................................ 53 Intensive Modular Trays .......................................................................................... 62
5 ANALYSIS OF RESULTS ....................................................................................... 70
Summary of Findings .............................................................................................. 70 Wind Uplift Prevention Strategies ........................................................................... 71 Conclusion .............................................................................................................. 73 Recommendations for Future Study ....................................................................... 74
LIST OF REFERENCES ............................................................................................... 76
BIOGRAPHICAL SKETCH ............................................................................................ 78
7
LIST OF TABLES
Table page 2-1 Classification of hurricanes by the Saffir/Simpson Scale (adapted from Simiu
and Miyata 2006). ............................................................................................... 26
2-2 Weights of commonly used growing media components (adapted from Weiler and Scholz-Barth 2009) ...................................................................................... 32
3-1 Height and area restrictions on Group B, R-1, and R-2 buildings in the Florida Building Code ..................................................................................................... 43
3-2 Intensive and Extensive GreenGrid® modular green roof system ...................... 45
3-3 Frictional Force for the maximum weight of GreenGrid® modular green roof system ................................................................................................................ 49
3-4 Extensive and intensive GreenGrid® modular green roof system horizontal Af value for lateral force ...................................................................................... 50
3-5 Extensive and intensive GreenGrid® modular green roof system horizontal Af value for uplift force ............................................................................................ 50
5-1 Actual maximum height for extensive on intensive green roof models for theoretical building .............................................................................................. 70
5-2 Design maximum height for extensive and intensive modular green roof modules for theoretical model ............................................................................. 71
8
LIST OF FIGURES
Figure page 1-1 Typical cross section of a modular green roof .................................................... 17
2-1 Horizontal distribution of wind speeds and pressure in a hurricane or tornado according to Rankine Vortex theoretical model. ................................................. 25
2-2 Number of Saffir-Simpson category events for specified coastal states, 1851-2006. .................................................................................................................. 28
2-3 Failure modes due to horizontal forces in three types of root systems ............... 34
2-4 Root tensile strength plotted against root diameter.. .......................................... 36
2-5 Root area ratio (RAR) distribution with depth. .................................................... 37
3-1 Lateral and uplift forces on modular green roof trays. ........................................ 47
3-2 Initial and steady state coefficient of frictions for EPDM rubbers ........................ 48
4-1 100 mph wind net force on extensive modular trays ........................................... 56
4-2 Extensive modular tray performance in 100 mph wind ....................................... 56
4-3 110 mph wind net force on extensive modular trays ........................................... 57
4-4 Extensive modular tray performance in 110 mph wind ....................................... 57
4-5 120 mph wind net force on extensive modular trays ........................................... 58
4-6 Extensive modular tray performance in 120 mph wind ....................................... 58
4-7 130 mph wind net force on extensive modular trays ........................................... 59
4-8 Extensive modular tray performance in 130 mph wind ....................................... 59
4-9 140 mph wind net force on extensive modular trays ........................................... 60
4-10 Extensive modular tray performance in 140 mph wind ....................................... 60
4-11 150 mph wind net force on extensive modular trays ........................................... 61
4-12 Extensive modular tray performance in 150 mph wind ....................................... 61
4-13 100 mph wind net force on intensive modular trays ............................................ 64
4-14 Intensive modular tray performance in 100 mph wind ........................................ 64

9
4-15 110 mph wind net force on intensive modular trays ............................................ 65
4-16 Intensive modular tray performance in 110 mph wind ........................................ 65
4-17 120 mph wind net force on intensive modular trays ............................................ 66
4-18 Intensive modular tray performance in 120 mph wind ........................................ 66
4-19 130 mph wind net force on intensive modular trays ............................................ 67
4-20 Intensive modular tray performance in 130 mph wind ........................................ 67
4-21 140 mph wind net force on intensive modular trays ............................................ 68
4-22 Intensive modular tray performance in 140 mph wind ........................................ 68
4-23 150 mph wind net force on intensive modular trays ............................................ 69
4-24 Intensive modular tray performance in 150 mph wind ........................................ 69

10
LIST OF ABBREVIATIONS
ASCE American Society of Engineers
IBC International Building Code
LEED Leadership in Energy and Environmental Design
LRFD Live and Resistance Factor Design
NHC National Hurricane Center's
NOAA National Oceanic and Atmosphere Administration
NRCA National Roofing Contractors Association
SIUE Southern Illinois University, Edwardsville
UHI Urban Heat Island Effect

11
Abstract of Thesis Presented to the Graduate School of the University of Florida in Partial Fulfillment of the
Requirements for the Degree of Master of Science in Building Construction
EFFECTS OF HURRICANE FORCE WINDS ON MODULAR GREEN ROOF SYSTEMS
By
Duane Andre Ellis
May 2010
Chair: Charles J. Kibert Cochair: R. Raymond Issa Major: Building Construction
Green roofs are becoming increasing popular system to conserve energy in
buildings. However, there is very little data or research on the best strategy to ensure
that these systems perform when subjected to hurricane force winds. Green roof
systems can be either modular, a series of individual trays, or built in place. Green roof
systems built in the Eastern and Gulf Coast region of the United States, have their own
set of challenges as between the months of June and November is hurricane season,
and this region is very susceptible to hurricanes. The severity of the winds that
hurricanes produce make wind design criteria for roofs in regions prone to hurricanes
very stringent. Modular green roof systems, because of their design, would be more
likely to experience the effects of wind generated by hurricanes. Commercial building,
especially the high rises in the heart of a city is best suited green roof systems because
of their contributions to sustainable efforts. Green roof systems reduce the Heat Island
Effect of the city and provide ecological advantages such as improving air quality and
converting carbon dioxide into oxygen. The problem with modular green roof systems is
that they have the potential to produce an arsenal of projectiles when exposed to
hurricane strength winds. Since green roof systems are typically being installed on high
12
rise buildings in densely populated, there is the potential for a green roof system to
cause devastating effects to the surrounding area. This research focuses on the
performance of the modular green roof systems when subjected to hurricane force
winds. Commercial builders, especially roofing contractors, in cities along the Eastern
and Gulf Coast would benefit extremely from this research. Based on provisions
outlined in the ASCE 7-05 and ASCE 07-10 Standards, a theoretical model with clearly
defined parameters was developed and wind load design criteria were established.
How wind forces would affect the modular green roof trays was based on the premise
that the modular tray would be subjected to both horizontal and vertical forces that
would overturn them at the pivot point furthest from where the lateral force hits the side
panels of the tray. The theoretical model evaluated the typical design of a modular
green roof system and considered how each component affects the modular green roof
system’s ability to resist being overturned. This research concluded that both extensive
and intensive modular green roof systems can be installed on commercial and
residential building in the Eastern and Gulf coasts, but intensive modular green roof
systems provide better resistance to wind uplift for very tall structures.
13
CHAPTER 1 INTRODUCTION TO THE STUDY
Introduction to the Problem
As the world braces for the impending energy crisis, many industries are taking
initiative to conserve energy. In the built environment, one of the strategies for reducing
the energy consumption in a building is to install a green roof system. Green roof
provides economic benefits to the owner by providing savings on energy heating and
cooling cost, depending on the size of the building, the climate, and type of green roof.
Green roof systems can be either modular or built in place. Green Roof systems have
the biggest impact in buildings located in cities as they can reduce the urban heat island
(UHI) effect. Temperatures in cities are usually 2º F to 10º F hotter than rural areas,
thus the cooling requirements for the buildings in urban areas are much higher (Kibert
2008). UHI can be contributed to the removal of vegetation and replacing it with
buildings and other structures. Green Roofs serve to replace the vegetation up heaved
when the building is constructed. According to the Green Roofs for Healthy Cities
website, green roofs can facilitate a significant improvement in the LEEDTM rating of a
building, contributing as many as 15 credits under the system, depending on design and
level of integration with other building systems. In some instances, while green roofs
may not contribute directly to achieving points under the system, they contribute to
earning LEEDTM credits when used with other sustainable building elements. Green
roofs can be categorized as intensive or extensive systems depending on the plant
material and planned usage for the roof area. Green roof systems can either be
modular or built-in place. The type of green roof system depends on the vegetation
needed to be supported. Extensive systems have a very shallow depth of soil or
14
growing medium compared to intensive systems that have a greater depth of soil and
growing medium which allows for greater diversity in size and type of vegetation (Weiler
and Scholz-Barth 2009). Built-in-place roof systems are more traditional and are
constructed by layering materials in place over the roof surface. According to the Green
Roof Research Program at Michigan State University, intensive green roofs utilize a
wide variety of plant species that may include trees and shrubs, require deeper
substrate layers usually greater than 4 in (10 cm), and are generally limited to flat roofs.
Extensive roofs are limited to herbs, grasses, mosses, and drought tolerant succulents
such as Sedum, and can be sustained in a shallow substrate layer less than 4 in (10
cm). The incentives for installing a green roof in a new or renovation project are
significant; however, one of the concerns of green roof systems is whether or they can
withstand wind up lift. Modular green roof systems, due to their design, have a greater
potential to be vulnerable to wind uplift sine there rest on the roof sub structure with no
means of securing them to roof.
Background to the Problem
Every year the East and Gulf Coast of the United States is threatened by
hurricanes. Winds produced by hurricanes can sustained range between 74 miles per
hour (mph) for a Category 1 hurricane, to greater than 155 mph for a Category 5
according to the National Oceanic and Atmosphere Administration (NOAA), National
Weather Service, National Hurricane Center's (NHC) new 2009 Saffir-Simpson Wind
Scale. The Saffir-Simpson categorizes hurricanes based on wind strength and the 1 to 5
scale provides examples of the type of damages and impacts associated with winds of
an indicated intensity. A maximum sustained wind is considered to be the maximum
wind speed measured 33 ft (10 m) above the earth's surface. The NHC uses the Saffir-
15
Simpson scale to also estimate how much damage each category of hurricane will inflict
once it reaches land. According the scale, roof damage does not become a concern
until a hurricane reaches Category 2, where wind speeds are estimated between 96 and
110 mph. Research done by the NHC shows that high rise buildings are most
susceptible to hurricane winds, as the strength of the wind increases with elevation.
Commercial buildings located in major cities along the East and Gulf Coasts are
typically greater than two stories.
Currently there is no set guidance for wind uplift as it pertains to green roof
systems. ASTM Standard E2397-05 (Practice for Determination of Dead and Live
Loads Associated with Green Roof Systems) does not address live loads associated
with wind loads. Other ASTM Standards, E2399-05 (Maximum Media Density of Dead
Load Analysis of Green Roof Systems) and E2400-06 (Guide for the Selection,
Installation, and Maintenance of Plants for Green Roof Systems), do not factor the
effects of severe wind condition in their recommendations and guidance. In Florida,
where hurricanes are prevalent, the building code does not specifically address green
roof systems nor does the ASTM Standard.
Problem Statement
Modular green roof systems are trays filled with growth media and vegetation that
are placed on the roof of buildings without any mechanism in place to anchor them to
the roof structure. If these green roof systems are to be installed in areas prone to
hurricanes, they need to be able to withstand the forces that these winds produce. The
objective of this research is to determine the survivability of these systems on roofs of
various heights and at various hurricane wind speeds. Building height is an important
factor in this evaluation as wind speed increases with elevation.
16
Statement of Purpose
This study will examine the likely hood that modular intensive and extensive
systems will be able to withstand hurricane wind speeds by formulating a model using
the wind design criteria established in the ASCE 7-05 and ASCE 7-10 standards. The
survivability of modular green roof system under hurricane conditions is vital in the
pursuit of this sustainable application in the Eastern and Gulf Coast Regions.
Rationale
Green roof systems installed on high rise buildings would produce the most
benefit to as these buildings are typically located in urban settings. Not knowing how
they will perform during hurricane conditions may be a cause for concern for many
owners and buildings who want to pursue sustainable measures in the building design
or renovation. A modular green roof system is a series of trays with vegetation and
growth media resting on a roof surface. One of the advantages of a modular green roof
system is the ease of which it can be moved to allow for easy access to the roof surface
for repairs and maintenance. It is the ease of which modular green roofs can be moved
that begs to question whether they can withstand hurricane force winds. The
design/build community in these cities may want to incorporate and promote green
roofs, however, they may be discouraged from doing so due to the threat that
hurricanes pose each year. If modular green roof systems cannot withstand hurricane
force winds and it is blown away, it will leave the substructure of the roof vulnerable
which will create further damage to the roof. As an owner, knowing whether or not there
is a risk associated with installing green roof systems in this region is important.
Insuring buildings with modular green roofs may become more expensive if they are
susceptible to wind uplift. If the modular tray is blown away by hurricane force winds,
17
this leaves the underlying roof surface exposed and will cause more damage to
components of the roof that were not meant to be exposed to high wind and rain.
To evaluate the effects of wind uplift on modular green roof systems, this
research analyzes the effects strong winds have on the main components of a modular
green roof system. The two components under scrutiny are the vegetation, to include
growth media, and the trays. Strong wind forces, along with saturation, may make the
vegetation easier to uproot depending on the plant’s root structure and the type of soil
the roots are embedded in. Without the weight of the vegetation, the trays will be more
susceptible to the effects of the hurricane strength winds. This research also evaluates
the modular green system as a whole. The system when viewed holistically should be
able to withstand wind uplift forces regardless of vegetation, soil type, and saturated
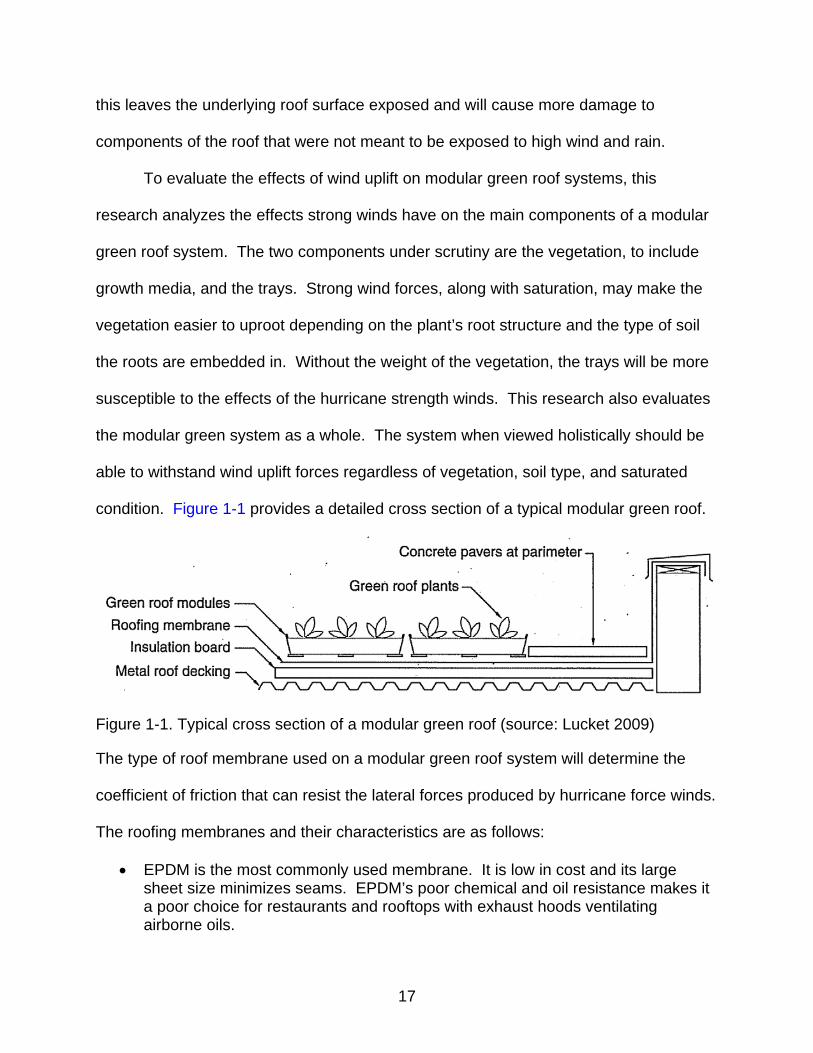
condition. Figure 1-1 provides a detailed cross section of a typical modular green roof.
Figure 1-1. Typical cross section of a modular green roof (source: Lucket 2009)
The type of roof membrane used on a modular green roof system will determine the
coefficient of friction that can resist the lateral forces produced by hurricane force winds.
The roofing membranes and their characteristics are as follows:
• EPDM is the most commonly used membrane. It is low in cost and its large sheet size minimizes seams. EPDM’s poor chemical and oil resistance makes it a poor choice for restaurants and rooftops with exhaust hoods ventilating airborne oils.
18
• TPO is increasing becoming a popular membrane. It is identified by its reflective white surface and is joined together by heat-welded seams. The expense of heat-welding equipment can limit the number of qualified contractors, reducing the competition and increasing the cost of the project. TPO has excellent durability and provides good root, chemical, and oil resistance.
• PVC has a reflective white surface with heated-welded seams. The expense of heat-welding equipment can limit the number of qualified contractors, reducing the competition and increasing the cost of the project. It has excellent durability and provides good root, chemical, and oil resistance.
• Modified Bitumen is commonly used roofing membrane as a cap sheet for built-up roofing systems. It is available in torch down (APP) and adhered (SBS) formulations. It is low cost, but is poor at root resistance and requires the use of a root barrier to prevent plant root from growing into the asphalt surface. Poor chemical and oil resistance makes modified bitumen a poor choice for restaurants and rooftops with exhaust hoods ventilating airborne oils.
• Liquid-Applied Membrane is an increasingly popular waterproofing strategy for green roofs. It is available in hot rubber-modified asphalt formulations and synthetic liquid membrane formulations. It is excellent for monolithic concrete substrates, but its poor root resistance requires the use of a root barrier to prevent plant roots from growing into the asphalt. Poor chemical and oil resistance makes liquid-applied membrane a poor choice for restaurants and rooftops with exhaust hoods ventilating airborne oils.
Aims and Objective of Study
The aim of the study is to determine the approximate wind speed and building
height intensive and extensive green roof modules are able to remain on a roof
structure. The study also evaluates how vegetation and growth media are affected by
wind uplift. The study proposes a method for designers to evaluate the performance of
a modular green roof system under hurricane conditions based on plant type, growth
media, roofing membrane, building location, and building height.
Research Method
The study was based on scholarly articles and books on green roof design and
maintenance, wind design for buildings, plant root structure, and soils. The study used

19
the methods for calculating wind loads on buildings and roof top structures based on the
provisions outlined in ASCE 7-05 and ASCE 7-10.
Assumptions and Limitations
Several assumptions and limitations pertain to this study. This study assumes that
the modular green roof trays will act similarly to rooftop structures and equipment when
exposed to wind forces. The study also assumes that no vegetation or growth media
will be disturbed when the modular trays are exposed to hurricane force winds. The
study assumed that the modular green roof system being evaluated is located on top of
a rectangular shaped building. The study is limited to a singular metal modular
intensive and extensive tray on an EMPD roof membrane surface. Modular green roof
trays can be made of materials other than metal and EMPD is just one type of roofing
membrane that these trays can rest. Modular trays arranged in a grid system will
perform differently under hurricane system as the pivot point of the tray will change.
The square area of the tray will determine how much of an impact the vertical forces
produced by winds will have on it. The model developed for this study does not account
for a parapet wall. According to ASCE 7-05, parapet wall higher than 3 ft (91.4 cm) will
reduce the wind velocity pressure on a roof at the corners of the roof of a building.
Description of Research Organization
The research is comprised of five chapters, the first of which presents the reason
why this researcher saw the need to investigate the effect of hurricane force winds on
modular green roof systems. The first chapter also discusses the limitations to the
study and the selected methodology for the study. The second chapter reviews
literature that support the need for this study and how best to evaluate wind uplift on
modular green roof systems due to hurricane force winds. The third chapter discusses

20
the methodical approach and strategies used to obtain the results of the study while
acknowledging the limitations associated with the study. The fourth chapter presents
the results of the study by graphically illustrating the horizontal and vertical forces
experienced by the intensive and extensive modular trays at various building heights
and the failure height of both intensive and extensive modular systems at various wind
speeds. The fifth chapter concludes the research by presenting the research findings,
strategies that could be employed to prevent wind uplift of modular roof systems due to
hurricane force winds, and recommendations for future research.
Conclusion
The study shall focus on the how hurricane strength winds will affect modular
green roof systems and why this determination is important in the Eastern and Gulf
Coast regions of the United States. The next chapter presents the literature reviewed
for this study.

21
CHAPTER 2 LITERATURE REVIEW
Introduction
The literature reviewed for this research comes from various academic disciplines
to include botany, meteorology, architecture, and engineering. This chapter reviews the
literature authored by green roof industry experts in order to ascertain what methods the
green roof industry has in place to combat hurricane strength winds. An in depth
knowledge of the components of a modular green roof was crucial to this research, thus
literature on plant root structure as it pertain to wind forces was reviewed. Since it was
determined that soil strength is a factor in the ability for plants to resist wind uplift,
literature on soils typical of green roofs was reviewed. Studies on the frequency on
hurricanes along the Eastern and Gulf Coast regions was reviewed to establish the
likely hood that buildings in this region will be subjected to hurricane wind speeds that
would cause damage to roof structures. ASTM Standards used to evaluate wind loads,
along with literature on wind design on structures was reviewed in order to develop a
model that could simulate how hurricane force winds would affect modular green roof
systems.
Making the Case for this Study
In an article written by Kelly Luckett, the president of Green Roofs Blocks, he
discusses his concerns with wind uplift and green roof systems. His concerns came
about after completing a project in Orlando, Florida, and nothing was mentioned of how
the green roof compiled with wind uplift in the building code. Since the Florida Building
Code does not address green roofs, there was no need to ensure it meets the wind
uplift requirements of a traditional roofing system. According to Luckett, the building
22
inspectors turned a blind eye to the green roof portion of the project. The biggest issue
with wind uplift and green roof systems is the potential debris that a green roof systems
will generate when exposed to high winds. A modular green roof is not attached to a
roof and its resistance to normal wind uplift loads is due to its own weight (Weiler and
Scholz-Barth 2009). The issue of wind uplift affects most roof systems. The perimeter
of the roof is affected by a phenomenon known as wind vortex. Wind travels up the wall
of the building and creates negative pressure at the roof surface as it swirls along the
roof edge. In a meeting hosted by the Single Ply Roofing Industry, Mark Graham,
Technical Director of the National Roofing Contractors Association (NRCA), told a group
that the NRCA had proposed changes to the International Building Code (IBC) that
would require green roofs to meet the same requirements for wind uplift as all other
roofing assemblies (Luckett 2009). Mr. Graham felt that the lack of clear direction in the
building code for green roof construction would leave the roofing contractor liable if a
catastrophic failure should ever occur. Opponents to having a standard to green roofs
site Europe as evidence that green roofs structurally safe. According to the website
greenroofs.com, green roofs have been in use in Germany for the past 30 years and the
Germans have been credited as being the originators of green rood technology. The
argument the opponents to green roofs standards try to construct is that Europe has
been installing green roofs for over 30 years and have not had any issues with them.
But unlike the Eastern and Gulf Coast of the United States, European countries are not
subjected to hurricanes and the green roofs being installed on the roofs in those
countries do not have to account for wind uplift compared to the green roof system
being installed roofs located Eastern and Gulf Coast. Another argument these
23
opponents to green roof standards put forth is that there are too many variations of
green roof design and planting schemes to test them all (Retzlaff 2009). The American
National Standards Institute in conjunction with Green Roofs for Healthy Cities and the
Single Ply Roofing Industry have been working together to develop guidelines for wind
up lift on green roofs. The premise in the roofing industry is that vegetated growth
media will perform similarly to other form of roof ballasts when subjected to winds.
Many in the roofing industry agree with this statement despite the lack of empirical
evidence to support this claim (Luckett 2009).
SUI Research
In June 2009, Southern Illinois University Edwardsville performed wind uplift a test
on green roof modules that was sponsored by the NRCA. The modules were tested at
various wind speeds and at a wind speed of 120 mph, began to slide. The module was
tested again with a metal sheet deflector on the front side of the module and the result
was the module being stable for 5 minutes at wind speeds 140 mph. The NRCA made
available to the university René Dupuis, an engineer with “relevant” experience, and
when consulted, suggested to set the module with the corner facing the wind source.
According to the Mr. Dupuis, this would allow for a more realistic representation of wind
forces acting on the surface of a green roof. When the module was initially tested, it
was oriented perpendicular to the wind force and although this set-up was valuable in
determining the fail point of the module, did not properly assess the wind uplift
resistance to the growth media and vegetation. The subsequent test with the module
oriented with the corners facing the wind force resulted in minor media displacement
and minor loss of plant material when subjected to wind speeds of 140 mph for 5
minutes.
24
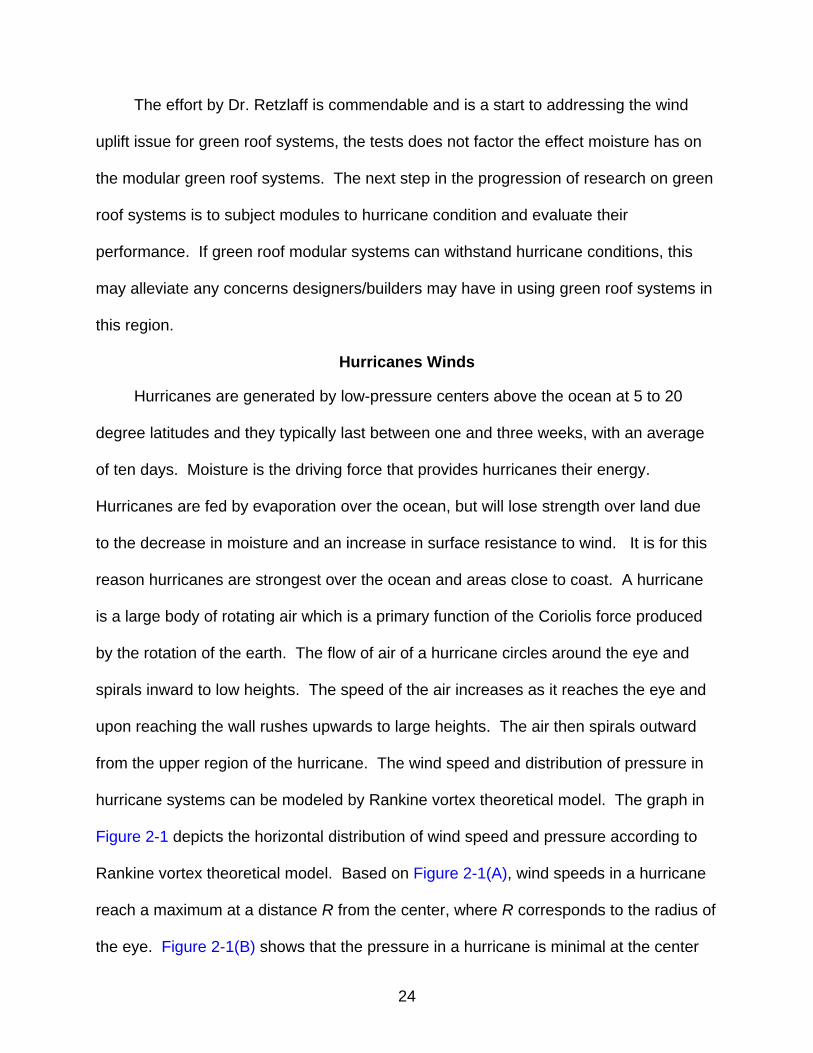
The effort by Dr. Retzlaff is commendable and is a start to addressing the wind
uplift issue for green roof systems, the tests does not factor the effect moisture has on
the modular green roof systems. The next step in the progression of research on green
roof systems is to subject modules to hurricane condition and evaluate their
performance. If green roof modular systems can withstand hurricane conditions, this
may alleviate any concerns designers/builders may have in using green roof systems in
this region.
Hurricanes Winds
Hurricanes are generated by low-pressure centers above the ocean at 5 to 20
degree latitudes and they typically last between one and three weeks, with an average
of ten days. Moisture is the driving force that provides hurricanes their energy.
Hurricanes are fed by evaporation over the ocean, but will lose strength over land due
to the decrease in moisture and an increase in surface resistance to wind. It is for this
reason hurricanes are strongest over the ocean and areas close to coast. A hurricane
is a large body of rotating air which is a primary function of the Coriolis force produced
by the rotation of the earth. The flow of air of a hurricane circles around the eye and
spirals inward to low heights. The speed of the air increases as it reaches the eye and
upon reaching the wall rushes upwards to large heights. The air then spirals outward
from the upper region of the hurricane. The wind speed and distribution of pressure in
hurricane systems can be modeled by Rankine vortex theoretical model. The graph in
Figure 2-1 depicts the horizontal distribution of wind speed and pressure according to
Rankine vortex theoretical model. Based on Figure 2-1(A), wind speeds in a hurricane
reach a maximum at a distance R from the center, where R corresponds to the radius of
the eye. Figure 2-1(B) shows that the pressure in a hurricane is minimal at the center

25
and rises with r, where r represents the radial distance from the hurricane’s center (Liu
1991).
A
B
Figure 2-1. Horizontal distribution of wind speeds and pressure in a hurricane or tornado according to Rankine Vortex theoretical model. A) Velocity Distribution. B) Pressure Distribution. (source: Liu 1991).
Wind speed is measured by anemometers mounted normally at a height of 33 ft
(10 m) above the ground. This measurement is considered to be surface wind and
should not be confused with the wind measurements by aircrafts at high altitudes as
wind speed in hurricanes decreases with a decrease in height, reaching zero velocity at
ground level. Surface wind is the wind that is normally experienced by structures unless
the structure is very tall (Liu 1991).
The National Hurricane Center (NHC) uses the Saffir-Simpson scale categorizes a
hurricane based on wind speeds and the damage those wind speed will cause. Table
2-1 depicts the classification of hurricanes.
26
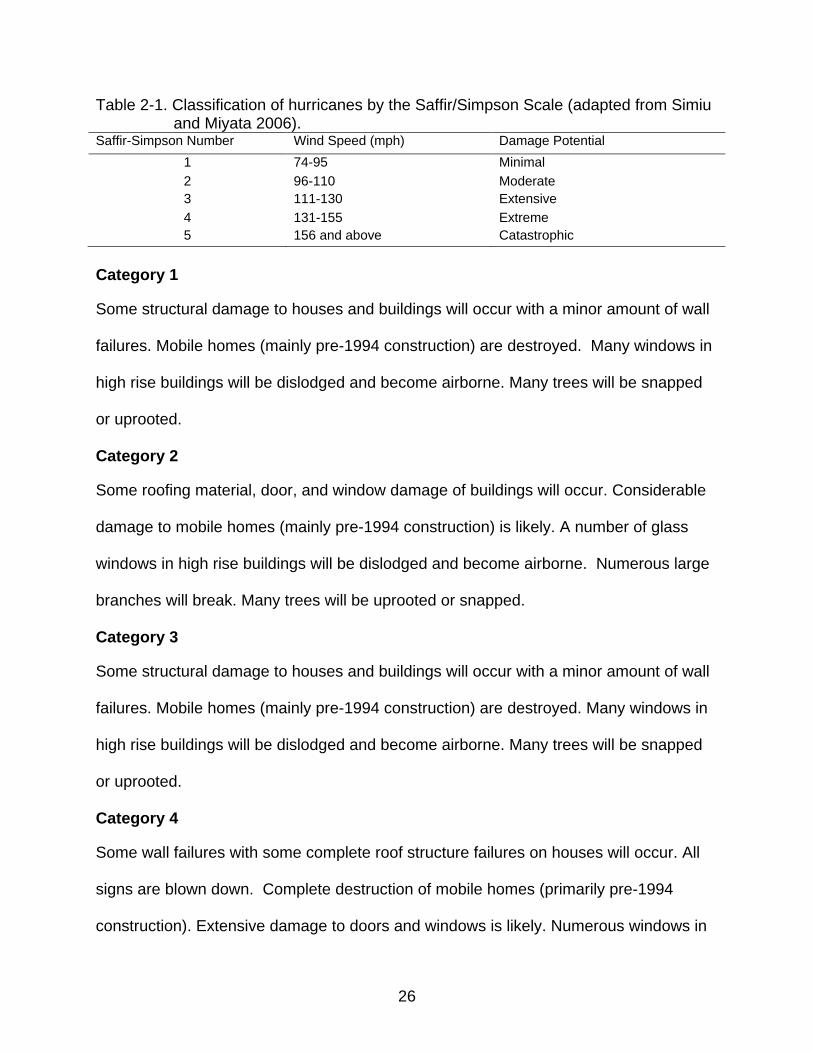
Table 2-1. Classification of hurricanes by the Saffir/Simpson Scale (adapted from Simiu and Miyata 2006).
Saffir-Simpson Number Wind Speed (mph) Damage Potential 1 74-95 Minimal 2 96-110 Moderate 3 111-130 Extensive 4 131-155 Extreme 5 156 and above Catastrophic
Category 1
Some structural damage to houses and buildings will occur with a minor amount of wall
failures. Mobile homes (mainly pre-1994 construction) are destroyed. Many windows in
high rise buildings will be dislodged and become airborne. Many trees will be snapped
or uprooted.
Category 2
Some roofing material, door, and window damage of buildings will occur. Considerable
damage to mobile homes (mainly pre-1994 construction) is likely. A number of glass
windows in high rise buildings will be dislodged and become airborne. Numerous large
branches will break. Many trees will be uprooted or snapped.
Category 3
Some structural damage to houses and buildings will occur with a minor amount of wall
failures. Mobile homes (mainly pre-1994 construction) are destroyed. Many windows in
high rise buildings will be dislodged and become airborne. Many trees will be snapped
or uprooted.
Category 4
Some wall failures with some complete roof structure failures on houses will occur. All
signs are blown down. Complete destruction of mobile homes (primarily pre-1994
construction). Extensive damage to doors and windows is likely. Numerous windows in
27
high rise buildings will be dislodged and become airborne. Wind-borne debris will cause
extensive damage. Most trees will be snapped or uprooted.
Category 5
Complete roof failure on many residences and industrial buildings will occur. Some
complete building failures with small buildings blown over or away are likely. Complete
destruction of mobile homes (built in any year). Severe and extensive window and door
damage will occur. Nearly all windows in high rise buildings will be dislodged and
become airborne. Nearly all trees will be snapped or uprooted and power poles
downed. Fallen trees and power poles will isolate residential areas.
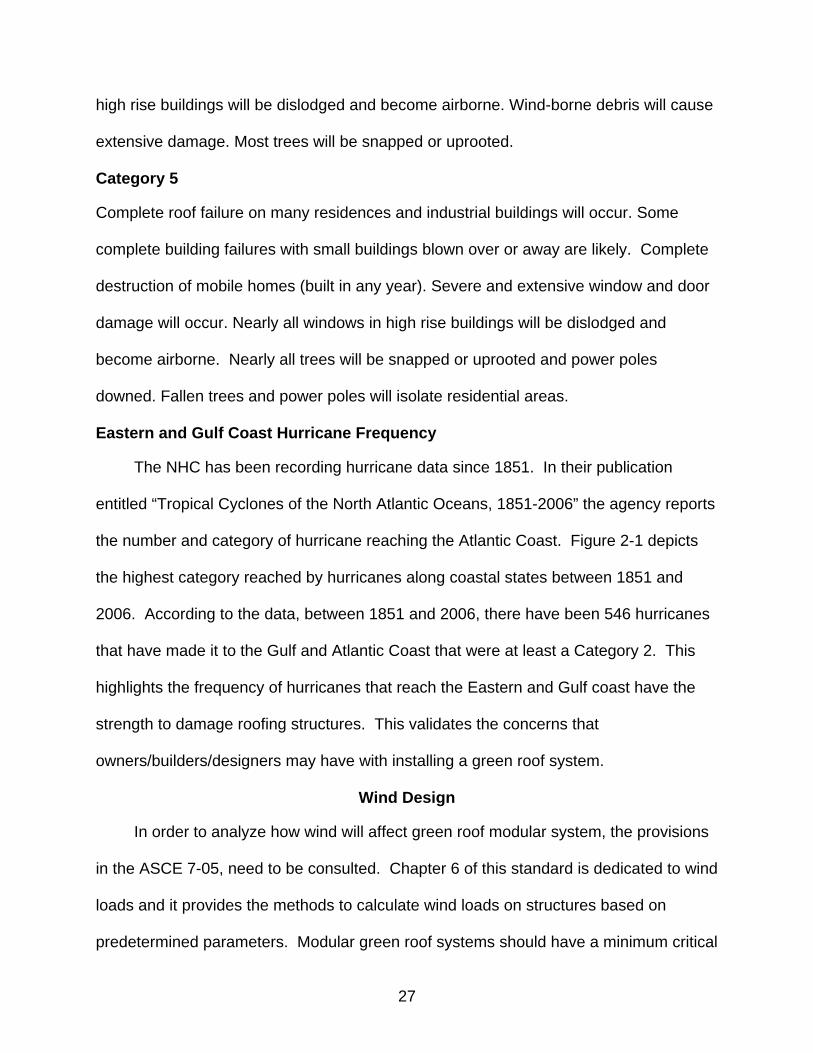
Eastern and Gulf Coast Hurricane Frequency
The NHC has been recording hurricane data since 1851. In their publication
entitled “Tropical Cyclones of the North Atlantic Oceans, 1851-2006” the agency reports
the number and category of hurricane reaching the Atlantic Coast. Figure 2-1 depicts
the highest category reached by hurricanes along coastal states between 1851 and
2006. According to the data, between 1851 and 2006, there have been 546 hurricanes
that have made it to the Gulf and Atlantic Coast that were at least a Category 2. This
highlights the frequency of hurricanes that reach the Eastern and Gulf coast have the
strength to damage roofing structures. This validates the concerns that
owners/builders/designers may have with installing a green roof system.
Wind Design
In order to analyze how wind will affect green roof modular system, the provisions
in the ASCE 7-05, need to be consulted. Chapter 6 of this standard is dedicated to wind
loads and it provides the methods to calculate wind loads on structures based on
predetermined parameters. Modular green roof systems should have a minimum critical
28
depth and weight to effectively serve as roof ballast to be able to withstand certain wind
loads. The parameters that are pertinent to this research are wind speeds, building
categories, exposure categories, and enclosure classification.
Figure 2-2. Number of Saffir-Simpson category events for specified coastal states, 1851-2006 (source: McAdie et al. 2009).
Wind is defined as a turbulent flow, characterized by the random fluctuations of
velocity and pressure (Liu 1991). The ASCE 7-05 specifies three procedures for
determining design wind loads: the simplified procedure, the analytical procedure, and
the wind tunnel procedure. To apply the standard, the engineer must know the basic
29
wind speeds, importance factors, exposure categories, and topographic factors (Simiu
and Miyata 2006). Wind speed changes constantly so in order to determine wind
speed, averages are obtained using different averaging times or durations. Gust is the
instantaneous velocity wind. Ordinary structures are sensitive to peak gusts with the
duration of 1 second, therefore the use of a mean wind speed value over one second
for structural design must account for gust (Liu 1991). According to the ASCE 7-05
standard, the basic wind speed is defined as the 3 second peak gust at 33 ft (10 m)
above the ground in open terrain. In hurricane prone regions the basic wind speed is
defined as the speed with a mean recurrence interval (MRI) of 500 years instead of 50
years for winds outside hurricane prone regions. The MRI is the probability that wind
speeds occurring in any one year exceeds an expected value (Simiu et al. 2006).
ASCE 7-05 divides buildings into four categories based on the risk these buildings
pose to human life if failure occurs.
• Category I: agricultural facilities, minor storage facilities, and certain temporary facilities.
• Category II: all categories not defined in categories I, III, and IV.
• Category III: buildings and other structures where more than 300 people congregate in one area.
• Category IV: structures designated as essential facilities.
The importance factor coefficient varies depending on the category of the structure and
whether or not the region it resides in is prone to hurricanes.
In order to properly evaluate the wind loads, the surface roughness category
needs to be assigned. The surface roughness categories are as follows:
• Surface Roughness A: omitted from standard due to the practical impossibility of defining reliably the surface roughness of centers of large cities

30
• Surface Roughness B: urban and suburban areas, wooded areas, or other terrain with numerous closely spaced obstructions having the size of the single-family dwelling or larger.
• Surface Roughness C: open terrain with scattered obstruction generally less than 30 ft (10 m) high and flat open country, grasslands, and water surfaces in hurricane prone regions.
• Surface Roughness D: flat, unobstructed areas, including smooth mudflats, salt flats, and unbroken ice, and water surfaces outside hurricane prone regions.
See Appendix A for a visual depiction of the different exposure surfaces. Other factors
that the ASCE standard considers that are pertinent in this study are whether the
building being evaluated is open, enclosed, or partially enclosed. The enclosure
classifications are as follows: 1) Open: a building having each wall at least 80 percent
open; 2) Partially Enclosed: A building that complies with the following conditions. The
total area of the openings in a wall that receive positive external pressure exceeds the
sum of the areas of openings in the balance of the building envelope (walls and roof) by
more than 10 percent. The total area of the openings in a wall that receives positive
external pressure exceeds 4 ft2 (0.37 m2) or 1 percent of the area of that wall, whichever
is smaller, and the percentage of openings in the balance of the building envelope does
not exceed 20 percent; and, 3) Enclosed: A building that does not comply with the
requirements for open or partially enclosed buildings. For the purposes of enclosure
classification, glazing and doors are not considered defined as openings except under
certain conditions (Simiu and Miyata 2006).
The topography of the land has an effect on wind speed due to rising slopes.
Over rising slopes, wind speeds are higher for any given height above ground
compared to winds traveling over horizontal terrain (Simiu and Miyata 2006). This effect
has to be factored into the wind design calculations.
31
Green Roof Design Considerations
The benefits of green roof systems are more pronounced in commercial buildings
located in an urban setting. Commercial and residential buildings in the heart of major
cities along the Eastern and Gulf Coasts tend to be over 3 stories in height. Since wind
speed increases with height, over 3 stories will experience a stronger wind force and will
be more susceptible to wind uplift. This provides yet another deterrent for
owners/builders/designers to install a green roof system in a building over 3 stories in
an area prone to hurricanes as the green roof systems will likely experience scouring.
Scouring is the blowing of the particles in the growth media from the surface of the
green roof (Luckett 2009). This effect reduces the volume and weight of the growth
media and its ability to ballast the green roof components below. Scouring has a
greater effect on intensive green roof systems as those systems are designed to hold
larger vegetation. Taller, upright plants catch wind easier and thus are easier to uproot.
Hurricane conditions will only magnify the effect of scouring on extensive systems as
plants in saturated soil will not be anchored as well and it will be blown away easier
when subjected to hurricane force winds. To limit the effect of scouring on taller plants,
Luckett, in his book “Green Roof Construction and Maintenance”, suggest planting
these trees away from the roof edges where winds tend to be stronger. He also
suggests the use of anchors to allow for these taller plants to establish roots capable of
withstanding wind loads, however, under hurricane conditions, the soil will be saturated
and the roots of these taller plants will be loosen and any technique used to ensure
proper anchoring will be negated.

32
The International Green Roof Association Global Networking for Green Roofs
recommends that plant materials can be broken down in these basic categories for the
purpose of structural load calculations:
• Sedums and succulents – 2 lb/ft2 • Grasses and bushes up to 6 inches – 3 lb/ft2 • Shrubs and bushes up to 3 feet – 4 lb/ft2 For design purposes the weight of green roofs are comparable to stone ballast used to
protect and preserve the water proofing membrane on traditional roofing systems. The
structural engineer of a green roof will break up the vegetation into three main
categories: lawns; short grasses; shrubs; and trees. The depth of the soil required to
promote growth, and the weight of the vegetation itself, is the distinguishing factor for
each category. Soil densities and loads vary depending on the type of soil, its level of
compaction, and its moisture content. Table 2-2 lists the soil density for commonly used
growth media.
Table 2-2. Weights of commonly used growing media components (adapted from Weiler and Scholz-Barth 2009)
Growth Media Pressure Loamy soils (saturated) 100-120 pcf Clayey soils (saturated) 105-125 pcf Silty soils (saturated) 100-120 pcf Humus 80-85 pcf Mulch 90-95 pcf Lightweight aggregates 45-55 pcf Sand (saturated) 120-130 pcf Prefabricated lightweight soils (saturated) 6.5-8 psf per inch of depth
Engineers will most likely use the lightest growth media in green roof design to
reduce the cost associated with the materials needed to support more weight. The
problem with this philosophy is that the lighter the green roof system, the bigger the
impact wind uplift will have on it. However, hurricanes produce a lot of rain and the
33
saturation of the soil will provide additional weight to the system that will prevent some
uplift.
It is not necessary to calculate the wind loads on grass and shrubs as these loads
are typically negligible. Wind loads should be taken into consideration for any trees or
vegetation planted over the structure. When wind pressure acts against the tree canopy
and surface, a tree firmly rooted in the soil acts as a cantilever and has to resist
overturning forces. The survivability of trees when exposed to wind forces is dependent
upon how well their roots have been established. The horizontal forces acting on a
structure due to the wind pressure on a trees area (canopy and trunk) can be significant
to the structure’s lateral force resisting system design, depending on the building’s size,
and should be considered in the developing structural systems for green roof systems.
(Weiler and Scholz-Barth 2009).
The Vegetation Component
The type of vegetation that makes up the green roof system is important to its
effectiveness. The vegetation used should be similar to the natural vegetation of that
region. Modular green roofs systems are basically planters that are arranged on
rooftops and are comprised of engineering soil blends and plants based on the regional
climate. It is recommended that green roof plants be able to withstand extremes of heat
and cold, low growing, shallow roots, and long life expectancy (Lucket 2009).
Plant Root Structure
Engineers evaluate root structures in plants because roots provide anchoring and
absorb water and nutrients from the soil. This research focuses on the anchoring
function of roots. The force that plants commonly experience is the horizontal force by
the wind which results in overturning. Roots therefore have to be able to transmit
34
rotational torque to the soil effectively. Fibrous root systems are effective at preventing
uprooting but not as effective at avoiding overturning. Tap and plate root systems tend
to have at least one rigid element at the base of the stem to act as a lever which can
provide resistance to rotation. There are two other root systems that provide effective
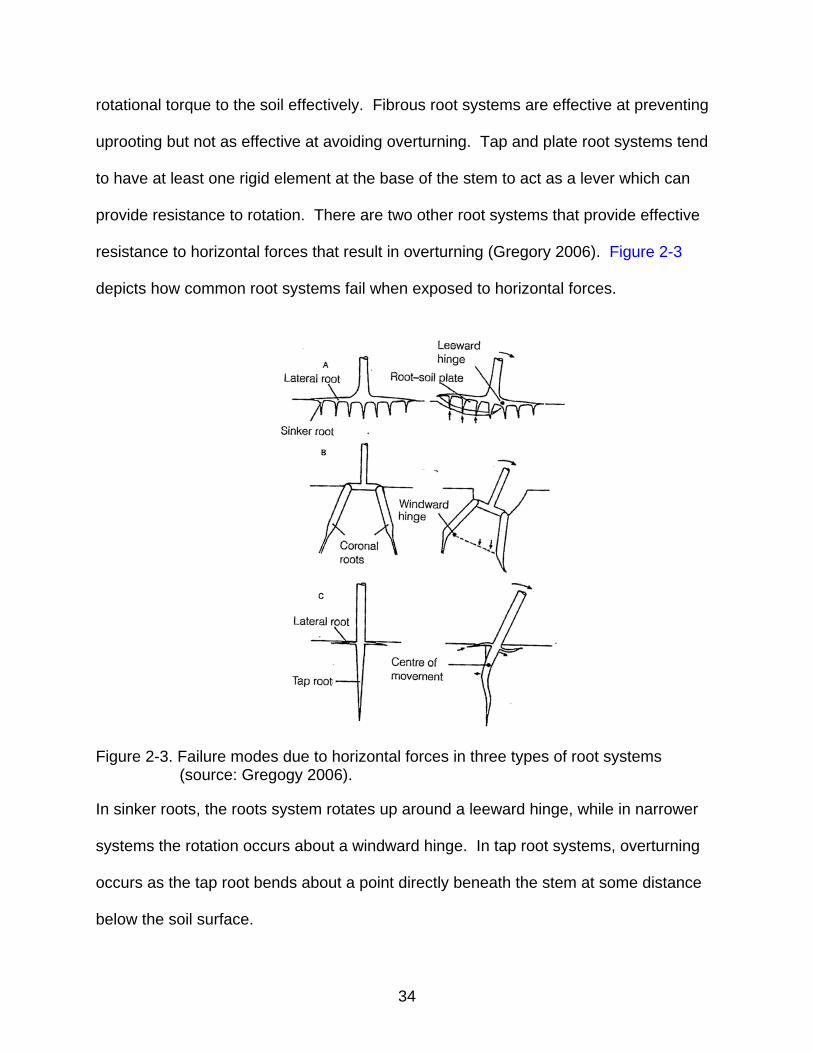
resistance to horizontal forces that result in overturning (Gregory 2006). Figure 2-3
depicts how common root systems fail when exposed to horizontal forces.
Figure 2-3. Failure modes due to horizontal forces in three types of root systems (source: Gregogy 2006).
In sinker roots, the roots system rotates up around a leeward hinge, while in narrower
systems the rotation occurs about a windward hinge. In tap root systems, overturning
occurs as the tap root bends about a point directly beneath the stem at some distance
below the soil surface.

35
Tap roots is a characteristic of most small flowering plants that are in the
dicotyledon class of plants. The anchoring mechanism of tap roots is twofold: (1) the
resistance of the soil to compression on the leeward side; and, (2) the bending
resistance of the tap root. If the tap root is acting like a foundation pile so that the plant
can resist overturning, then the maximum resistance (Rmax) to lateral loading can be
predicted by the equation:
Rmax=4.5σDL2 (2-1)
where D and L are the diameter and the length of the rigid rod and σ is the shear
strength of the soil. Based on this equation, soil properties have a significant influence
on the failure.
A study of vegetation, particularly grasses, shrubs, herbs, other small
dicotyledons, found in the Cárcavo catchment, located about 25 miles (40 km)
northwest of the city of Murcia in Spain, was conducted to evaluate the root tensile
strength and root reinforcement. The study excavated 50 roots of the different types of
plants all with a diameter less than 0.3 in (8 mm) and a minimum root length of
approximately 4 in (0.10 m). The roots were carefully preserved and tested for tensile
strength using a universal tensile and compression test machine. The following formula
was used to calculate the tensile strength of the root, Tr:
Tr=Fmax
π�D2
4 � (2-2)
where Fmax is the maximum force (N) needed to break the root and D is the root
diameter. Figure 2-4 shows the result of the laboratory test of root tensile strength for
different types of vegetation.
36
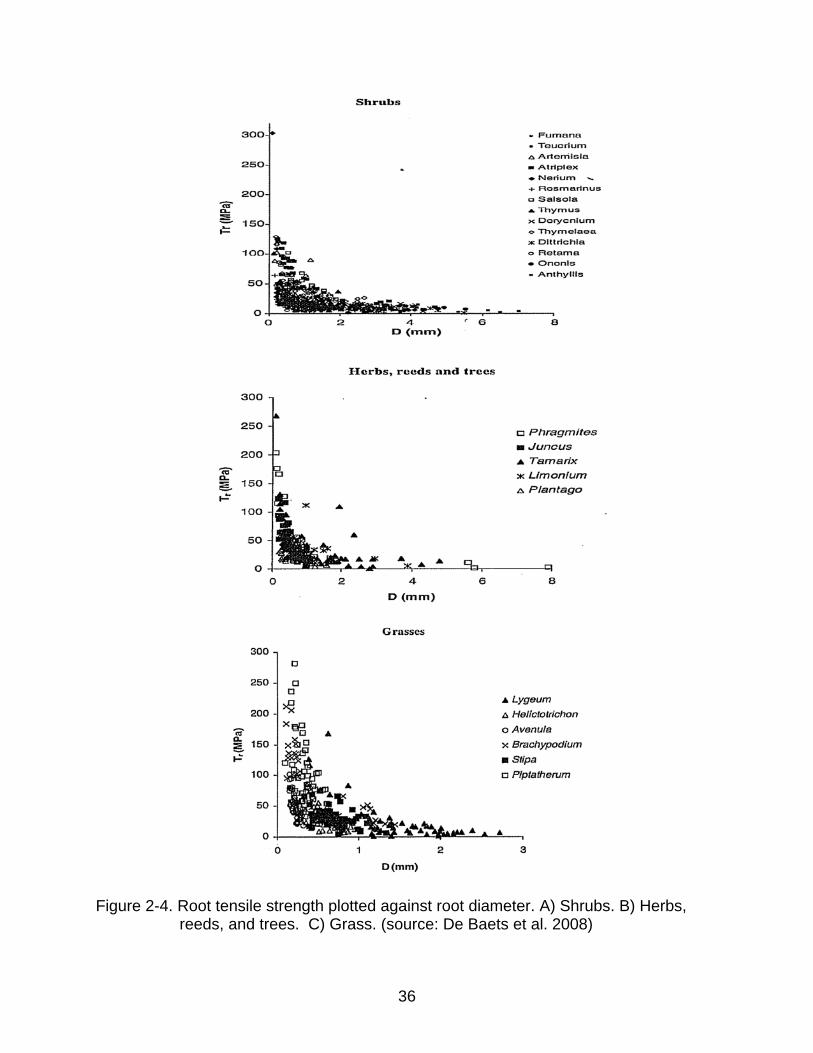
Figure 2-4. Root tensile strength plotted against root diameter. A) Shrubs. B) Herbs, reeds, and trees. C) Grass. (source: De Baets et al. 2008)

37
The maximum root tensile strength recorded in the test was 303 MPa with a root
diameter of 0.09 mm. The test results also showed that the plant species Atriplex
halimus had the strongest roots among the shrubs and Brachypodium retusum had the
strongest roots among the grass (De Baets et al. 2008).
The study also assessed the contribution root area concentration to soil strength.
Root area ratio (RAR) was calculated using root length density (RLD) and the diameter
of the root. The notion is that there is an increase in soil shear strength due to the
presence of roots. Plant roots act as a cohesive agent in the soil, binding the soil
together in a “monolithic mass” which contributes to the soil strength (De Baets et al.
2008). Plants with a large RAR value will have serve to strengthen the soil it inhabits.
Figure 2-5 shows the RAR of different species of plants.
Figure 2-5. Root area ratio (RAR) distribution with depth. A) Shrubs. B) Herbs, reeds, and trees. C) Grass. (source: De Baets et al. 2008)
(A) (B)
(C)
38
To comprehensively evaluate how a plant root system will perform under lateral
loading, plants need to be evaluated with based on root length, root diameter, RAR, and
soil type. Evaluating the combination effect of root length, root diameter, and RAR on
lateral loading resistance is beyond the scope of this research. This researcher
however recommends evaluating this combination effect if green roof modules are
tested in a wind tunnel as it is still important to determine the survivability of the
vegetation component if exposed to hurricane force winds.
Wind Loading
The effect on wind loading on vegetation is only significant if the wind is stronger
than 11 m/s (24.6 mph). Wind tunnel experiments have shown that wind blowing
parallel to a level surface can be expressed by the equation:
p=0.5paV2CD (2-3)
Other experiments have developed an equation to determine shear forces and
overturning moments due to wind. The equation is based on the assumption that the
wind is only acting on individual trees and any dynamic effects are ignored. A single
tree being exposed to a wind parallel to the slope can be expressed by the equation:
ps=p cos β cos β (2-4)
ps represents the wind pressure and β is the slope angle normal to the wind pressure
(Coppin and Richards 1990).
Growth Media
The type of growth media selected on a green roof is important to the longevity of
the system. The type of growth media selected has more implication than how long the
plant is going to last. It may also determine the survivability of the system under

39
hurricane conditions. How well roots perform the function of anchorage depends on the
soil the roots are embedded. Soil shear strength decreases and increases with
moisture content hence plants are more susceptible to overturning in waterlogged soil.
When the soil is waterlogged, critical shear stress is reached as the soil particle looses
cohesion (Stokes 2002). The growth media on a green roof is generally lightweight and
able to support plant life. Expanded aggregates, pumice, and volcanic rock are used as
foundation for the growth media for green roofs because these minerals will not break
down over time, thus contributing to the longevity of the green roof. The plant requires
some amount of nutrients and this provided be added organic material to the growth
media. The ratio of mineral to organic material that will contribute to a successful green
roof is 80% mineral and 20% organic. A Michigan experiment attempted to determine
the right organic to mineral blend. The experiment used 60% - 100% expanded slate as
the inorganic substrate. For blends that had less than 100% expanded slate, the
remaining volume was filled with a mixture of peat, sand and aged compost. The result
showed that a growth media mix can be comprised of 80% of inorganic material and still
produce healthy plants. Another study conducted by Southern Illinois University,
Edwardsville (SIUE) did a similar research in an attempt to determine the best growth
media mix. The experiment involved using four different types of inorganic components:
Arkalyte, Haydite, lava, and pumice. The inorganic to organic ratio was kept at 80:20
with pine bark making up the organic component. The study found that pumice blend
provided the best roof coverage after six months. Typically, traditional soil is too heavy,
especially when wet to use on rooftops, so a green roof growing substrate was
developed that had water holding capacity, degree of drainage, fertility for vegetation
40
and growth. A firm in Atlanta is using growth media that is primarily sand based with
expanded clay or slate and compost. Other common growth media used on green roofs
are expanded shale, expanded clay, and crushed roofing tiles (Lucket 2009).
The ability for plants to avoid being overturned by the wind is a function of the
plant’s diameter, its length, and the shear strength of the soil. The shear strength of the
soil is defined as the maximum resistance which it can offer to shear stress (Bell 1992).
Two common growth media are peat and shale. The shear strength of peat is
influenced by humification and mineral content (Bell 1992). Humification is essentially
an oxidation process in which complex organic molecules are broken down into simpler
organic acids, which may subsequently be mineralized into simple, inorganic forms
suitable for uptake by plants (Allaby 2004). Shear strength is directly proportional to
these two factors. Increased moisture content of peat has the effect of lowering its
shear strength. Peat is also found to be prone to rotational failure or failure by
spreading, especially when subjected to horizontal seepage forces. Peat has been
found to behave similarly to normally consolidated clay, despite its extremely high water
content. When fully saturated the strength of peat is negligible, as water is removed, it
increases to values between 20 kN/m2 (417.7 lb/ft2) and 30 kN/m2 (626.6 lb/ft2) (Bell
1992).
The strength of shale decreases exponentially as the void ratio and moisture
increases. Shale strength can be as weak as 15 kN/m2 (313.3 lb/ft2) or as strong as 23
MN/m2 (480,365 lb/ft2) depending on when it was formed. Shales formed in the
Cambrian period showed to be the strongest. Desired use of the shale in the design
41
would determine the needed strength, however, it is not recommended to use shale with
strength lower than 20 kN/m2 (417.7 lb/ft2) (Bell 1992).
Conclusion
There is little study in the roofing industry on how wind forces affect modular green
roof systems. One possibility for the lack of research is the myriad of variations to
green roof systems that can be installed on a roof. Each configuration will perform
differently when exposed to hurricane force winds. Another reason is the different
parameters involved in determining wind load calculation. The building height and type
of roof can affect the performance of the modular roof systems when exposed to high
wind speeds. The literature review did show a strong possibility for the Eastern and
Gulf Coast region to experience at least Category 2 hurricane each year. This data
further validates the need to evaluate modular green roof systems in this region and
promotes the need for standards to be in place that specifically address wind design
criteria for green roof systems.
42
CHAPTER 3 METHODOLOGY
Introduction
In order to evaluate the effect of hurricane force winds, a theoretical building with
an intensive and extensive modular green roof system was developed. The model was
developed based on the Florida Building Code, ASCE 7-05, and ASCE 7-10. The
building is located in an urban setting in the Florida. Florida was chosen because the
State covered the range of wind speeds used in calculating wind loads on a building.
The building type was based on buildings typical metropolitan area in Florida. The
Florida Building Code was used to determine if any building height restrictions existed,
while the ASCE Standards where used to determine the parameters needed to
calculate wind loads based on the building type and location.
Developing the Model
Building
Green roofs are going to be most effective in very densely populated areas where
there is a lot of hardscape. The theoretical model will be based on the types of
buildings typical of densely populated urban areas. Since wind force increases with
elevation, the building types being theoretical modeled are high rise commercial and
residential buildings. These buildings typically have a flat roof top surface with a
parapet, thus the wind load calculations will also based on this assumption.
Florida Building Code
The Florida Building Code was consulted to determine building height and parapet
restrictions for the theoretical model. The Florida Building Code was used as the state
has coastlines located in the eastern most part of the United States and the Gulf of
43
Mexico. In order to determine height constraints on the theoretical model, the building
group needs to be known. The height restriction of the theoretical model is based on
the Group B, Group R-1, and Group R-2 classification of buildings. Section 304.1
defines Group B as buildings that occupancy includes among others, the use of a
building or structure, or portion thereof, for office, professional or service-type
transactions, including the storage of records and accounts. Based on this definition,
high rise commercial buildings of a densely populated urban area will fall into this
category. Section 310.1 defines Group R as buildings that occupancy includes, among
others, the use of a building or structure, or portion thereof, for sleeping purposes when
not classified as an Institutional Group I or when not regulated by the Florida Building
Code. Buildings in the Group R-1 are those that contain sleeping units where the
occupants are primarily transient in nature. An example of a building in this category is
a hotel. Group R-2 buildings are building that contain sleeping units or more than two
dwelling units where the occupants are primary permanent in nature. Example of a
building in this category is a condominium. Section 503 in the building code governs
the height and area limitations for buildings and it states that the height and area for a
building will be governed by the intended use of the building and shall not exceed the
limits in the Table 503 of the Florida Building Code. The height and area limitations for
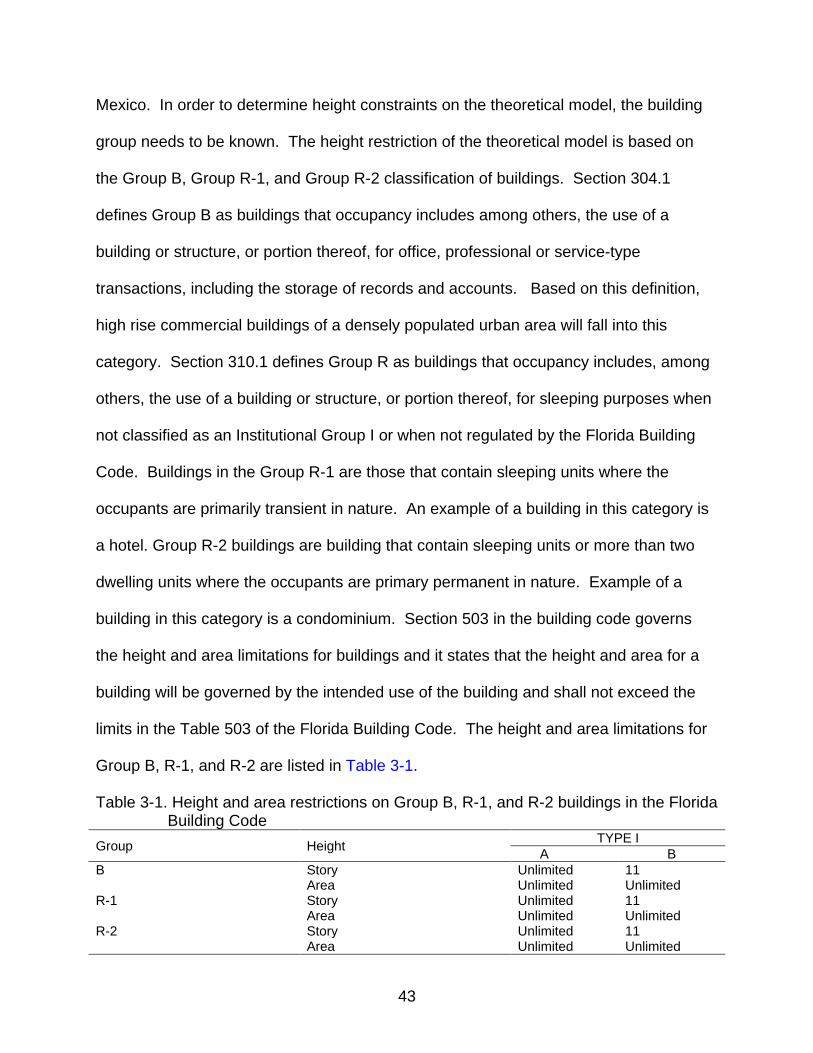
Group B, R-1, and R-2 are listed in Table 3-1.
Table 3-1. Height and area restrictions on Group B, R-1, and R-2 buildings in the Florida Building Code
Group Height TYPE I A B
B Story Unlimited 11 Area Unlimited Unlimited
R-1 Story Unlimited 11 Area Unlimited Unlimited
R-2 Story Unlimited 11 Area Unlimited Unlimited
44
Type I construction are those types of construction in which the building elements such
as: structural frame; nonbearing walls; partitions; floor construction; and roof
construction are of noncombustible materials or treated with a fire retarding agent. If
the building is over two stories are 20 ft in height, fire treated wood is not permitted in
the construction of the roof. Type I-A are typical of high rise buildings and Type I-B are
typical of mid-rise buildings. The most appropriate type of construction for the
theoretical model would be Type I-A, however, this construction type is unrestricted in
height and area. The wind load calculations will be based on the highest building in the
State of Florida. According to Emporis.com, a website that provides building
information for buildings around the world, the Four Season Hotel in Miami in not only
the tallest building in Florida, but it is also the tallest building south of Atlanta, Georgia.
This building is approximately 788 ft 9 in (240.41 m) tall with an approximate building
footprint of 1500 ft2 (139.4 m2). The building footprint information was gathered from
talking to the engineering department of the hotel. The theoretical model will have a
roof plan area of 1000 ft2 (92.9 m2) since the graph in Figure 6-15 depicts the GCp
coefficient as that is the maximum value on the effective wind area axis on that chart
and a height of 790 ft (240.8 m).
A parapet is typical of high rise buildings and according to Section 2121.2.5.2 of
the Florida Building Code, a parapet wall exceeding 5 ft (1.534 m) in height above a tie
beam or other point of lateral support shall be specifically designed to resist horizontal
wind loads.
Modular Trays
In order to properly calculate wind loads on the modular green roof system, the
dimensions of trays will be needed. Modular trays vary in length and width, and can

45
range in depths depending on the type of vegetation in needs to support. The
dimensions being used in the theoretical model will be based on Weston Solution’s
GreenGrid® System. According to the specification summary of the products the
weights in Table 3-2 are based on bulk density at maximum water holding capacity.
Table 3-2. Intensive and Extensive GreenGrid® modular green roof system
Module Type Size Weight of Planted Modules
Extensive 2 ft x 2ft x 4 in 60.96 cm x 60.96 cm x 10.16 cm
18 – 22 lb/ft2
87.9 – 107.4 kg/m2 Intensive 2 ft x 2 ft x 8 in
60.96 cm x 60.96 cm x 20.32 cm 36 – 44 lb/ft2 175.7 – 214.7 kg/m2
The theoretical model will use the 22 lb/ft2 and the 44 lb/ft2 weight to predict the best
chance for the modular trays not to be influenced by hurricane force winds.
ASCE 7-05/10, Wind Load Calculation
Any reference made to figures, sections, and formulas are from ASCE 7-05, Chapter
6, Wind Loads unless stated otherwise. In order to use the analytical procedure for
calculating wind loads on buildings, the building has to meet the following conditions:
1. The building or the other structure is a regular-shaped building or structure as defend in section 6.2.
2. The building does not have response characteristics making it subject to across wind
loading, vortex shedding, instability due to galloping or flutter; or does not have site location for which channeling effects or buffeting in the wake of upwind obstructions warrants special consideration.
Calculation for velocity pressure will be based on the following equation:
qz=0.00256KzKztKdV2I (5)
Section 6.5.7.1 states that isolated hills, ridges, and escarpments constituting
abrupt changes in the general category, located in any exposure category, shall be
included in the design. If site conditions and locations of the structures do not meet all
the conditions specified in Section 6.5.7.1, Kzt = 1.0. Florida is a relatively flat state with

46
little hills especially in the areas close to the coast, where you will find most of the
state’s major cities.
Section 6.5.8.1 states that for rigid structures as defined by section 6.2, the gust-
effect factor, Kd shall be taken as 0.85. A rigid building is defined as having a negligible
wind induced resonance. The theoretical model will be rigid as it is representative of a
typical high rise residential or commercial building.
Section 6.5.4.4 states that the wind directionality factor, Kd, shall be determined
from Table 6-4. Using the table, the Kd value will be 0.85 as the structure type being
evaluated is a building.
Table 6-1 provides the value for the Importance Factor, I. The building category
for the theoretical model will be Category II. For Category II, I is 1.0 for hurricane prone
regions with wind speed greater than 100 mph.
The values for V, wind speed, will be based on the Figure 6-1A. Based on Figure
6-1A, the design wind speed for the State of Florida range from 100 mph to 150 mph,
and is representative of the range of design wind speeds in the Eastern and Gulf
Coasts.
Section 6.5.6.6 outlines the use of the Velocity Pressure Exposure Coefficient,
Kz. According to Table 6-3, Kz may be determined by the following formula:
For 15 ft (4.6 m) ≤ z ≤ zg
Kz=2.01( z zg� )2 α� (3-1)
The values zg is 1200 and α is 7.0 based on exposure category B. Exposure category
B characterized as urban area with numerous closely spaced obstructions having the
size of a single family dwelling or larger. The values for z will be start at 33 ft since wind
47
speed is defined at that height. The values will range from 33 ft (10 m) to 790 ft
(241.8 m).
A value for velocity pressure, V will be calculated with the z value increasing at 15 ft
increments, representing an additional story, for the different ranges of hurricane wind
speeds.
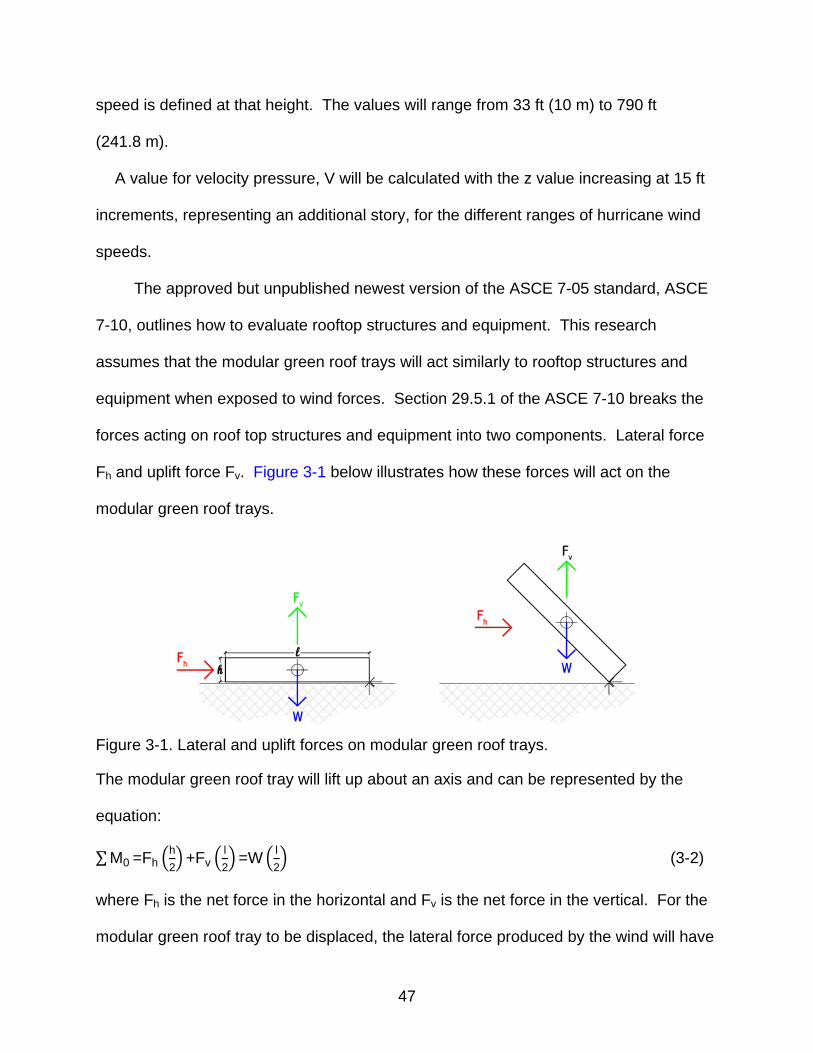
The approved but unpublished newest version of the ASCE 7-05 standard, ASCE
7-10, outlines how to evaluate rooftop structures and equipment. This research
assumes that the modular green roof trays will act similarly to rooftop structures and
equipment when exposed to wind forces. Section 29.5.1 of the ASCE 7-10 breaks the
forces acting on roof top structures and equipment into two components. Lateral force
Fh and uplift force Fv. Figure 3-1 below illustrates how these forces will act on the
modular green roof trays.
Figure 3-1. Lateral and uplift forces on modular green roof trays.
The modular green roof tray will lift up about an axis and can be represented by the
equation:
∑M0 =Fh �h2�+Fv �
l2�=W � l
2� (3-2)
where Fh is the net force in the horizontal and Fv is the net force in the vertical. For the
modular green roof tray to be displaced, the lateral force produced by the wind will have
48
to overcome the frictional force of the roofing membrane, while the uplift force will have
to overcome the weight of the modular green roof tray. The coefficient of friction is the
ratio of the frictional force between two bodies, parallel to the contact surface, to that of
the force normal to the contact surface. Breakaway friction is the threshold friction
coefficient as motion begins, and running friction is the steady-state friction coefficient
as motion continues. EPDM is the most common type of roofing membrane and the
coefficient of friction used in force calculations will assume that the modular green roofs
are resting on an EPDM surface. The Mechanical Engineering Handbook states the
theory of dry friction is the maximum frictional force that can be exerted on dry
contracting surfaces that are stationary relative to each other (Marghitu et al. 2001).
The value for coefficient of friction for EPDM is based on study on the dry friction and
sliding wear of EPDM rubbers. The friction and wear characteristics were determined
with a steel pin being pushed against the rubber plate with different loads (POP-L).
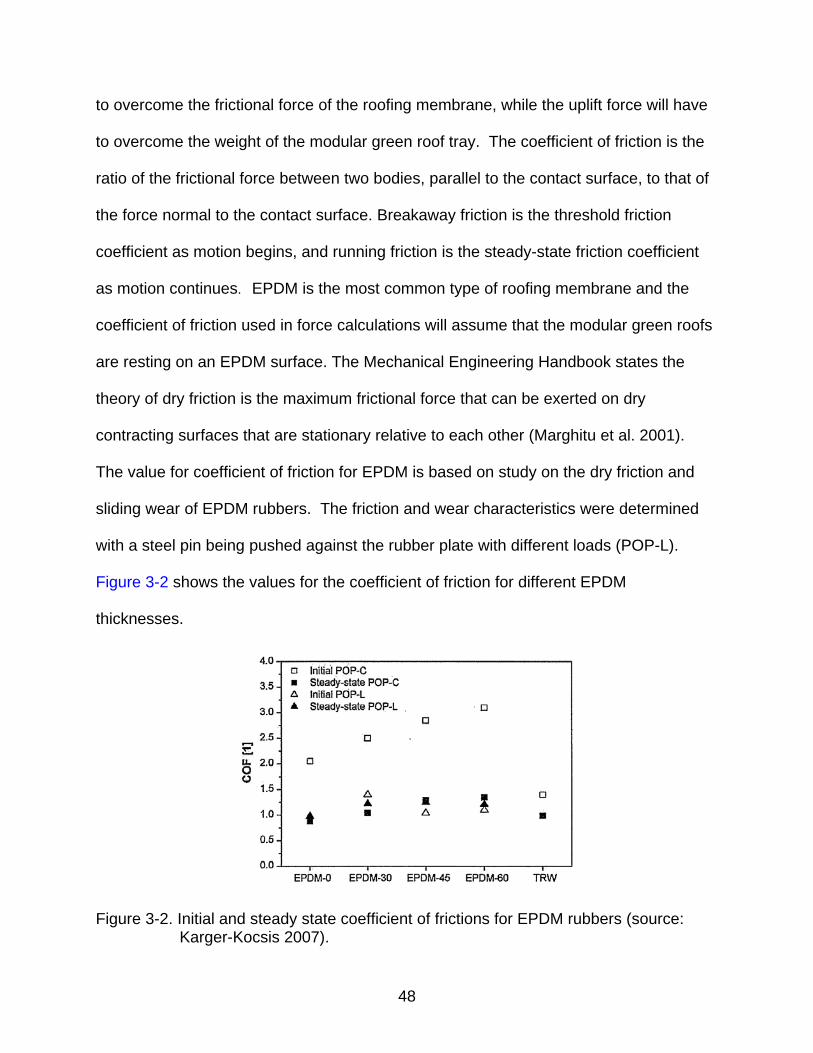
Figure 3-2 shows the values for the coefficient of friction for different EPDM
thicknesses.
Figure 3-2. Initial and steady state coefficient of frictions for EPDM rubbers (source: Karger-Kocsis 2007).
49
The coefficient value for the model will be 1.25 as that value would represent the
strongest coefficient of friction force for Initial POP-L. Steady-state POP-L values where
ignores as those values represent the coefficient of friction as the steel pin is being
dragged against the rubber which is not applicable to this research (Karger-Kocsis et al.
2007). This research assumes that the modular green roof trays will become airborne
once the lateral and uplift forces overpower become greater than the frictional force and
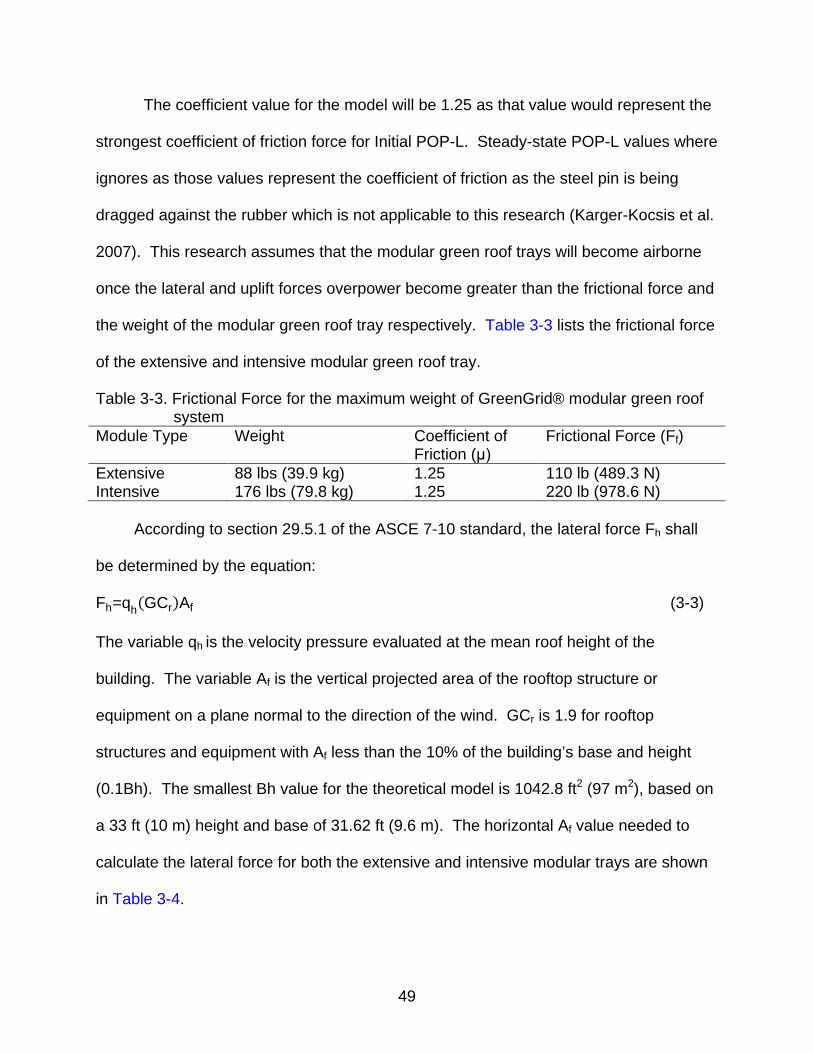
the weight of the modular green roof tray respectively. Table 3-3 lists the frictional force
of the extensive and intensive modular green roof tray.
Table 3-3. Frictional Force for the maximum weight of GreenGrid® modular green roof system
Module Type Weight Coefficient of Friction (μ)
Frictional Force (Ff)
Extensive 88 lbs (39.9 kg) 1.25 110 lb (489.3 N) Intensive 176 lbs (79.8 kg) 1.25 220 lb (978.6 N)
According to section 29.5.1 of the ASCE 7-10 standard, the lateral force Fh shall
be determined by the equation:
Fh=qh(GCr)Af (3-3)
The variable qh is the velocity pressure evaluated at the mean roof height of the
building. The variable Af is the vertical projected area of the rooftop structure or
equipment on a plane normal to the direction of the wind. GCr is 1.9 for rooftop
structures and equipment with Af less than the 10% of the building’s base and height
(0.1Bh). The smallest Bh value for the theoretical model is 1042.8 ft2 (97 m2), based on
a 33 ft (10 m) height and base of 31.62 ft (9.6 m). The horizontal Af value needed to
calculate the lateral force for both the extensive and intensive modular trays are shown
in Table 3-4.
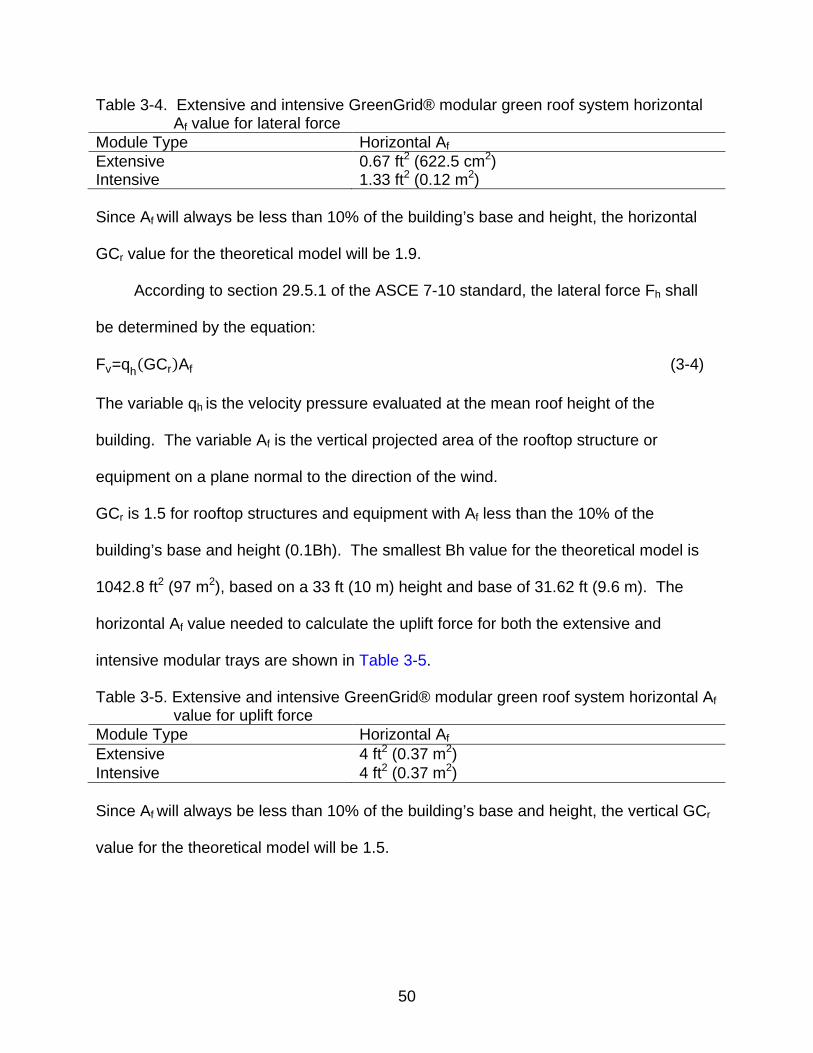
50
Table 3-4. Extensive and intensive GreenGrid® modular green roof system horizontal Af value for lateral force
Module Type Horizontal Af Extensive 0.67 ft2 (622.5 cm2) Intensive 1.33 ft2 (0.12 m2) Since Af will always be less than 10% of the building’s base and height, the horizontal
GCr value for the theoretical model will be 1.9.
According to section 29.5.1 of the ASCE 7-10 standard, the lateral force Fh shall
be determined by the equation:
Fv=qh(GCr)Af (3-4)
The variable qh is the velocity pressure evaluated at the mean roof height of the
building. The variable Af is the vertical projected area of the rooftop structure or
equipment on a plane normal to the direction of the wind.
GCr is 1.5 for rooftop structures and equipment with Af less than the 10% of the
building’s base and height (0.1Bh). The smallest Bh value for the theoretical model is
1042.8 ft2 (97 m2), based on a 33 ft (10 m) height and base of 31.62 ft (9.6 m). The
horizontal Af value needed to calculate the uplift force for both the extensive and
intensive modular trays are shown in Table 3-5.
Table 3-5. Extensive and intensive GreenGrid® modular green roof system horizontal Af value for uplift force
Module Type Horizontal Af Extensive 4 ft2 (0.37 m2) Intensive 4 ft2 (0.37 m2) Since Af will always be less than 10% of the building’s base and height, the vertical GCr
value for the theoretical model will be 1.5.

51
Root Structure and Growth Media
To determine the survivability of vegetation on green roofs under hurricane
conditions, a range of values for D, root diameter, and L, rod length, in the equation
Rmax = 4.5σDL2 will need to be evaluated for a tap root system. When determining Rmax
value for the shear strength of the soil, σ, the shear strength of the soil type when wet
should be used since hurricanes typically produce a lot rain. This Rmax value will then be
compared to the horizontal force, Fh, produced by the wind at that specific height. If Fh
is greater than Rmax, overturning will occur. Due to the infinite combination of L and D
for vegetation typical to a green roof, a realistic model for the survivability of the different
types of vegetation when subjected to hurricane force winds will be an enormous
undertaking and would take years of research. Conducting additional research will only
be applicable for intensive green roof modular systems as extensive green roof modular
systems are not designed to support the type of vegetation where this analysis is
needed.
Summary
The model in which the modular green roof system will be evaluated is based on a
790 ft (240.8 m) building with a footprint of 1500 ft2 (139.4 m2), a roof top area is 1000
ft2 (92.9 m2), and located in a urban setting in the State of Florida. The module being
evaluated is based on Weston Solution’s standard extensive and intensive GreenGrid®
modules. The max saturated weight for the modules will be 22 lb/ft2 for the intensive
and 44 lb/ft2. The modules will be resting on an EPDM roofing membrane which has a
coefficient of friction of 1.25 against a metal surface. The modules will be evaluated on
their ability to survive the different design wind speeds for the State of Florida which
range from 100 mph to 150 mph. The model assumes that the both the intensive and
52
extensive modular trays will overturn when the combination of both the horizontal and
vertical components of the wind force overcome the weight of the respective module
along with its frictional force that exist between the metal trays and the EPDM roof
membrane.
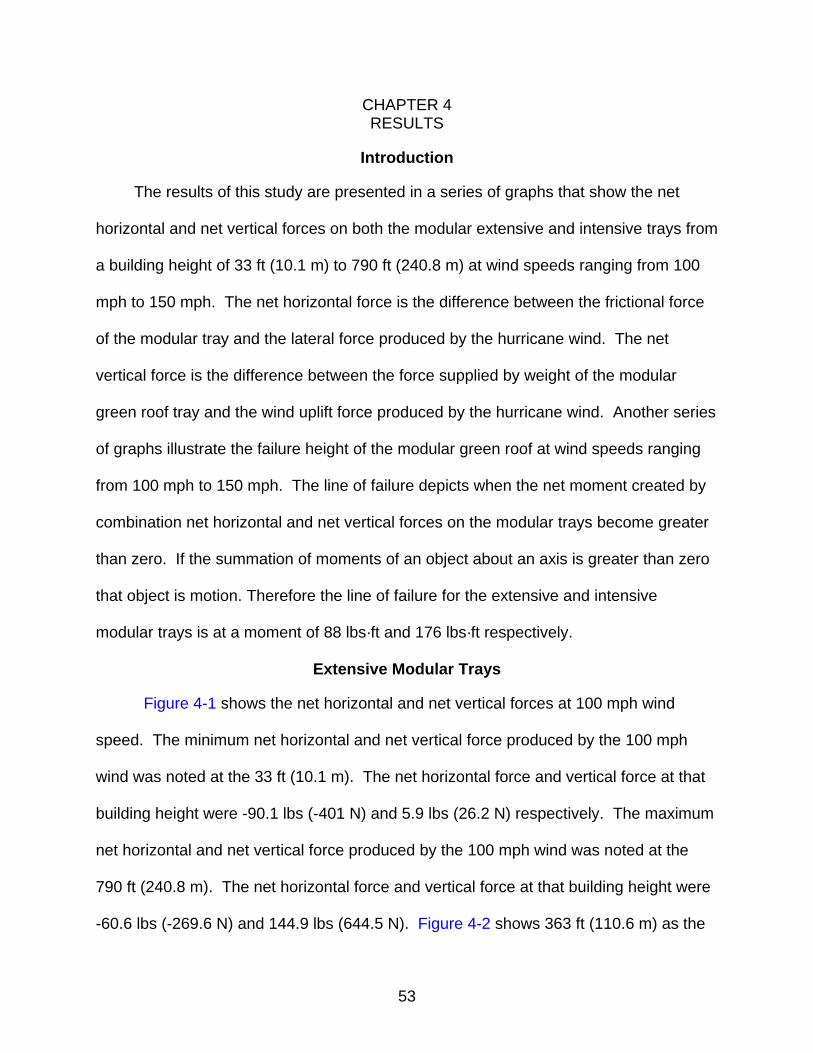
53
CHAPTER 4 RESULTS
Introduction
The results of this study are presented in a series of graphs that show the net
horizontal and net vertical forces on both the modular extensive and intensive trays from
a building height of 33 ft (10.1 m) to 790 ft (240.8 m) at wind speeds ranging from 100
mph to 150 mph. The net horizontal force is the difference between the frictional force
of the modular tray and the lateral force produced by the hurricane wind. The net
vertical force is the difference between the force supplied by weight of the modular
green roof tray and the wind uplift force produced by the hurricane wind. Another series
of graphs illustrate the failure height of the modular green roof at wind speeds ranging
from 100 mph to 150 mph. The line of failure depicts when the net moment created by
combination net horizontal and net vertical forces on the modular trays become greater
than zero. If the summation of moments of an object about an axis is greater than zero
that object is motion. Therefore the line of failure for the extensive and intensive
modular trays is at a moment of 88 lbs·ft and 176 lbs·ft respectively.
Extensive Modular Trays
Figure 4-1 shows the net horizontal and net vertical forces at 100 mph wind
speed. The minimum net horizontal and net vertical force produced by the 100 mph
wind was noted at the 33 ft (10.1 m). The net horizontal force and vertical force at that
building height were -90.1 lbs (-401 N) and 5.9 lbs (26.2 N) respectively. The maximum
net horizontal and net vertical force produced by the 100 mph wind was noted at the
790 ft (240.8 m). The net horizontal force and vertical force at that building height were
-60.6 lbs (-269.6 N) and 144.9 lbs (644.5 N). Figure 4-2 shows 363 ft (110.6 m) as the
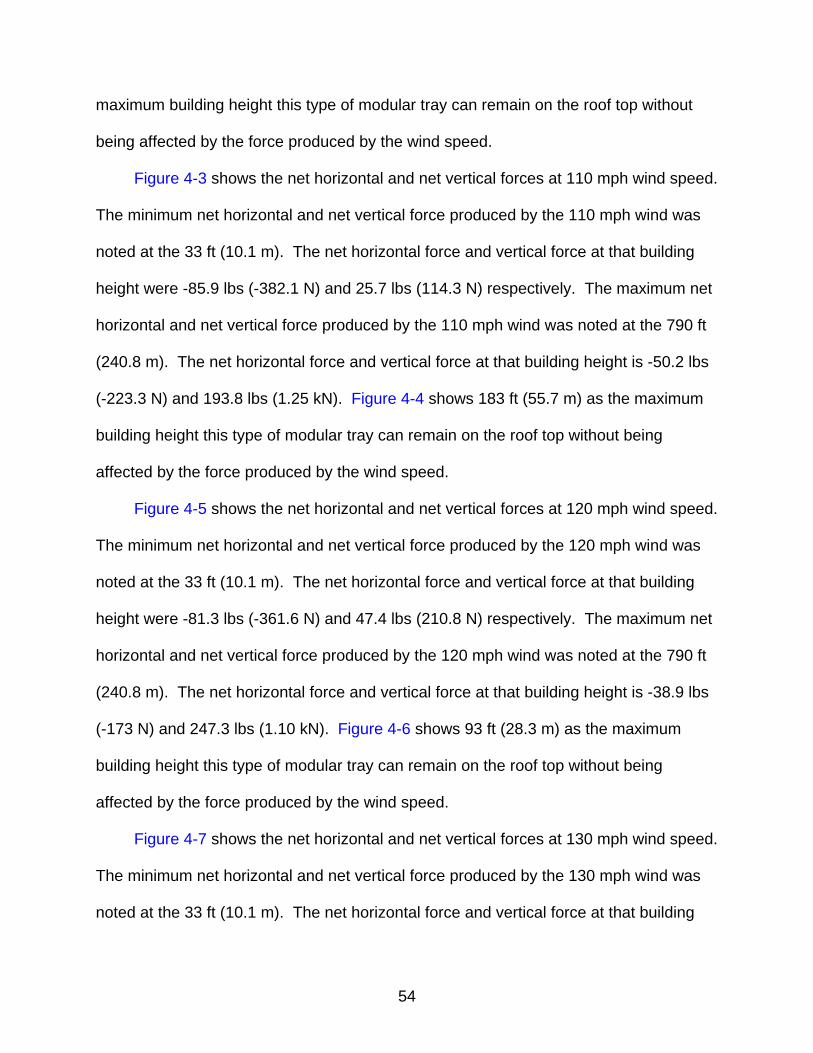
54
maximum building height this type of modular tray can remain on the roof top without
being affected by the force produced by the wind speed.
Figure 4-3 shows the net horizontal and net vertical forces at 110 mph wind speed.
The minimum net horizontal and net vertical force produced by the 110 mph wind was
noted at the 33 ft (10.1 m). The net horizontal force and vertical force at that building
height were -85.9 lbs (-382.1 N) and 25.7 lbs (114.3 N) respectively. The maximum net
horizontal and net vertical force produced by the 110 mph wind was noted at the 790 ft
(240.8 m). The net horizontal force and vertical force at that building height is -50.2 lbs
(-223.3 N) and 193.8 lbs (1.25 kN). Figure 4-4 shows 183 ft (55.7 m) as the maximum
building height this type of modular tray can remain on the roof top without being
affected by the force produced by the wind speed.
Figure 4-5 shows the net horizontal and net vertical forces at 120 mph wind speed.
The minimum net horizontal and net vertical force produced by the 120 mph wind was
noted at the 33 ft (10.1 m). The net horizontal force and vertical force at that building
height were -81.3 lbs (-361.6 N) and 47.4 lbs (210.8 N) respectively. The maximum net
horizontal and net vertical force produced by the 120 mph wind was noted at the 790 ft
(240.8 m). The net horizontal force and vertical force at that building height is -38.9 lbs
(-173 N) and 247.3 lbs (1.10 kN). Figure 4-6 shows 93 ft (28.3 m) as the maximum
building height this type of modular tray can remain on the roof top without being
affected by the force produced by the wind speed.
Figure 4-7 shows the net horizontal and net vertical forces at 130 mph wind speed.
The minimum net horizontal and net vertical force produced by the 130 mph wind was
noted at the 33 ft (10.1 m). The net horizontal force and vertical force at that building
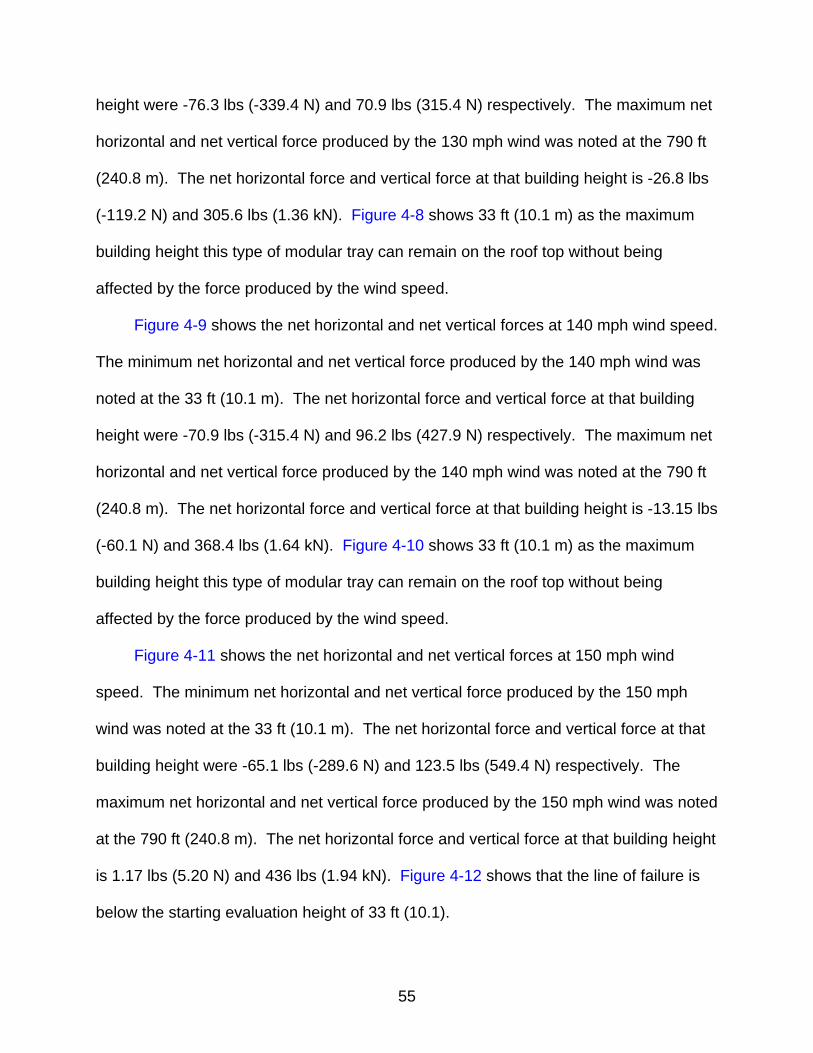
55
height were -76.3 lbs (-339.4 N) and 70.9 lbs (315.4 N) respectively. The maximum net
horizontal and net vertical force produced by the 130 mph wind was noted at the 790 ft
(240.8 m). The net horizontal force and vertical force at that building height is -26.8 lbs
(-119.2 N) and 305.6 lbs (1.36 kN). Figure 4-8 shows 33 ft (10.1 m) as the maximum
building height this type of modular tray can remain on the roof top without being
affected by the force produced by the wind speed.
Figure 4-9 shows the net horizontal and net vertical forces at 140 mph wind speed.
The minimum net horizontal and net vertical force produced by the 140 mph wind was
noted at the 33 ft (10.1 m). The net horizontal force and vertical force at that building
height were -70.9 lbs (-315.4 N) and 96.2 lbs (427.9 N) respectively. The maximum net
horizontal and net vertical force produced by the 140 mph wind was noted at the 790 ft
(240.8 m). The net horizontal force and vertical force at that building height is -13.15 lbs
(-60.1 N) and 368.4 lbs (1.64 kN). Figure 4-10 shows 33 ft (10.1 m) as the maximum
building height this type of modular tray can remain on the roof top without being
affected by the force produced by the wind speed.
Figure 4-11 shows the net horizontal and net vertical forces at 150 mph wind
speed. The minimum net horizontal and net vertical force produced by the 150 mph
wind was noted at the 33 ft (10.1 m). The net horizontal force and vertical force at that
building height were -65.1 lbs (-289.6 N) and 123.5 lbs (549.4 N) respectively. The
maximum net horizontal and net vertical force produced by the 150 mph wind was noted
at the 790 ft (240.8 m). The net horizontal force and vertical force at that building height
is 1.17 lbs (5.20 N) and 436 lbs (1.94 kN). Figure 4-12 shows that the line of failure is
below the starting evaluation height of 33 ft (10.1).
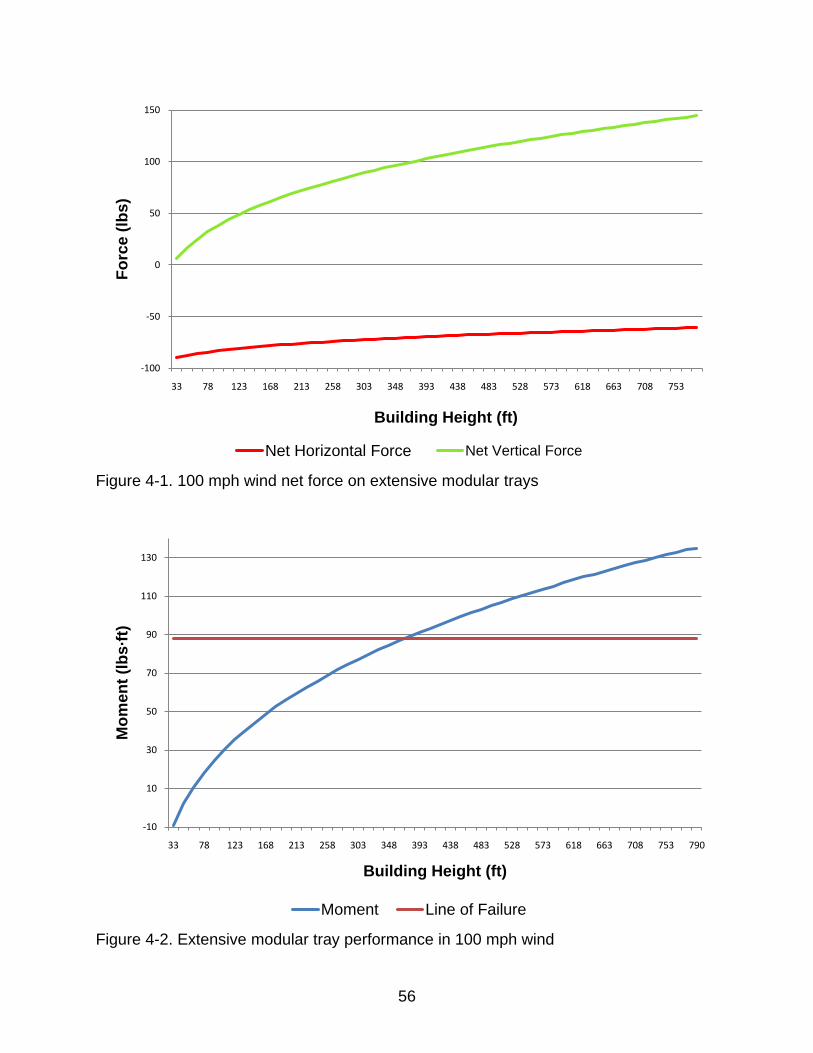
56
Figure 4-1. 100 mph wind net force on extensive modular trays
Figure 4-2. Extensive modular tray performance in 100 mph wind
-100
-50
0
50
100
150
33 78 123 168 213 258 303 348 393 438 483 528 573 618 663 708 753
Forc
e (lb
s)
Building Height (ft)
Net Horizontal Force Net Vertical Force
-10
10
30
50
70
90
110
130
33 78 123 168 213 258 303 348 393 438 483 528 573 618 663 708 753 790
Mom
ent (
lbs·
ft)
Building Height (ft)
Moment Line of Failure

57
Figure 4-3. 110 mph wind net force on extensive modular trays
Figure 4-4. Extensive modular tray performance in 110 mph wind
-100
-50
0
50
100
150
200
33 78 123 168 213 258 303 348 393 438 483 528 573 618 663 708 753 790
Forc
e (lb
s)
Building Height (ft)
Net Horizontal Force Net Vertical Force
0
20
40
60
80
100
120
140
160
180
200
33 78 123 168 213 258 303 348 393 438 483 528 573 618 663 708 753 790
Mom
ent (
lb·ft
)
Building Height (ft)
Moment Line of Failure
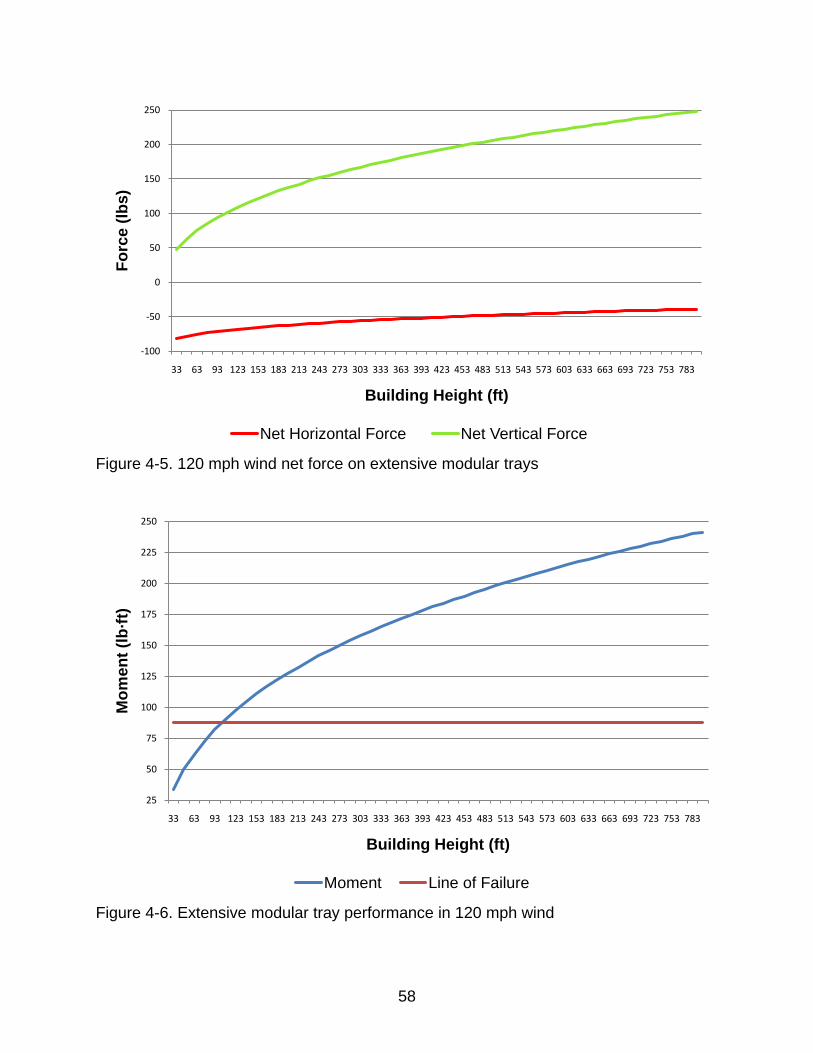
58
Figure 4-5. 120 mph wind net force on extensive modular trays
Figure 4-6. Extensive modular tray performance in 120 mph wind
-100
-50
0
50
100
150
200
250
33 63 93 123 153 183 213 243 273 303 333 363 393 423 453 483 513 543 573 603 633 663 693 723 753 783
Forc
e (lb
s)
Building Height (ft)
Net Horizontal Force Net Vertical Force
25
50
75
100
125
150
175
200
225
250
33 63 93 123 153 183 213 243 273 303 333 363 393 423 453 483 513 543 573 603 633 663 693 723 753 783
Mom
ent (
lb·ft
)
Building Height (ft)
Moment Line of Failure

59
Figure 4-7. 130 mph wind net force on extensive modular trays
Figure 4-8. Extensive modular tray performance in 130 mph wind
-100
-50
0
50
100
150
200
250
300
350
33 78 123 168 213 258 303 348 393 438 483 528 573 618 663 708 753 790
Forc
e (lb
s)
Building Height (ft)
Net Horizontal Force Net Vertical Force
50
100
150
200
250
300
350
33 63 93 123 153 183 213 243 273 303 333 363 393 423 453 483 513 543 573 603 633 663 693 723 753 783
Mom
ent (
lb·ft
)
Building Height (ft)
Moment Line of Failure
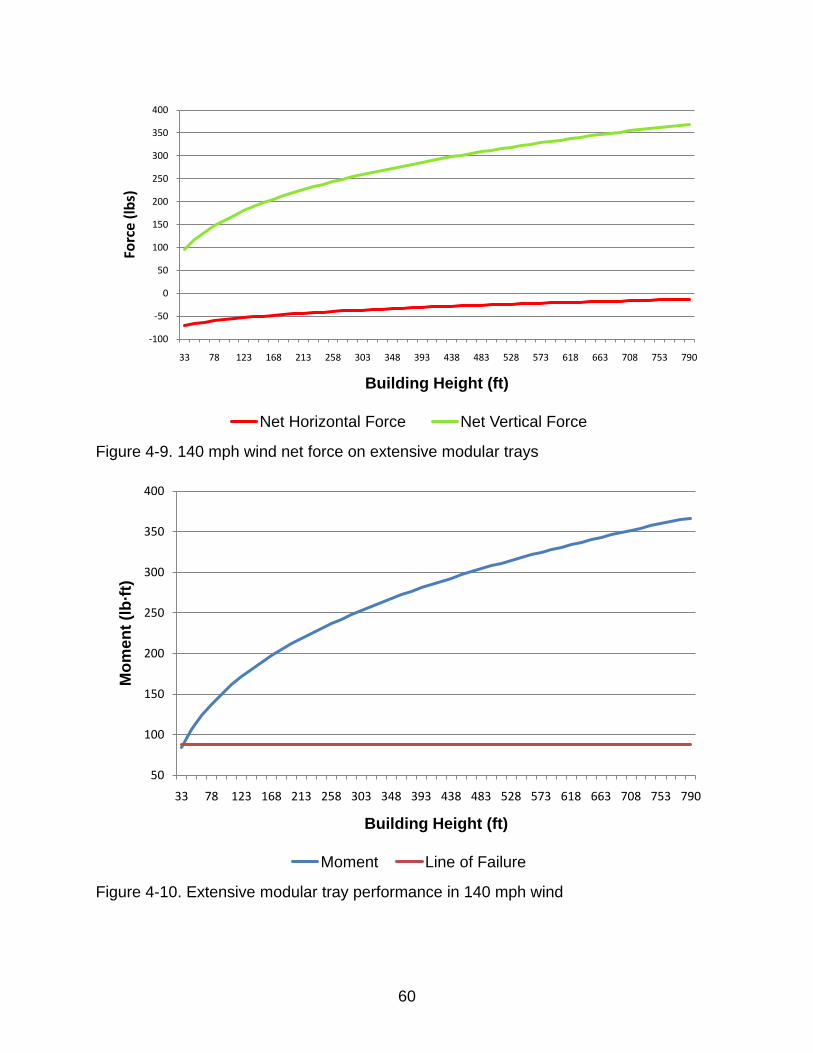
60
Figure 4-9. 140 mph wind net force on extensive modular trays
Figure 4-10. Extensive modular tray performance in 140 mph wind
-100
-50
0
50
100
150
200
250
300
350
400
33 78 123 168 213 258 303 348 393 438 483 528 573 618 663 708 753 790
Forc
e (lb
s)
Building Height (ft)
Net Horizontal Force Net Vertical Force
50
100
150
200
250
300
350
400
33 78 123 168 213 258 303 348 393 438 483 528 573 618 663 708 753 790
Mom
ent (
lb·ft
)
Building Height (ft)
Moment Line of Failure
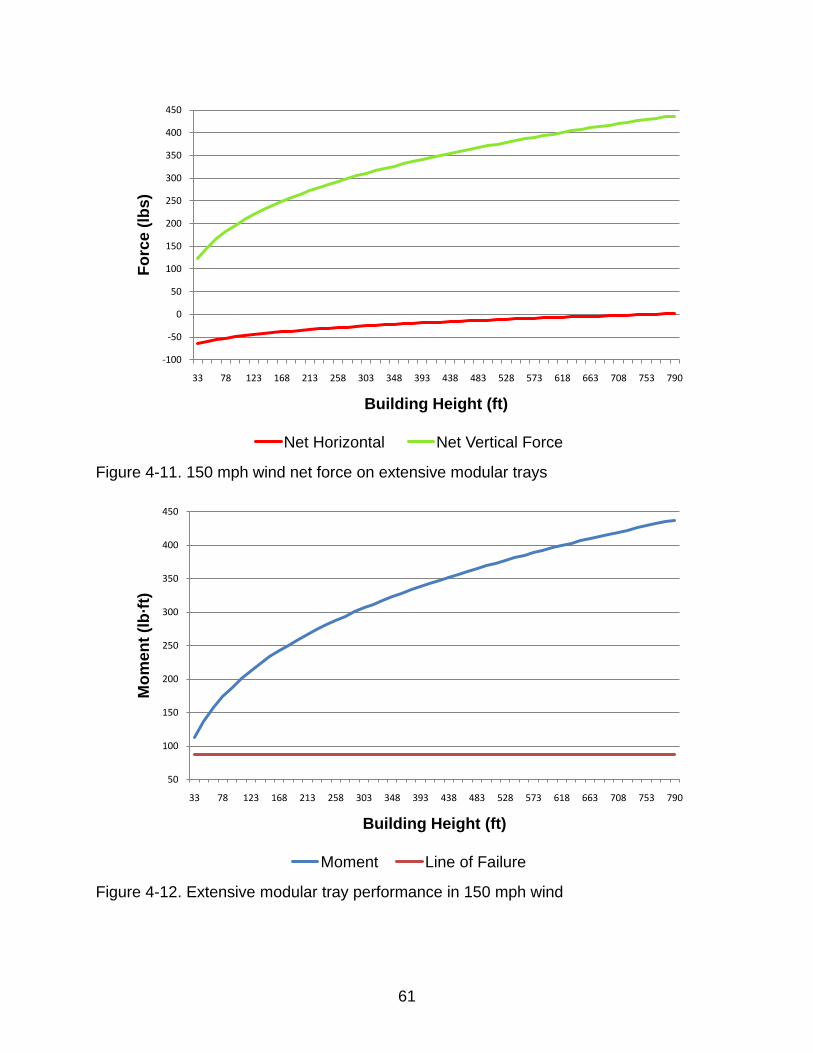
61
Figure 4-11. 150 mph wind net force on extensive modular trays
Figure 4-12. Extensive modular tray performance in 150 mph wind
-100
-50
0
50
100
150
200
250
300
350
400
450
33 78 123 168 213 258 303 348 393 438 483 528 573 618 663 708 753 790
Forc
e (lb
s)
Building Height (ft)
Net Horizontal Net Vertical Force
50
100
150
200
250
300
350
400
450
33 78 123 168 213 258 303 348 393 438 483 528 573 618 663 708 753 790
Mom
ent (
lb·ft
)
Building Height (ft)
Moment Line of Failure

62
Intensive Modular Trays
Figure 4-13 shows the net horizontal and net vertical forces at 100 mph wind
speed. The minimum net horizontal and net vertical force produced by the 100 mph
wind was noted at the 33 ft (10.1 m). The net horizontal force and vertical force at that
building height were -180.4 lbs (-802.5 N) and -82 lbs (-364.8 N) respectively. The
maximum net horizontal and net vertical force produced by the 100 mph wind was noted
at the 790 ft (240.8 m). The net horizontal force and vertical force at that building height
were -121.9 lbs (-542.2 N) and 56.9 lbs (253.1 N). Figure 4-14 shows the intensive
modular trays do not fail for any given building height.
Figure 4-15 shows the net horizontal and net vertical forces at 110 mph wind
speed. The minimum net horizontal and net vertical force produced by the 110 mph
wind was noted at the 33 ft (10.1 m). The net horizontal force and vertical force at that
building height were -172.1 lbs (-765.5 N) and -62.3 lbs (-277.1 N) respectively. The
maximum net horizontal and net vertical force produced by the 110 mph wind was noted
at the 790 ft (240.8 m). The net horizontal force and vertical force at that building height
were -101.3 lbs (-450.6 N) and 105.8 lbs (470.6 N). Figure 4-16 shows the intensive
modular trays do not fail for any given building height.
Figure 4-17 shows the net horizontal and net vertical forces at 120 mph wind
speed. The minimum net horizontal and net vertical force produced by the 120 mph
wind was noted at the 33 ft (10.1 m). The net horizontal force and vertical force at that
building height were -163 lbs (-725.1 N) and -40.6 lbs (-180.6 N) respectively. The
maximum net horizontal and net vertical force produced by the 120 mph wind was noted
at the 790 ft (240.8 m). The net horizontal force and vertical force at that building height
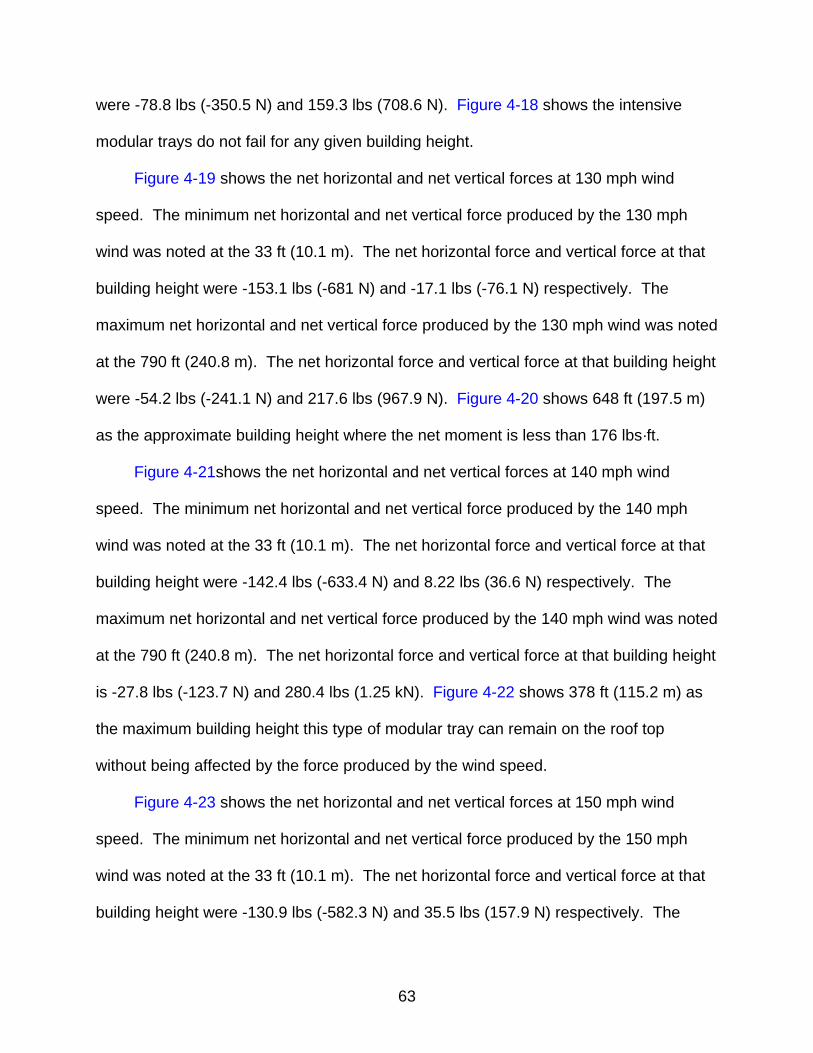
63
were -78.8 lbs (-350.5 N) and 159.3 lbs (708.6 N). Figure 4-18 shows the intensive
modular trays do not fail for any given building height.
Figure 4-19 shows the net horizontal and net vertical forces at 130 mph wind
speed. The minimum net horizontal and net vertical force produced by the 130 mph
wind was noted at the 33 ft (10.1 m). The net horizontal force and vertical force at that
building height were -153.1 lbs (-681 N) and -17.1 lbs (-76.1 N) respectively. The
maximum net horizontal and net vertical force produced by the 130 mph wind was noted
at the 790 ft (240.8 m). The net horizontal force and vertical force at that building height
were -54.2 lbs (-241.1 N) and 217.6 lbs (967.9 N). Figure 4-20 shows 648 ft (197.5 m)
as the approximate building height where the net moment is less than 176 lbs·ft.
Figure 4-21shows the net horizontal and net vertical forces at 140 mph wind
speed. The minimum net horizontal and net vertical force produced by the 140 mph
wind was noted at the 33 ft (10.1 m). The net horizontal force and vertical force at that
building height were -142.4 lbs (-633.4 N) and 8.22 lbs (36.6 N) respectively. The
maximum net horizontal and net vertical force produced by the 140 mph wind was noted
at the 790 ft (240.8 m). The net horizontal force and vertical force at that building height
is -27.8 lbs (-123.7 N) and 280.4 lbs (1.25 kN). Figure 4-22 shows 378 ft (115.2 m) as
the maximum building height this type of modular tray can remain on the roof top
without being affected by the force produced by the wind speed.
Figure 4-23 shows the net horizontal and net vertical forces at 150 mph wind
speed. The minimum net horizontal and net vertical force produced by the 150 mph
wind was noted at the 33 ft (10.1 m). The net horizontal force and vertical force at that
building height were -130.9 lbs (-582.3 N) and 35.5 lbs (157.9 N) respectively. The
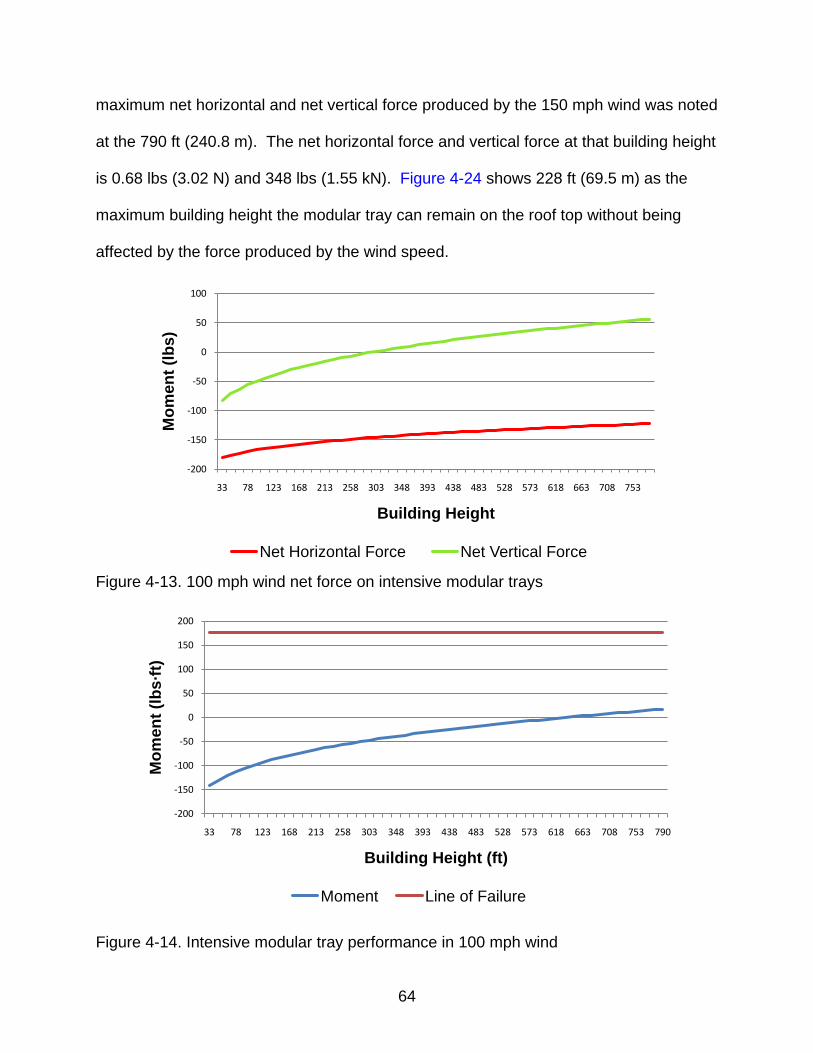
64
maximum net horizontal and net vertical force produced by the 150 mph wind was noted
at the 790 ft (240.8 m). The net horizontal force and vertical force at that building height
is 0.68 lbs (3.02 N) and 348 lbs (1.55 kN). Figure 4-24 shows 228 ft (69.5 m) as the
maximum building height the modular tray can remain on the roof top without being
affected by the force produced by the wind speed.
Figure 4-13. 100 mph wind net force on intensive modular trays
Figure 4-14. Intensive modular tray performance in 100 mph wind
-200
-150
-100
-50
0
50
100
33 78 123 168 213 258 303 348 393 438 483 528 573 618 663 708 753
Mom
ent (
lbs)
Building Height
Net Horizontal Force Net Vertical Force
-200
-150
-100
-50
0
50
100
150
200
33 78 123 168 213 258 303 348 393 438 483 528 573 618 663 708 753 790
Mom
ent (
lbs·
ft)
Building Height (ft)
Moment Line of Failure
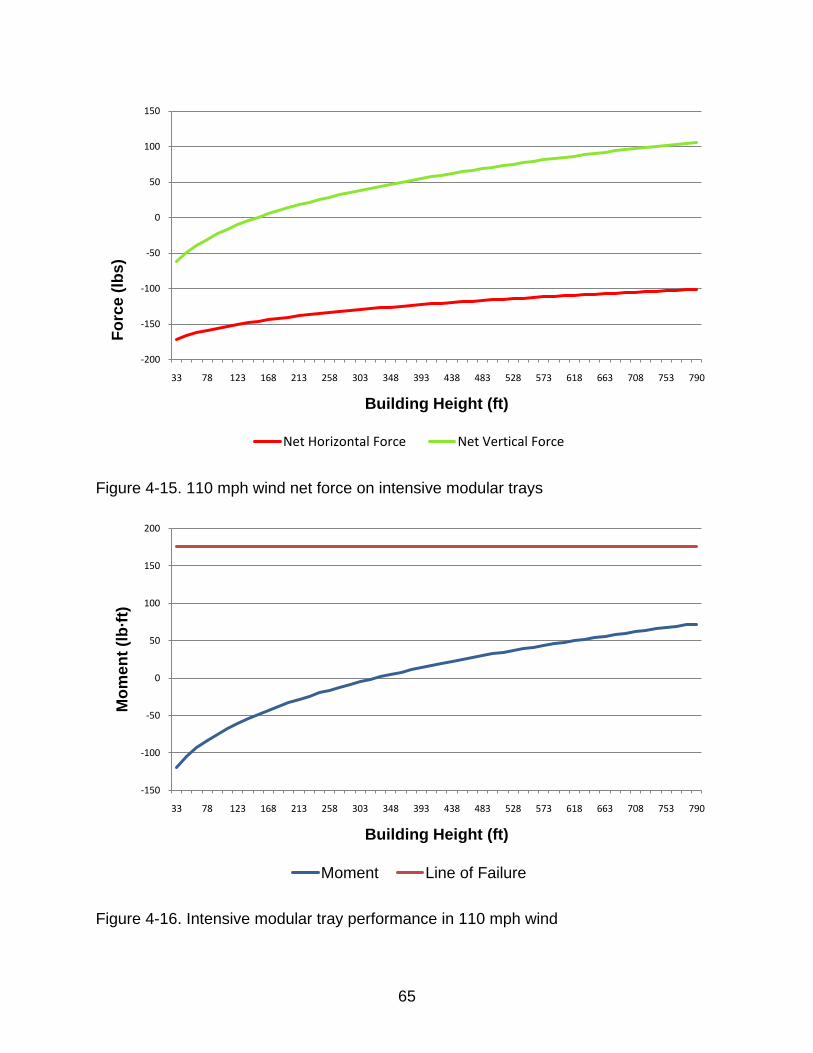
65
Figure 4-15. 110 mph wind net force on intensive modular trays
Figure 4-16. Intensive modular tray performance in 110 mph wind
-200
-150
-100
-50
0
50
100
150
33 78 123 168 213 258 303 348 393 438 483 528 573 618 663 708 753 790
Forc
e (lb
s)
Building Height (ft)
Net Horizontal Force Net Vertical Force
-150
-100
-50
0
50
100
150
200
33 78 123 168 213 258 303 348 393 438 483 528 573 618 663 708 753 790
Mom
ent (
lb·ft
)
Building Height (ft)
Moment Line of Failure

66
Figure 4-17. 120 mph wind net force on intensive modular trays
Figure 4-18. Intensive modular tray performance in 120 mph wind
-200
-150
-100
-50
0
50
100
150
200
33 78 123 168 213 258 303 348 393 438 483 528 573 618 663 708 753 790
Forc
e (lb
s)
Building Height (ft)
Net Horizontal Force Net Vertical Force
-100
-50
0
50
100
150
200
33 78 123 168 213 258 303 348 393 438 483 528 573 618 663 708 753 790
Mom
ent (
lb·ft
)
Building Height (ft)
Moment Line of Failure
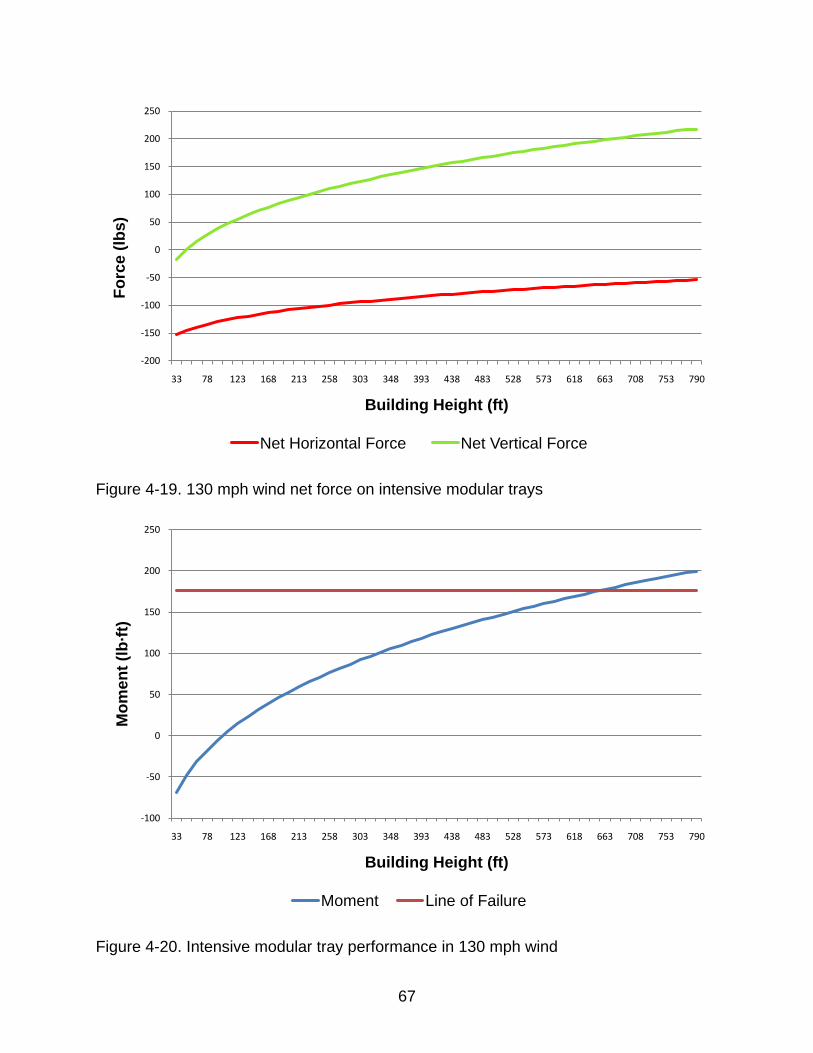
67
Figure 4-19. 130 mph wind net force on intensive modular trays
Figure 4-20. Intensive modular tray performance in 130 mph wind
-200
-150
-100
-50
0
50
100
150
200
250
33 78 123 168 213 258 303 348 393 438 483 528 573 618 663 708 753 790
Forc
e (lb
s)
Building Height (ft)
Net Horizontal Force Net Vertical Force
-100
-50
0
50
100
150
200
250
33 78 123 168 213 258 303 348 393 438 483 528 573 618 663 708 753 790
Mom
ent (
lb·ft
)
Building Height (ft)
Moment Line of Failure
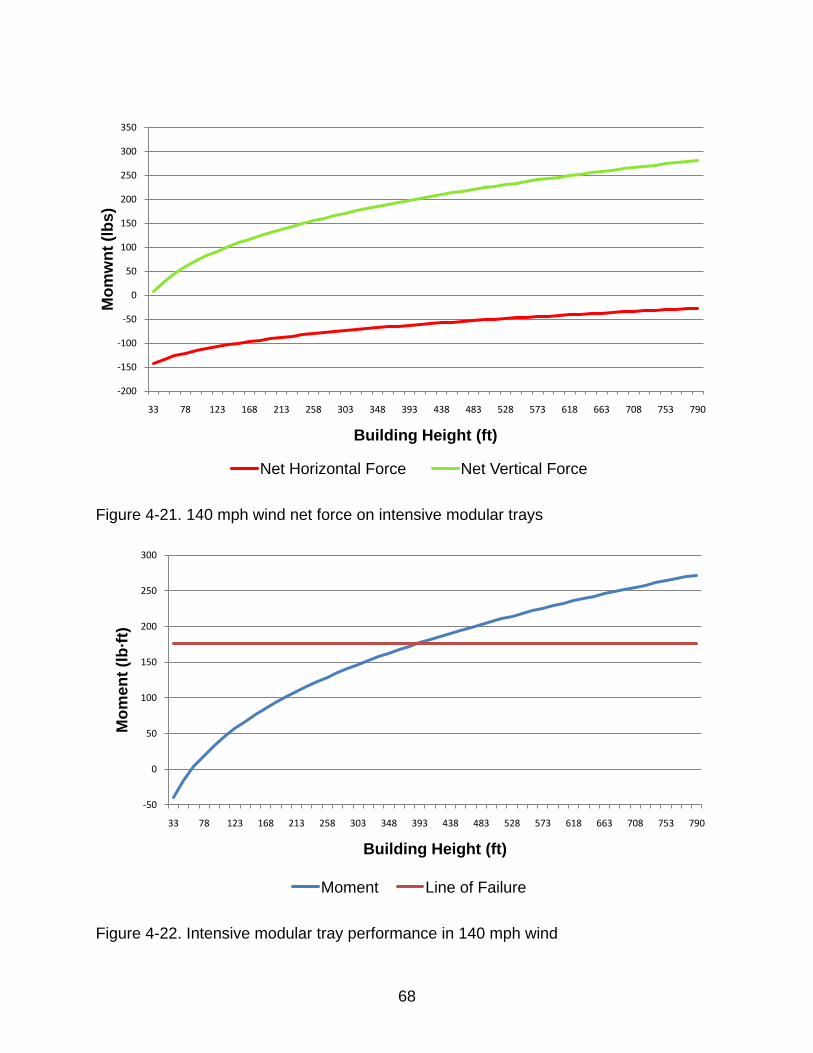
68
Figure 4-21. 140 mph wind net force on intensive modular trays
Figure 4-22. Intensive modular tray performance in 140 mph wind
-200
-150
-100
-50
0
50
100
150
200
250
300
350
33 78 123 168 213 258 303 348 393 438 483 528 573 618 663 708 753 790
Mom
wnt
(lbs
)
Building Height (ft)
Net Horizontal Force Net Vertical Force
-50
0
50
100
150
200
250
300
33 78 123 168 213 258 303 348 393 438 483 528 573 618 663 708 753 790
Mom
ent (
lb·ft
)
Building Height (ft)
Moment Line of Failure
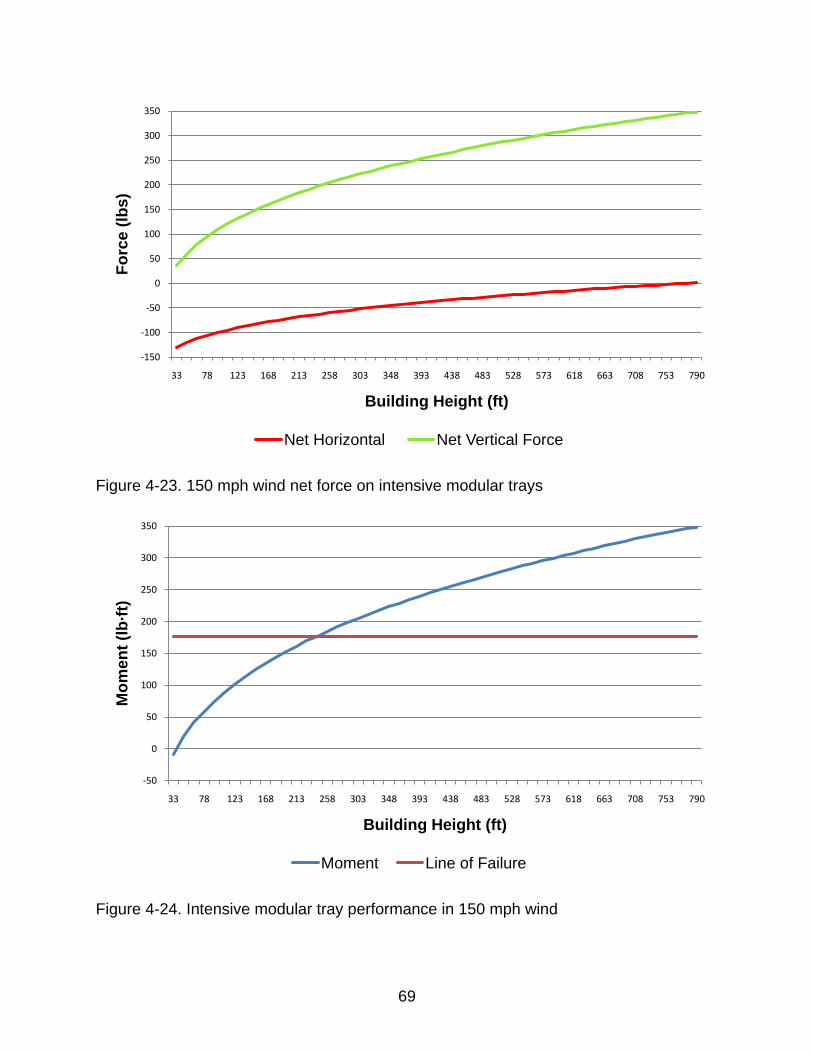
69
Figure 4-23. 150 mph wind net force on intensive modular trays
Figure 4-24. Intensive modular tray performance in 150 mph wind
-150
-100
-50
0
50
100
150
200
250
300
350
33 78 123 168 213 258 303 348 393 438 483 528 573 618 663 708 753 790
Forc
e (lb
s)
Building Height (ft)
Net Horizontal Net Vertical Force
-50
0
50
100
150
200
250
300
350
33 78 123 168 213 258 303 348 393 438 483 528 573 618 663 708 753 790
Mom
ent (
lb·ft
)
Building Height (ft)
Moment Line of Failure

70
CHAPTER 5 ANALYSIS OF RESULTS
Summary of Findings
Based on this analysis, an extensive modular green roof system on the
theoretical model building can survive up to a Category 4 hurricane at 140 mph at an
approximate building height of 33 ft and an intensive modular green roof system can
survive a Category 5 hurricane at a 150 mph at an approximate building height of 228
feet. The study only determines when the modular trays will lose contact with the roof
and not necessarily when the modular will become completely airborne. This study
assumes that none of the vegetation was displaced, thus the maximum weight of the
modular green roof system was maintained throughout the duration of the hurricane. In
both the extensive and intensive modules, the contributing factor to the overturning of
the trays was the vertical force. The net horizontal forces for all building heights and at
all ranges of wind speeds were mostly negative. The uplift forces in the vertical are
extremely great and overcame the horizontal component eliminating any contact with
the EPDM roofing membrane. The values obtained for the net vertical force are of
primary concern when evaluating this data or pursuing similar research.
Table 5-1 summarizes the failure building height for both the extensive and
intensive modular trays at different wind speeds.
Table 5-1. Actual maximum height for extensive on intensive green roof models for theoretical building
Wind Speed (mph) Modular Tray Maximum Height (ft) Extensive Intensive
100 363 790 110 183 790 120 93 790 130 48 648 140 33 378 150 N/A 228
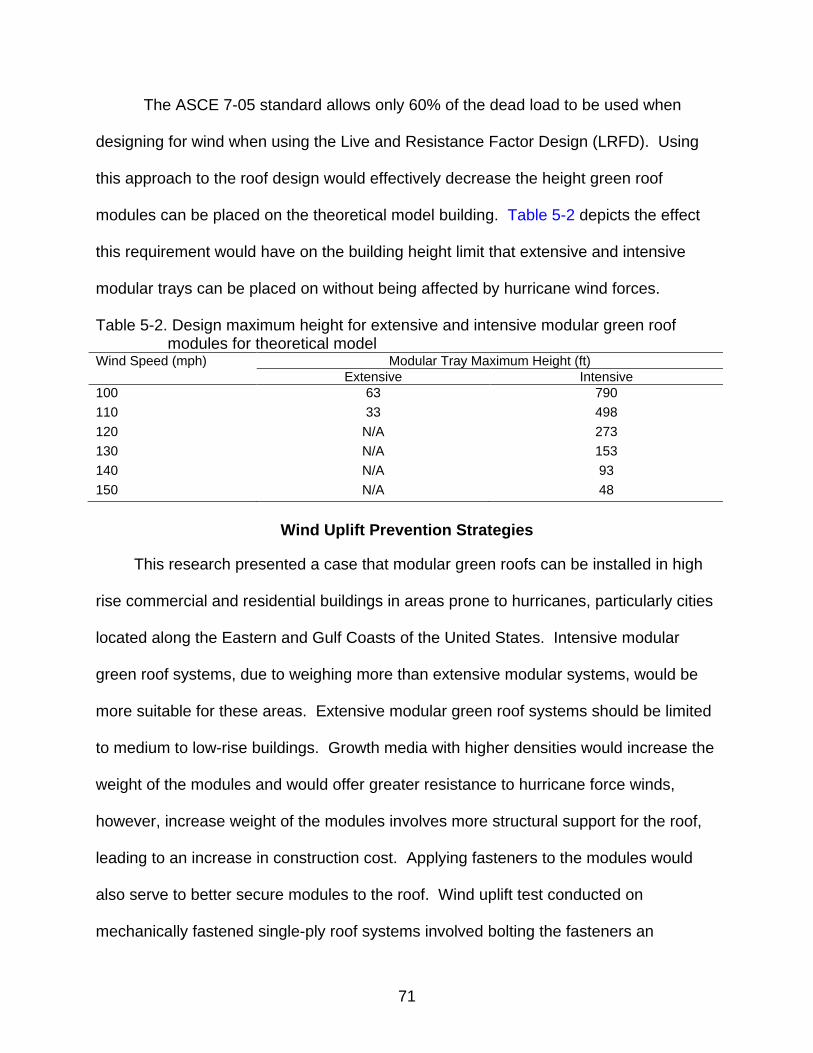
71
The ASCE 7-05 standard allows only 60% of the dead load to be used when
designing for wind when using the Live and Resistance Factor Design (LRFD). Using
this approach to the roof design would effectively decrease the height green roof
modules can be placed on the theoretical model building. Table 5-2 depicts the effect
this requirement would have on the building height limit that extensive and intensive
modular trays can be placed on without being affected by hurricane wind forces.
Table 5-2. Design maximum height for extensive and intensive modular green roof modules for theoretical model
Wind Speed (mph) Modular Tray Maximum Height (ft) Extensive Intensive
100 63 790 110 33 498 120 N/A 273 130 N/A 153 140 N/A 93 150 N/A 48
Wind Uplift Prevention Strategies
This research presented a case that modular green roofs can be installed in high
rise commercial and residential buildings in areas prone to hurricanes, particularly cities
located along the Eastern and Gulf Coasts of the United States. Intensive modular
green roof systems, due to weighing more than extensive modular systems, would be
more suitable for these areas. Extensive modular green roof systems should be limited
to medium to low-rise buildings. Growth media with higher densities would increase the
weight of the modules and would offer greater resistance to hurricane force winds,
however, increase weight of the modules involves more structural support for the roof,
leading to an increase in construction cost. Applying fasteners to the modules would
also serve to better secure modules to the roof. Wind uplift test conducted on
mechanically fastened single-ply roof systems involved bolting the fasteners an
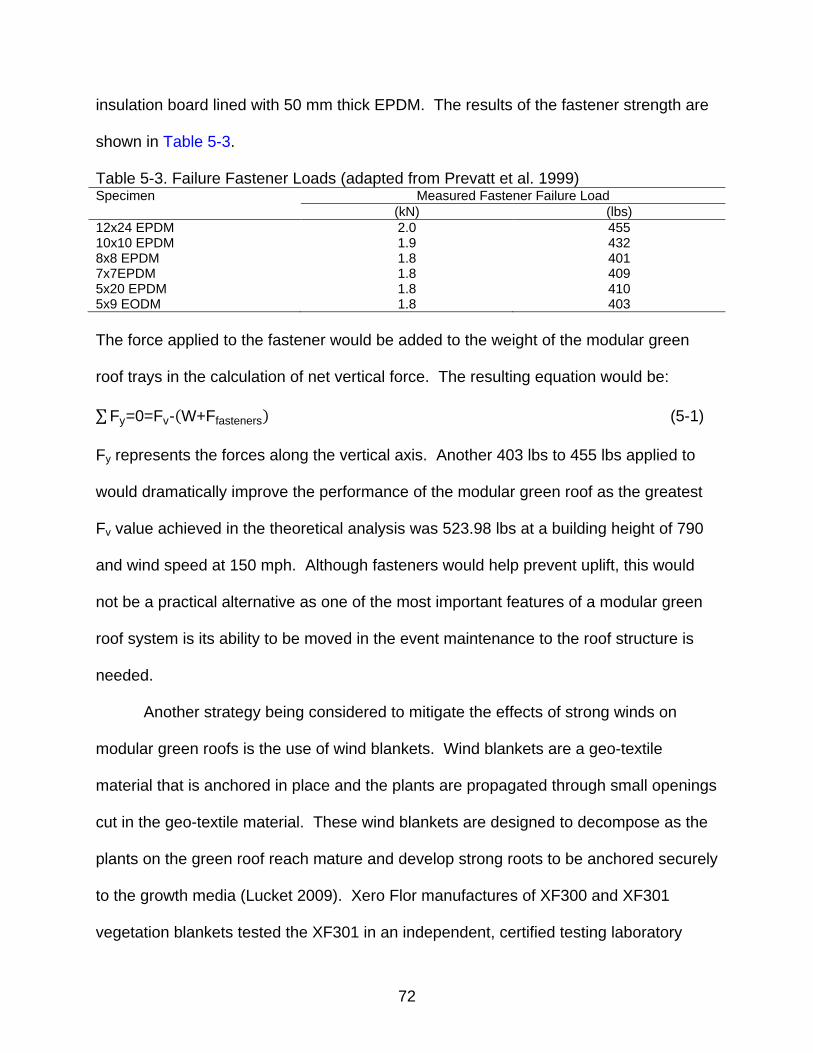
72
insulation board lined with 50 mm thick EPDM. The results of the fastener strength are
shown in Table 5-3.
Table 5-3. Failure Fastener Loads (adapted from Prevatt et al. 1999) Specimen Measured Fastener Failure Load
(kN) (lbs) 12x24 EPDM 2.0 455 10x10 EPDM 1.9 432 8x8 EPDM 1.8 401 7x7EPDM 1.8 409 5x20 EPDM 1.8 410 5x9 EODM 1.8 403 The force applied to the fastener would be added to the weight of the modular green
roof trays in the calculation of net vertical force. The resulting equation would be:
∑Fy=0=Fv-(W+Ffasteners) (5-1)
Fy represents the forces along the vertical axis. Another 403 lbs to 455 lbs applied to
would dramatically improve the performance of the modular green roof as the greatest
Fv value achieved in the theoretical analysis was 523.98 lbs at a building height of 790
and wind speed at 150 mph. Although fasteners would help prevent uplift, this would
not be a practical alternative as one of the most important features of a modular green
roof system is its ability to be moved in the event maintenance to the roof structure is
needed.
Another strategy being considered to mitigate the effects of strong winds on
modular green roofs is the use of wind blankets. Wind blankets are a geo-textile
material that is anchored in place and the plants are propagated through small openings
cut in the geo-textile material. These wind blankets are designed to decompose as the
plants on the green roof reach mature and develop strong roots to be anchored securely
to the growth media (Lucket 2009). Xero Flor manufactures of XF300 and XF301
vegetation blankets tested the XF301 in an independent, certified testing laboratory
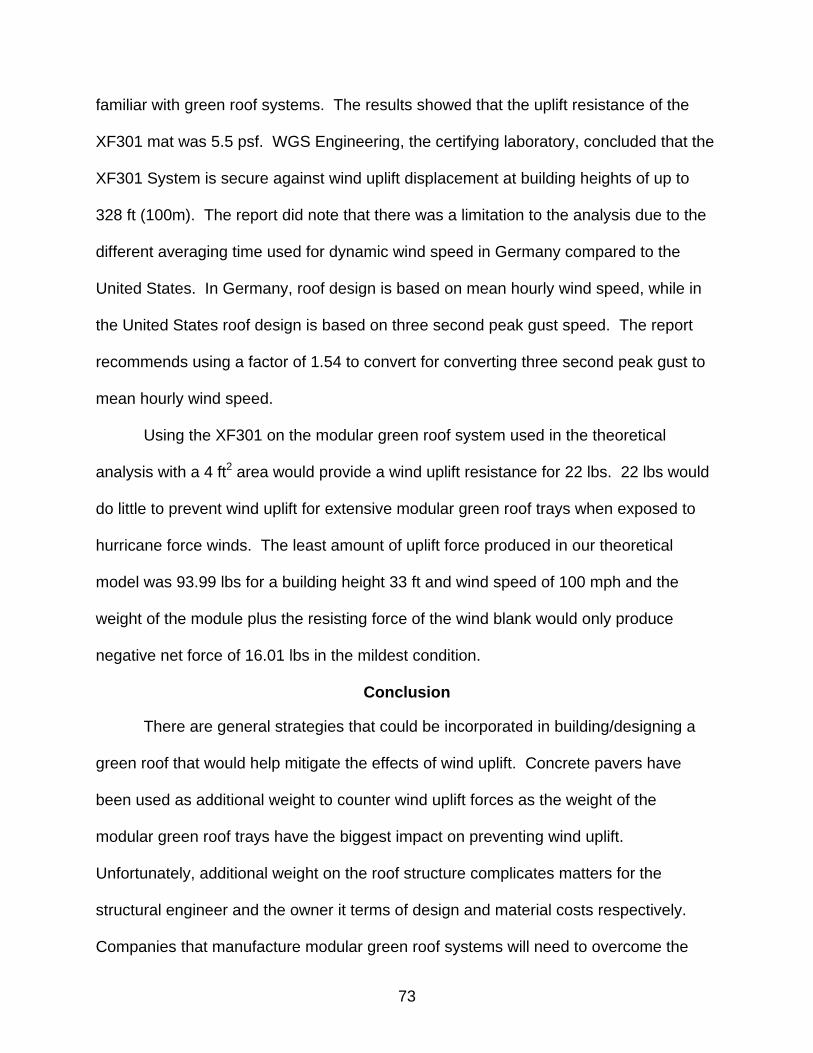
73
familiar with green roof systems. The results showed that the uplift resistance of the
XF301 mat was 5.5 psf. WGS Engineering, the certifying laboratory, concluded that the
XF301 System is secure against wind uplift displacement at building heights of up to
328 ft (100m). The report did note that there was a limitation to the analysis due to the
different averaging time used for dynamic wind speed in Germany compared to the
United States. In Germany, roof design is based on mean hourly wind speed, while in
the United States roof design is based on three second peak gust speed. The report
recommends using a factor of 1.54 to convert for converting three second peak gust to
mean hourly wind speed.
Using the XF301 on the modular green roof system used in the theoretical
analysis with a 4 ft2 area would provide a wind uplift resistance for 22 lbs. 22 lbs would
do little to prevent wind uplift for extensive modular green roof trays when exposed to
hurricane force winds. The least amount of uplift force produced in our theoretical
model was 93.99 lbs for a building height 33 ft and wind speed of 100 mph and the
weight of the module plus the resisting force of the wind blank would only produce
negative net force of 16.01 lbs in the mildest condition.
Conclusion
There are general strategies that could be incorporated in building/designing a
green roof that would help mitigate the effects of wind uplift. Concrete pavers have
been used as additional weight to counter wind uplift forces as the weight of the
modular green roof trays have the biggest impact on preventing wind uplift.
Unfortunately, additional weight on the roof structure complicates matters for the
structural engineer and the owner it terms of design and material costs respectively.
Companies that manufacture modular green roof systems will need to overcome the
74
problem wind uplift poses on their product if it is going to be a staple in the Eastern and
Gulf coast areas that annually braces for hurricane force winds during the months of
June and November.
Recommendations for Future Study
This study presents a very rudimentary approach to evaluating the viability of
modular green roof systems when exposed to hurricane conditions. In order to fully
evaluate how hurricane force winds effect modular green roof systems more research is
needed. This study proposes a worst case scenario for modular trays being on a roof
top but is not very realistic. It does however provide a baseline for how modular green
roofs will perform under the most adverse of conditions. A model green roof capable of
supporting both intensive and extensive trays subjected to wind speeds typical of a
Category 2 and higher could be better evaluated how well they perform when exposed
to hurricane conditions. The University of Florida’s Civil and Coastal Engineering
Department has hurricane simulator that simulates both wind speeds and rain typical of
a hurricane. Subjecting a modular green roof system to this machine would provide
very realistic conditions. The test could include how a parapet wall could not only help
prevent wind uplift but can also serve as a mechanism to catch the modular trays if they
do become airborne. The ability of a parapet wall to prevent the modular green roofs
from being blown off a roof top prevents damage to surrounding structures in addition to
being able to salvage the modular green roof trays.
Another research opportunity to better establish the effect of hurricane force winds
on modular green roof systems would be to determine what plant type and growth
media combination is best suited to withstand hurricane conditions. As discussed in this
research, the type of root structure a plant possess, the size of the plant, and the growth
75
media the plant is in has a direct effect on the plants ability to prevent overturning. The
results of such a research could establish better design criteria for modular green roof
systems being installed in hurricane prone regions.

76
LIST OF REFERENCES
Allaby, Michael. A Dictionary of Ecology 2004 ASTM Committee D 18 on Soil and Rock, International Symposium on Laboratory and Bell, F. G. Engineering Properties of Soils and Rocks 1992 Coppin, N. J., Richards, I. G. Use of Vegetation in Civil Engineering 1990 Eshel, Amram, Kafkafi, U., NetLibrary, Inc and Waisel, Yoav. Plant roots: The Hidden
Half 2002 Florida Building Commission, International Code Council. Florida Building Code 2007
2007- Gregory, P. J. Plant Roots : Growth, Activity, and Interaction with Soils 2006 Houghton, E. L., Carruthers, N. B. Wind forces on Buildings and Structures: An
Introduction 1976 Karger-Kocsis, J., Mousa, A., Major, Z. and Békési, N. Dry friction and Sliding Wear of
EPDM Rubbers Against Steel as a Function of Carbon Black Content 2008 Kibert, Charles J. Sustainable Construction 2008 Liu, Henry. Wind Engineering : A Handbook for Structural Engineers 1990 Luckett, Kelly. Green Roof Construction and Maintenance 2009
Luckett, Kelly. Green Roof Wind Uplift Challenges: Paranoia, Turn a Blind Eye, or How About We Work Together? 2009
Marghitu, Dan B., ScienceDirect. Mechanical Engineer's Handbook [electronic resource]
2001 McAdie, Colin J., Landsea, Christopher W., Neumann, Charles J., David, John., Blake,
Eric S. and Hammer, Gregory S. Tropical Cyclones of the North Atlantic Ocean, 1871-2006 2009
Michigan State University, Department of Horticulture. Green Roof Research Program 2006
Naval Civil Engineering Laboratory. Single-Ply Roofing System 1987
77
Prevatt, D. O., Schiff, S. D. and Malpezzi, J. A. Investigating of Chamber Size for Uplifting Performance Testing of Single-Ply Roof Systems 1999
Retzlaff, Bill. Wind Uplift Testing: Part 1 2009 S. Baets, J. Poesen, B. Reubens, K. Wemans, J. De Baerdemaeker and B. Muys. Root
Tensile Strength and Root Distribution of Typical Mediterranean Plant Species and their Contribution to Soil Shear Strength 2008
Simiu, Emil, Miyata, Toshio. Design of Buildings and Bridges for Wind: A Practical
Guide for ASCE-7 Standard Users and Designers of Special Structures 2006 Stokes, Alexia. Biomechanics of Tree Anchorage 2002 Weiler, Susan K., Scholz-Barth, Katrin. Green Roof Systems: A Guide to the Planning,
Design, and Construction of Landscape of Structure 2009 Xero Flor America. Xero Flor XF300 and XF301 Green Roof System Wind Uplift
Resistance Certification 2008
78
BIOGRAPHICAL SKETCH
Duane Andre Ellis earned his Master of Science in building construction from the
M. E. Rinker, Sr., School of Building Construction at the University of Florida. While at
the University of Florida he worked as a graduate teaching assistant for the BCN 3281C
Construction Mechanics course. Prior to earning his MSBC degree, Duane graduated
from the University of West Florida in 2008 with a Bachelor of Science degree in
engineering technology, with a concentration in construction. He also holds
certifications as a LEED AP and a Construction Document Technologist.