Embed Size (px)
Citation preview


By Daniel P. BearthSenior Features Writer
The 2017 Transport Topics Top 50 Global Freight Carriers list reflects a little bit of everything: growth, decline and consolidation.
Parcel carriers continue to lead the way with solid revenue gains as the boom in e-commerce extends across borders. U.S.-based FedEx Corp. and UPS Inc. held on to their positions at the top of the list, while Germany’s Deutsche Post DHL and Japan’s Yamato Group moved up to Nos. 6 and 16, respectively, from Nos. 9 and 20 a year ago.
U.S.-based rail carriers saw their business fall off due to weak demand for energy and commodities, but state-owned railroads in China, Russia and India posted higher revenue in 2016 compared with the prior year.
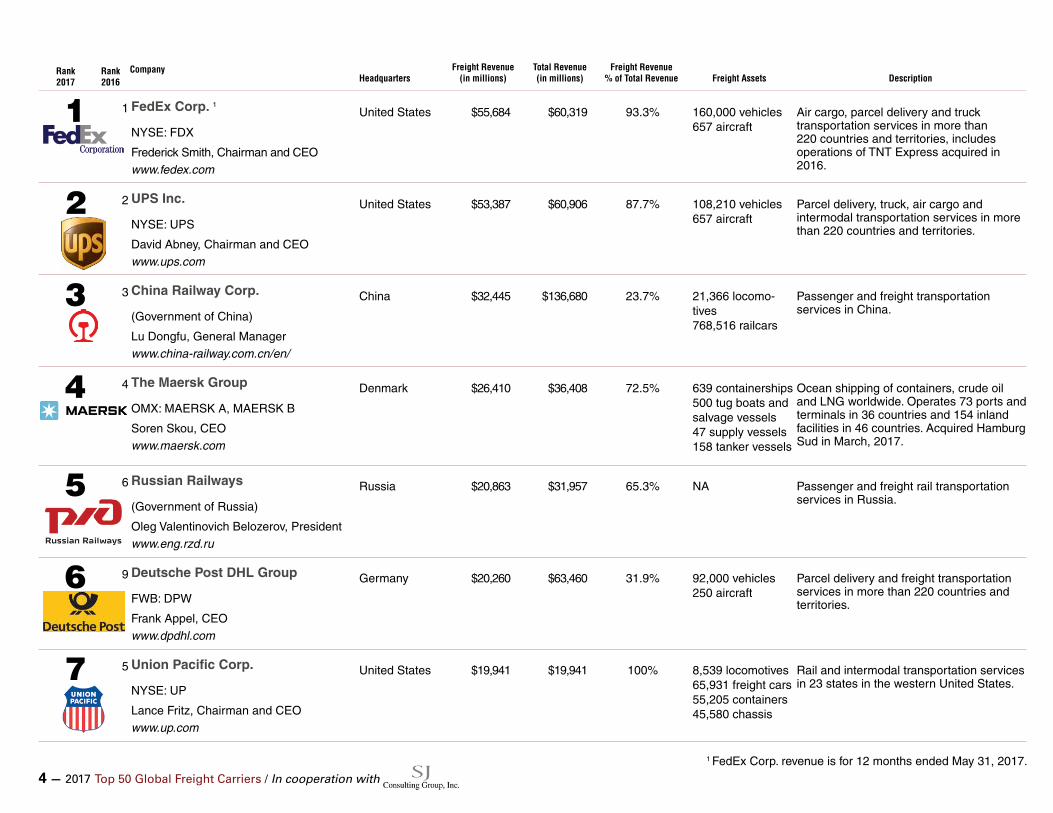
Among ocean freight carriers, the bankruptcy of Korea’s Hanjin Shipping Co. led to an increase in mergers and acquisitions. Hapag-Lloyd AG of Germany acquired United Arab Shipping Co. and two of China’s major ocean carriers, COSCO Group and China Shipping Container Lines, combined to form China COSCO Shipping Corp. Hapag-Lloyd ranks No. 15 this year and China COSCO Shipping Corp. ranks No. 18.
Several other deals are pending. Mediterranean Shipping Co. is slated to acquire the Mercosul Line, which operates in Brazil’s domestic container shipping market, and Maersk Group is expected to complete its planned purchase of Hamburg Sud from Germany’s Oetker Group later this year. Swiss-based Mediterranean Shipping ranks No. 9 and Maersk ranks No. 4.
Air cargo carriers saw both gains and losses, with Emirates Group and Cathay Pacific Airways posting revenue increases in 2016 compared with 2015 and Lufthansa Group and
Korean Air showing declines.Truck freight carriers also presented a mixed picture with
XPO Logistics, J.B. Hunt Transport Services, Schneider and Old Dominion Freight Line reporting revenue gains, while YRC Worldwide, Swift Transportation and TFI International saw declines in 2016 versus the prior year.
Consolidation also is on the horizon for trucking with the pending merger of truckload and intermodal carrier Swift and regional truckload specialist Knight Transportation. Both companies are based in Phoenix.
Total freight revenue for carriers on the Top 50 list this year is $520.4 billion, down from $556.6 billion for the Top 50 carriers a year ago.
Three carriers are listed for the first time. They are:•Kansas City Southern (No. 45), a holding company for a
rail carrier with service in the United States and Mexico and a 50% ownership in the Panama Canal Railway Co.
•Estes Express Lines (No. 48), a family-owned truck freight carrier based in Richmond, Va., that provides service throughout the United States, Canada, Mexico and the Caribbean.
•Ukrzaliznytsia (No. 49), the national railroad of Ukraine.The Top 50 Global Freight Carriers is a listing of the
largest freight carriers in the world. It is the only ranking that combines air, ocean, rail and truck freight haulers in a single list. Companies are ranked based on revenue generated from freight operations in the most recent 12-month period, which corresponds in most cases to the calendar year 2016. Local currencies are converted into U.S. dollars based on the average exchange rate for the time period covered.
The list was compiled for Transport Topics by Mark D’amico, a senior analyst at S.J. Consulting Group, a research and consulting firm in Sewickley, Pa.
A Mixed Picture Emerges For Global Freight Carriers
Acknowledgements and SourcesThe 2017 Top 50 Global Freight Carriers is an annual project of TransporT Topics in cooperation with SJ Consulting Group.
Senior Features Writer Daniel P. Bearth coordinated the project with help from Editorial Researcher Brandon Green. The publication was edited by Seth Clevenger, managing editor of features. Cover design by Joseph Terry, senior designer, and layout by Debra Devine, production manager.
4 — 2017 Top 50 Global Freight Carriers / In cooperation with
Rank2017
Rank2016
CompanyHeadquarters
Freight Revenue (in millions)
Total Revenue (in millions)
Freight Revenue % of Total Revenue Freight Assets Description
1 1 FedEx Corp. 1United States $55,684 $60,319 93.3% 160,000 vehicles
657 aircraftAir cargo, parcel delivery and truck transportation services in more than 220 countries and territories, includes operations of TNT Express acquired in 2016.
NYSE: FDX
Frederick Smith, Chairman and CEOwww.fedex.com
2 2 UPS Inc. United States $53,387 $60,906 87.7% 108,210 vehicles657 aircraft
Parcel delivery, truck, air cargo and intermodal transportation services in more than 220 countries and territories.NYSE: UPS
David Abney, Chairman and CEOwww.ups.com
3 3 China Railway Corp. China $32,445 $136,680 23.7% 21,366 locomo-tives768,516 railcars
Passenger and freight transportation services in China.
(Government of China)
Lu Dongfu, General Managerwww.china-railway.com.cn/en/
4 4 The Maersk Group Denmark $26,410 $36,408 72.5% 639 containerships500 tug boats and salvage vessels47 supply vessels158 tanker vessels
Ocean shipping of containers, crude oil and LNG worldwide. Operates 73 ports and terminals in 36 countries and 154 inland facilities in 46 countries. Acquired Hamburg Sud in March, 2017.
OMX: MAERSK A, MAERSK B
Soren Skou, CEOwww.maersk.com
5 6 Russian Railways Russia $20,863 $31,957 65.3% NA Passenger and freight rail transportation services in Russia.
(Government of Russia)
Oleg Valentinovich Belozerov, Presidentwww.eng.rzd.ru
6 9 Deutsche Post DHL Group Germany $20,260 $63,460 31.9% 92,000 vehicles250 aircraft
Parcel delivery and freight transportation services in more than 220 countries and territories.FWB: DPW
Frank Appel, CEOwww.dpdhl.com
7 5 Union Pacific Corp. United States $19,941 $19,941 100% 8,539 locomotives 65,931 freight cars 55,205 containers 45,580 chassis
Rail and intermodal transportation services in 23 states in the western United States.
NYSE: UP
Lance Fritz, Chairman and CEOwww.up.com
1 FedEx Corp. revenue is for 12 months ended May 31, 2017.
2017 Top 50 Global Freight Carriers / In cooperation with — 5
Rank2017
Rank2016
CompanyHeadquarters
Freight Revenue (in millions)
Total Revenue (in millions)
Freight Revenue % of Total Revenue Freight Assets Description
8 8 BNSF Railway United States $18,921 $19,829 95.4% 8,000 locomotives72,000 railcars
Rail and intermodal transportation services in 28 states in the midwest and northwest United States and three provinces in Canada.
(Berkshire Hathaway Inc.)
Matthew Rose, Chairman Carl Ice, CEOwww.bnsf.org
9 10 Mediterranean Shipping Co. Switzerland $17,675 $17,675 100% 490 vessels Ocean shipping of containers, intermodal transportation and port services in more than 155 countries.Gianluigi Aponte, Chairman
Diego Aponte, President and CEOwww.msc.com
10 7 CMA CGM Group France $15,977 $15,977 100% 445 vessels1,480 containers
Ocean shipping of dry, refrigerated and tank containers and bulk commodities worldwide, planned acquisition of Mercosul Line announced in June.
Jacques Saade, Chairmanwww.cma-cgm.com
11 11 Indian Railways 1 India $15,929 $24,574 64.8% 11,126 locomo-tives251,256 railcars
Passenger and freight rail transportation services in India.
(Government of India)
A.K. Mital, Chairmanwww.indianrailways.gov.in
12 13 NYK Group Japan $12,789 $18,395 69.5% 758 vessels Ocean shipping of containers, wood chips, cars, bulk commodities and LNG worldwide, port terminal operations and harbor truck services in North America.
TYO: 9101
Yasumi Kudo, Chairman Tadaaki Naito, Presidentwww.nyk.com
13 14 Mitsui O.S.K Lines Japan $12,731 $13,607 93.6% 847 vessels Ocean shipping of containers, bulk commodities, cars and LNG worldwide.
TYO: 9104
Koichi Muto, Chairman Junichiro Ikeda, President and CEOwww.mol.co.jp/en/
1 Indian Railways and NYK Group revenue is for 12 months ended March 31, 2017.

6 — 2017 Top 50 Global Freight Carriers / In cooperation with
Rank2017
Rank2016
CompanyHeadquarters
Freight Revenue (in millions)
Total Revenue (in millions)
Freight Revenue % of Total Revenue Freight Assets Description
14 16 Deutsche Bahn AG Germany $12,085 $44,912 26.9% NA Passenger and freight rail and truck transportation in Germany and more than 130 countries worldwide.(Government of Germany)
Dr. Richard Lutz, CEOwww.deutschebahn.com
15 15 Hapag-Lloyd AG Germany $11,662 $11,662 100% 230 vessels Ocean shipping of dry and refrigerated containers; includes operations of United Arab Shipping Co. acquired in 2016.Rolf Jansen, CEO
www.hapag-lloyd.com
16 20 Yamato Group Japan $11,136 $16,881 66% NA Package delivery services in Japan and Asia.
TYO: 9064
Makoto Kigawa, Chairman Masaki Yamauchi, President and CEOwww.yamato-hd.co.jp
17 17 CSX Corp. United States $11,069 $11,069 100% 4,400 locomotives65,159 railcars18,147 containers
Rail and intermodal transportation services in 23 states and the District of Columbia in the eastern United States. Hunter Harrison, President and CEO
www.csx.com
18 12 China COSCO Shipping Corp. China $10,518 $10,518 100% 4,000 vehicles800 vessels
Ocean shipping of containers, bulk commodities, crude oil and LNG worlwide, includes operations of China Shipping Container Lines acquired in 2016.
(Government of China)
Xu Lirong, Chairmanwww.cnshipping.com
19 19 Norfolk Southern Corp. United States $9,888 $9,888 100% 4,268 locomotives69,283 railcars20,948 containers3,842 vehicles
Rail and intermodal transportation services in 22 states and the District of Columbia in the eastern United States.NYSE: NSC
James Squires, Chairman, President and CEOwww.nscorp.com
20 18 Kawaski Kisen Kaisha Ltd. Japan $9,465 $9,465 100% 529 vessels Ocean shipping of containers, cars, bulk commodities, crude oil and LNG worldwide; United States and Europe and provides heavy-lift services.
TYO: 9107
Eizo Murakami, CEOwww.kline.co.jp

2017 Top 50 Global Freight Carriers / In cooperation with — 7
Rank2017
Rank2016
CompanyHeadquarters
Freight Revenue (in millions)
Total Revenue (in millions)
Freight Revenue % of Total Revenue Freight Assets Description
21 21 Canadian National Railway Canada $8,689 $8,953 97% 2,268 locomotives63,442 railcars
Rail and intermodal transportation services in Canada and the United States. Operates ships and barges for hauling bulk commodities on the Great Lakes St. Lawrence Seaway System.
NYSE:CNI
Luc Jobin, President and CEOwww.cn.ca
22 22 SF Express China $8,585 $8,585 100% 15,000 vehicles36 aircraft
Parcel delivery in China and Mongolia, Southeast Asia, Japan, South Korea, Australia and the United States. Wang Wei, Chairman
www.sf-express.com
23 30 XPO Logistics United States $7,388 $14,619 50.5% 15,813 vehicles27,606 trailers9,941 containers8,142 chassis
Truck and intermodal freight transportation services in Europe, the United States, Canada and Mexico.NYSE: XPO
Bradley Jacobs, Chairman and CEOwww.xpologistics.com
24 25 SG Holdings Group 1Japan $7,142 $8,858 80.6% NA Provides parcel delivery services in Asia,
North America and Africa. Eiichi Kuriwada, Chairman and CEOwww.sg-hldgs.co.jp
25 26 GeoPost Group France $6,583 $6,825 96.5% NA Parcel delivery under DPDgroup brand in 20 countries in Europe, Australia and the United Kingdom.(Le Groupe La Poste)
Paul-Marie Chavanne, Chairman and CEOwww.geopostgroup.com
26 24 Hamburg Süd Group Germany $6,234 $6,234 100% 177 vessels583,000 contain-ers
Ocean shipping of containers and bulk commodities, fuel and chemicals worldwide, sale to Maersk Line pending.(Oetker Group)
Dr. Ottmar Gast, Chairmanwww.hamburgsud.com
27 28 J.B. Hunt Transport Services United States $5,717 $6,555 87.2% 14,805 vehicles30,330 trailers84,594 containers
Intermodal and truck freight transportation services in the United States.
NASDAQ: JBHT
Kirk Thompson, Chairman John Roberts III, President and CEOwww.jbhunt.com
1 SG Holdings Group revenue is for 12 months ended March 20, 2017.

8 — 2017 Top 50 Global Freight Carriers / In cooperation with
Rank2017
Rank2016
CompanyHeadquarters
Freight Revenue (in millions)
Total Revenue (in millions)
Freight Revenue % of Total Revenue Freight Assets Description
28 27 Orient Overseas (International) Ltd. Hong Kong $5,298 $5,298 100% 55 vessels Ocean shipping of containers worldwide and port terminal operations in Taiwan and the United States. SEHK: 316
Tung Chee Chen, Chairman and CEOwww.ooilgroup.com
29 32 YRC Worldwide United States $4,698 $4,698 100% 14,300 vehicles44,500 trailers
Truck and intermodal transportation services in the United States and Canada.
NASDAQ: YRCW
James Welch, CEOwww.yrcw.com
30 29 Canadian Pacific Railway Canada $4,508 $4,636 97.2% 1,490 locomotives37,429 railcars7,819 containers5,820 chassis
Rail and intermodal freight transportation services in Canada and parts of the midwest and northeast United States.TSX: CP, NYSE: CP
Keith Creel, President and CEOwww.cpr.ca
31 31 Hyundai Merchant Marine Co. South Korea $3,749 $3,749 100% 130 vessels Ocean shipping of containers, bulk commodities, crude oil, LNG and heavy-lift cargoes worldwide.KRX: 011200
C.K. Yoo, CEOwww.hmm21.com
32 34 Swift Transportation United States $3,721 $4,032 92.3% 18,366 vehicles64,066 trailers9,131 containers
Truck and intermodal freight transportation services in the United States, Canada and Mexico. Merger with Knight Transportation pending.
NYSE: SWFT
Richard Dozer, Chairman Richard Stocking, President and CEOwww.swifttrans.com
33 33 Yang Ming Marine Transport Corp. Taiwan $3,579 $3,579 100% 97 vessels Ocean shipping of containers and bulk commodities worldwide and operates port terminals in Taiwan, the United States and Europe.
TWSE: 2609.TW
Bronson Hsieh, Chairman and CEOwww.yangming.com
2017 Top 50 Global Freight Carriers / In cooperation with — 9
Rank2017
Rank2016
CompanyHeadquarters
Freight Revenue (in millions)
Total Revenue (in millions)
Freight Revenue % of Total Revenue Freight Assets Description
34 36 Transnet Group South Africa $3,426 $4,464 76.8% 2,415 locomotives75,275 railcars
Rail transportation and port services in South Africa.
(Government of South Africa)
Siyabonga Gama, CEOwww.transnet.net
35 35 Evergreen Marine Corp. Taiwan $3,412 $3,836 88.9% 190 vessels Provides ocean shipping of containers worldwide.
LSE: EGMD
Cheng-Yung Chang, Chairmanwww.evergreen-marine.com
36 37 Schneider United States $3,383 $4,046 83.6% 10,459 vehicles37.910 trailers6,838 chassis18,087 containers
Truck and intermodal freight transportation services in the United States, Canada, Mexico and China. Chris Lofgren, CEO and President
www.schneider.com
37 46 Nippon Express Japan $2,993 $17,092 18.3% NA Parcel delivery, air cargo and truck freight transportation services and coastal shipping of containers and heavy-lift cargo in Japan.
TYO: 9062
Kenji Watanabe, Chairmannipponexpressusa.com
38 44 Old Dominion Freight Line Inc. United States $2,992 $2,992 100% 8,117 vehicles32,525 trailers 373 chassis
Truck freight transportation services in the United States.
Nasdaq: ODFL
Earl Congdon, Chairman David Congdon, CEOwww.odfl.com
39 40 Emirates Group 1United Arab Emirates
$2,884 $22,799 12.6% 259 aircraft Passenger and air cargo transportation services worldwide.
(Government of United Arab Emirates)
Ahmed bin Saeed Al Maktoum, Chairman and CEOwww.theemiratesgroup.com
1 Emirates Group revenue is for 12 months ended March 31, 2017.
10 — 2017 Top 50 Global Freight Carriers / In cooperation with
Rank2017
Rank2016
CompanyHeadquarters
Freight Revenue (in millions)
Total Revenue (in millions)
Freight Revenue % of Total Revenue Freight Assets Description
40 41 TFI International Canada $2,857 $2,994 95.4% 18,535 vehicles25,310 trailers
Parcel and truck freight services in Canada and the United States.
TSX: TFI
Alain Bedard, Chairman, President and CEOwww.transforcecompany.com
41 39 Toll Group Australia $2,838 $5,898 48.1% 19,000 vehicles Parcel delivery, truck, intermodal, rail and air cargo transportation services in Australia, New Zealand and more than 50 other countries.
(Japan Post)
Michael Byrne, Managing Directorwww.tollgroup.com
42 47 Aurizon Australia $2,588 $2,588 100% 500 locomotives13,000 railcars
Rail freight transportation services in Australia.
ASX: AZJ
Tim Poole, Chairman Andrew Harding, CEOwww.aurizon.com.au
43 43 Cathay Pacific Airways Hong Kong $2,584 $11,946 21.6% 146 aircraft Passenger and air cargo transportation services worldwide.
SEHK: 0293
John Slosar, Chairman Rupert Hogg, CEOwww.cathaypacific.com
44 42 ZIM Integrated Shipping Services Israel $2,540 $2,540 100% 80 vessels Ocean shipping of containers worldwide.
Aharon Fogel, Chairman Eli Glickman, President and CEOwww.zim.com

2017 Top 50 Global Freight Carriers / In cooperation with — 11
Rank2017
Rank2016
CompanyHeadquarters
Freight Revenue (in millions)
Total Revenue (in millions)
Freight Revenue % of Total Revenue Freight Assets Description
45 Not Ranked
Kansas City Southern United States $2,334 $2,334 100% 1,044 locomotives20,612 railcars
Rail and intermodal freight transportation services in the United States, Mexico and Panama.NYSE: KSU
Patrick Ottensmeyer, President and CEOwww.kcsouthern.com
46 48 Lufthansa Group Germany $2,307 $35,043 6.6% 617 aircraft Passenger and air cargo transportation services worldwide.
XETRA: LHA
Carsten Spohr, Chairman and CEOwww.lufthansagroup.com
47 38 Pacific International Lines Singapore $2,194 $3,184 68.9% 136 container ships19 bulk carriers
Ocean shipping of containers and special project cargo in more than 100 countries.
Chang Yun Chung, Chairmanwww.pilship.com
48 Not Ranked
Estes Expess Lines United States $2,155 $2,397 89.9% 7,561 vehicles26,718 trailers 56 containers
Truck freight transportation services in the United States.
Rob Estes, Jr., Chairman, President and CEOwww.estes-express.com
49 Not Ranked
Ukrzaliznytsia Ukraine $2,131 $2,605 81.8% NA Passenger and freight transportation services in Ukraine.
(Government of Ukraine)
Evhen Kravtsov, Chairmanwww.uz.gov.ua/en/
50 49 Korean Air South Korea $2,107 $9,918 21.2% 161 aircraft Passenger and air cargo transportation services around the world.
KRX: 003490
Yang Ho Cho, Chairman and CEOwww.koreanair.com

12 — 2017 Top 50 Global Freight Carriers / In cooperation with
*20-foot Equivalent Unit
North American Ports
Volume of FreightName of Port Type of Freight TEUs* Tons
Port of Anchorage Anchorage, Alaska
container, break bulk, dry bulk, liquid bulk, automotive, air cargo, passenger
471,166 3,540,605
Juneau Port Juneau, Alaska
container NA 864,999
Port of Ketchikan Ketchikan, Alaska
container, passenger NA 928,095
Port of Kivalina Kivalina, Alaska
liquid builk, container, passenger NA 3,146,813
Port Nikiski Nikishka, Alaska
liquid bulk NA 5,156,956
Port of Valdez Valdez, Alaska
liquid bulk, container, passenger NA 26,747,395
International Port of Dutch Harbor Unalaska Island, Alaska
container NA 1,651,306
Prince Rupert Harbour Prince Rupert, British Columbia
container, break bulk, dry bulk, liquid bulk, special project cargo, passenger
736,663 20,691,536
Port of Nanaimo Nanaimo, British Columbia
container, break bulk, dry bulk, liquid bulk, passenger 43,024 5,389,937
Port of Vancouver Vancouver, British Columbia
container, break bulk, dry bulk, liquid bulk, automobile, special project cargo, passenger
136,000,000
Volume of FreightName of Port Type of Freight TEUs* Tons
Port of Coos Bay Coos Bay, Ore.
container NA 1,755,356
Port of Portland Portland, Ore.
container, break bulk, liquid bulk, dry bulk, automobile, heavy lift, air cargo, special project cargo
1,725 18,624,568
Port of Anacortes Anacortes, Wash.
container, dry bulk, air cargo, special project cargo passenger
NA 9,519,828
Port of Everett Everett, Wash.
container, break bulk, passenger 27,488 1,599,169
Port of Grays Harbor Grays Harbor, Wash.
container, break bulk, liquid bulk, air cargo NA 2,202,538
Port of Kalama Kalama, Wash.
container NA 13,320,919
Port of Longview Longview, Wash.
container, break bulk, liquid bulk, dry bulk, heavy lift, special project cargo
NA 11,061,788
Port of Olympia Olympia, Wash.
container, break bulk, dry bulk, heavy lift NA 1,137,908
Northwest Seaport Alliance Seattle
container, break bulk, liquid bulk, dry bulk, automobile, heavy lift, special project cargo, refrigerated, passenger, air cargo
3,615,752 22,606,608
Port of Vancouver Vancouver, Wash.
container, break bulk, dry bulk, heavy lift, special projects cargo
1,666 8,444,247
Pacific Northwest Ports
Volume of FreightName of Port Type of Freight TEUs* Tons
Port of Long Beach Long Beach, Calif.
container, break bulk, dry bulk, liquid bulk, automotive, heavy lift, special project cargo, refrigerated, passenger
6,775,170 78,164,597
Port of Los Angeles Los Angeles
container, break bulk,dry bulk, liquid bulk, automotive, heavy lift, special project cargo, refrigerated, passenger
8,856,783 60,187,840
Port of Oakland Oakland, Calif.
container, break bulk, dry bulk, liquid bulk 2,369,641 17,565,619
Port of Hueneme Port Hueneme, Calif.
container, dry bulk, liquid bulk, automobile, passenger
83,600 1,711,619
Port of Redwood City Redwood City, Calif.
container, dry bulk, liquid bulk NA 2,052,051
Port of Richmond Richmond, Calif.
container, break bulk, dry bulk, liquid bulk NA 28,529,178
Port of San Diego San Diego
container, automobile, passenger 142,764 1,454,921
Port of San Francisco San Francisco
break bulk, dry bulk, liquid bulk, passenger NA 1,800,051
Volume of FreightName of Port Type of Freight TEUs* Tons
Port of Stockton Stockton, Calif.
container, break bulk, dry bulk, liquid bulk NA 4,034,963
Port of Apra Harbor Apra Harbor, Guam
NA 198,209 NA
Hilo Harbor Hilo, Hawaii
container, liquid bulk, passenger 42,731 2,130,495
Kawaihae Harbor Kawaihae, Hawaii
container, dry bulk, liquid bulk 81,407 1,994,961
Nawiliwili Harbor Kauai, Hawaii
container, liquid bulk, passenger 50,814 1,929,149
Kahului Harbor Maui, Hawaii
container, liquid bulk, passenger 109,065 3,719,568
Honolulu Harbor Oahu Oahu, Hawaii
container, dry bulk, liquid bulk, automotive, passenger
1,211,997 13,831,929
Kalaeloa Barbers Point Harbor Oahu, Hawaii
dry bulk, liquid bulk 11,038 10,570,317
California and Pacific Islands
2017 Top 50 Global Freight Carriers / In cooperation with — 13*20-foot Equivalent Unit
North American Ports
Great Lakes PortsVolume of Freight
Name of Port Type of Freight (TEUs)* Tons
Port of Hamilton Hamilton
container, break bulk, dry bulk, liquid bulk, special project cargo
49 9,200,000
Port of Toronto Toronto
container,break bulk, dry bulk, liquid bulk, passenger 304 2,000,000
Port of Montreal Montreal
container, break bulk, dry bulk, liquid bulk, passenger 1,446,075 32,000,000
Port Saguenay Saguenay, Quebec
container, break bulk, dry bulk, liquid bulk, passenger 461 NA
Port of Chicago Chicago
dry bulk, liquid bulk NA 17,482,673
Buffington Harbor Buffington, Ind.
NA NA 1,588,807
Indiana Harbor East Chicago, Ind.
dry bulk, liquid bulk, heavy lift NA 13,019,286
Port of Gary Gary, Ind.
NA NA 9,313,540
Port of Indiana-Burns Harbor Portage, Ind.
container, dry bulk, liquid bulk, heavy lift NA 9,606,984
Port of Alpena Alpena, Mich.
NA NA 2,249,447
Port of Calcite Calcite, Mich.
special project cargo NA 6,017,441
Port Dolomite Clark Township, Mich.
NA NA 2,681,959
Port of Detroit Detroit
dry bulk, liquid bulk, passenger NA 14,147,457
Drummond Island Port Drummond Island, Mich.
NA NA 1,122,455
Port of Escanaba Escanaba, Mich.
NA NA 4,552,513
Port of Grand Haven Grand Haven , Mich.
NA NA 4,552,513
Port Inland Gulliver, Mich.
NA NA 3,797,215
Port of Marquette Marquette, Mich.
NA NA 1,273,297
Volume of FreightName of Port Type of Freight (TEUs)* Tons
Port of Monroe Monroe, Mich.
NA NA 2,763,464
Port of Muskegon Muskegon, Mich.
break bulk, dry bulk, heavy lift NA 1,850,497
Presque Isle Harbor Presque Isle, Mich.
NA NA 9,100,293
Port of St. Clair St. Clair, Mich.
NA NA 6,916,865
Port of Stoneport Stoneport, Mich.
NA NA 5,936,636
Port of Duluth-Superior Duluth, Minn., and Superior, Wis.
break bulk, dry bulk, liquid bulk, heavy lift, passenger NA 37,389,983
Port of Silver Bay Silver Bay, Minn.
NA NA 5,979,390
Two Harbors Two Harbors, Minn.
dry bulk NA 14,779,471
Ashtabula Harbor Ashtabula, Ohio
dry bulk NA 4,834,323
Port of Cleveland Cleveland
container, dry bulk, liquid bulk, heavy lift, special project cargo
2,187 12,999,044
Port of Conneaut Conneaut, Ohio
NA NA 4,800,331
Fairport Harbor Point Fairport Harbor, Ohio
NA NA 1,718,915
Port of Lorain Lorain, Ohio
NA NA 960,423
Port Clinton Marblehead, Ohio
NA NA 2,463,813
Port of Sandusky Sandusky, Ohio
NA NA 2,138,530
Port of Toledo Toledo, Ohio
NA NA 11,278,405
Port of Green Bay Green Bay, Wis.
dry bulk, liquid bulk NA 2,482,846
Port of Milwaukee Milwaukee
dry bulk NA 2,977,251
14 — 2017 Top 50 Global Freight Carriers / In cooperation with
*20-foot Equivalent Unit
North American Ports
North Atlantic PortsVolume of Freight
Name of Port Type of Freight TEUs* Tons
Port Saint John Saint John, New Brunswick
container, break bulk, dry bulk, liquid bulk, passenger 90,262 28,000,000
Port of Halifax Halifax, Nova Scotia
container, break bulk, dry bulk, liquid bulk, automobile, special project cargo, passenger
480,722 4,461,038
Port of Bridgeport Bridgeport, Conn.
NA NA 3,332,214
Port of New Haven New Haven, Conn.
container, break bulk,dry bulk, liquid bulk, special project cargo
NA 10,020,160
Port of New Castle New Castle, Del.
NA NA 7,836,612
Port of Wilmington Wilmington, Del.
container, break bulk, dry bulk, liquid bulk, automobile, refrigerated
362,492 7,914,373
Port of Portland Portland, Maine
container, break bulk, dry bulk, liquid bulk, special project cargo
15,562 8,295,415
Port of Searsport Searsport, Maine
break bulk, dry bulk, liquid bulk NA 1,557,860
Port of Boston Boston
containers, break bulk, dry bulk, passengers 248,391 16,843,278
Volume of FreightName of Port Type of Freight TEUs* Tons
Port of Fall River Fall River, Mass.
NA NA 1,254,382
Port of Portsmouth Portsmouth, N.H.
container, break bulk, dry bulk, special project cargo NA 2,787,884
Port of Camden-Gloucester Camden-Gloucester, N.J.
container, break bulk, dry bulk NA 6,923,348
Port of Paulsboro Paulsboro, N.J.
containers, break bulk, dry bulk, liquid bulk, heavy lift NA 22,499,613
Port of Albany–Rensselaer Albany, N.Y.
break bulk, dry bulk, liquid bulk, heavy lift NA 9,603,643
Port of Hampstead Hampstead, N.Y.
NA NA 1,036,924
Port of New York and New Jersey New York
container, break bulk, dry bulk, liquid bulk, automotive, heavy lift, special project cargo, refrigerated, passenger
6,251,953 126,690,317
Port Jefferson Port Jefferson, N.Y.
NA NA 1,097,592
Port of Prividence Providence, R.I.
break bulk, dry bulk, liquid bulk, special project cargo NA 8,043,051
Mid-Atlantic PortsVolume of Freight
Name of Port Type of Freight TEUs* Tons
Port Saint John Saint John, New Brunswick
container, break bulk, dry bulk, liquid bulk, passenger
90,262 28,000,000
Port of Halifax Halifax, Nova Scotia
container, break bulk, dry bulk, liquid bulk, automobile, special project cargo, passenger
480,722 4,461,038
Port of Bridgeport Bridgeport, Conn.
NA NA 3,332,214
Port of New Haven New Haven, Conn.
container, break bulk,dry bulk, liquid bulk, special project cargo
NA 10,020,160
Port of New Castle New Castle, Del.
NA NA 7,836,612
Port of Wilmington Wilmington, Del.
container, break bulk, dry bulk, liquid bulk, automobile, refrigerated
362,492 7,914,373
Port of Portland Portland, Maine
container, break bulk, dry bulk, liquid bulk, special project cargo
15,562 8,295,415
Port of Searsport Searsport, Maine
break bulk, dry bulk, liquid bulk NA 1,557,860
Port of Boston Boston
containers, break bulk, dry bulk, passengers 248,391 16,843,278
Volume of FreightName of Port Type of Freight TEUs* Tons
Port of Fall River Fall River, Mass.
NA NA 1,254,382
Port of Portsmouth Portsmouth, N.H.
container, break bulk, dry bulk, special project cargo NA 2,787,884
Port of Camden-Gloucester Camden-Gloucester, N.J.
container, break bulk, dry bulk NA 6,923,348
Port of Paulsboro Paulsboro, N.J.
containers, break bulk, dry bulk, liquid bulk, heavy lift NA 22,499,613
Port of Albany–Rensselaer Albany, N.Y.
break bulk, dry bulk, liquid bulk, heavy lift NA 9,603,643
Port of Hampstead Hampstead, N.Y.
NA NA 1,036,924
Port of New York and New Jersey New York
container, break bulk, dry bulk, liquid bulk, automotive, heavy lift, special project cargo, refrigerated, passenger
6,251,953 126,690,317
Port Jefferson Port Jefferson, N.Y.
NA NA 1,097,592
Port of Prividence Providence, R.I.
break bulk, dry bulk, liquid bulk, special project cargo NA 8,043,051

2017 Top 50 Global Freight Carriers / In cooperation with — 15*20-foot Equivalent Unit
North American Ports
South Atlantic PortsVolume of Freight
Name of Port Type of Freight TEUs* Tons
Port of Brunswick Brunswick, Ga.
break bulk, dry bulk, automobile NA 3,252,285
Port of Savannah Savannah, Ga.
container, break bulk, heavy lift, automobile, refrigerated 3,737,402 34,359,148
Port Canaveral Brevard County, Fla.
container, break bulk, dry bulk, liquid bulk, autombile, heavy lift, special project cargo, passenger
NA 3,149,159
Port Everglades Broward County, Fla.
container, break bulk, dry bulk, liquid bulk, passenger 1,060,506 22,441,578
Port of Jacksonville Jacksonville, Fla.
container, break bulk, dry bulk, liquid bulk, automobile, heavy lift, refrigerated
915,292 17,300,602
Port Manatee Manatee, Fla.
container, break bulk, dry bulk, liquid bulk, special project cargo
29,100 1,992,091
Volume of FreightName of Port Type of Freight TEUs* Tons
Port of Miami Miami
container, passenger 1,007,782 7,142,109
Port of Palm Beach Palm Beach, Fla.
container, break bulk, dry bulk, liquid bulk, passenger 271,277 2,135,325
Port of Tampa Tampa, Fla.
container, break bulk, dry bulk, liquid bulk, heavy lift, passenger
56,742 35,193,654
Port of Morehead City Morehead City, N.C.
break bulk, dry bulk, liquid bulk NA 2,623,640
Port of Wilmington Wilmington, N.C.
container, break bulk, dry bulk, liquid bulk heavy lift 291,843 5,887,971
Port of Charleston Charleston, S.C.
container, break bulk, dry bulk, automobile, refrigerated 1,973,204 19,847,051
Gulf Coast PortsVolume of Freight
Name of Port Type of Freight TEUs* Tons
Port of Guntersville Guntersville, Ala.
NA NA 1,713,457
Port of Mobile Mobile, Ala.
container, break bulk, dry bulk, heavy lift 272,734 58,594,752
Helena Harbor Helena, Ark.
NA NA 1,804,260
Port of Panama City Panama City, Fla.
container, break bulk, dry bulk, liquid bulk 29,626 2,779,840
Port of Pensacola Pensacola, Fla.
container 17 918,862
Kaskaskia Regional Port Red Bud, Ill.
break bulk, dry bulk NA 5,890,088
Port of Indiana-Mount Vernon Mount Vernon, Ind.
NA 8,375,192
Hickman Fulton County Riverport Hickman, Ky.
NA NA 1,025,388
Port of Louisville Louisville, Ky.
dry bulk NA 7,017,827
Port of Greater Baton Rouge Baton Rouge, La.
break bulk, dry bulk, liquid bulk NA 68,781,974
Port of Terrebonne Houma, La.
NA NA 3,864,834
Volume of FreightName of Port Type of Freight TEUs* Tons
Port of Iberia Iberia, La.
container, break bulk, dry bulk, liquid bulk NA 2,463,976
Port Fourchon Lafourche Parish, La.
liquid bulk NA 9,322,060
Port of Lake Charles Lake Charles, La.
dry bulk, heavy lift, special project cargo NA 56,692,442
Port of Lake Providence Lake Providence, La.
NA NA 1,158,515
Port of South Louisiana LaPlace, La.
break bulk, dry bulk, liquid bulk NA 259,102,230
Port of Morgan City Morgan City, La.
container, dry bulk NA 1,200,306
Port of New Orleans New Orleans
container, break bulk, dry bulk, liquid bulk, passenger 522,364 87,809,854
Plaquemines Port Plaquemines, La.
container, break bulk, dry bulk, liquid bulk NA 53,506,448
Port of St. Paul St. Paul, Minn.
dry bulk NA 5,279,420
Port of Biloxi Biloxi, Miss.
NA NA 1,037,236
Port of Greenville Greenville, Miss.
container, break bulk, dry bulk NA 2,968,038
Port of Gulfport Gulfport, Miss.
container, break bulk, dry bulk 165,095 1,890,607
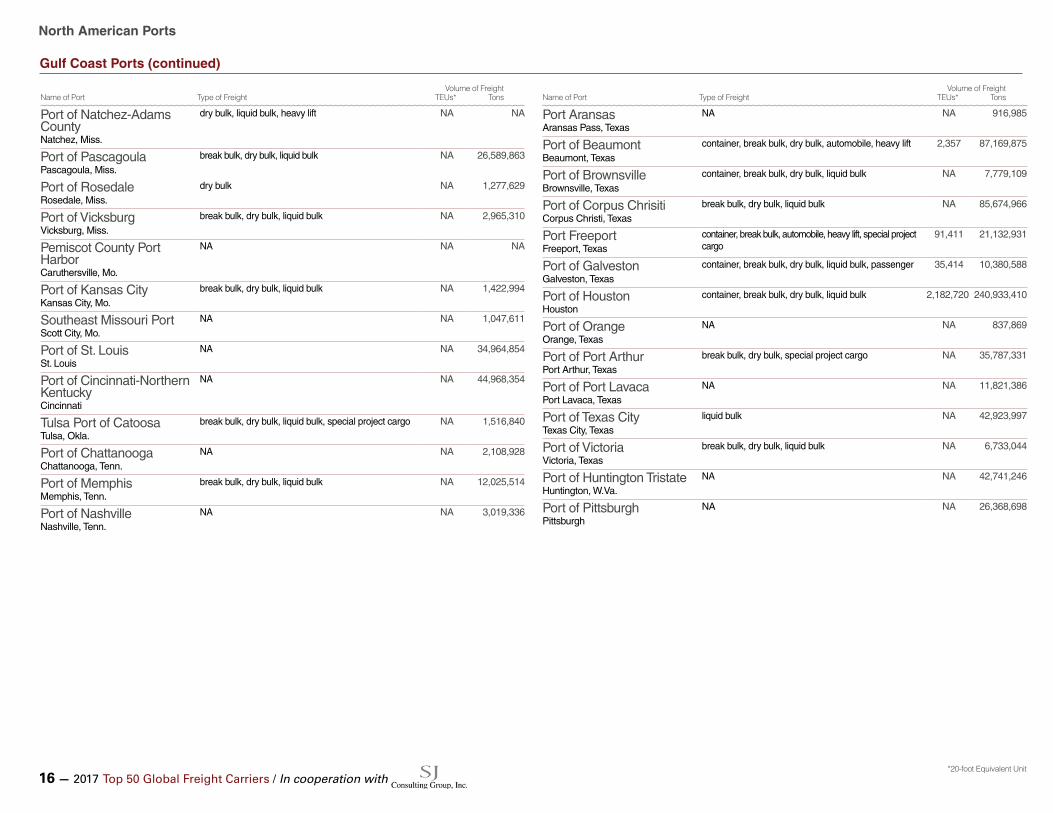
16 — 2017 Top 50 Global Freight Carriers / In cooperation with
*20-foot Equivalent Unit
North American Ports
Volume of FreightName of Port Type of Freight TEUs* Tons
Port of Natchez-Adams County Natchez, Miss.
dry bulk, liquid bulk, heavy lift NA NA
Port of Pascagoula Pascagoula, Miss.
break bulk, dry bulk, liquid bulk NA 26,589,863
Port of Rosedale Rosedale, Miss.
dry bulk NA 1,277,629
Port of Vicksburg Vicksburg, Miss.
break bulk, dry bulk, liquid bulk NA 2,965,310
Pemiscot County Port Harbor Caruthersville, Mo.
NA NA NA
Port of Kansas City Kansas City, Mo.
break bulk, dry bulk, liquid bulk NA 1,422,994
Southeast Missouri Port Scott City, Mo.
NA NA 1,047,611
Port of St. Louis St. Louis
NA NA 34,964,854
Port of Cincinnati-Northern Kentucky Cincinnati
NA NA 44,968,354
Tulsa Port of Catoosa Tulsa, Okla.
break bulk, dry bulk, liquid bulk, special project cargo NA 1,516,840
Port of Chattanooga Chattanooga, Tenn.
NA NA 2,108,928
Port of Memphis Memphis, Tenn.
break bulk, dry bulk, liquid bulk NA 12,025,514
Port of Nashville Nashville, Tenn.
NA NA 3,019,336
Volume of FreightName of Port Type of Freight TEUs* Tons
Port Aransas Aransas Pass, Texas
NA NA 916,985
Port of Beaumont Beaumont, Texas
container, break bulk, dry bulk, automobile, heavy lift 2,357 87,169,875
Port of Brownsville Brownsville, Texas
container, break bulk, dry bulk, liquid bulk NA 7,779,109
Port of Corpus Chrisiti Corpus Christi, Texas
break bulk, dry bulk, liquid bulk NA 85,674,966
Port Freeport Freeport, Texas
container, break bulk, automobile, heavy lift, special project cargo
91,411 21,132,931
Port of Galveston Galveston, Texas
container, break bulk, dry bulk, liquid bulk, passenger 35,414 10,380,588
Port of Houston Houston
container, break bulk, dry bulk, liquid bulk 2,182,720 240,933,410
Port of Orange Orange, Texas
NA NA 837,869
Port of Port Arthur Port Arthur, Texas
break bulk, dry bulk, special project cargo NA 35,787,331
Port of Port Lavaca Port Lavaca, Texas
NA NA 11,821,386
Port of Texas City Texas City, Texas
liquid bulk NA 42,923,997
Port of Victoria Victoria, Texas
break bulk, dry bulk, liquid bulk NA 6,733,044
Port of Huntington Tristate Huntington, W.Va.
NA NA 42,741,246
Port of Pittsburgh Pittsburgh
NA NA 26,368,698
Gulf Coast Ports (continued)
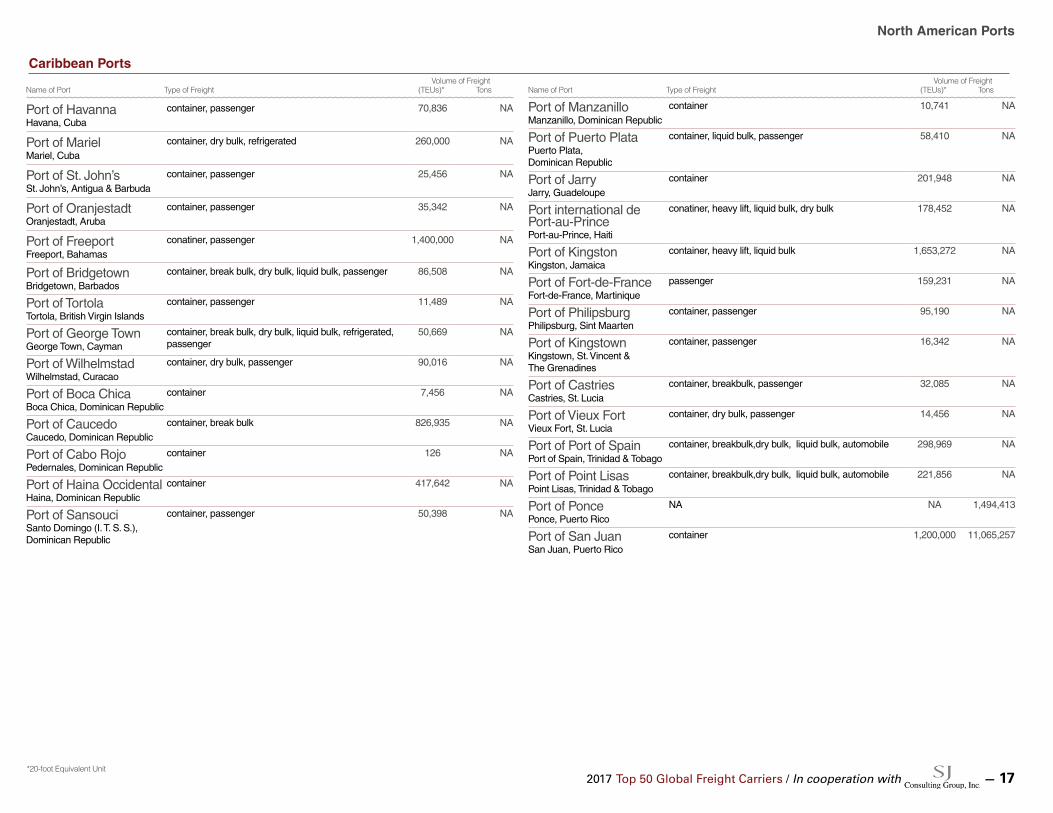
2017 Top 50 Global Freight Carriers / In cooperation with — 17*20-foot Equivalent Unit
North American Ports
Caribbean PortsVolume of Freight
Name of Port Type of Freight (TEUs)* Tons
Port of Havanna Havana, Cuba
container, passenger 70,836 NA
Port of Mariel Mariel, Cuba
container, dry bulk, refrigerated 260,000 NA
Port of St. John’s St. John’s, Antigua & Barbuda
container, passenger 25,456 NA
Port of Oranjestadt Oranjestadt, Aruba
container, passenger 35,342 NA
Port of Freeport Freeport, Bahamas
conatiner, passenger 1,400,000 NA
Port of Bridgetown Bridgetown, Barbados
container, break bulk, dry bulk, liquid bulk, passenger 86,508 NA
Port of Tortola Tortola, British Virgin Islands
container, passenger 11,489 NA
Port of George Town George Town, Cayman
container, break bulk, dry bulk, liquid bulk, refrigerated, passenger
50,669 NA
Port of Wilhelmstad Wilhelmstad, Curacao
container, dry bulk, passenger 90,016 NA
Port of Boca Chica Boca Chica, Dominican Republic
container 7,456 NA
Port of Caucedo Caucedo, Dominican Republic
container, break bulk 826,935 NA
Port of Cabo Rojo Pedernales, Dominican Republic
container 126 NA
Port of Haina Occidental Haina, Dominican Republic
container 417,642 NA
Port of Sansouci Santo Domingo (I. T. S. S.), Dominican Republic
container, passenger 50,398 NA
Volume of FreightName of Port Type of Freight (TEUs)* Tons
Port of Manzanillo Manzanillo, Dominican Republic
container 10,741 NA
Port of Puerto Plata Puerto Plata, Dominican Republic
container, liquid bulk, passenger 58,410 NA
Port of Jarry Jarry, Guadeloupe
container 201,948 NA
Port international de Port-au-Prince Port-au-Prince, Haiti
conatiner, heavy lift, liquid bulk, dry bulk 178,452 NA
Port of Kingston Kingston, Jamaica
container, heavy lift, liquid bulk 1,653,272 NA
Port of Fort-de-France Fort-de-France, Martinique
passenger 159,231 NA
Port of Philipsburg Philipsburg, Sint Maarten
container, passenger 95,190 NA
Port of Kingstown Kingstown, St. Vincent & The Grenadines
container, passenger 16,342 NA
Port of Castries Castries, St. Lucia
container, breakbulk, passenger 32,085 NA
Port of Vieux Fort Vieux Fort, St. Lucia
container, dry bulk, passenger 14,456 NA
Port of Port of Spain Port of Spain, Trinidad & Tobago
container, breakbulk,dry bulk, liquid bulk, automobile 298,969 NA
Port of Point Lisas Point Lisas, Trinidad & Tobago
container, breakbulk,dry bulk, liquid bulk, automobile 221,856 NA
Port of Ponce Ponce, Puerto Rico
NA NA 1,494,413
Port of San Juan San Juan, Puerto Rico
container 1,200,000 11,065,257

18 — 2017 Top 50 Global Freight Carriers / In cooperation with
*20-foot Equivalent Unit
North American Ports
Central American PortsVolume of Freight
Name of Port Type of Freight TEUs* Tons
Port of Belize Belize City, Belize
container, heavy lift, passenger 46,040 NA
Port of Caldera Caldera, Costa Rica
NA 264,371 NA
Port of Limon Limon/Moin, Costa Rica
container , passenger 1,177,374 NA
Port of Acajutla Acajutla, El Salvador
container 202,165 NA
Port of Puerto Barrios Puerto Barrios, Guatemala
container 427,940 NA
Port of Puerto Quetzal Puerto Quetzal, Guatemala
container 427,375 NA
Port of Santo Tomás de Castilla Santo Tomas de Castilla, Guatemala
container 568,025 NA
Port of Puerto Castillo Puerto Castillo, Honduras
container 109,992 NA
Volume of FreightName of Port Type of Freight TEUs* Tons
Port of Puerto Cortes Puerto Cortes, Honduras
container 621,819 NA
Port of San Lorenzo San Lorenzo, Honduras
container 25,460 NA
PSA Panama International Terminal PSA - Panama Int’l Terminals, Panama
container 157,967 NA
Port of Cristóbal Cristobal, Panama
container 793,941 NA
Port of Colón Colon, Panama
container, passenger 2,464,440 NA
Port of Balboa Balboa, Panama
container, dry bulk, passenger 2,831,893 NA
Port of Almirante Almirante, Panama
NA 18,261 NA
Port of Corinto Corinto, Nicaragua
container, dry bulk, liquid bulk, automobile, passenger
150,007 NA
Port of Arlen Siu-El Rama Arlen Siu/El Rama, Nicaragua
NA 6,893 NA
Volume of FreightName of Port Type of Freight TEUs* Tons
Port of Ensenada Ensenada, Baja California
NA 191,708 NA
Port of Chiapas Tapachula, Chiapas
NA 2,264 NA
Port of Manzanillo Manzanillo, Colima
container, passenger 2,580,660 NA
Port of Lázaro Cárdenas Lázaro Cárdenas, Michoacán
container, breakbulk, dry bulk, liquid bulk
1,115,452 27,086,385
Port of Salina Cruz Salina Cruz, Oaxaca
NA 397 NA
Puerto Morelos Puerto Morelos, Quintana Roo
NA NA NA
Port of Mazatlán Mazatlán, Sinaloa
NA 35,285 NA
Volume of FreightName of Port Type of Freight TEUs* Tons
Port of Guaymas Guaymas, Sonora
container 12,710 NA
Port of Dos Bocas Dos Bocas, Tabasco
container 47 NA
Port of Altamira Altamira, Tamaulipas
container, breakbulk, dry bulk, liquid bulk
684,931 NA
Port of Tampico Tampico, Tamaulipas
NA 476 NA
Port of Tuxpan Tuxpan, Veracruz
NA 199 NA
Port of Coatzacoalcos Coatzacoalcos, Veracruz
container 14,480 NA
Port of Veracruz Veracruz, Veracruz
NA 965,294 NA
Port of Progreso Progreso, Yucatán
NA 67,842 NA
Mexican Ports

2017 Top 50 Global Freight Carriers / In cooperation with — 19
Airports
1 Memphis International Memphis, Tenn.
23,866 million pounds
2 Ted Stevens Anchorage International Anchorage, Alaska
16,636 million pounds
3 Louisville International-Standiford Field Louisville, Ky.
12,804 million pounds
4 Chicago O’Hare International Chicago
9,358 million pounds
5 Miami International Miami
7,899 million pounds
6 Los Angeles International Los Angeles
6,931 million pounds
7 Indianapolis International Indianapolis
5,329 million pounds
8 Cincinnati/Northern Kentucky International Hebron, Ky.
4,275 million pounds
9 Dallas-Fort Worth International DFW Airport, Texas
3,328 million pounds
10 John F. Kennedy International Queens, N.Y.
3,197 million pounds
11 Metropolitan Oakland International Oakland, Calif.
3,152 million pounds
12 Newark Liberty International Newark, N.J.
2,803 million pounds
13 Hartsfield-Jackson Atlanta International Atlanta
2,613 million pounds
14 Ontario International Ontario, Calif.
2,588 million pounds
15 Daniel K. Inouye International Honolulu, Hawaii
2,456 million pounds
16 Philadelphia International Philadelphia
2,027 million pounds
17 Seattle-Tacoma International Seattle
1,878 million pounds
18 Phoenix Sky Harbor International Phoenix
1,704 million pounds
19 George Bush Intercontinental Houston
1,636 million pounds
20 Denver International Denver
1,425 million pounds
21 San Francisco International San Francisco
1,301 million pounds
22 Portland International Portland, Ore.
1,271 million pounds
23 Luis Munoz Marin International San Juan, Puerto Rico
1,085 million pounds
24 Salt Lake City International Salt Lake City
1,084 million pounds
25 Minneapolis-St. Paul International Minneapolis, Minn.
1,002 million pounds
26 Rickenbacker International Columbus, Ohio
983 million pounds
27 General Edward Lawrence Logan International Boston
981 million pounds
28 Orlando International Orlando, Fla.
975 million pounds
29 Chicago/Rockford International Rockford, Ill.
923 million pounds
30 Fort Worth Alliance Fort Worth, Texas
897 million pounds
31 Bradley International Windsor Locks, Conn.
831 million pounds
32 Boeing Field/King County International Seattle
793 million pounds
33 San Antonio International San Antonio
792 million pounds
34 Detroit Metropolitan Wayne County Detroit
779 million pounds
35 San Diego International San Diego
640 million pounds
36 Kansas City InternationalKansas City, Mo.
617 million pounds
37 General Mitchell International Milwaukee, Wis.
614 million pounds
38 Reno/Tahoe International Reno, Nev.
613 million pounds
39 Tampa International Tampa, Fla.
587 million pounds
40 Albuquerque International Sunport Albuquerque, N.M.
576 million pounds
41 Baltimore/Washington International Thurgood Marshall Glen Burnie, Md.
537 million pounds
42 Rafael Hernandez Aquadilla, Puerto Rico
532 million pounds
43 El Paso International El Paso, Texas
510 million pounds
44 Piedmont Triad International Greensboro, N.C.
499 million pounds
45 Fort Lauderdale/Hollywood International Fort Lauderdale, Fla.
493 million pounds
46 Des Moines International Des Moines, Iowa
486 million pounds
47 Austin-Bergstrom International Austin, Texas
484 million pounds
48 Manchester-Boston Regional Londonderry, N.H.
483 million pounds
49 Charlotte/Douglas International Charlotte, N.C.
467 million pounds
50 Washington Dulles International Dulles, Va.
460 million pounds
51 Spokane International Spokane, Wash.
456 million pounds
52 Raleigh-Durham International Raleigh, N.C.
452 million pounds
52 Pittsburgh International Pittsburgh
452 million pounds
54 Laredo International Laredo, Texas
450 million pounds
55 Richmond International Highland Springs, Va.
432 million pounds
56 Huntsville International-Carl T. Jones Field Huntsville, Ala.
412 million pounds
57 Jacksonville International Jacksonville, Fla.
407 million pounds
58 Columbia Metropolitan Columbia, S.C.
407 million pounds
59 Cleveland-Hopkins International Cleveland
404 million pounds
60 McCarran International Las Vegas
402 million pounds
61 Eppley Airfield Omaha, Neb.
396 million pounds
62 Lehigh Valley International Allentown, Pa.
387 million pounds
63 Sacramento Mather Sacramento, Calif.
376 million pounds
64 Joe Foss Field Sioux Falls, S.D.
369 million pounds
65 Harrisburg International Harrisburg, Pa.
363 million pounds
66 St. Louis Lambert International St. Louis
353 million pounds
67 Lubbock Preston Smith Lubbock, Texas
352 million pounds
Top U.S. Cargo Airports
NOTE: Data is preliminary for calendar year 2016 from the Federal Aviation Administration Air Carrier Activity Information System as of June 2017, with the exception of data for Dallas-Fort Worth International and Ontario International, which are for 2015.
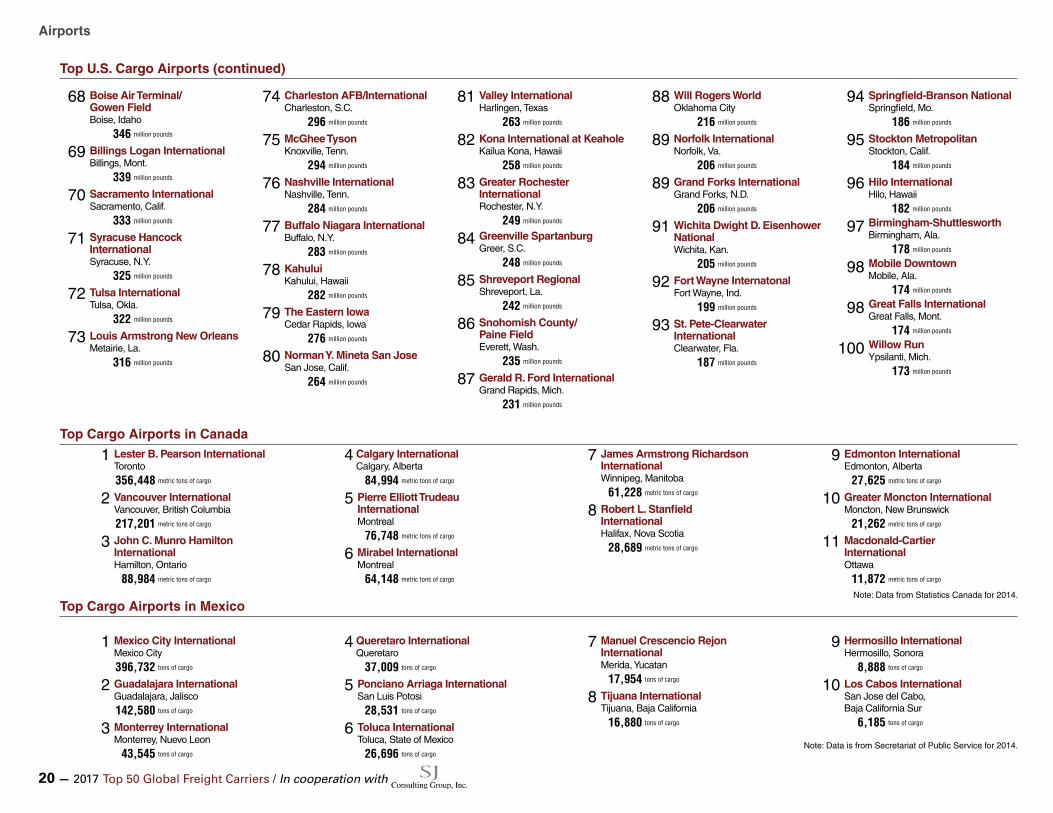
20 — 2017 Top 50 Global Freight Carriers / In cooperation with
Airports
Top U.S. Cargo Airports (continued)
68 Boise Air Terminal/ Gowen Field Boise, Idaho
346 million pounds
69 Billings Logan International Billings, Mont.
339 million pounds
70 Sacramento International Sacramento, Calif.
333 million pounds
71 Syracuse Hancock International Syracuse, N.Y.
325 million pounds
72 Tulsa International Tulsa, Okla.
322 million pounds
73 Louis Armstrong New Orleans Metairie, La.
316 million pounds
74 Charleston AFB/International Charleston, S.C.
296 million pounds
75 McGhee Tyson Knoxville, Tenn.
294 million pounds
76 Nashville International Nashville, Tenn.
284 million pounds
77 Buffalo Niagara International Buffalo, N.Y.
283 million pounds
78 Kahului Kahului, Hawaii
282 million pounds
79 The Eastern Iowa Cedar Rapids, Iowa
276 million pounds
80 Norman Y. Mineta San Jose San Jose, Calif.
264 million pounds
81 Valley International Harlingen, Texas
263 million pounds
82 Kona International at Keahole Kailua Kona, Hawaii
258 million pounds
83 Greater Rochester International Rochester, N.Y.
249 million pounds
84 Greenville Spartanburg Greer, S.C.
248 million pounds
85 Shreveport Regional Shreveport, La.
242 million pounds
86 Snohomish County/ Paine Field Everett, Wash.
235 million pounds
87 Gerald R. Ford International Grand Rapids, Mich.
231 million pounds
88 Will Rogers World Oklahoma City
216 million pounds
89 Norfolk International Norfolk, Va.
206 million pounds
89 Grand Forks International Grand Forks, N.D.
206 million pounds
91 Wichita Dwight D. Eisenhower National Wichita, Kan.
205 million pounds
92 Fort Wayne Internatonal Fort Wayne, Ind.
199 million pounds
93 St. Pete-Clearwater International Clearwater, Fla.
187 million pounds
94 Springfield-Branson National Springfield, Mo.
186 million pounds
95 Stockton Metropolitan Stockton, Calif.
184 million pounds
96 Hilo International Hilo, Hawaii
182 million pounds
97 Birmingham-Shuttlesworth Birmingham, Ala.
178 million pounds
98 Mobile Downtown Mobile, Ala.
174 million pounds
98 Great Falls International Great Falls, Mont.
174 million pounds
100 Willow Run Ypsilanti, Mich.
173 million pounds
Top Cargo Airports in Mexico
1 Mexico City InternationalMexico City
396,732 tons of cargo
2 Guadalajara InternationalGuadalajara, Jalisco
142,580 tons of cargo
3 Monterrey InternationalMonterrey, Nuevo Leon
43,545 tons of cargo
4 Queretaro InternationalQueretaro
37,009 tons of cargo
5 Ponciano Arriaga InternationalSan Luis Potosi
28,531 tons of cargo
6 Toluca InternationalToluca, State of Mexico
26,696 tons of cargo
7 Manuel Crescencio Rejon InternationalMerida, Yucatan
17,954 tons of cargo
8 Tijuana InternationalTijuana, Baja California
16,880 tons of cargo
9 Hermosillo InternationalHermosillo, Sonora
8,888 tons of cargo
10 Los Cabos InternationalSan Jose del Cabo, Baja California Sur
6,185 tons of cargo
Note: Data is from Secretariat of Public Service for 2014.
Top Cargo Airports in Canada
1 Lester B. Pearson International Toronto
356,448 metric tons of cargo
2 Vancouver International Vancouver, British Columbia
217,201 metric tons of cargo
3 John C. Munro Hamilton International Hamilton, Ontario
88,984 metric tons of cargo
4 Calgary International Calgary, Alberta
84,994 metric tons of cargo
5 Pierre Elliott Trudeau International Montreal
76,748 metric tons of cargo
6 Mirabel International Montreal
64,148 metric tons of cargo
7 James Armstrong Richardson International Winnipeg, Manitoba
61,228 metric tons of cargo
8 Robert L. Stanfield International Halifax, Nova Scotia
28,689 metric tons of cargo
9 Edmonton International Edmonton, Alberta
27,625 metric tons of cargo
10 Greater Moncton International Moncton, New Brunswick
21,262 metric tons of cargo
11 Macdonald-Cartier International Ottawa
11,872 metric tons of cargo
Note: Data from Statistics Canada for 2014.
2017 Top 50 Global Freight Carriers / In cooperation with — 21
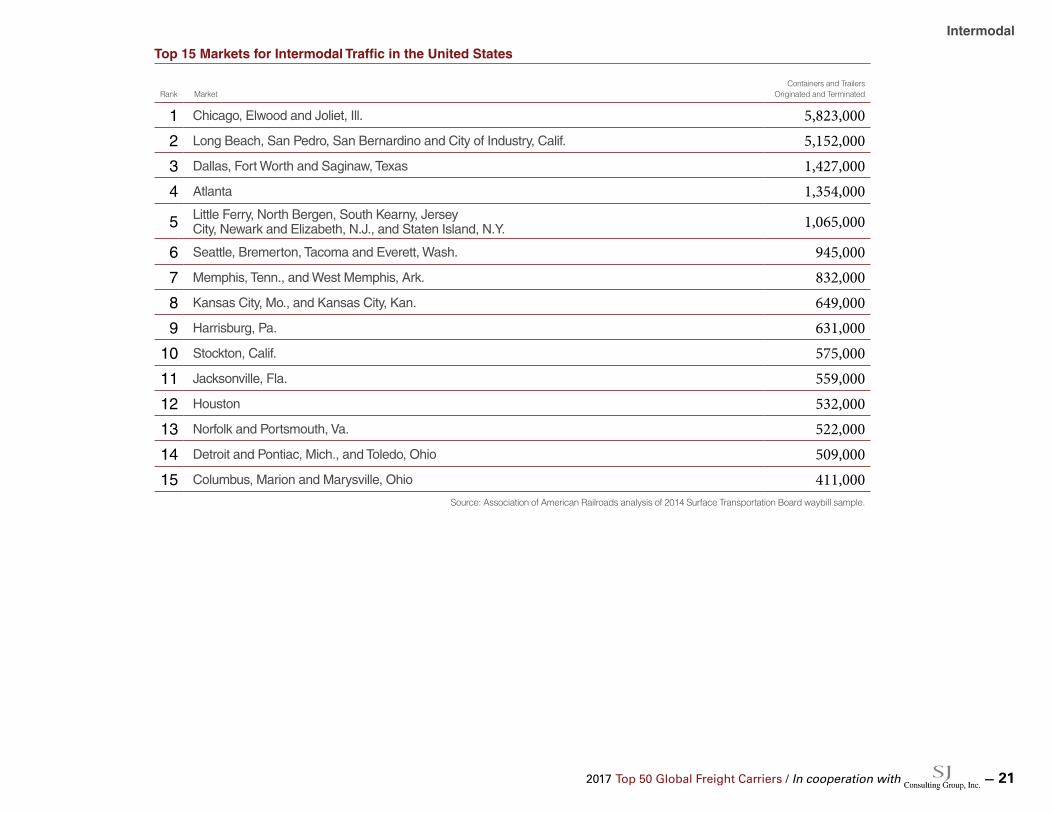
Intermodal
Rank MarketContainers and Trailers
Originated and Terminated
1 Chicago, Elwood and Joliet, Ill. 5,823,0002 Long Beach, San Pedro, San Bernardino and City of Industry, Calif. 5,152,0003 Dallas, Fort Worth and Saginaw, Texas 1,427,0004 Atlanta 1,354,000
5 Little Ferry, North Bergen, South Kearny, Jersey City, Newark and Elizabeth, N.J., and Staten Island, N.Y. 1,065,000
6 Seattle, Bremerton, Tacoma and Everett, Wash. 945,0007 Memphis, Tenn., and West Memphis, Ark. 832,0008 Kansas City, Mo., and Kansas City, Kan. 649,0009 Harrisburg, Pa. 631,000
10 Stockton, Calif. 575,00011 Jacksonville, Fla. 559,00012 Houston 532,00013 Norfolk and Portsmouth, Va. 522,00014 Detroit and Pontiac, Mich., and Toledo, Ohio 509,00015 Columbus, Marion and Marysville, Ohio 411,000
Source: Association of American Railroads analysis of 2014 Surface Transportation Board waybill sample.
Top 15 Markets for Intermodal Traffic in the United States


![Air-Conditioners - MyLinkDrivemeus1.mylinkdrive.com/files/PEAD-A24-42AA4_Install_WT06034X01_10-13.pdf6 [Fig. 8-3] AIndoor terminal block BEarth wire (green/yellow) CIndoor/outdoor](https://img.pdfslide.us/doc/110x75/5e78d2810de7c9077a7f4f35/air-conditioners-6-fig-8-3-aindoor-terminal-block-bearth-wire-greenyellow.jpg)