Embed Size (px)
Citation preview

Statistical Tests for Nonrandomness
By: Curtis B. Storlie
University of New Mexico
E-mail:[email protected]
Curt Storlie Statistical Tests for Nonrandomness

Outline
◮ Tests Based on Gridding
◮ Common Means (CMN)◮ Common Locations (CL)◮ Common Variances (CV)◮ Chi Square Test for Statistical Independence (SI)
◮ Flexible Grid-Free Tests◮ Linear and Quadratic Regression◮ Rank Correlation Coefficient Test◮ Squared Rank Differences Test (SRD)
◮ Combining Statistical Tests
◮ Reliability of Results, TDCC
Curt Storlie Statistical Tests for Nonrandomness
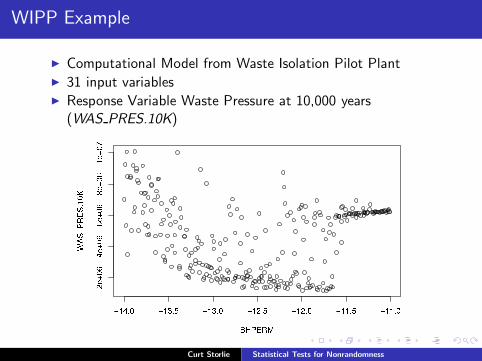
WIPP Example
◮ Computational Model from Waste Isolation Pilot Plant◮ 31 input variables◮ Response Variable Waste Pressure at 10,000 years
(WAS PRES.10K)
Curt Storlie Statistical Tests for Nonrandomness

Common Means (CMN) Test
◮ Divide all of the values of xj into M disjoint classes (usually atequally spaced quantiles along the x-axis).
◮ For discrete xj , define classes for each of the distinct values.◮ Then perform an analysis of variance (ANOVA) to determine
if y has a different mean across these classes.
Curt Storlie Statistical Tests for Nonrandomness
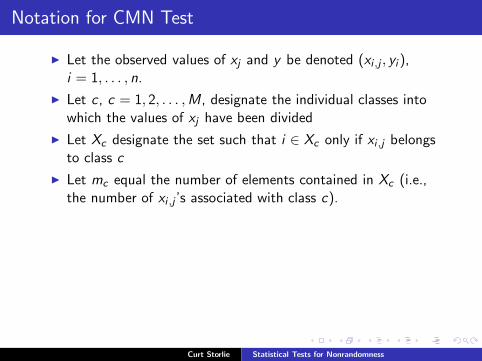
Notation for CMN Test
◮ Let the observed values of xj and y be denoted (xi ,j , yi ),i = 1, . . . , n.
◮ Let c , c = 1, 2, . . . ,M, designate the individual classes intowhich the values of xj have been divided
◮ Let Xc designate the set such that i ∈ Xc only if xi ,j belongsto class c
◮ Let mc equal the number of elements contained in Xc (i.e.,the number of xi ,j ’s associated with class c).
Curt Storlie Statistical Tests for Nonrandomness
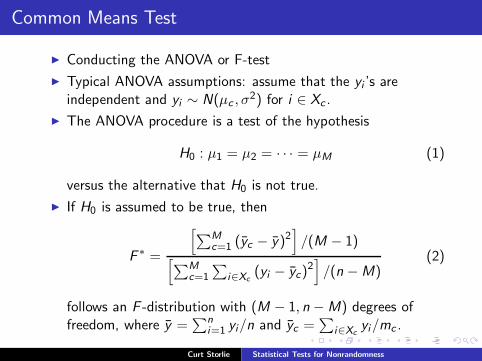
Common Means Test
◮ Conducting the ANOVA or F-test
◮ Typical ANOVA assumptions: assume that the yi ’s areindependent and yi ∼ N(µc , σ
2) for i ∈ Xc .
◮ The ANOVA procedure is a test of the hypothesis
H0 : µ1 = µ2 = · · · = µM (1)
versus the alternative that H0 is not true.
◮ If H0 is assumed to be true, then
F ∗ =
[
∑Mc=1 (yc − y)2
]
/(M − 1)[
∑Mc=1
∑
i∈Xc(yi − yc)
2]
/(n − M)(2)
follows an F -distribution with (M − 1, n − M) degrees offreedom, where y =
∑ni=1 yi/n and yc =
∑
i∈Xcyi/mc .
Curt Storlie Statistical Tests for Nonrandomness

Common Means Test
◮ Let Fa,b denote a random variable from an F distribution witha and b degrees of freedom.
◮ The p-value for the test of the null hypothesis H0 is given by
p = P [FM−1,n−M > F ∗] (3)
◮ A small p-value suggests that at least one of the µc is notequal to the rest. Hence, the observed pattern involving xj
and y did not arise by chance and xj has an effect on thebehavior of y .
◮ A level of significance α is specified a-priori (e.g., α = .05). Ifp < α, then we conclude xj has an effect on the behavior of y .
◮ Relative importance of the xj ’s can be assessed by rankingthem according to their respective p-values (smaller thep-value, the more important).
Curt Storlie Statistical Tests for Nonrandomness

Common Means Test
◮ CMN Test Results on WAS PRES.10K output
Input p-value
BHPERM 0.0000
HALCOMP 0.0000
HALPRM 0.0000
BPCOMP 0.0004
ANHPRM 0.0019
ANHCOMP 0.0212
Curt Storlie Statistical Tests for Nonrandomness

Common Locations (CL) Test
◮ CL test is the Kruskal-Wallis test for common medians amonggroups.
◮ Groups are defined by the same classes of xj values as in theCMN test above.
◮ Assume that the yi ’s are independent and identicallydistributed with median(yi) = ηc for i ∈ Xc , c = 1, . . . ,M. Itis also assumed that the shape and scale of the distribution ofthe yi ’s is the same across all M groups.
◮ The CL procedure is then a test of the hypothesis
H0 : η1 = η2 = · · · = ηM (4)
versus the alternative that H0 is not true.
Curt Storlie Statistical Tests for Nonrandomness
Common Locations Test
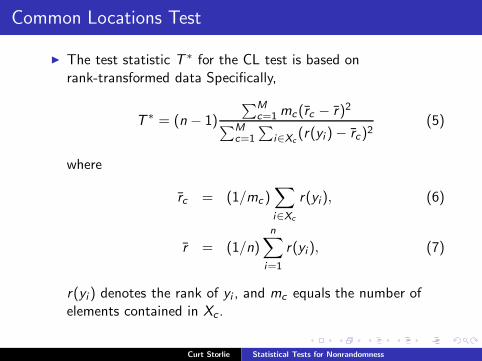
◮ The test statistic T ∗ for the CL test is based onrank-transformed data Specifically,
T ∗ = (n − 1)
∑Mc=1 mc (rc − r)2
∑Mc=1
∑
i∈Xc(r(yi ) − rc)2
(5)
where
rc = (1/mc )∑
i∈Xc
r(yi), (6)
r = (1/n)
n∑
i=1
r(yi ), (7)
r(yi ) denotes the rank of yi , and mc equals the number ofelements contained in Xc .
Curt Storlie Statistical Tests for Nonrandomness

Common Locations Test
◮ If all of the y values have the same distribution, then T ∗
approximately follows a χ2M−1 distribution.
◮ The p-value for this test is
p = P [χ2M−1 > T ∗]. (8)
◮ A small p-value indicates that y has a different distributiondepending on which of the groups xj is in. Since it wasassumed that the shape and scale of the distribution of y
across each of the M groups is the same, the difference mustbe between the locations (medians).
◮ Even without the the shape and scale assumption though, asmall p-value indicates that xj has some effect on y (locationshift or otherwise).
Curt Storlie Statistical Tests for Nonrandomness

Common Locations Test
◮ CMN and CL Test Results on WAS PRES.10K output
CMN Results CL Results
Input p-value Input p-value
BHPERM 0.0000 BHPERM 0.0000
HALCOMP 0.0000 HALCOMP 0.0000
HALPRM 0.0000 HALPRM 0.0000
BPCOMP 0.0004 BPCOMP 0.0002
ANHPRM 0.0019 ANHPRM 0.0005
ANHCOMP 0.0212 ANHCOMP 0.0063
BPPRM 0.0403
Curt Storlie Statistical Tests for Nonrandomness

Common Variances Tests
◮ Define groups by the same classes of xj values as in the CMNand CL tests above.
◮ Any test for common variances (Levene’s Test, Bartlett’sTest, etc.) can be used to test whether or not the variance ofy is the same across xj .
◮ Two pitfalls to a CV test◮ When the distribution of y changes with xj it tends to do so
more dramatically by location shifts than by changes in higherorder moments.
◮ Variances are much harder to estimate than Means. So evenwhen the variance shift is pronounced, it is harder to detect.
◮ One possibility is to combine the CMN and CV test (or CLand CV test) into one test using the Bonferroni Inequality.
Curt Storlie Statistical Tests for Nonrandomness
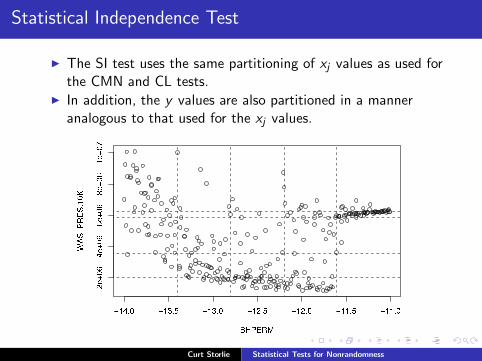
Statistical Independence Test
◮ The SI test uses the same partitioning of xj values as used forthe CMN and CL tests.
◮ In addition, the y values are also partitioned in a manneranalogous to that used for the xj values.
Curt Storlie Statistical Tests for Nonrandomness

Statistical Independence Test
◮ The SI test makes use of the χ2-test for contingency tables,to indicate if the pattern appearing in a scatterplot appears tobe nonrandom.
◮ Let r , r = 1, 2, . . . ,L, designate the individual classes intowhich the values of y are divided
◮ Let Yr designate the set such that i ∈ Yr only if yi belongs toclass r
◮ Let lr equal the number of elements contained in Yr (i.e., thenumber of yi ’s associated with class r).
◮ The partitioning of xj and y into M and L classes,respectively, in turn partitions (xj , y) into M × L classes.
◮ Let Or ,c denote the set such that i ∈ Or ,c only if i ∈ Xc andalso i ∈ Yr , and let kr ,c equal the number of elementscontained in Or ,c .
Curt Storlie Statistical Tests for Nonrandomness

Statistical Independence Test
◮ The SI procedure is a test of the hypothesis
H0 : y is independent of xj . (9)
versus the alternative that H0 is not true.
◮ Under the assumption of H0, y has the same distribution ineach of the xj classes.
◮ If xj and y are independent,
Er ,c = (lr/n)(mc/n)n = lrmc/n (10)
is an estimate of the expected number of observations (xj , y)that should fall in class (r , c).
Curt Storlie Statistical Tests for Nonrandomness

Statistical Independence Test
◮ Define the test statistic
T ∗ =M
∑
c=1
L∑
r=1
(kr ,c − Er ,c )2
Er ,c(11)
◮ Asymptotically, T ∗ follows a χ2(M−1)(L−1) distribution when xj
and y are independent. Since large values of T ∗ indicateevidence against the independence hypothesis, the p-value canbe obtained as
p = P [χ2(M−1)(L−1) > T ∗] (12)
◮ A small p-value indicates that xj and y are likely notindependent.
Curt Storlie Statistical Tests for Nonrandomness

Statistical Independence Test
◮ CMN, CL, and SI Test Results on WAS PRES.10K output
CMN Results CL Results SI Results
Input p-value Input p-value Input p-value
BHPERM 0.0000 BHPERM 0.0000 BHPERM 0.0000
HALCOMP 0.0000 HALCOMP 0.0000 HALCOMP 0.0000
HALPRM 0.0000 HALPRM 0.0000 HALPRM 0.0001
BPCOMP 0.0004 BPCOMP 0.0002 WGRCOR 0.0026
ANHPRM 0.0019 ANHPRM 0.0005 BPCOMP 0.0029
ANHCOMP 0.0212 ANHCOMP 0.0063 ANHPRM 0.0189
BPPRM 0.0403 WGRMICH 0.0331
WRBRNSAT 0.0495
Curt Storlie Statistical Tests for Nonrandomness

WAS PRES.10K vs. WGRCOR Scatterplot
Curt Storlie Statistical Tests for Nonrandomness

Outline
◮ Tests Based on Gridding
◮ Common Means (CMN)◮ Common Locations (CL)◮ Common Variances (CV)◮ Chi Square Test for Statistical Independence (SI)
◮ Flexible Grid-Free Tests◮ Linear and Quadratic Regression◮ Rank Correlation Coefficient Test◮ Squared Rank Differences Test (SRD)
◮ Combining Statistical Tests
◮ Reliability of Results, TDCC
Curt Storlie Statistical Tests for Nonrandomness

Linear & Quadratic Regression
◮ The regression (REG) test for nonrandomness in scatterplotsis performed by fitting simple linear regression of the y on xj .
◮ The p-value for the test is obtained from the test of nonzeroslope.
◮ the quadratic regression (QREG) test performs a quadraticregression of y on xj . That is, the multiple regression model
yi = β0 + β1xi + β2x2i + εi (13)
is fit to the data.
◮ The p-value is obtained by testing the full model forsignificance (i.e., testing the hypothesis β1 = β2 = 0 versusthe alternative that either β1 6= 0 or β2 6= 0).
Curt Storlie Statistical Tests for Nonrandomness

Linear & Quadratic Regression
◮ REG and QREG Test Results on WAS PRES.10K output
REG Results QREG Results
Input p-value Input p-value
HALCOMP 0.0000 BHPERM 0.0000
HALPRM 0.0000 HALCOMP 0.0000
BPCOMP 0.0000 HALPRM 0.0000
ANHPRM 0.0001 ANHPRM 0.0001
HALPOR 0.0031 BPCOMP 0.0001
BPMAP 0.0045 BPMAP 0.0044
BPPRM 0.0046 HALPOR 0.0121
ANHCOMP 0.0166 BPPRM 0.0164
Curt Storlie Statistical Tests for Nonrandomness

Linear & Quadratic Regression
◮ Fitted linear regression line for WAS PRES.10K versusBHPERM (blue line), p-val=0.34
◮ Fitted quadratic regression line for WAS PRES.10K versusBHPERM (red line), p-val=0.00
Curt Storlie Statistical Tests for Nonrandomness

Rank Correlation Coefficient Test
◮ The rank correlation coefficient (RCC) test is based on therank (or Spearman) correlation coefficient
r =
∑ni=1[r(xi ,j) − (n + 1)/2][r(yi ) − (n + 1)/2]
{∑n
i=1[r(xi ,j) − (n + 1)/2]}1/2{∑n
i=1[r(yi ) − (n + 1)/2]}1/2
(14)where r(xi ,j) and r(yi ) are the ranks associated xj and y forsample element i .
Curt Storlie Statistical Tests for Nonrandomness

Rank Correlation Coefficient Test
◮ Under the null hypothesis of no monotonic relationshipbetween xj and y , the quantity r is asymptotically distributedas a student’s t random variable with n − 2 degrees offreedom.
◮ Value of r which are large in magnitude (absolute value)indicate that the the underlying rank correlation may bedifferent from zero and there is a relationship between xj andy .
◮ Thus, the p-value to test the null hypotheses is given by
p = P(|tn−2| > |r |) = 2P(tn−2 > |r |). (15)
Curt Storlie Statistical Tests for Nonrandomness

Squared Rank Differences Test
◮ The Squared Rank Differences (SRD) Test is effective atidentifying linear and very general nonlinear patterns inanalysis results.
◮ the SRD test does not involve the specification of a grid or aparametric model between y and x .
◮ The SRD test is based on the statistic
Q =n−1∑
i=1
(ri+1,j − ri ,j)2 (16)
where ri ,j , i = 1, 2, . . . , n, is the rank of y obtained with thesample element in which xj has rank i .
Curt Storlie Statistical Tests for Nonrandomness

Squared Rank Differences Test
◮ Under the null hypothesis of no relationship between xj and y ,the test statistic
S∗ =Q − n(n2 − 1)/6
n5/2/6(17)
approximately follows a standard normal distribution forn > 40. Small values of Q (and subsequently small values ofS) indicate similar ranks among y values with similar xj
values. This is inconsistent with the null hypothesis ofindependence between xj and y . Thus, a p-value can beobtained as
p = P(Z < S∗) (18)
where Z is a standard normal random variable.
Curt Storlie Statistical Tests for Nonrandomness

Squared Rank Differences Test
◮ SRD can be combined with RCC to produce a hybridSRD/RCC which can perform better than either test alone.
◮ The SRD/RCC test is obtained from combining the p-valuesof the SRD and RCC tests, see Hora ?? for details.
RCC Results SRD Results SRD/RCC Results
Input p-value Input p-value Input p-value
HALCOMP 0.0000 BHPERM 0.0000 BHPERM 0.0000
HALPRM 0.0000 SHBCEXP 0.0269 HALPRM 0.0000
BPCOMP 0.0001 HALCOMP 0.0000
ANHPRM 0.0017 BPCOMP 0.0001
HALPOR 0.0032 ANHPRM 0.0011
BPPRM 0.0086 HALPOR 0.0037
BPMAP 0.0086 ANHCOMP 0.0082
ANHCOMP 0.0127 BPMAP 0.0149
BPPRM 0.0305
Curt Storlie Statistical Tests for Nonrandomness

Outline
◮ Tests Based on Gridding
◮ Common Means (CMN)◮ Common Locations (CL)◮ Common Variances (CV)◮ Chi Square Test for Statistical Independence (SI)
◮ Flexible Grid-Free Tests◮ Linear and Quadratic Regression◮ Rank Correlation Coefficient Test◮ Squared Rank Differences Test (SRD)
◮ Combining Statistical Tests
◮ Reliability of Results, TDCC
Curt Storlie Statistical Tests for Nonrandomness

Top Down Coefficient of Concordance (TDCC)
◮ The Top Down Coefficient of Concordance (TDCC) wasintroduced as a way to quantify the level of agreementbetween different sensitivity analysis procedures.
◮ Assume that there are K SA procedures used to rank theimportance of the inputs x on the response y .
◮ For example, suppose we use the CMN, SI, and SRD/PCCtests and rank each of the input variables by their p-values, inascending order.
◮ The TDCC measure emphasizes agreement between themultiple rankings assigned to important variables andde-emphasizes disagreement between rankings assigned to lessimportant/unimportant variables.
Curt Storlie Statistical Tests for Nonrandomness
Top Down Coefficient of Concordance (TDCC)
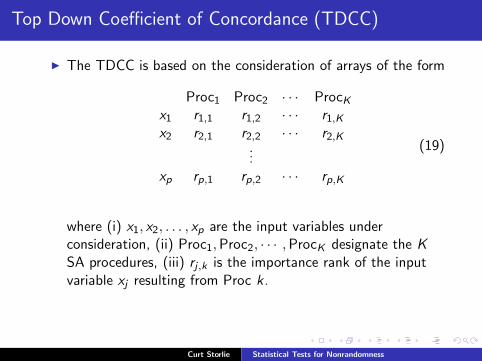
◮ The TDCC is based on the consideration of arrays of the form
Proc1 Proc2 · · · ProcK
x1 r1,1 r1,2 · · · r1,K
x2 r2,1 r2,2 · · · r2,K...
xp rp,1 rp,2 · · · rp,K
(19)
where (i) x1, x2, . . . , xp are the input variables underconsideration, (ii) Proc1,Proc2, · · · ,ProcK designate the K
SA procedures, (iii) rj ,k is the importance rank of the inputvariable xj resulting from Proc k.
Curt Storlie Statistical Tests for Nonrandomness

Top Down Coefficient of Concordance (TDCC)
◮ The TDCC measure uses corresponding Savage scores ssj ,k ,where
ssj ,k =
p∑
j=rj,k
1
j(20)
(average Savage scores are assigned in the event of ties).◮ Notice that the Savage scores are large (∼ 2) for the smallest
ranks and very small (1/p) for the largest ranks.◮ The TDCC is defined by
CT =
∑pj=1
(
∑Kk=1 ssj ,k
)2− pK 2
K 2(
p −∑p
j=11j
) . (21)
◮ The TDCC is a number between 0 and 1 where 1 indicatesperfect agreement between the respective ranks of the SAprocedures.
Curt Storlie Statistical Tests for Nonrandomness
Top Down Coefficient of Concordance (TDCC)
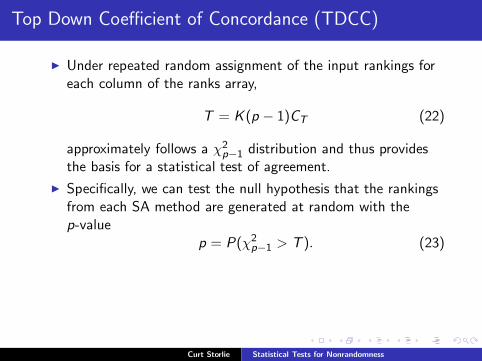
◮ Under repeated random assignment of the input rankings foreach column of the ranks array,
T = K (p − 1)CT (22)
approximately follows a χ2p−1 distribution and thus provides
the basis for a statistical test of agreement.
◮ Specifically, we can test the null hypothesis that the rankingsfrom each SA method are generated at random with thep-value
p = P(χ2p−1 > T ). (23)
Curt Storlie Statistical Tests for Nonrandomness

Top Down Coefficient of Concordance (TDCC)
◮ TDCC can also be used to test for reproducibility of sensitivityresults obtained when using one particular SA procedure.
◮ To accomplish this, instead of using one sample of size n, weconsider R replicated samples of size n. This is the case withthe WIPP data example we have been using (i.e. 3 LHSsamples of size n = 100 to make a total sample of size 300).
◮ Suppose we apply one particular SA method (e.g. CMN) toeach of the R samples. Each of the R results produce aranking of the order of importance for the inputs.
◮ These R sets of ranks are then treated the same as the K setsof ranks from the various SA procedures to produce theTDCC value.
◮ A large TDCC indicates that the results from this particularSA procedure are “trustworthy” in the sense that they will notchange that much from one sample to another.
Curt Storlie Statistical Tests for Nonrandomness
Summary & Conclusions
◮ Scatterplot Tests can capture very general nonlinearrelationships between x and y
◮ Scatterplot Test Results can be ranked for variable importancebased on p-value, but this is not all that satisfying. Ideally amore quantitative measure of relative importance is desired(like variance decomposition).
◮ Scatterplot Tests cannot assess the strength of interactions
◮ The p-values for these tests are based on distributionalassumptions that in many cases do not hold. Permutationp-values can be used with any of these tests to improve theaccuracy of the p-values.
Curt Storlie Statistical Tests for Nonrandomness

References
1. W.J. Conover. Practical Nonparametric Statistics. New York, NY:John Wiley & Sons, 2 edition, 1980.
2. S.C. Hora and J.C. Helton. A distribution-free test for therelationship between model input and output when using Latinhypercube sampling. Reliability Engineering and System Safety,79:333339, 1996.
3. R.L. Iman and W.J. Conover. A measure of top-down correlation.Technometrics, 29:351357, 1987.
4. J.C. Helton, J.D. Johnson, C.J. Sallaberry, and C.B. Storlie. Surveyof sampling-based methods for uncertainty and sensitivity analysis.Reliability Engineering and System Safety, 91:11751209, 2006.
Curt Storlie Statistical Tests for Nonrandomness