Embed Size (px)
Citation preview

by Ciro Fiorillo, CTA - NFPCSP
National Food Policy Capacity Strengthening ProgramNational Food Policy Capacity Strengthening Program
Research in support of the National Food Policy:Results of challenge fund research
and review of on-going projects
Wednesday, 18 February 2009
Workshop’s context and objectives

Rice ProductionRice Production Agriculture has proved resilient to the combined effect of flood, cyclone and high costs of fuel and fertilizers with an exceptional response by farmers to the high food prices.
BORO +18.7% AUS + 25.2% AMAN + 18.1%
-
5,000
10,000
15,000
20,000
25,000
30,000
35,000
1972
-73
1974
-75
1976
-77
1978
-79
1980
-81
1982
-83
1984
-85
1986
-87
1988
-89
1990
-91
1992
-93
1994
-95
1996
-97
1998
-99
2000
-01
2002
-03
2004
-05
2006
-07
2008
-09
Tho
usan
d M
T
Total rice
Aus
Aman
Boro
estimate

UndernourishmentUndernourishment
FAO, SOFI, 2008
• Long term positive trend reverted by 2007/08 crises• FAO/WFP estimated impact of food crisis:
- Consuming less than 2,122 kcal/day: +7.5Million- Consuming less than 1,805 kcal/day: +6.9Million
27%
40%36%
40
51
42
0
10
20
30
40
50
60
1990-92 1995-97 2003-05
num
ber
10
20
30
40
50
60
perc
enta
ge
Prevalence Number

Children under 5
0
1020
3040
50
6070
80
pe
rce
nta
ge
Stunting Underweight
Underweight and StuntingUnderweight and Stunting
2007 data NIPORT-BDHS ; Other years: HKI/IPHN-NSP
Estimated impacts of price increase from 2006 to 2008: • Wasting + 49.7%• Underweight + 23.1%
(BRAC, 2009)
2007
Stunting 36%
Underweight 46%

Supply-Utilization Balance 2008-09Supply-Utilization Balance 2008-09
Scenario 1 - DAE’s optimistic targets (Production: DAE targets except Aus, BBS official figure; Imports: actual as of 12th Feb 544 + NFPCSP estimates for the rest of the year)
Scenario 2 - NFPCSP more conservative calculations (Production: Aus is official BBS figure; For Aman and Boro, DAE target growth rate 07/08 to 08/09 applied to actual 07/08 figures; Imports: actual as of 14 th Jan 544 + NFPCSP estimates for the rest of the year)
Even with a pessimistic scenario, 2008/09 ends with a substantial stock increase Scenario 1 Scenario 2
TOTAL SUPPLY (in thousand tons) 33,915 31,434Production 32,915 30,434
Aus 1,894 1,894Aman 13,009 11,410Boro 18,012 17,130
Total imports, including food aid 1,000 1,000TOTAL UTILIZATION 33,915 31,434Annual Food Use 25,630 25,630
per capita apparent daily consumption (grams) 474.9 474.9population (thousands) 147,860 147,860
Other uses (12% of production) 3,950 3,652Estimated annual stock increase 4,335 2,152

Food security in Bangladesh:Food security in Bangladesh:dealing with chronic food insecuritydealing with chronic food insecurity
• Substantial progress in production increase, poverty and undernourishment reduction, BUT:
- large section of the population still affected by chronic food insecurity
- Substantial deterioration of the nutritional status of the poor during price hike, with some irreversible effects
• Agriculture proved to be resilient to natural and market shocks but vulnerable population needs support
•Bangladesh is achieving rice self sufficiency but no reason for complacency
Source: MISMSource: MISM
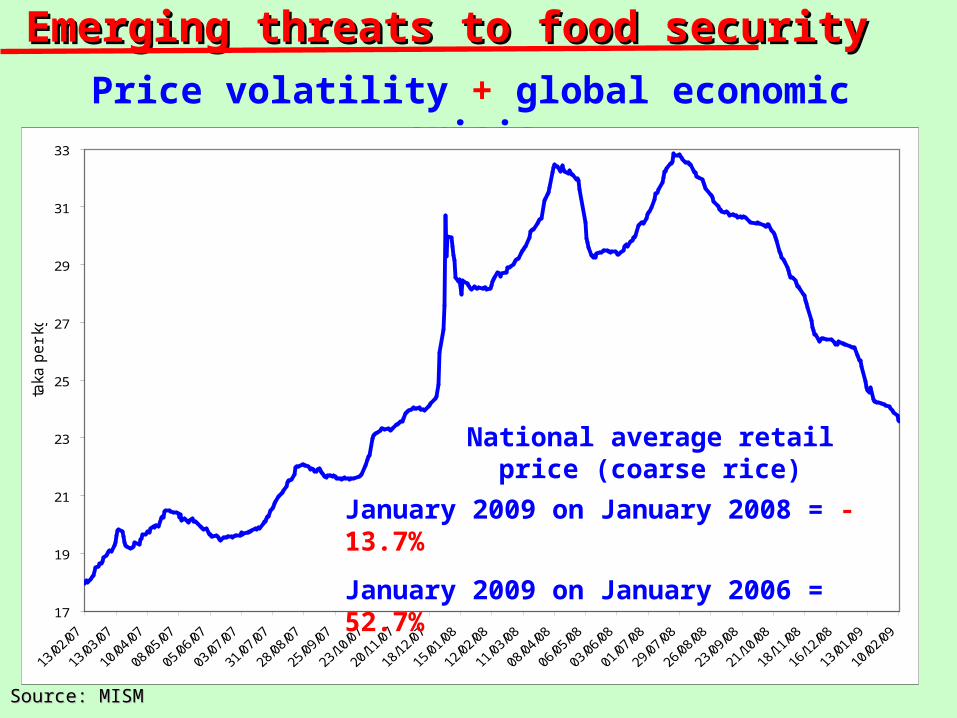
Emerging threats to food securityEmerging threats to food security
Price volatility + global economic crisis
17
19
21
23
25
27
29
31
33
taka
pe
r kg
National average retail price (coarse rice)
January 2009 on January 2008 = -13.7%
January 2009 on January 2006 = 52.7%

Emerging threats to food securityEmerging threats to food security
Price volatility
• low food prices good for consumers but reduce production incentives: risk of domestic and global prices shooting up again
• reduction of global fertilizer/fuel prices not fully reflected domestically due to subsidies, while food prices are more responsive profitability to decline with negative effect on production
Global economic crisis
• reduced exports and remittances to impact on income, employment and fiscal revenues
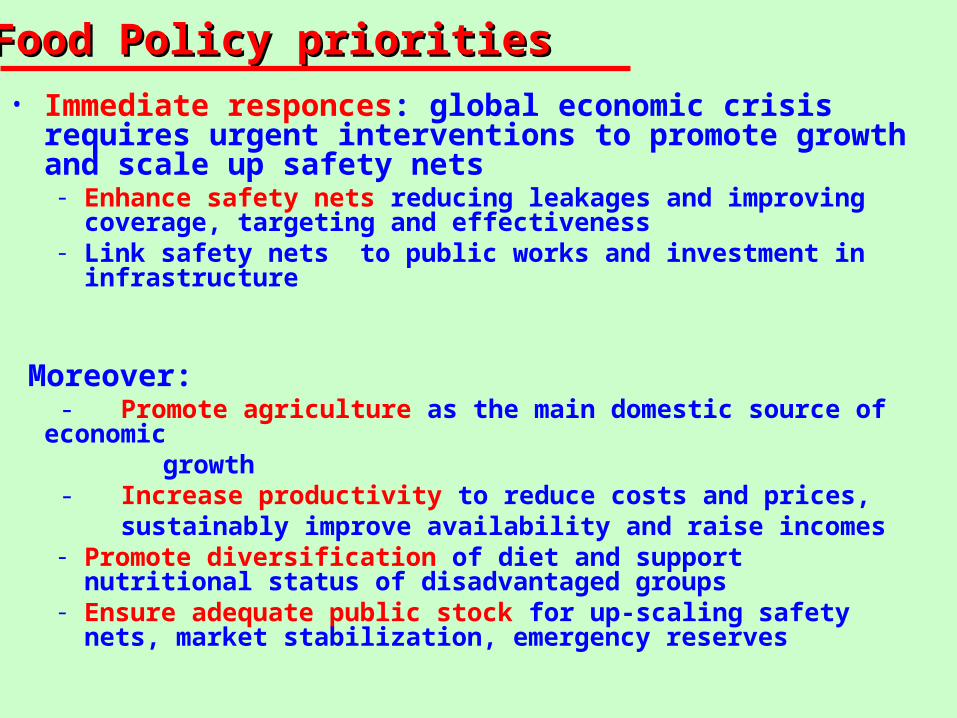
Food Policy prioritiesFood Policy priorities• Immediate responces: global economic crisis requires
urgent interventions to promote growth and scale up safety nets- Enhance safety nets reducing leakages and improving coverage,
targeting and effectiveness- Link safety nets to public works and investment in infrastructure
Moreover: - Promote agriculture as the main domestic source of economic
growth - Increase productivity to reduce costs and prices, sustainably improve availability and raise incomes- Promote diversification of diet and support nutritional status of
disadvantaged groups- Ensure adequate public stock for up-scaling safety nets, market
stabilization, emergency reserves

Food Policy ApproachFood Policy Approach
Achieving MDG 1 and the World Food Summit target will require renewed and intensified policy commitment
FOOD SECURITY POLICIES should:
• be comprehensive including:
- availability and stability of supply- economic, social and physical access
- food utilization for safe and balanced nutrition
• combine short term and structural responses, i.e. twin track approach: direct transfer should be linked to graduation and development
• flexibly adjust to the changing market situation

The National Food Policy The National Food Policy
a comprehensive framework for food security
interventions
encompassing
• Availability, Adequate and stable supply of safe and nutritious food
• Access Increased purchasing power and access to food by the poor through safety nets
• Nutrition for all individuals, especially women and children
NFP Plan of Action (2008-2015) approved by the Food Planning and Monitoring Committee
(FPMC) on 5 August 2008….

In order to be effective,
policy decisions on food security needs to be based on:
• reliable, complete and timely information• analysis of the information relevant to policy
making• building capacity and institutions • scientific knowledge from research• dialog with stakeholders in civil society
Informed policy making for FSInformed policy making for FS
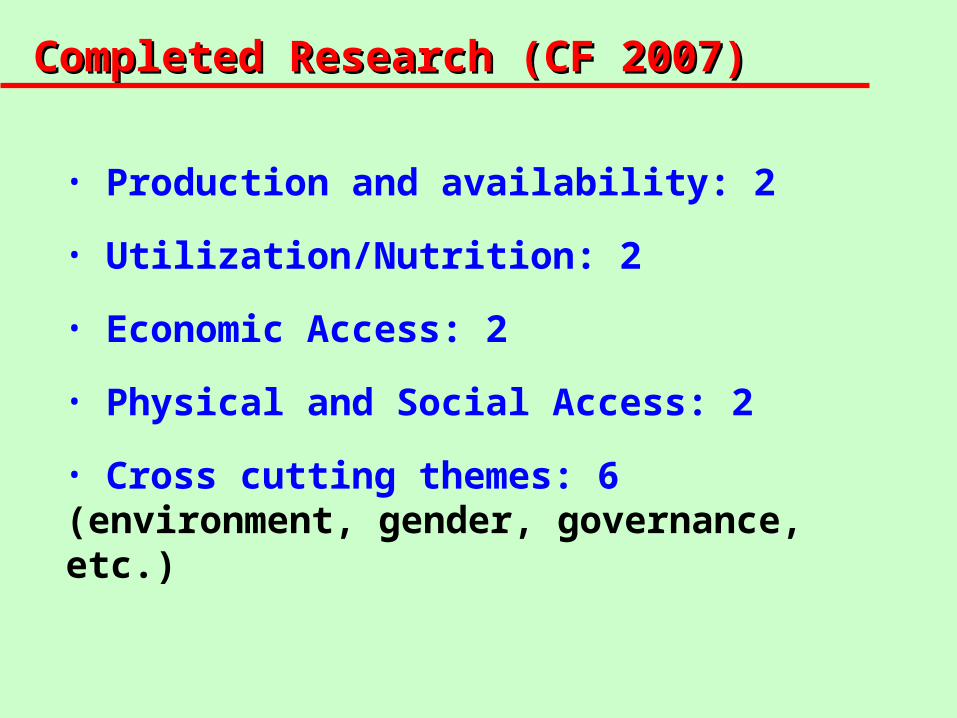
• Production and availability: 2
• Utilization/Nutrition: 2
• Economic Access: 2
• Physical and Social Access: 2
• Cross cutting themes: 6 (environment, gender, governance, etc.)
Completed Research (CF 2007)Completed Research (CF 2007)

• Production and availability
2 PR (2007), 5 CF (2008) & 5 PR (2008)
• Utilization/Nutrition
1 PR (2007), 1CF & 1 PR (2008)
• Economic Access
3 PR (2007) & 5 CF (2008)
• Physical and Social Access
3 PR (2008)
• Cross cutting themes
2 PR (2007) & 2 PR (2008)
On-going ResearchOn-going Research

POLICY RECOMMENDATIONS - POLICY RECOMMENDATIONS - AvailabilityAvailability
• Reorganize fertilizer distribution and promote balanced use• Improve farmers and traders access to bank credit• Promote tolerant (flood, submergence, salt) rice varieties• Establish land zoning to grow HYV rice• Regulate fishing to ensure sustainability• Facilitate co-existence of rice and shrimp farming• Ensure seed standards and promote local varieties • Provide regulations and training for improved use of
agrochemicals• Develop market infrastructures, e.g., fish landing, transport

• Improve planning and designing of safety net programs based on ex ante assessment of feasibility
• Strengthen geographical and socio economic targeting, focusing on extremely vulnerable in more remote areas
• Strengthen community participation in implementation to improve local governance
• Reinforce monitoring systems• Improve transparency to reduce leakages• Provide adequate training to GoB officials for
managing safety nets at field level
POLICY RECOMMENDATIONS – POLICY RECOMMENDATIONS – social accesssocial access

• Adopt and enforce food safety regulations • Establish and promote quality standard • Promote safe farming of safe food• Promote awareness of the food-chain linkages to
improve food quality and safety • Use of germ plasm cultivars of higher nutritional
quality, while developing new varieties with low glycemic index
POLICY RECOMMENDATIONS - POLICY RECOMMENDATIONS - nutritionnutrition

• Discuss findings of 14 completed CF research with a focus on policy implications
• Present through poster paper preliminary findings of 8 PR research undertaken at the end of 2007
• Present through poster papers objectives and methodologies of new research initiated in late 2008
• Promote dialogue among researchers and between researchers and policy makers in support of decision making
Purpose of the WorkshopPurpose of the Workshop

Thank you !

Developed by 12 government agencies led by the FPMU through a wide consultation process involving main
Government actors and other stakeholders
26 areas of intervention and 314 actions
Fully consistent with the PRSP and other relevant policies (e.g., agricultural policy), the PoA provides:
• a framework to coordinate government interventions
• a reference for development support to food security to be in line with the Paris Declaration on aid effectiveness (alignment, ownership, etc.)
The NFP Plan of ActionThe NFP Plan of Action
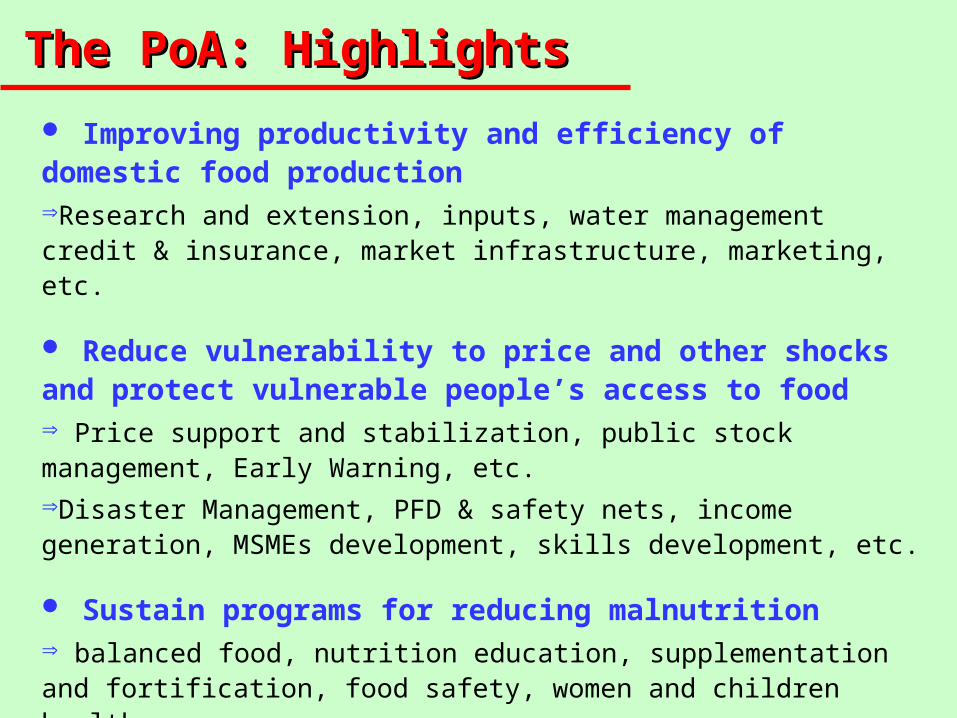
The PoA: HighlightsThe PoA: Highlights
Improving productivity and efficiency of domestic food productionResearch and extension, inputs, water management credit & insurance, market infrastructure, marketing, etc.
Reduce vulnerability to price and other shocks and protect vulnerable people’s access to food Price support and stabilization, public stock management, Early Warning, etc.Disaster Management, PFD & safety nets, income generation, MSMEs development, skills development, etc.
Sustain programs for reducing malnutrition balanced food, nutrition education, supplementation and fortification, food safety, women and children health

NFP STRATEGY AND POLICY RECOMMENDATIONS
Strategy 1.2.: Efficient food markets
Development of fish marketing systems (tilapia)
Need for developing modern infrastructure for fish landing, transport and preservation

Donors:
PARTNERS
FAO:
Implementing Technical Agency
GoB:
• FPMU
•11 Ministries/Dept
NFPCSP: Project Formulation and PartnersNFPCSP: Project Formulation and Partners
• developed alongside the National Food Policy
• Initially: 3 donors for a 5 year project
Now: Phase I : 2 donors for 3 years (till end 2008)Phase II: 2 donors for 4 years (till end 2012)
15
17
19
21
23
25
27
29
31
33
35
01-J
an
15-J
an
29-J
an
12-F
eb
26-F
eb
12-M
ar
26-M
ar
09-A
pr
23-A
pr
07-M
ay
21-M
ay
04-J
un
18-J
un
02-J
ul
16-J
ul
30-J
ul
13-A
ug
27-A
ug
10-S
ep
24-S
ep
08-O
ct
22-O
ct
05-N
ov
19-N
ov
03-D
ec
17-D
ec
31-D
ec
Tak
a p
er k
g
2007
2008
2009
11-Feb-16.7% 9-May
44.2%10-Apr64.5%
23-Jul63.4%
20-Aug44.4%
14-Sep41.1%
25-Nov12.9%
25-Oct33.3%
11-D
ec10
.1%
31-D
ec 5
.3%
31-Jan-09-14.4%
25-Nov12.9%
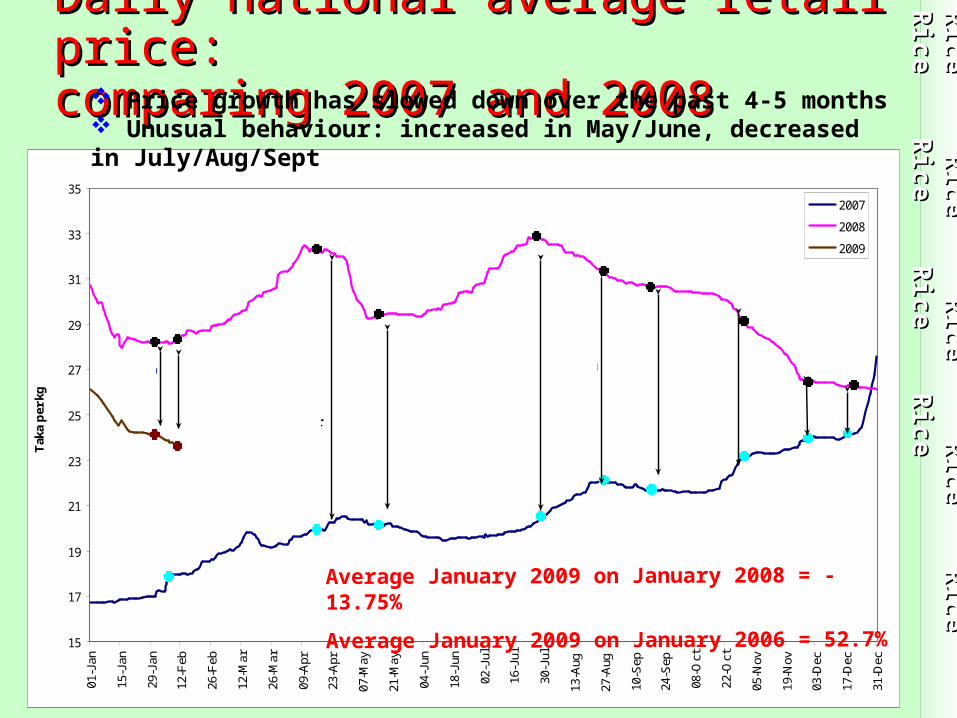
Daily national average retail price:Daily national average retail price:comparing 2007 and 2008comparing 2007 and 2008
Price growth has slowed down over the past 4-5 months Unusual behaviour: increased in May/June, decreased in July/Aug/Sept
Ric
e R
ice R
ice R
ice R
ice R
ice R
ice
Ric
e R
ice R
ice R
ice R
ice R
ice R
ice
Ric
e R
ice
Ric
e R
ice
Average January 2009 on January 2008 = -13.75%
Average January 2009 on January 2006 = 52.7%

NFP STRATEGY AND POLICY RECOMMENDATIONS
Strategy 1.3.1: Price incentives for domestic food production
Price alternatives and options - Expectations play key role in
determining prices, government policies can affect prices
- Significant impacts of coarse rice price - Importance of scaling up safety nets

NFP STRATEGY AND POLICY RECOMMENDATIONS
Strategy 1.2.1 :Development of market infra structure
Import marketing and marketing systems (coastal)
-Need for reorganizing of present fertilizer system (timely and reasonable price, maintain buffer stocks
and better planning of monthly requirements) -Need for supporting local seed varieties -Training needed on use of pesticides and market
regulation

NFP STRATEGY AND POLICY RECOMMENDATIONS
Strategy 1.1.1 : Agriculture diversification and improved agriculture technology
Biodiversity related studies Homestead plant biodiversity programme
( timber, fruit, medicinal and speice) may be considered for implementation nationwide

NFP STRATEGY AND POLICY RECOMMENDATIONS Strategy 1.1. : Efficient and sustainable increase in food
production
Environment related studies
-Promote balanced fertilizers use
-Land zoning to grow HYV rice
-Awareness raising and improvement of quality mechanisms
- Improve farmers and traders access to low cost bank credit
-Tolerant (flood and submergence) rice varieties to be introduced
Development of fish marketing systems for improving food supply
-Regulation of sustainable fishing -Expansion as well intensification
of shrimp aquaculture should be considered with caution
-Saline resistant rice varieties should be developed/promoted for co-existence of rice and shrimp

Production and availability11. Input marketing and management systems in coastal regions. 14. Effects of
chemicals & hormones on cultivation & marketing of vegetables, banana
Physical and Social Access1. Community participation & safety net management in vulnerable char lands. 7. Spectre problems of food distribution systems & impacts on household FS
Economic Access8.Development potential of tilapia marketing systems for food supply. 9.FS for the poor: policy options under alternative price regimes
Utilization/Nutrition4. Problems and possibilities of production & consumption of safe foods. 6.Screening nutritionally rich and low glycemic index rice varieties
Cross cutting themes2.Impact of intensive cropping on long term degradation of natural resources.
3.Transparency and accountability for food security. 5.Integrated management of costal zones for food security. 10.Global warming and sea level rising impacts on agriculture/food security. 12. Environmental degradation and food security in St Martin’s Island. 13.Homestead plant biodiversity in South west coastal areas
Research Topics: CFResearch Topics: CF

22.8
41.8
24.0
18.4
20.5
20.9
17.0
23.3
23.0
39.9
57.2
24.5
20.0
20.8
20.5
20.8
32.2
30.4
14.1
20.1
15.4
14.4
12.8
12.6
13.5
15.5
15.9
- 10.0 20.0 30.0 40.0 50.0 60.0 70.0
Thai broken A1 Super
Thai 100%B 2nd grade
Delhi
Hyderabad
Bhubaneswar
Lucknow
Kolkata
Dhaka city
National
Taka per kg
Jan-06
Jul-08Jan-09
Increase/decrease 91% -24%
107% -28%
54% -19%
63%2%
63%-2%
39%-8%
58%-2%
184%-43%
185%-27%

Rice balance 2007-08Rice balance 2007-08
SUPPLY excluding stocks (in Thousand tons) 30,590Production 28,531Aus 1,506Amon 9,662Boro (NFPCSP estimation) 17,363Total imports, including food aid 2,059UTILIZATION 30,590Annual Food Use 24,696
per capita apparent daily consumption (grams) 464464 population (thousands) 145,930
Other uses (12% of production) 3,424 Stock increase, estimates at June 30, 2008 2,4702,470
NFPCSP estimates. Data in thousand tons if not otherwise specified
Despite flood and cyclone, positive balance estimated Total stocks increased by almost 2.5 Million tons

Programme Funded Research (PR)Challenge Fund (CF)
Steering Committee
Approves TORs of RGP and modalities for selection of
grants
Donors
Participation in selection of CS
Representatives
GoB - FPMU
Preparation of research needs digests & organization of Workshops and Seminars
Research Grants Panel (RGP)Chaired by FAO Representative
Members : - Chairperson of the donor Consortium - Representative from FAO’s ESA Division - Representative from WFP - Representative from FPMU - 2 Representatives from Civil Society - TAT Team Leader
Member secretary:
Research Grants Administrator (RGA)
Select research proposals for grants
Technical Assistance Team
Technical support
Research Grants Administrator
Administrative support
NFPCSP research Grant InitiativeNFPCSP research Grant Initiative

Donors:
PARTNERS
FAO:
Implementing Technical Agency
GoB:
• FPMU
•11 Ministries/Dept
NFPCSP: Project Formulation and PartnersNFPCSP: Project Formulation and Partners
• developed alongside the National Food Policy
• Initially: 3 donors for a 5 year project
Now: Phase I : 2 donors for 3 years (till end 2008)Phase II: 2 donors for 4 years (till end 2012)

15
17
19
21
23
25
27
29
31
33
35
01-J
an
15-J
an
29-J
an
12-F
eb
26-F
eb
12-M
ar
26-M
ar
09-A
pr
23-A
pr
07-M
ay
21-M
ay
04-J
un
18-J
un
02-J
ul
16-J
ul
30-J
ul
13-A
ug
27-A
ug
10-S
ep
24-S
ep
08-O
ct
22-O
ct
05-N
ov
19-N
ov
03-D
ec
17-D
ec
31-D
ec
Tak
a p
er k
g
2007
2008
2009
11-Feb-16.7% 9-May
44.2%10-Apr64.5%
23-Jul63.4%
20-Aug44.4%
14-Sep41.1%
25-Nov12.9%
25-Oct33.3%
11-D
ec10
.1%
31-D
ec 5
.3%
31-Jan-09-14.4%
25-Nov12.9%
Daily national average retail price:Daily national average retail price:comparing 2007 and 2008comparing 2007 and 2008
Price growth has slowed down over the past 4-5 months Unusual behaviour: increased in May/June, decreased in July/Aug/Sept
Ric
e R
ice R
ice R
ice R
ice R
ice R
ice
Ric
e R
ice R
ice R
ice R
ice R
ice R
ice
Ric
e R
ice
Ric
e R
ice
Average January 2009 on January 2008 = -13.75%
Average January 2009 on January 2006 = 52.7%