Embed Size (px)
Citation preview
THE CONCRETE STAVE SILO LANDSCAPE: DIFFUSION OF
AGRICULTURAL TECHNOLOGY IN NORTHEASTERN SOUTH DAKOTA
BY
James D. Sampson
A thesis submitted in partial fulfillment of the requirements for the
Master of Science
Major in Geography
South Dakota State University
2014

ii
THE CONCRETE STAVE SILO LANDSCAPE: DIFFUSION OF
AGRICULTURAL TECHNOLOGY IN NORTHEASTERN SOUTH DAKOTA
This thesis is approved as a creditable and independent investigation by a
candidate for the Master of Science degree and is acceptable for meeting the thesis
requirements for this degree. Acceptance of this thesis does not imply that the
conclusions reached by the candidate are necessarily the conclusions of the major
department
__________________________________
Dr. Janet Gritzner Date
Thesis Advisor
__________________________________
Dr. George White Date
Head, Geography
__________________________________
Dean, Graduate School Date

iii
ACKNOWLEDGEMENTS
I need to thank my advisor Janet Gritzner for sticking with me through all the
variety and changes in my interests. My wife, Sue Sampson has been patient letting me
go through my two degree midlife crisis and proofreading lots of geography papers. I
thank Irene Esser and Bob Kirby for sharing Watertown Cement Products Company
history and data that is crucial to this study.
All pictures without credits have been photographed or drawn by the author.
iv
TABLE OF CONTENTS
LIST OF FIGURES ............................................................................................... vi
LIST OF ILLUSTRATIONS ................................................................................. ix
ABSTRACT ........................................................................................................... xi
Chapter 1 - Introduction and Literature Review ..................................................... 1
Introduction ......................................................................................................... 1
Agricultural landscapes of the Midwest ............................................................. 1
Farm Silos as Landscape Elements ..................................................................... 2
Diffusion Literature ............................................................................................ 4
Study Areas in Northeastern South Dakota ........................................................ 7
Chapter 2 - Changing Agricultural Technologies ................................................... 9
History of Silos and Silage ................................................................................. 9
Silage............................................................................................................... 9
Silos in the United States .............................................................................. 10
Chapter 3 - Sources and Methods ......................................................................... 24
Watertown Cement Products Company ............................................................ 24
Sales Records Compilation ............................................................................... 26
Locating Silos ................................................................................................... 27

v
Identification of Assumptions ........................................................................... 31
Methods of Display ........................................................................................... 31
Chapter 4 - Results and Analysis .......................................................................... 33
Silo Expansion through Time ........................................................................... 33
Codington County ............................................................................................. 43
Brookings - Kingsbury Counties ...................................................................... 46
Hoven ................................................................................................................ 49
Groton ............................................................................................................... 52
Silo Decline ....................................................................................................... 56
South Dakota Agricultural Economies ............................................................. 67
Chapter 5 – Discussion and Conclusions .............................................................. 70
Driving Questions Revisited ............................................................................. 70
Conclusions ....................................................................................................... 73
Future Study ...................................................................................................... 73
APPENDIX ........................................................................................................... 75
References ......................................................................................................... 99

vi
LIST OF FIGURES
Figure 1: Contagious Diffusion .............................................................................. 5
Figure 2: Hierarchical Diffusion ............................................................................. 5
Figure 3: Main Study Areas .................................................................................... 8
Figure 4: Sales Records and Silo Data Sample ..................................................... 26
Figure 5: City Points and Polygons ...................................................................... 28
Figure 6: WCPC Silo Density per Square Mile .................................................... 29
Figure 7: WCPC Silo Point Density Interpolation ................................................ 30
Figure 8: Distribution of Silos 1937-38 ................................................................ 33
Figure 9: Distribution of Silos 1946 ..................................................................... 34
Figure 10: Distribution of Silos 1948 ................................................................... 35
Figure 11: Distribution of Silos 1949 ................................................................... 36
Figure 12: Distribution of Silos 1954 ................................................................... 37
Figure 13: Distribution of Silos 1958 ................................................................... 38
Figure 14: Distribution of Silos 1967 ................................................................... 39
Figure 15: Codington County ............................................................................... 40
Figure 16: Brookings/Kingsbury Counties ........................................................... 41
Figure 17: Hoven Area.......................................................................................... 42
Figure 18: Southeast Brown County ..................................................................... 42
Figure 19: Codington 1937-38 .............................................................................. 43
Figure 20: Codington 1939 ................................................................................... 44
Figure 21: Codington 1940 ................................................................................... 45
Figure 22: Codington 1941 ................................................................................... 45

vii
Figure 23: Brookings/Kingsbury 1938 ................................................................. 46
Figure 24: Brookings/Kingsbury 1940 ................................................................. 46
Figure 25: Brookings/Kingsbury 1941-45 ............................................................ 47
Figure 26: Hoven 1947 ......................................................................................... 49
Figure 27: Hoven 1949 ......................................................................................... 50
Figure 28: Hoven 1950-51 .................................................................................... 50
Figure 29: Hoven 1952-53 .................................................................................... 51
Figure 30: SE Brown County 1941 ....................................................................... 52
Figure 31: SE Brown County 1941-45 ................................................................. 53
Figure 32: SE Brown County 1951 ....................................................................... 53
Figure 33: SE Brown County 1958 ....................................................................... 54
Figure 34: Silo Sales per Year .............................................................................. 56
Figure 35: Silo Volume per Year .......................................................................... 56
Figure 36: Cattle Sales .......................................................................................... 57
Figure 37: Farm Count .......................................................................................... 57
Figure 38: Corn Production 1940 ......................................................................... 63
Figure 39: Corn Production 1960 ......................................................................... 63
Figure 40: Corn Production 2007 ......................................................................... 64
Figure 41: Farm Count .......................................................................................... 67
Figure 42: Dairy Cows Milked ............................................................................. 68
Figure 43: Cattle Sold ........................................................................................... 68
Figure 44: Distribution of Silos 1939 ................................................................... 75

viii
Figure 45: Distribution of Silos 1940 ................................................................... 76
Figure 46: Distribution of Silos 1941 ................................................................... 77
Figure 47: Distribution of Silos 1942 ................................................................... 78
Figure 48: Distribution of Silos 1943 ................................................................... 79
Figure 49: Distribution of Silos 1944 ................................................................... 80
Figure 50: Distribution of Silos 1945 ................................................................... 81
Figure 51: Distribution of Silos 1947 ................................................................... 82
Figure 52: Distribution of Silos 1950 ................................................................... 83
Figure 53: Distribution of Silos 1951 ................................................................... 84
Figure 54: Distribution of Silos 1952 ................................................................... 85
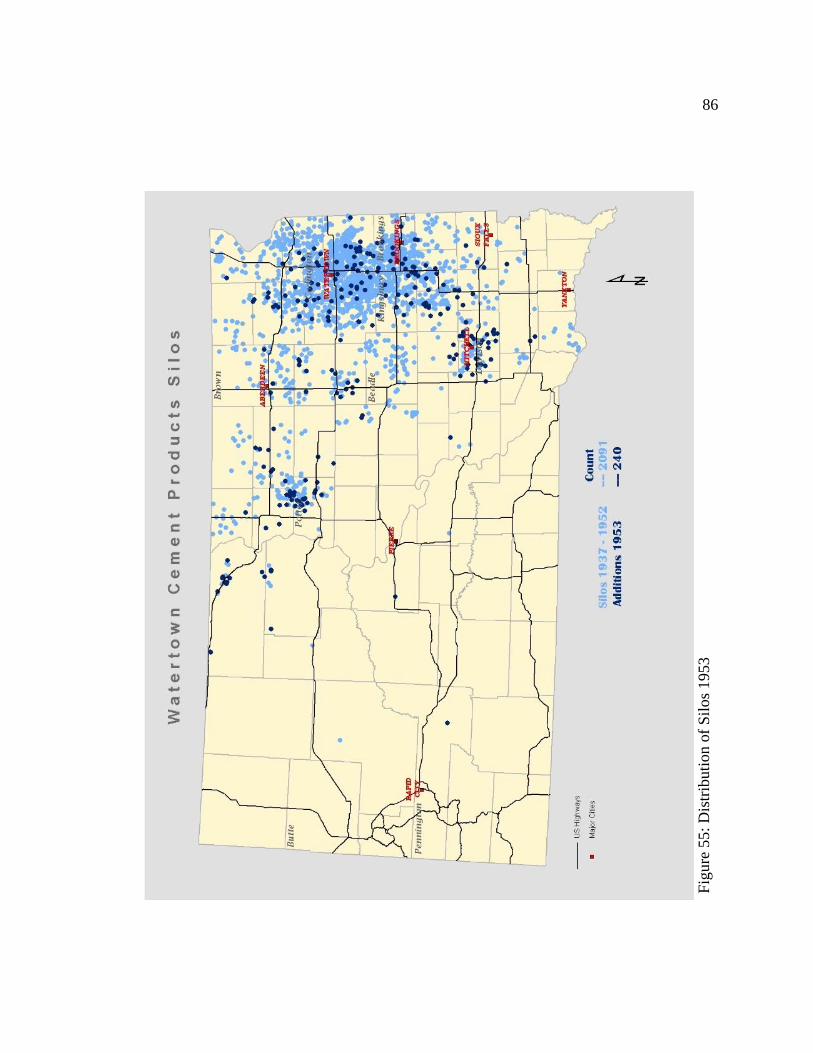
Figure 55: Distribution of Silos 1953 ................................................................... 86
Figure 56: Distribution of Silos 1955 ................................................................... 87
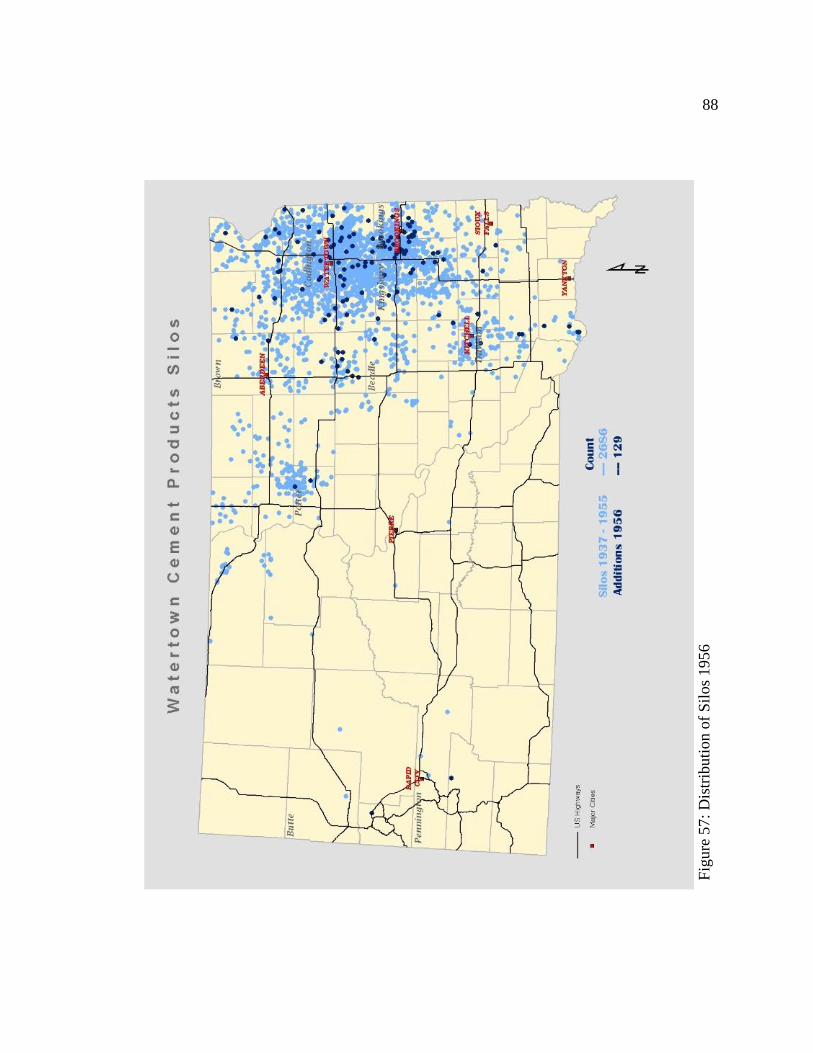
Figure 57: Distribution of Silos 1956 ................................................................... 88
Figure 58: Distribution of Silos 1957 ................................................................... 89
Figure 59: Distribution of Silos 1959 ................................................................... 90
Figure 60: Distribution of Silos 1960 ................................................................... 91
Figure 61: Distribution of Silos 1961 ................................................................... 92
Figure 62: Distribution of Silos 1962 ................................................................... 93
Figure 63: Distribution of Silos 1963 ................................................................... 94
Figure 64: Distribution of Silos 1964 ................................................................... 95
Figure 65: Distribution of Silos 1965 ................................................................... 96
Figure 66: Distribution of Silos 1966 ................................................................... 97
ix
LIST OF ILLUSTRATIONS
Picture 1: Silage Pit ............................................................................................... 11
Picture 2: Wood silo - Kingsbury County............................................................. 12
Picture 3: Stone silo .............................................................................................. 12
Picture 4: Brick silo .............................................................................................. 13
Picture 5: Tile silo ................................................................................................. 13
Picture 6: Poured concrete silo ............................................................................. 14
Picture 7: Stave silo construction .......................................................................... 15
Picture 8: WCPC Plant - Watertown .................................................................... 15
Picture 9: Concrete stave silos .............................................................................. 16
Picture 10: Hanson Silo ........................................................................................ 16
Picture 11: Madison Silo ....................................................................................... 17
Picture 12: Watertown Silo advertisement ........................................................... 17
Picture 13: Silo stave ............................................................................................ 18
Picture 14: Silo construction detail ....................................................................... 19
Picture 15: Silo roof .............................................................................................. 20
Picture 16: Silo unloading chute ........................................................................... 21
Picture 18: Silo loading with blower .................................................................... 22
Picture 17: Silage chopping .................................................................................. 22
Picture 19: Automatic silage unloader .................................................................. 23
Picture 20: Farm Name and Date .......................................................................... 24
Picture 21: Silage Distributor Patent..................................................................... 25
Picture 22: Silage Distributor Patent..................................................................... 25

x
Picture 23: Silage pit filling .................................................................................. 58
Picture 24: Silage pit - Aerial view ....................................................................... 59
Picture 25: Dairy Silage Pits ................................................................................. 60
Picture 26: Fiberglass Lined Silo .......................................................................... 61
Picture 27: Silo Destruction .................................................................................. 66
xi
ABSTRACT
THE CONCRETE STAVE SILO LANDSCAPE: DIFFUSION OF
AGRICULTURAL TECHNOLOGY IN NORTHEASTERN SOUTH DAKOTA
James D. Sampson
2014
Geographic diffusion of agricultural landscape features gives us a picture of our
state history. This thesis is a geographic analysis of the business history (1937-1967) of
Watertown Cement Products Company, based in Watertown, South Dakota. It examines
how the constructed products of a single company gave a unique character to the
landscape of a large portion of the state of South Dakota and a picture of the importance
of silage and silos. The research applies GIS technologies to map and analyze the spatial
patterns over this landscape. Cultural landscape change and diffusion models were used
to define the spread of Watertown Cement Products concrete stave silos over time. The
results show that there were multiple influences that determined the diffusion of concrete
stave silos across the state of South Dakota.
Keywords: silo, silage, agricultural landscape, GIS, diffusion

1
Chapter 1 - Introduction and Literature Review
Introduction
The red barn with cows, chickens, a field, and silo symbolizes the American
family farm. The farm silo is an especially visible landscape element, and has come to
define agricultural landscapes in many parts of the United States, but especially in the
Midwestern corn belt. The silo is representative of a complex of structures belonging to
the mixed crop-livestock farm of the early and mid-twentieth century United States
(Hudson, 2010). The silo, visible from a great distance, often outlasts barns and other
farm buildings. It stands as a relic to changing agricultural economies and technologies.
The silo and another Midwest landscape feature, the shelter belt of deciduous and
coniferous trees, are sometimes the only way to distinguish a farm location. It is a
remnant of the past embedded in today's landscape and demands documentation (Conzen,
2010). Study of the introduction and spread of the concrete stave silo in northeastern
South Dakota will contribute to our understanding of how landscapes are created and
changed through time.
Agricultural landscapes of the Midwest
Geographers John Fraser Hart, John Hudson, and Michael Conzen have had a
long and abiding interest in the making of farmlands in the Midwest. The first change to
the upper Midwest and South Dakota farm landscape was the plowing of the grassland
and planting of wheat in the late 19th and the early 20th centuries. Shortly after, railroads
and grain elevators spread across the plains for transportation and storage of the wheat
crop (Conzen, 2010). The wheat frontier was part of western settlement progress.
2
Railroad based settlements with grain elevators, grain bins, and silos for cattle feed were
visible in the spread to the west across the plains (Hudson, 2010). Many of the patterns of
towns across South Dakota are as dependent upon the railroads as they are on the roads in
the state. Corn replaced wheat across Wisconsin and Minnesota when farmers found their
land conducive to dairy production. With increased dairy production, the use of silage
became common, and silos to contain silage were built (Hart and Ziegler, 2008). Another
landscape feature of the Midwest is the grid system of surveying initiated by Thomas
Jefferson. In eastern South Dakota we have roads every mile both east to west and north
to south. The thought at the time was that one square mile of land would be sufficient for
any farmer. This type of thinking assumed that land fertility and moisture remain constant
throughout the region (Jackson, 1994). Other landscape traits such as water towers,
courthouses, and grain elevators have also engaged the interest of cultural geographers.
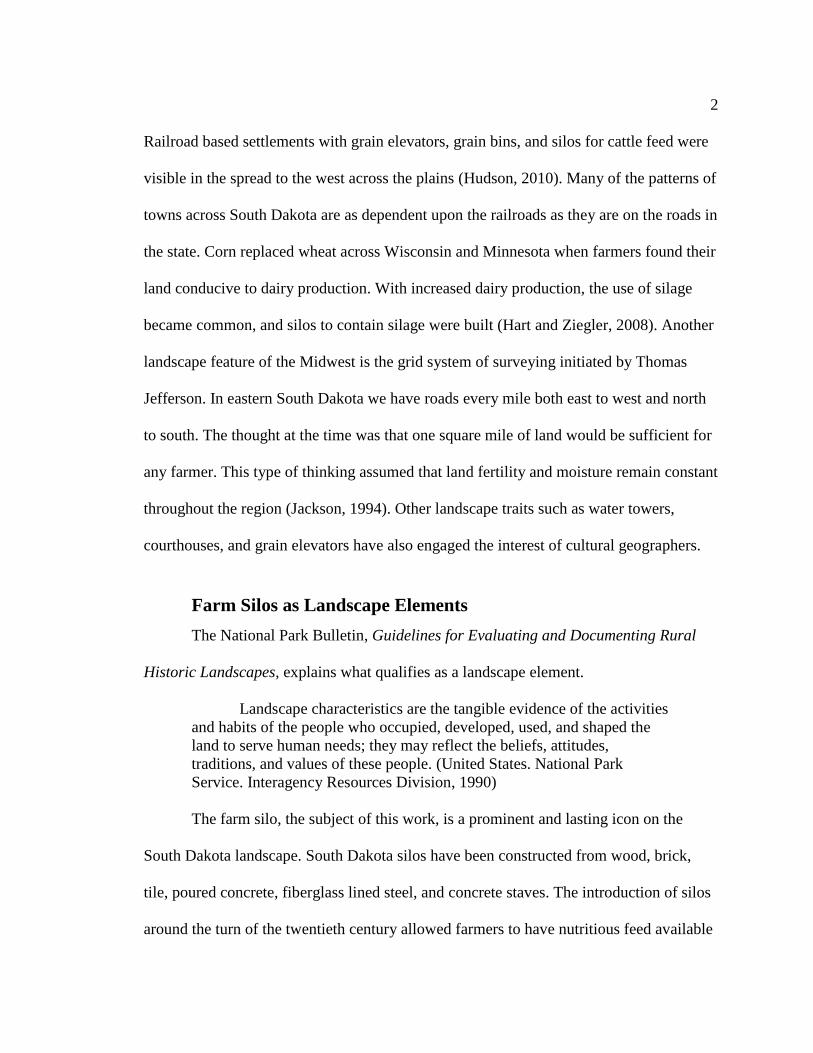
Farm Silos as Landscape Elements
The National Park Bulletin, Guidelines for Evaluating and Documenting Rural
Historic Landscapes, explains what qualifies as a landscape element.
Landscape characteristics are the tangible evidence of the activities
and habits of the people who occupied, developed, used, and shaped the
land to serve human needs; they may reflect the beliefs, attitudes,
traditions, and values of these people. (United States. National Park
Service. Interagency Resources Division, 1990)
The farm silo, the subject of this work, is a prominent and lasting icon on the
South Dakota landscape. South Dakota silos have been constructed from wood, brick,
tile, poured concrete, fiberglass lined steel, and concrete staves. The introduction of silos
around the turn of the twentieth century allowed farmers to have nutritious feed available
3
year round. A silo became an important farm feature when a better way to keep silage or
ensilage was needed. It was discovered that keeping chopped green feed in a partially
fermented state without exposure to outside air would provide a nutritious and palatable
feed for cattle. The dairy industry was most interested in having a consistent form of
nutrition year round. A beef cow-calf operation only needs winter feed of sufficient
quantity and quality to maintain the cow until spring calving. A dairy farmer produces
milk all winter and needs feed that will provide excess nutrition to produce a constant
milk supply. The first attempts at silage storage were pits in the ground where silage was
piled and packed. These trench silos were not completely air tight, and had problems with
contaminants from the surrounding soil. The solution was found in the vertical cylindrical
silo.
This research is a study of the concrete stave silo landscape of northeastern South
Dakota. It is a geographic analysis of the business history (1937-1967) of Watertown
Cement Products Company, based in Watertown, South Dakota. It examines how the
constructed products of a single company gave a unique character to the landscape of a
large portion of the state of South Dakota. It also looks at diffusion of an agricultural
innovation through time and space using GIS mapping and analysis techniques.
Some driving questions of the research are:
How has silage technology changed over time and how has this change
impacted the agricultural landscape of South Dakota?
What factors have influenced the decline of silo construction in South
Dakota?
4
Why was the Watertown Cement Products Company (WCPC) so
historically successful, or was it?
What is the geography of silo adoption and which diffusion theories best
fit silo adoption in South Dakota?
Is there a genuine clustering of silo construction in northeastern South
Dakota? If so, what explains the clustering?
Diffusion Literature
This section of the thesis looks at the fundamentals of diffusion theory and how it
applies to agricultural innovation. The remainder of the chapter defines study areas in
northeastern South Dakota.
The spread of the concrete stave silo across northeastern South Dakota is most
likely driven by diffusion theory. The main types of diffusion are expansion and
relocation (Jordan and Rowntree, 1990). Expansion diffusion is important in this study
since it occurs when neighbor influences neighbor and innovators educate receptive
future adopters. Relocation diffusion is less valuable to this study because it involves the
transfer of knowledge accompanied with a move from a distant location. The placement
of the first silos in the area of study was not the focus of this thesis. Expansion diffusion
is commonly separated into three types: contagious, hierarchical, and stimulus. In a silo
study, stimulus diffusion would apply if the end user would change the type of silage or
silo to use on his farm after being inspired by a different usage. An example would be a
farmer that fills his silo with alfalfa instead of corn since he is not able to grow corn
because his climate is too dry. Stimulus diffusion was not observed in northeastern South
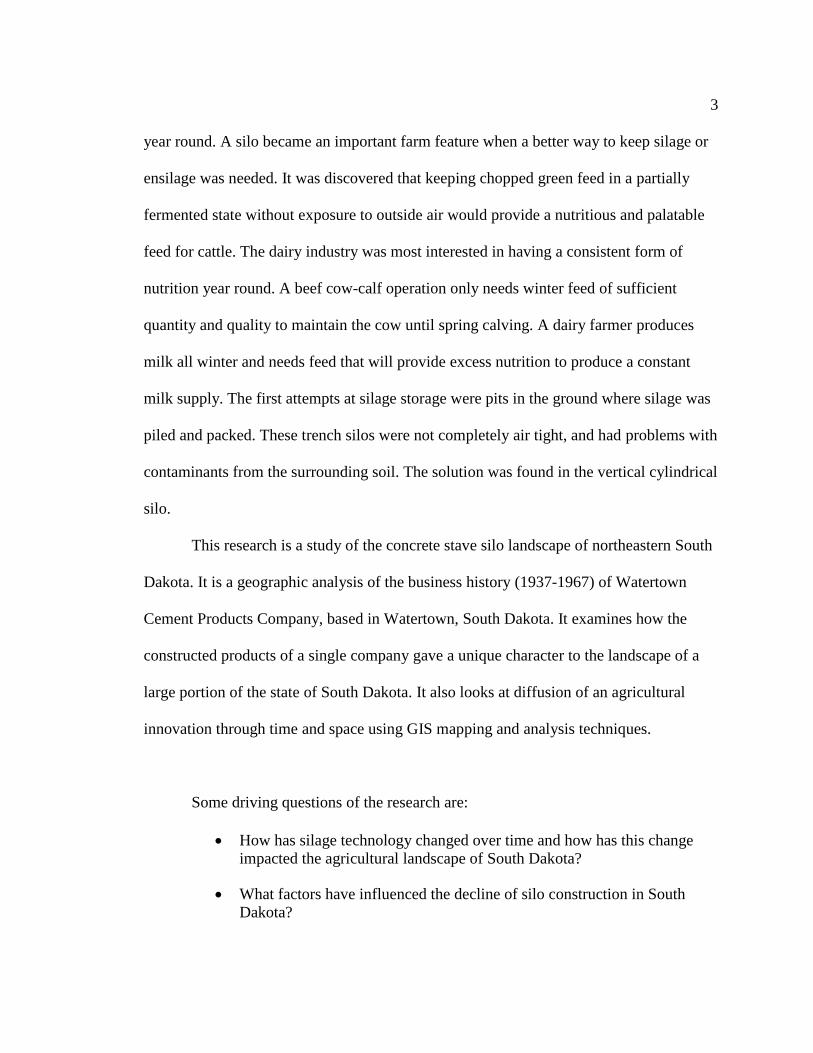
Dakota. In the following figures, each circle represents an entity that might influence or
5
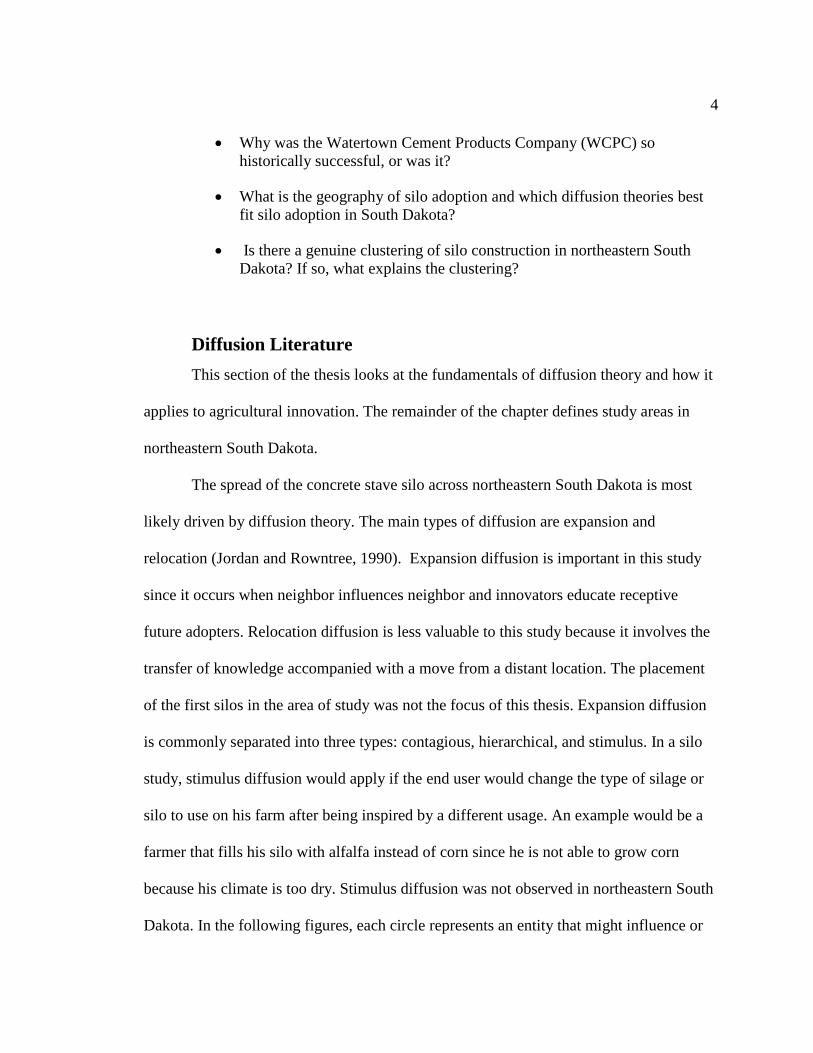
be influenced by neighboring entities. Contagious diffusion begins at one point, spreads
to all neighbors, and continues out in all directions (Figure 1).
Contagious diffusion was rarely observed during this study and only in small areas that
would be difficult to differentiate from hierarchical diffusion. Hierarchical diffusion
(Figure 2) also begins at a single point, but does not necessarily move to the closest
neighbors.
Hierarchical diffusion was always observed in the silo study areas. One of the driving
questions in this thesis is finding the possible reasons for those jumps to distant farms.
Figure 1: Contagious Diffusion
Figure 2: Hierarchical Diffusion

6
The most influential diffusion innovator was Thorsten Hägerstrand, who focused
on agricultural innovation and diffusion in Sweden (Hägerstrand, 1952). Hägerstrand
decided that information was the key factor in the diffusion of innovations. In 1977,
James Blaut expanded on some of Hägerstrand's theories pointing out that key innovators
can drive diffusion along with information agencies such as agricultural extension
services common in the United States (Blaut, 1977). DeTemple's local study of
Harvestore silo diffusion in Iowa analyzed and discounted the Hägerstrand innovative
farmer centric model of diffusion (DeTemple, 1971). The Harvestore Company kept
detailed records of silo construction dates and locations to assist with the study accuracy.
DeTemple decided that the influence of local cultural centers was more important than
the innovative farmer. I will call DeTemple’s results a “Space Preference” theory.

7
Study Areas in Northeastern South Dakota
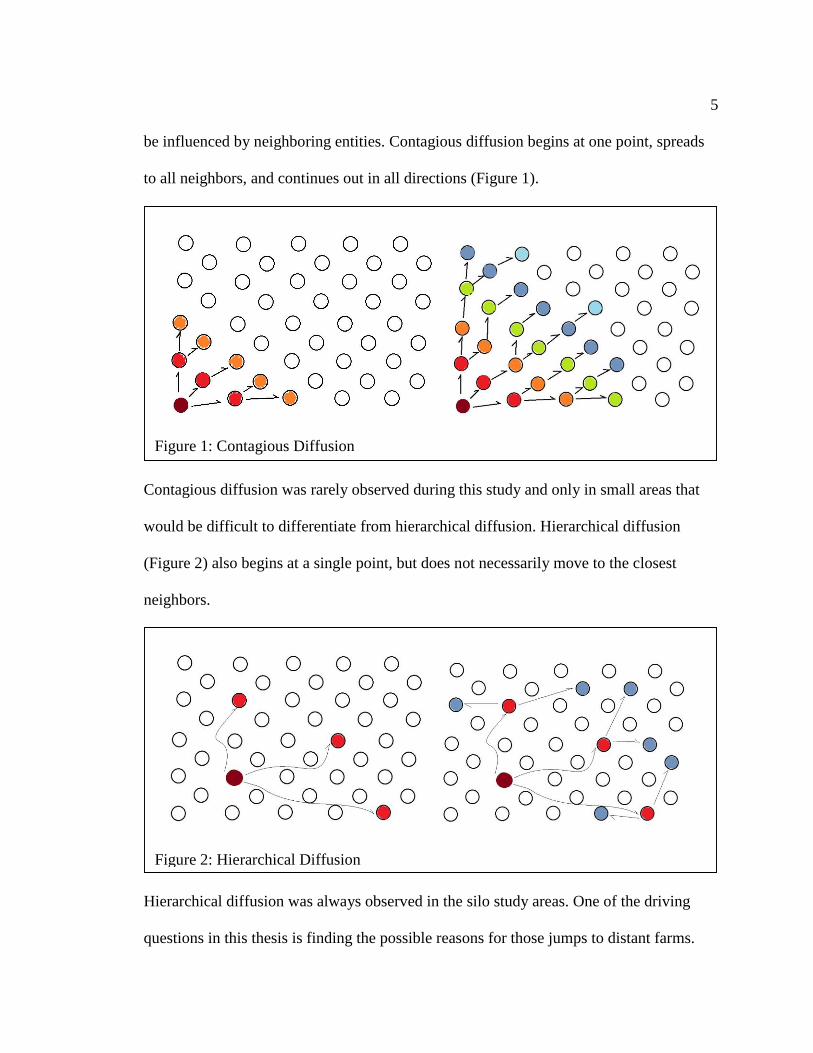
This thesis will focus on four study areas that either show high numbers of silos
or a diverse cluster of silo diffusion. The main study area is around the city of
Watertown, South Dakota where the headquarters of the Watertown Cement Products
Company (WCPC) was located (Figure 3). The basis of this diffusion study are the sales
records of Watertown Cement Products Company. The second study area is Brookings
County which has the distinction of having the highest concentration of WCPC silos in
the study area. The third study area is centered on Hoven, in northern Potter County. The
Hoven area has a fairly large concentration of silos considering the distance from the
headquarters in Watertown. A fourth study area is located in eastern Brown County near
Groton.
The areas and counties close to the company headquarters in Watertown are an
obvious area of study. Early sales would normally start close to the company's home
base. The silos constructed in the first three years of operation were mostly located
around Watertown (Figure 3-Box 1). The study area centered in western Brookings
County and encompasses part of Kingsbury County began expanding around 1940 and
eventually becomes the area with the highest concentration of WPCP silos (Figure 3-Box
2). According to interviews with the company salesman, Bob Kirby, sales were
influenced by a prominent Brookings Banker, Horace Fishback (Kirby, 2012).
Study area number three is the farm community surrounding Hoven on the
northern border of Potter County (Figure 3-Box 3). Hoven is 145 road miles west of
Watertown and silos began spreading out in the area around 1950, near the peak of the
company's sales years. The reasons for diffusion in the Hoven area may involve the
8
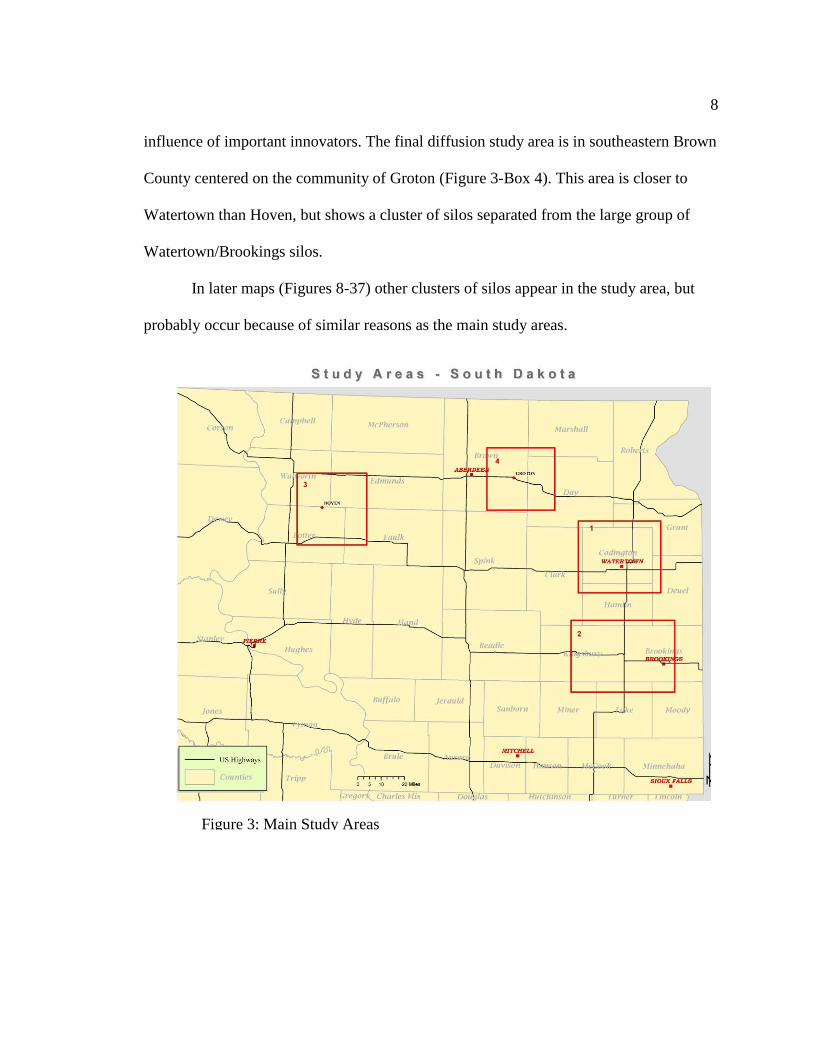
influence of important innovators. The final diffusion study area is in southeastern Brown
County centered on the community of Groton (Figure 3-Box 4). This area is closer to
Watertown than Hoven, but shows a cluster of silos separated from the large group of
Watertown/Brookings silos.
In later maps (Figures 8-37) other clusters of silos appear in the study area, but
probably occur because of similar reasons as the main study areas.
Figure 3: Main Study Areas

9
Chapter 2 - Changing Agricultural Technologies
History of Silos and Silage
Silage
The role of the silo is to produce and store silage. The history of silage is not fully
documented, though M. Auguste Goffart from France is given the most credit for early
publicity (Shaw, 1910). Goffart spent many years experimenting with the science of
silage and wrote The Manual of the Culture and siloing of Maize in 1877. But the origins
of silage are even earlier than 1877. In 1842 in a publication Transactions of the Baltic
Association for the Advancement of Agriculture, from the University of Griefswald, a
long description of the process shows that there is an earlier history to be found. The
French origin of the word 'ensilage' combines en - in and silo - pit (Stevens, 1881).
Silage would be generally described as a green feed packed firmly into an air tight
container and left to ferment. Any introduction of outside air that would allow oxidation
causes the silage to spoil. Early descriptions mention layering and packing the feed in pits
lined with bricks and/or cement, covering the silage with boards and adding weight to the
top to compress the material and reduce air contamination (Shaw, 1910).
In the late 1800s, silage fell out of favor for a while when George Fry insisted that
the farmer should produce sweet silage to make the feed more palatable to the cattle. This
process required some air exposure early in the process that caused the silage to heat to
over 120 degrees Fahrenheit. The silage was sweeter, but not as digestible so few farmers
felt that it was worth the trouble (Watson and Smith, 1956). Another feature of silage that
slowed usage was the fermentation quality. Some claimed that the silage would get the

10
cows drunk and a number of dairies refused to buy milk from farmers that fed silage
(Allen George Noble and Willhelm, 1995).
Silos in the United States
Farm silos and their diffusion have not been studied to the extent as other
agricultural innovations. In his book Diffusion of Silos, geographer Allen G. Noble
observed how the silo was distributed across the United States in the late 1800s. The first
silo in the United States was built in 1875 by Manly Miles at the University of Illinois for
research purposes (Allen G Noble, 1981). From there the early silos spread east to New
England, being mostly used by university researchers. F. Morris of Maryland was
credited with building a silo in 1876 (Shaw, 1910) and from there common usage spread
to New England and then west to Nebraska and Minnesota by 1884. Commercial use was
instituted by dairy farmers near major population centers that needed a reliable winter
feed source. The first silo may have been used in South Dakota as early as the 1890s.
In his doctoral thesis describing the diffusion of Harvestore Silos in Iowa, Blaut
states that diffusion of agricultural innovation needs an information source, either an
innovative farmer or a trusted local agriculture extension agency (Blaut, 1977). The
agriculture extension system which disseminates valuable information to farmers is
unique to the United States. The information provided is well researched by local
universities. U.S. government information in a USDA publication explains how a silo
should be built to fit the individual farmer's needs. The farmer determines how many tons
of feed are needed by the number of cows he/she will be feeding, possibly 100 pounds
per cow per day (McCalmont, 1960). Since two inches of silage should be removed each
11
day to prevent spoilage, the tonnage per day decides the diameter of the silo. The height
of the silo is figured by deciding how many days the cows will be fed. Other information
provided in the pamphlet describes the advantage of a silo roof and alternate silage
storage methods. Similar, but possibly not as reliable information was also provided by
the concrete industry (Portland Cement Association, 1957; Universal Portland Cement
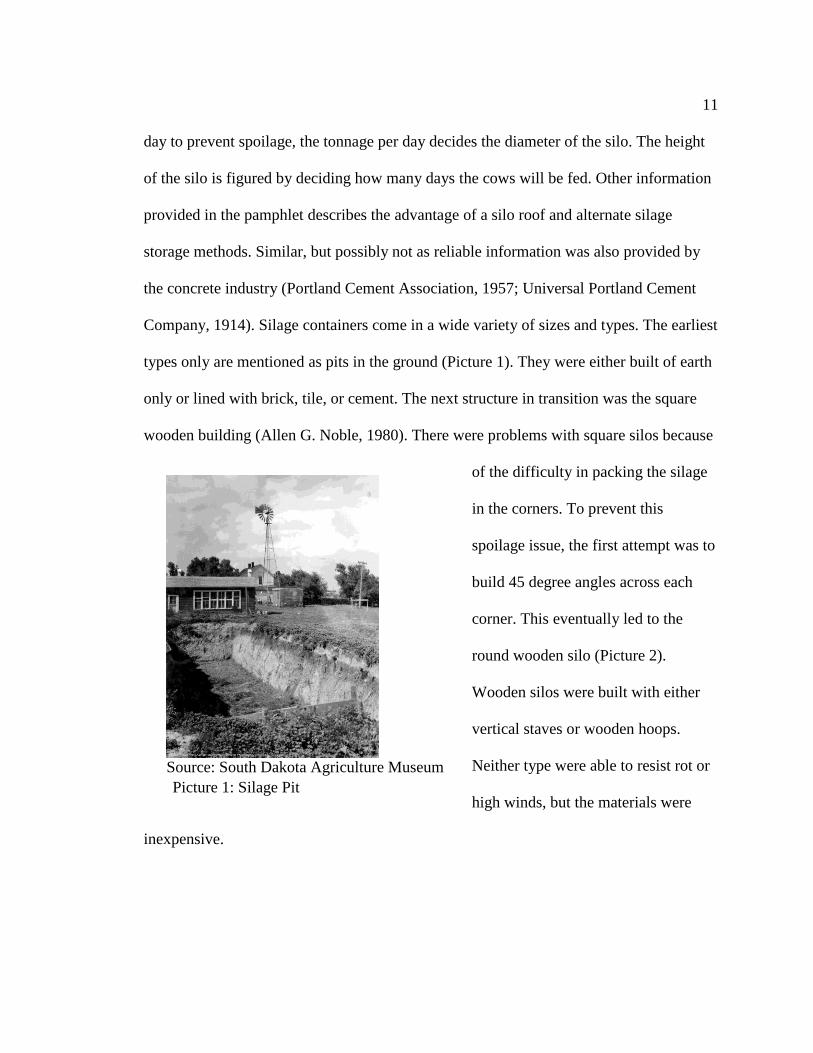
Company, 1914). Silage containers come in a wide variety of sizes and types. The earliest
types only are mentioned as pits in the ground (Picture 1). They were either built of earth
only or lined with brick, tile, or cement. The next structure in transition was the square
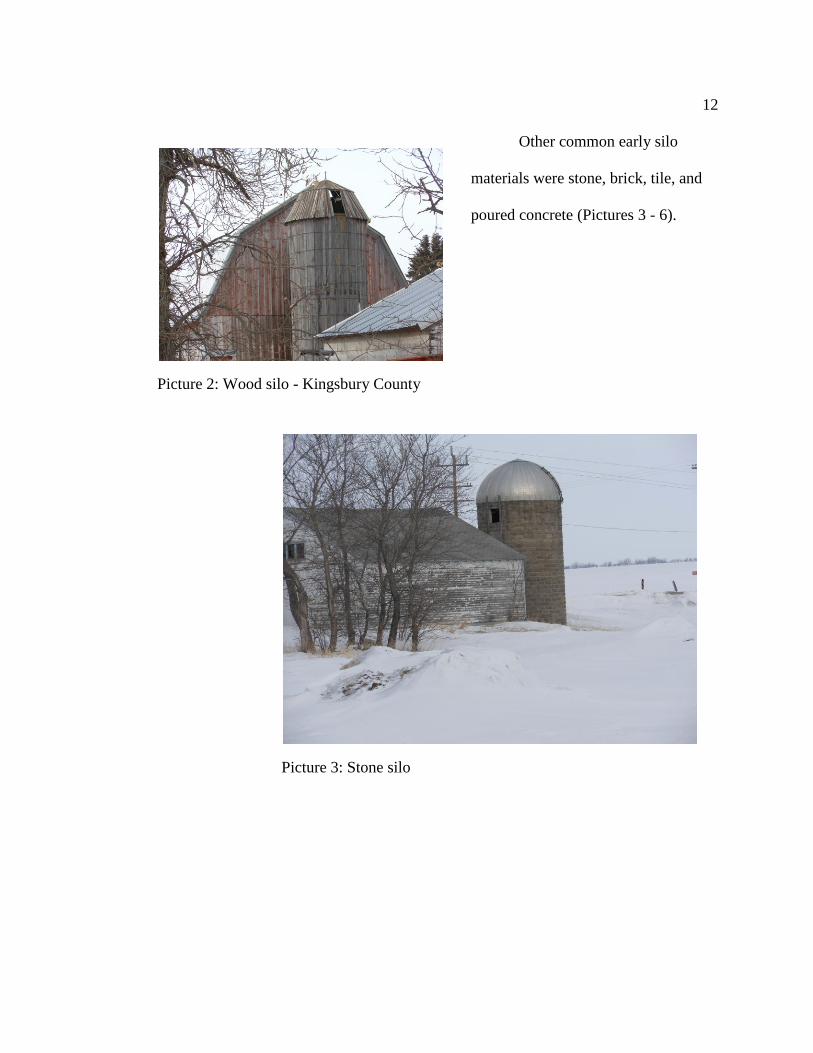
wooden building (Allen G. Noble, 1980). There were problems with square silos because
of the difficulty in packing the silage
in the corners. To prevent this
spoilage issue, the first attempt was to
build 45 degree angles across each
corner. This eventually led to the
round wooden silo (Picture 2).
Wooden silos were built with either
vertical staves or wooden hoops.
Neither type were able to resist rot or
high winds, but the materials were
inexpensive.
Source: South Dakota Agriculture Museum Picture 1: Silage Pit
12
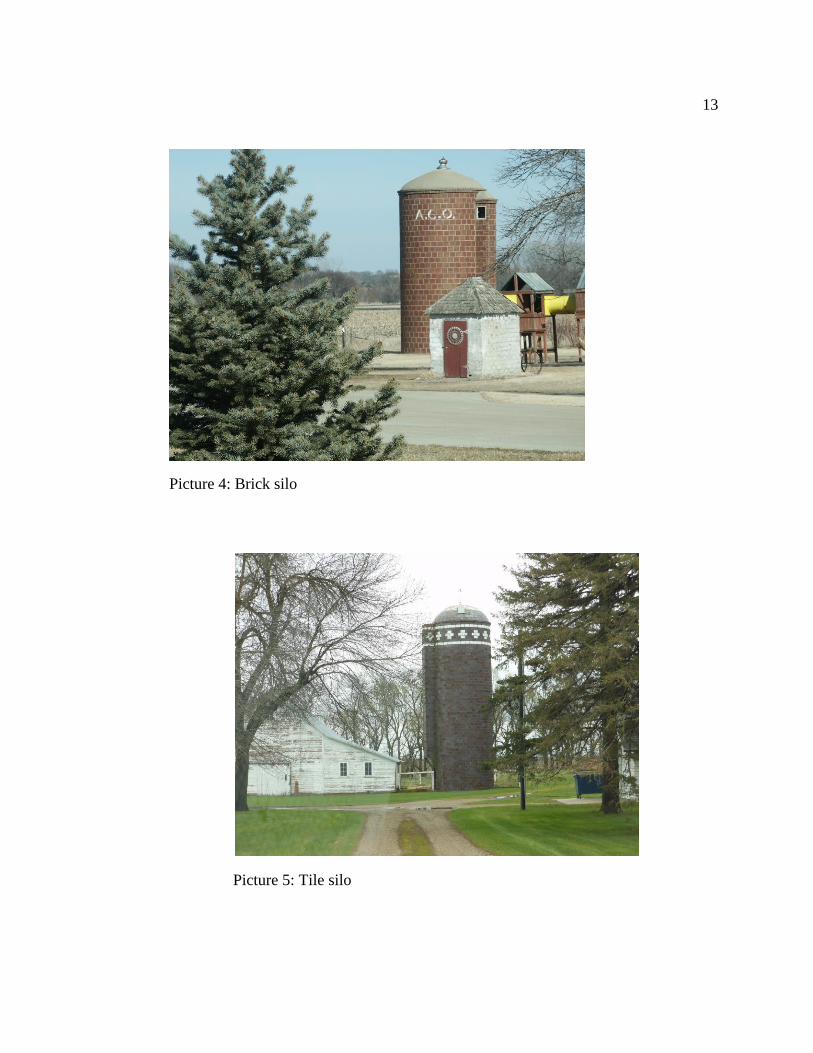
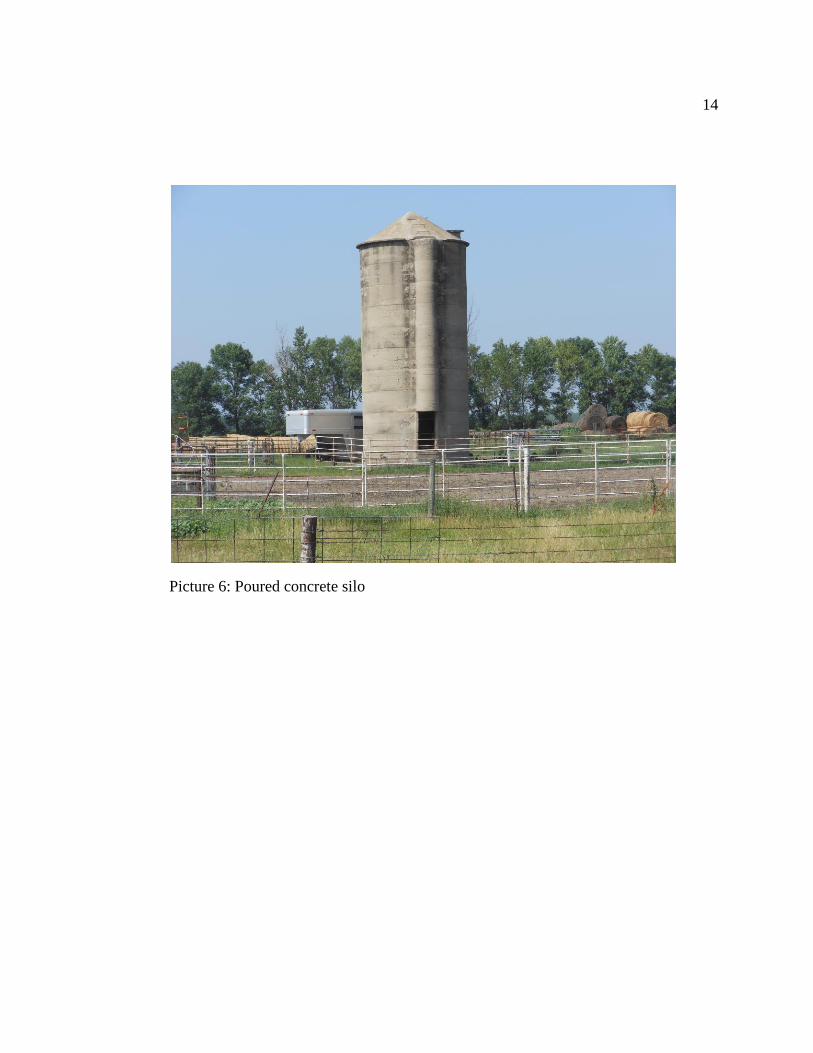
Other common early silo
materials were stone, brick, tile, and
poured concrete (Pictures 3 - 6).
Picture 2: Wood silo - Kingsbury County
Picture 3: Stone silo
13
Picture 5: Tile silo
Picture 4: Brick silo
14
Picture 6: Poured concrete silo
15
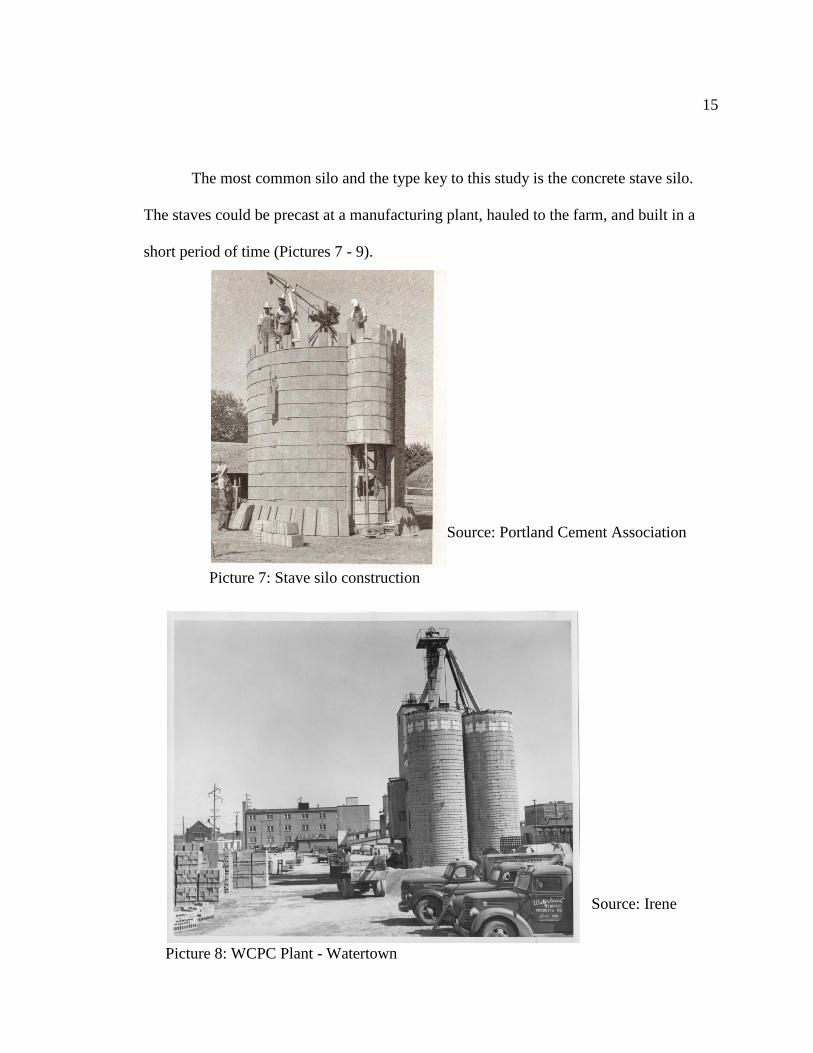
The most common silo and the type key to this study is the concrete stave silo.
The staves could be precast at a manufacturing plant, hauled to the farm, and built in a
short period of time (Pictures 7 - 9).
Picture 7: Stave silo construction
Source: Portland Cement Association
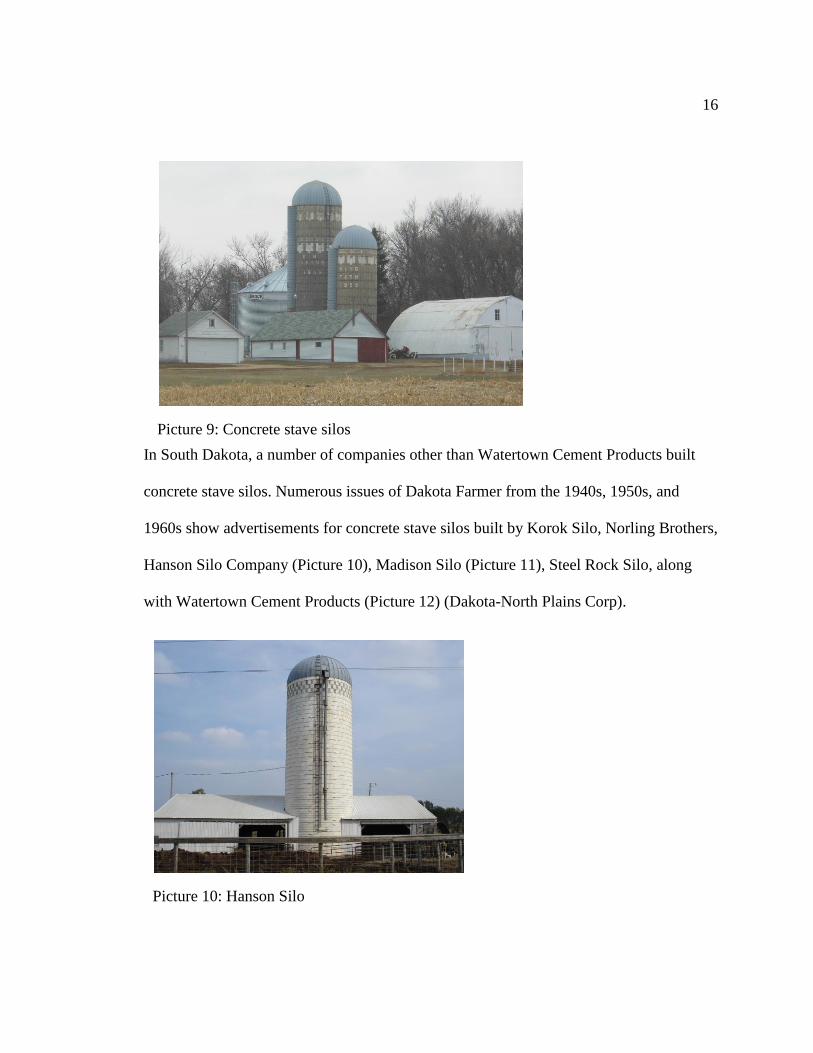
Picture 8: WCPC Plant - Watertown
Source: Irene
Esser
16
In South Dakota, a number of companies other than Watertown Cement Products built
concrete stave silos. Numerous issues of Dakota Farmer from the 1940s, 1950s, and
1960s show advertisements for concrete stave silos built by Korok Silo, Norling Brothers,
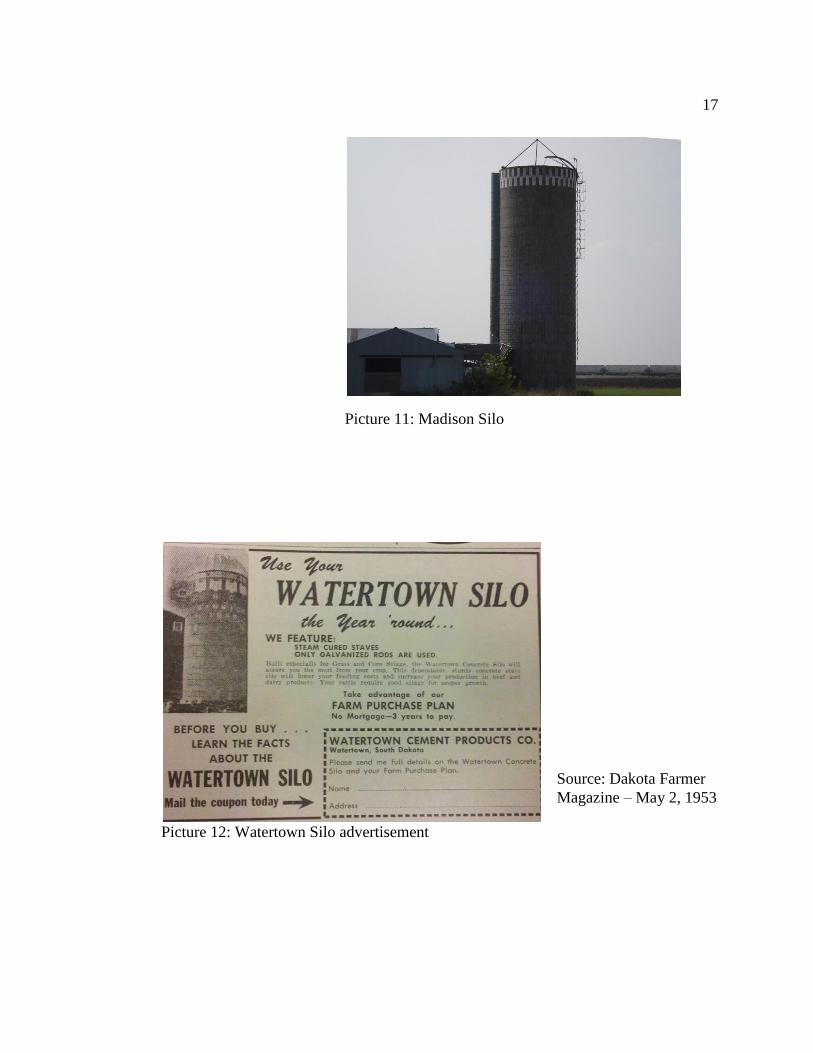
Hanson Silo Company (Picture 10), Madison Silo (Picture 11), Steel Rock Silo, along
with Watertown Cement Products (Picture 12) (Dakota-North Plains Corp).
Picture 9: Concrete stave silos
Picture 10: Hanson Silo
17
Source: Dakota Farmer
Magazine – May 2, 1953
Picture 11: Madison Silo
Picture 12: Watertown Silo advertisement
18
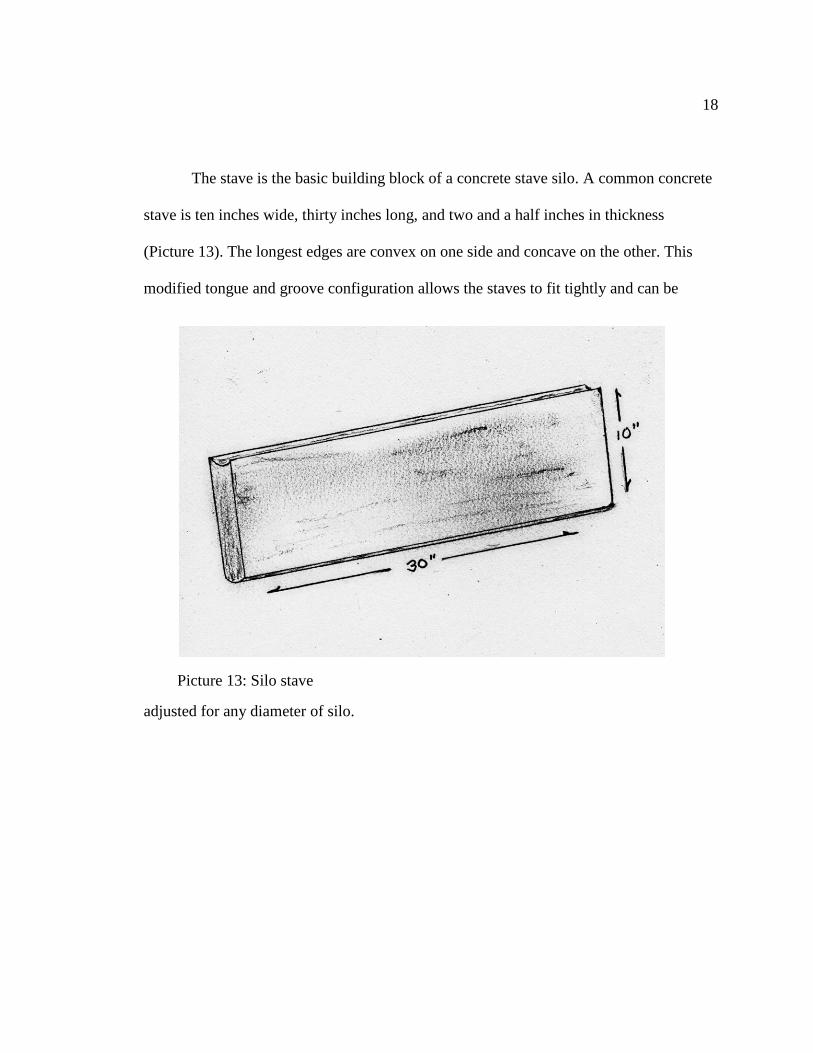
The stave is the basic building block of a concrete stave silo. A common concrete
stave is ten inches wide, thirty inches long, and two and a half inches in thickness
(Picture 13). The longest edges are convex on one side and concave on the other. This
modified tongue and groove configuration allows the staves to fit tightly and can be
adjusted for any diameter of silo.
Picture 13: Silo stave
19
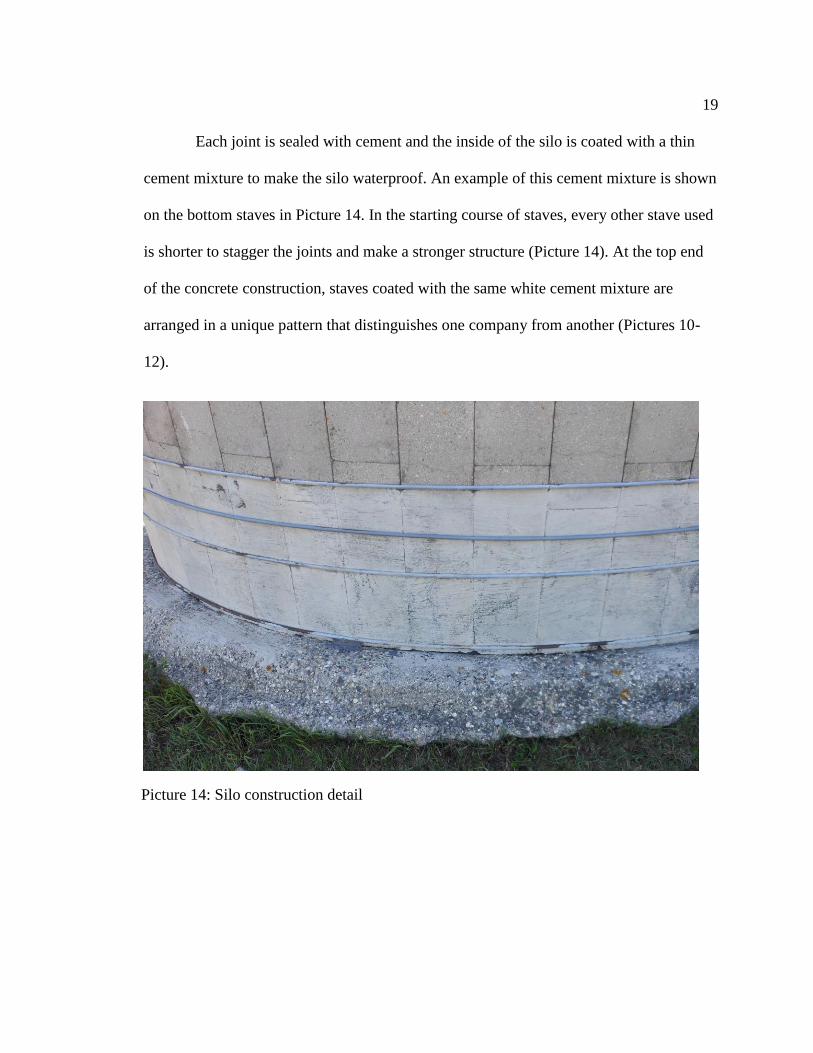
Each joint is sealed with cement and the inside of the silo is coated with a thin
cement mixture to make the silo waterproof. An example of this cement mixture is shown
on the bottom staves in Picture 14. In the starting course of staves, every other stave used
is shorter to stagger the joints and make a stronger structure (Picture 14). At the top end
of the concrete construction, staves coated with the same white cement mixture are
arranged in a unique pattern that distinguishes one company from another (Pictures 10-
12).
Picture 14: Silo construction detail

20
The crowning piece for most silos is a roof made from either galvanized steel or
aluminum (Picture 15). A roof is not always necessary (Picture 11), but a roof helps add
stability to the silo, retard freezing, reduce spoilage, protect an unloader from the
elements, and discourage damage from birds (McCalmont, 1960). If a roof is not
included, a tripod is positioned at the top to support loading and unloading equipment.
Picture 15: Silo roof
21
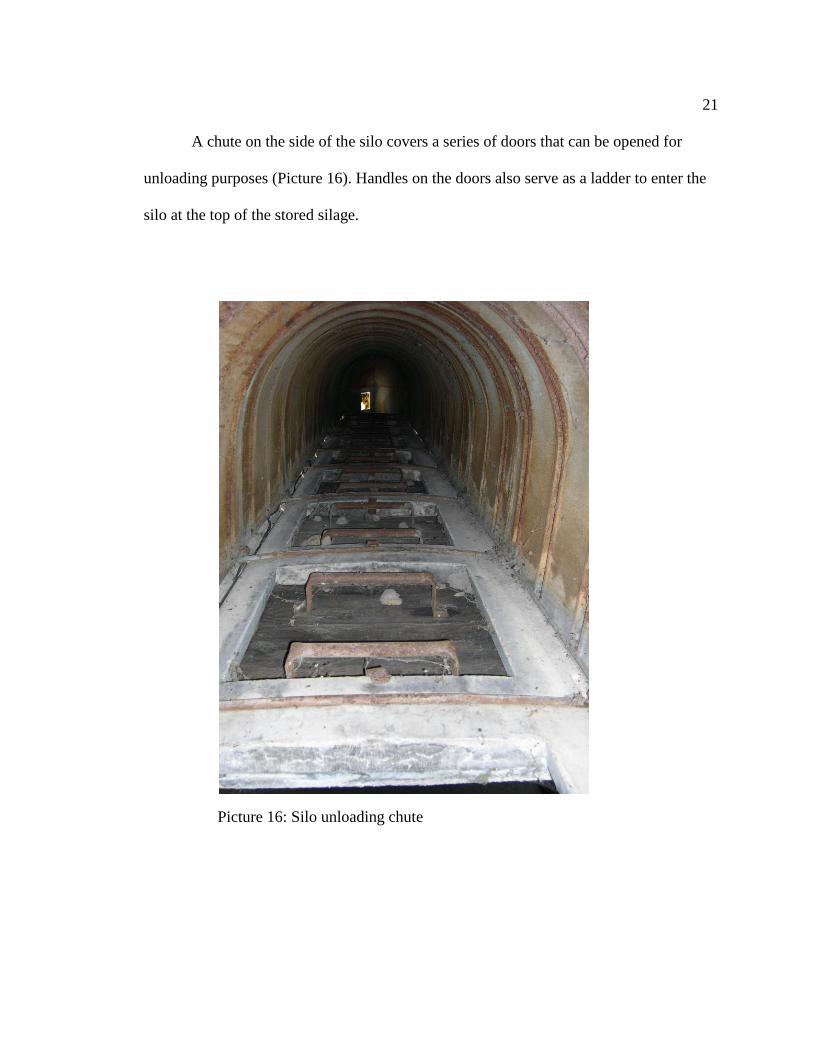
A chute on the side of the silo covers a series of doors that can be opened for
unloading purposes (Picture 16). Handles on the doors also serve as a ladder to enter the
silo at the top of the stored silage.
Picture 16: Silo unloading chute
22
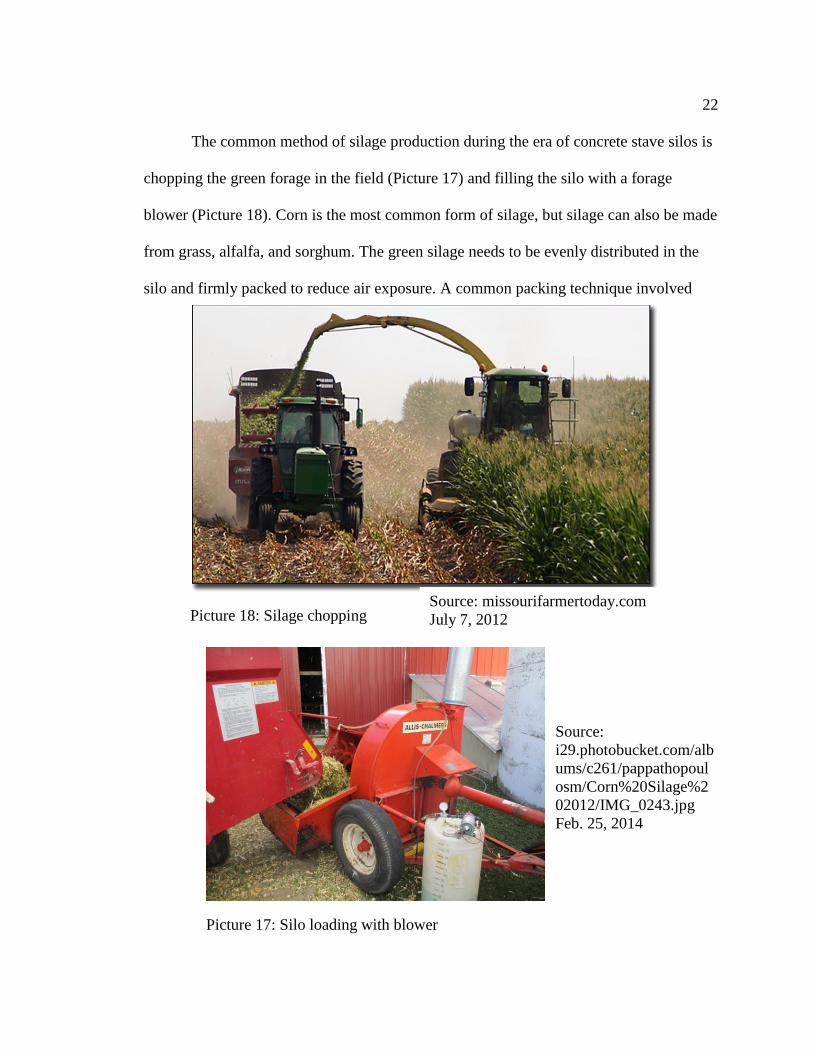
The common method of silage production during the era of concrete stave silos is
chopping the green forage in the field (Picture 17) and filling the silo with a forage
blower (Picture 18). Corn is the most common form of silage, but silage can also be made
from grass, alfalfa, and sorghum. The green silage needs to be evenly distributed in the
silo and firmly packed to reduce air exposure. A common packing technique involved
Picture 18: Silage chopping Source: missourifarmertoday.com
July 7, 2012
Picture 17: Silo loading with blower
Source:
i29.photobucket.com/alb
ums/c261/pappathopoul
osm/Corn%20Silage%2
02012/IMG_0243.jpg
Feb. 25, 2014
23
having the largest child in the family walk and tamp down the silage as it was being
unloaded.
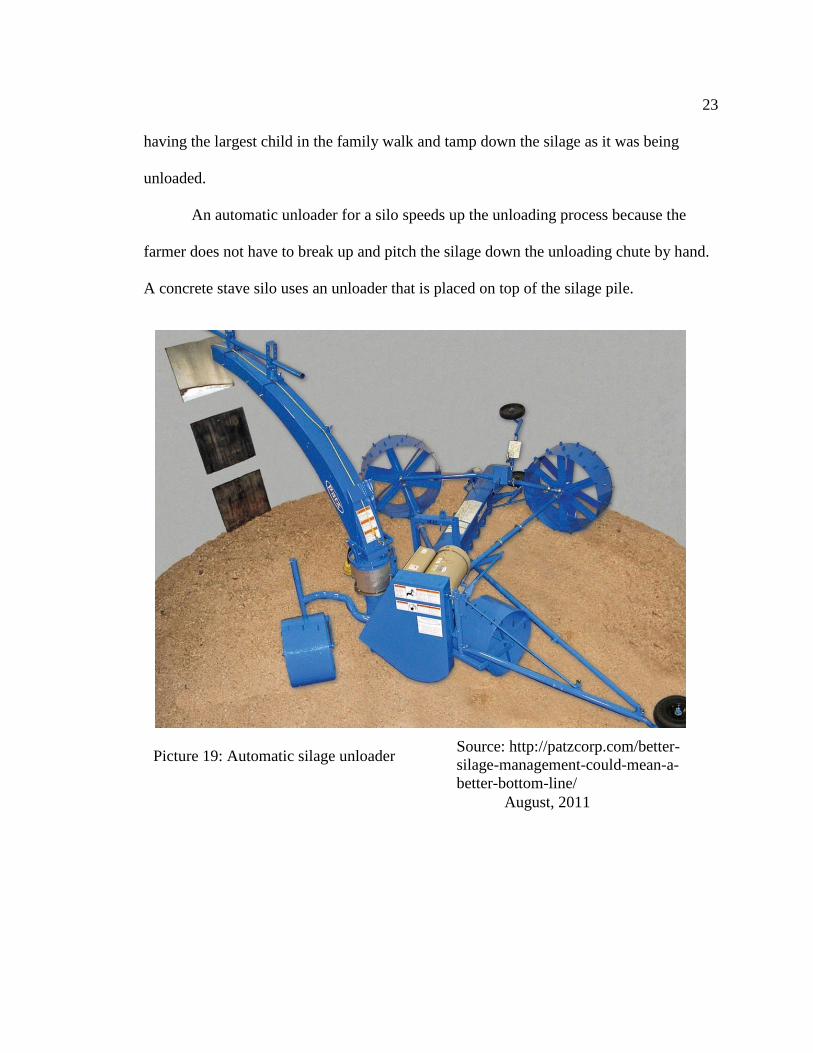
An automatic unloader for a silo speeds up the unloading process because the
farmer does not have to break up and pitch the silage down the unloading chute by hand.
A concrete stave silo uses an unloader that is placed on top of the silage pile.
Picture 19: Automatic silage unloader Source: http://patzcorp.com/better-
silage-management-could-mean-a-
better-bottom-line/
August, 2011

24
Chapter 3 - Sources and Methods
Chapter 3 details the history of the Watertown Cement Products Company,
company sales records compilation, and methods used in locating and mapping silos. I
have selected this company to study because I am the son-in-law of a Watertown Cement
Products Company president and have access to thirty years of company sales records.
Watertown Cement Products Company
Watertown Cement Products Company (WCPC) was founded in 1903. The main
company product was precast concrete blocks and ready-mix concrete. In 1937 the
company began building concrete stave silos. The distinctive pattern of a WCPC silo are
three staggered white staves that give the look of
a 'chevron' from a distance. The chevron is
topped by a band of circles that resemble a 'bull’s
eye' or target (Pictures 8, 9, 12, 15). Another
feature usually included was the farm name and
date of construction (Pictures 9, 12, 20). This
personalization may have kept some silos from
being torn down after they were no longer of use
because of the silo's new duty as a welcome sign.
Since the company only manufactured the
Picture 20: Farm Name and Date

25
concrete parts of a silo, they needed to buy roofs,
doors, and other metal accessories from other parts
manufacturers. One of those manufacturers was
Railoc Company of Plainfield, Illinois. This
company made steel and aluminum roofs and other
silo components (Pictures 21-22). In the mid-1950s,
Watertown Cement Products Company owed a
considerable amount of money to the Railoc
Company
because of
extended credit
on parts
purchases.
Peter Rutten, a
partner in Railoc, felt that the only way to recover
his investment required the purchase of WCPC and
the installation of his son-in-law, Henry Esser as
company president (Esser, 2013). The same method
was used to acquire and control silo construction
companies in Hutchinson, MN, Morris, IL, Joliet,
IL, and Cherokee, IA. WCPC continued to sell silos
and concrete products until 1967 when it had to be
Source:
http://www.google.com/patents
/US2867190
Picture 22: Silage Distributor
Patent
Source:
http://www.google.com/patents/
US2867190
Picture 21: Silage Distributor
Patent

26
sold for owner health reasons. A new competing company had just started up in
Watertown, so the company assets had to be auctioned since a new buyer could not be
found.
The majority of WCPC silo sales were made in northeastern South Dakota by a
traveling salesman. Some sales were made to farmers as far away as Rapid City, Newell,
and Hermosa in western South Dakota. These western South Dakota farmers were
referred by traveling reporters that worked for farm and ranch magazines (Kirby, 2012),
and were rewarded with a small finder's fee.
Sales Records Compilation
The sales records of WCPC were compiled into a database from written notes in
2006 as a family history project. The records had been kept since 1937 by the company
salesman, Bob Kirby. A sample of the data (Figure 4), shows that details were kept of the
Figure 4: Sales Records and Silo Data Sample

27
farmer or farm name, nearest town or postal town, silo size, cost, year constructed,
accessories included, and notes on stave or roof type.
For this study, any records that were not related to construction of a silo or silo
extension were excluded. An important area of this study is that of silage volume.
Records that would have no numbers in any volume calculation needed to be eliminated.
Records with missing data were either eliminated or estimates were made for the missing
pieces. After excluding unusable records, 3674 total silos or silo extensions were left to
analyze. If a cost was not included, it was possible to estimate that cost by comparing
silos constructed close by in both location and date. Some extensions were missing
dimensions. The diameter could usually be determined by noting the size of the silo that
farmer had previously purchased. The height could be determined if a cost was available
by using the proximity and date method.
Locating Silos
The silo sales records from the Watertown Cement Products Company contained
the buyer's name, nearest town, silo size, cost, year built, and notes related to accessories
purchased (Kirby, 2006). To find the location of each silo, county atlases by Midland
Atlas Company, Thomas O. Nelson, and Farm and Ranch Guides were used to find the
township, range and section of the farm (Farm and ranch directory, 1970; Midland Atlas
Company., 1975; Nelson (Thomas O.) Company Fergus Falls Minn. [from old catalog],
1963). GIS layers of townships and sections overlaid on recent imagery from the U.S.
Department of Agriculture was used to verify if the silo still existed. Bing Maps and
Google Earth were also helpful with the silo verification process. Bing Maps often
28
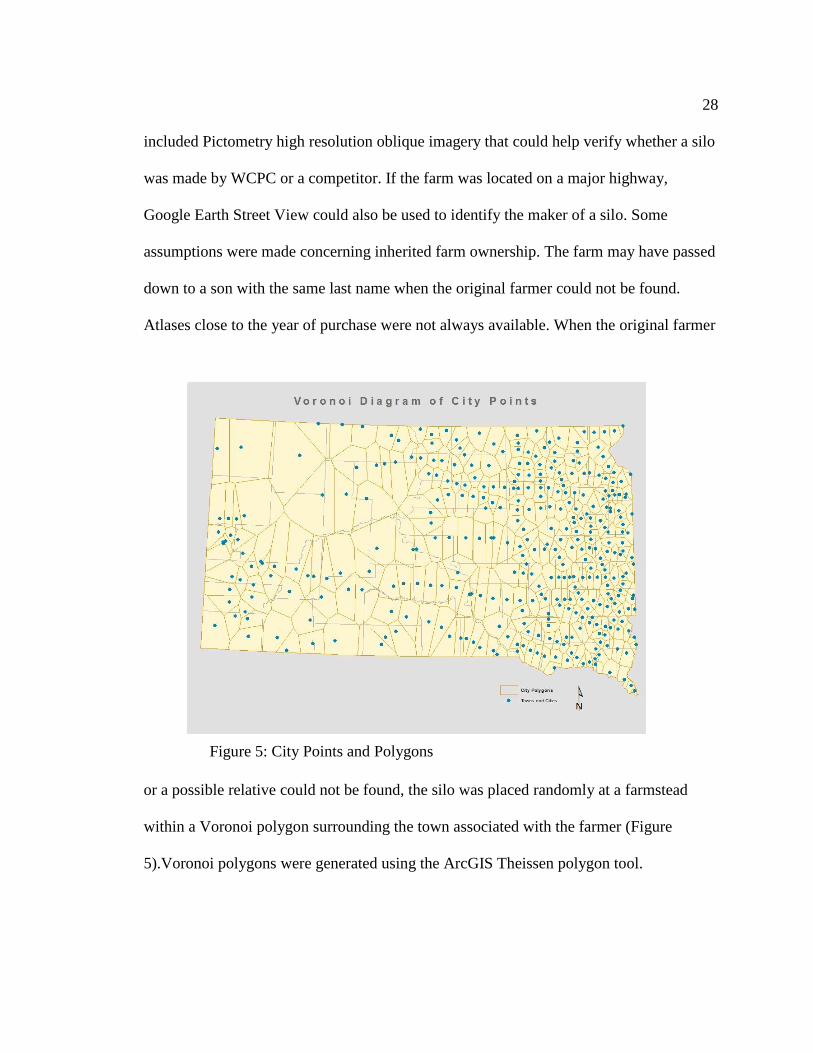
included Pictometry high resolution oblique imagery that could help verify whether a silo
was made by WCPC or a competitor. If the farm was located on a major highway,
Google Earth Street View could also be used to identify the maker of a silo. Some
assumptions were made concerning inherited farm ownership. The farm may have passed
down to a son with the same last name when the original farmer could not be found.
Atlases close to the year of purchase were not always available. When the original farmer
or a possible relative could not be found, the silo was placed randomly at a farmstead
within a Voronoi polygon surrounding the town associated with the farmer (Figure
5).Voronoi polygons were generated using the ArcGIS Theissen polygon tool.
Figure 5: City Points and Polygons

29
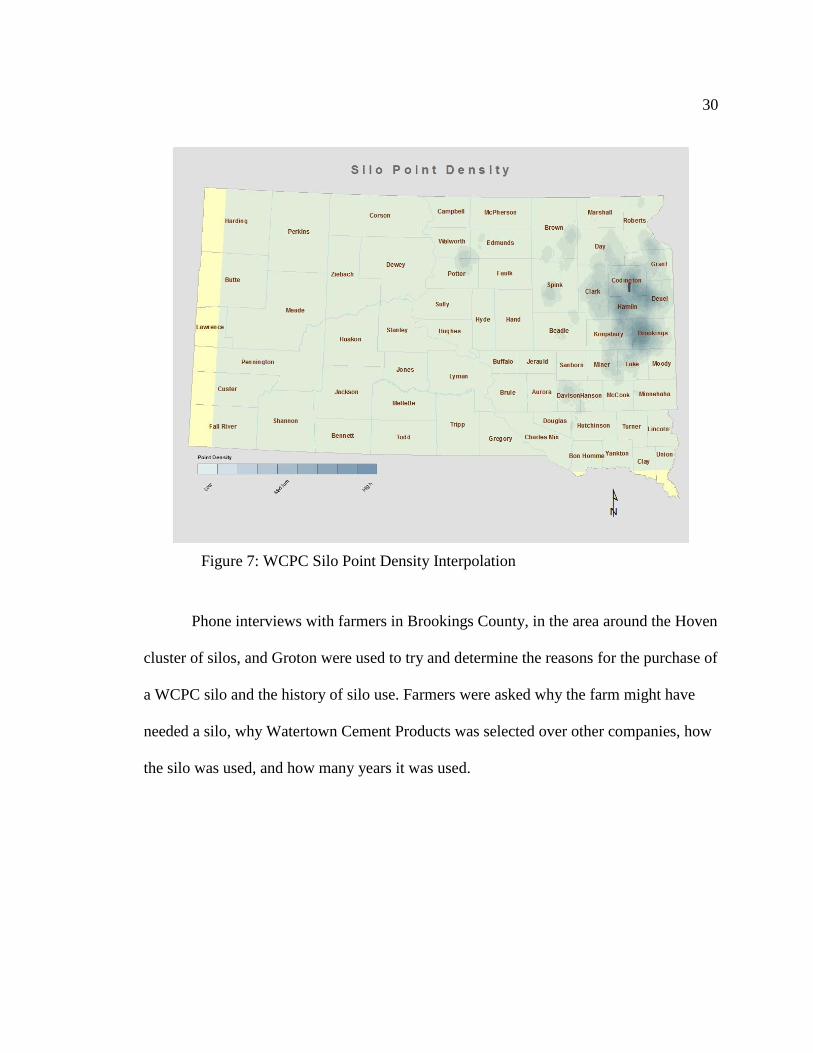
The same Voronoi diagrams of Theissen polygons were used to determine the
count and density of the silos in the area of influence around each town (Figure 6). A
point density interpolation map (Figure 7) helped find important cluster areas. Zooming
into a map area with an important original silo can determine if the diffusion spreads
from that farm or if the local town became the center as was noted in a study of Iowa
Harvestore silos by David DeTemple (DeTemple, 1971).
Figure 6: WCPC Silo Density per Square Mile
30
Phone interviews with farmers in Brookings County, in the area around the Hoven
cluster of silos, and Groton were used to try and determine the reasons for the purchase of
a WCPC silo and the history of silo use. Farmers were asked why the farm might have
needed a silo, why Watertown Cement Products was selected over other companies, how
the silo was used, and how many years it was used.
Figure 7: WCPC Silo Point Density Interpolation

31
Identification of Assumptions
When observing the distribution and diffusion of silos in northeastern South
Dakota, this thesis attempts to determine if this diffusion follows any of the previously
referenced diffusion models.
If the diffusion of WCPC silos follows the Hägerstrand model, then new silos
should appear around the farm of an early innovator in an area that previously did not
have silos (Blaut, 1977). If the diffusion follows the “Space Preference” approach of the
study by DeTemple (DeTemple, 1971), then new silos should appear around a central
place (town) that is near the location of any early innovator.
Considering that this study only deals with the sales and distribution of silos from
one company, then the influence of silos from any other companies will have to be
ignored. Additionally the competition from other stave silo companies or other types of
silos could not be determined when observing the decline of silo sales.
Methods of Display
The maps in Chapter 4: Results and Analysis portray a general picture of silo
diffusion. Data are mapped using a GIS by placing silo points at their exact or estimated
geographic latitude/longitude in a series by the year in which they were built. Years with
low numbers were sometimes combined. As each new year was added to the map, the
previously displayed points were colored light blue and the new year's points were
displayed a dark blue. The local cluster analysis maps that are presented later in the
chapter generally have multiple years combined. The first set of maps have major cities,

32
county boundaries, and U.S. highways represented. The Interstate highway system was
not included since it did was not complete at the time most of the silos were constructed.
33
Chapter 4 - Results and Analysis
Silo Expansion through Time
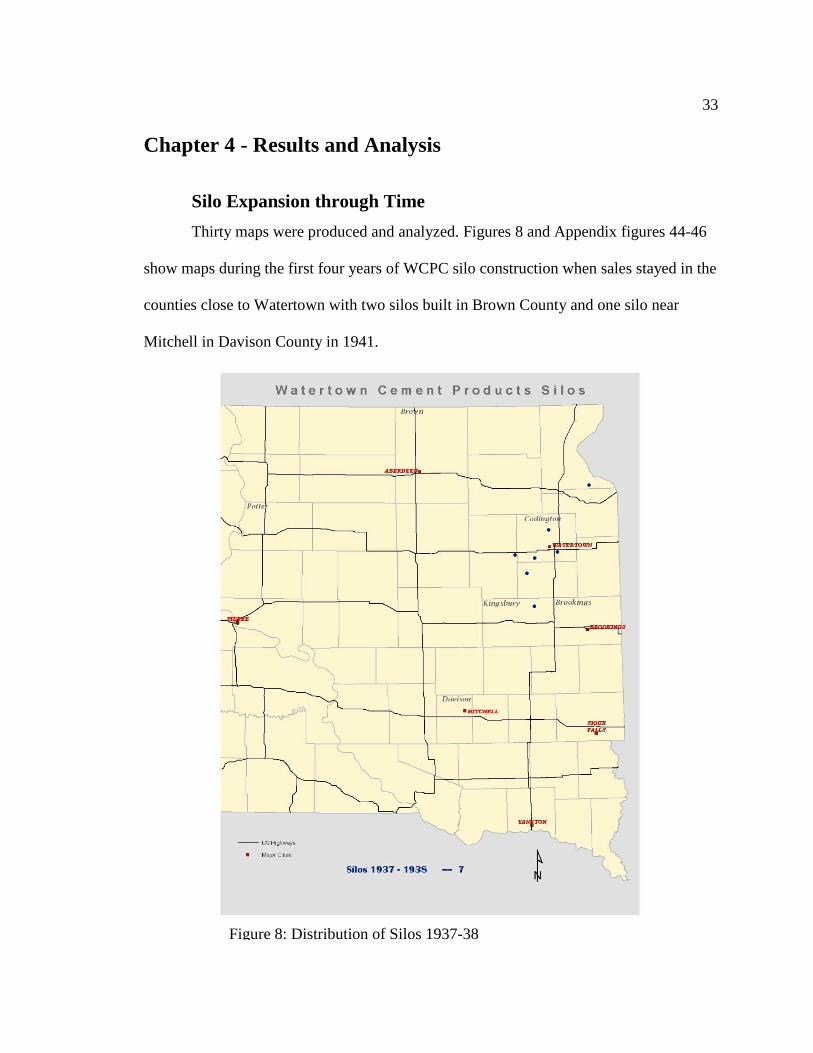
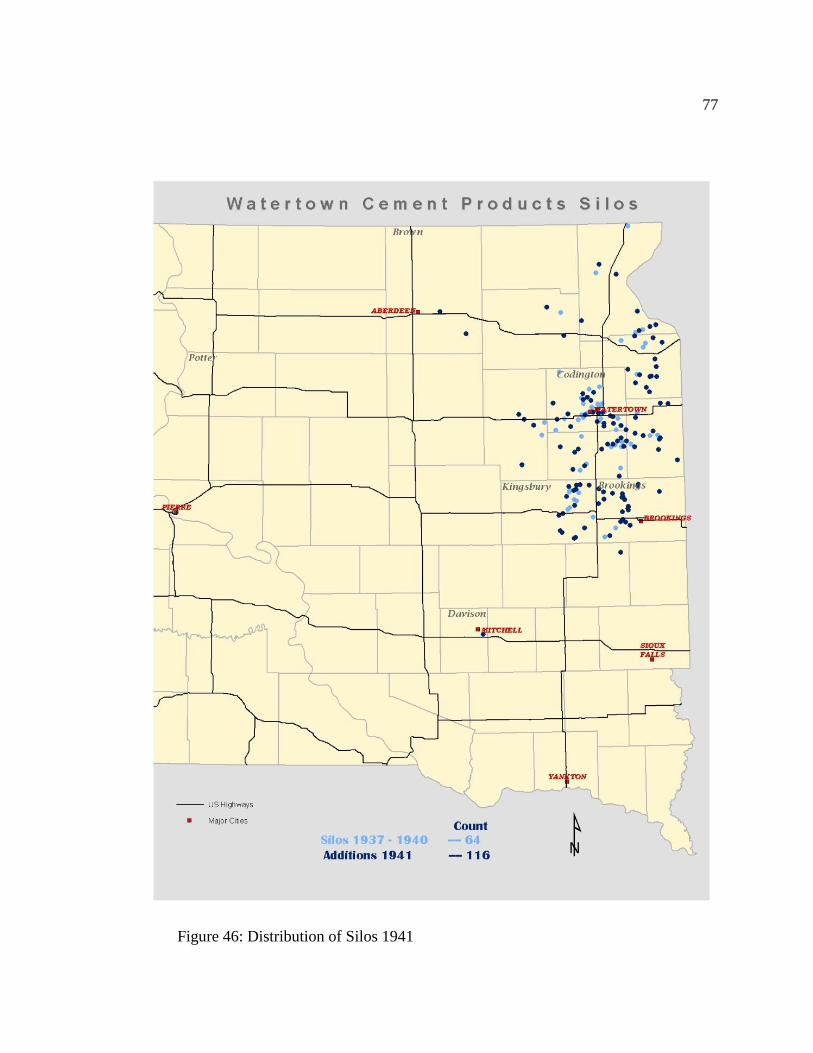
Thirty maps were produced and analyzed. Figures 8 and Appendix figures 44-46
show maps during the first four years of WCPC silo construction when sales stayed in the
counties close to Watertown with two silos built in Brown County and one silo near
Mitchell in Davison County in 1941.
Figure 8: Distribution of Silos 1937-38

34
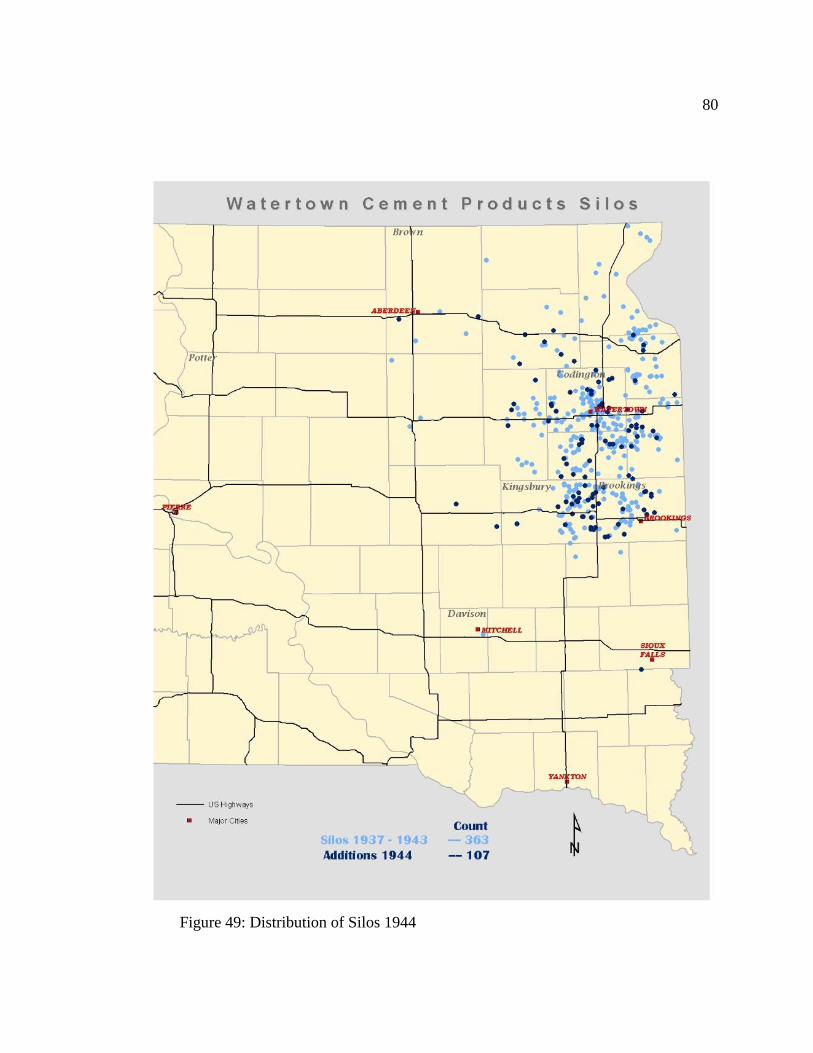
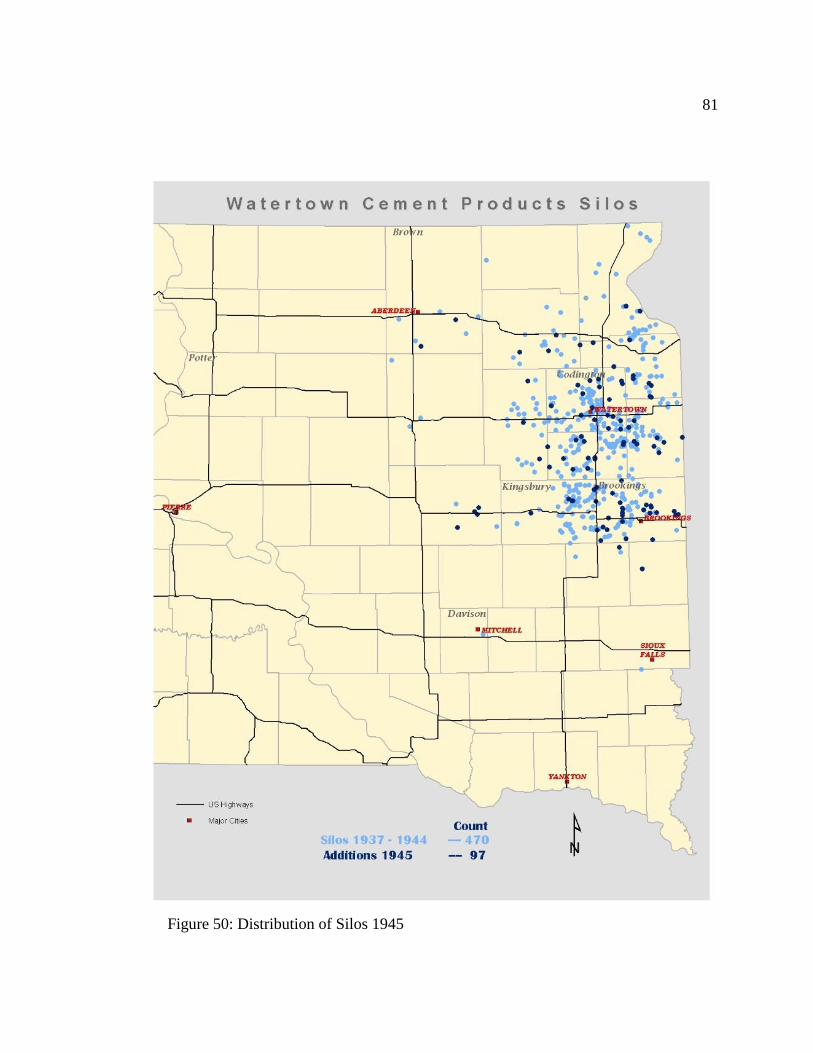
The war and post war years from 1942 through 1946 (Appendix Figures 47-50)
(Figure 9) kept the expansion and diffusion in the Watertown and Brookings areas with a
few more silos to the west in Brown and Spink Counties and one silo southwest of Sioux
Falls in Minnehaha County.
Figure 9: Distribution of Silos 1946
35
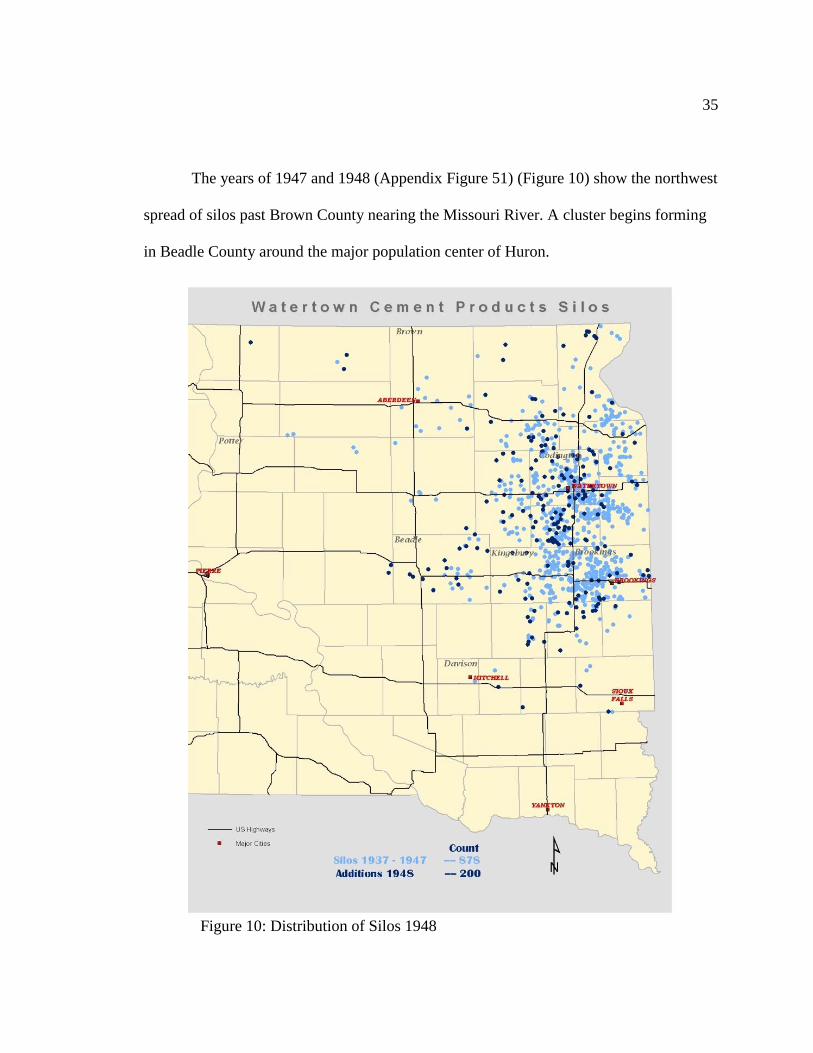
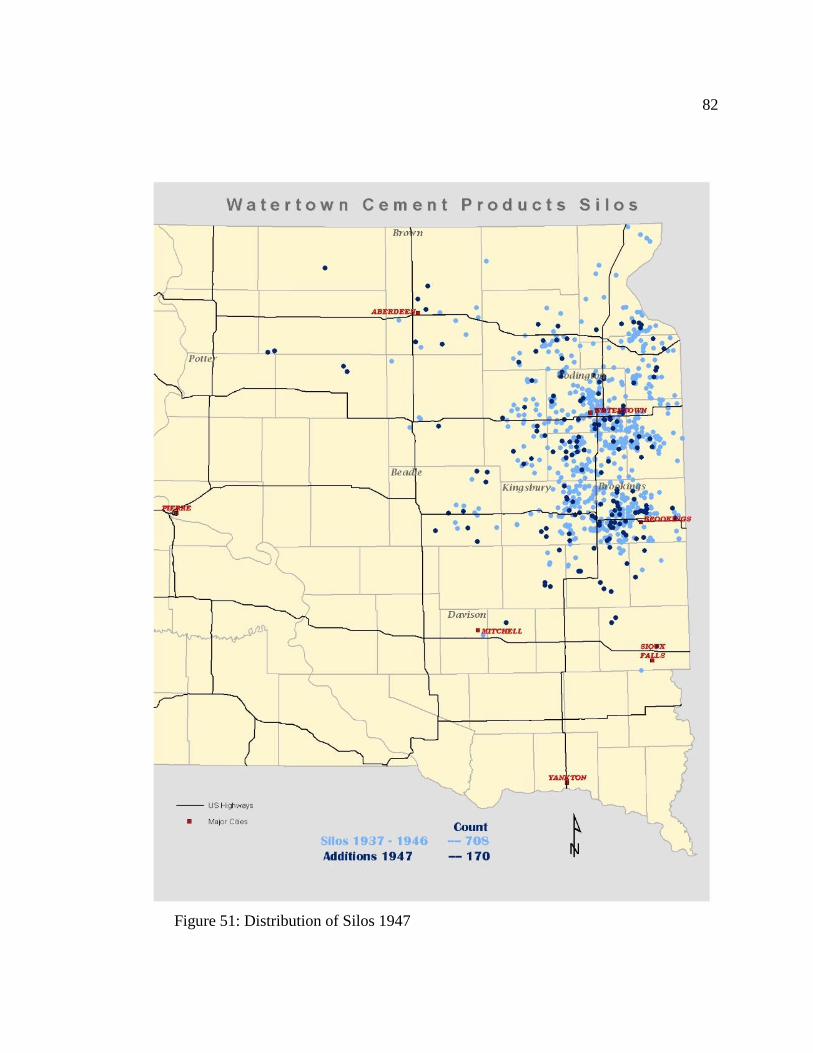
The years of 1947 and 1948 (Appendix Figure 51) (Figure 10) show the northwest
spread of silos past Brown County nearing the Missouri River. A cluster begins forming
in Beadle County around the major population center of Huron.
Figure 10: Distribution of Silos 1948

36
In 1949 (Figure 11) the first WCPC silos appear west of the Missouri River and in
1950 (Appendix Figure 52) a cluster begins to form near Hoven in Potter County. WCPC
silos are also built as far south as Springfield near the southern border of South Dakota
(Appendix Figure 52).
Fig
ure
11:
Dis
trib
uti
on o
f S
ilos
1949
37
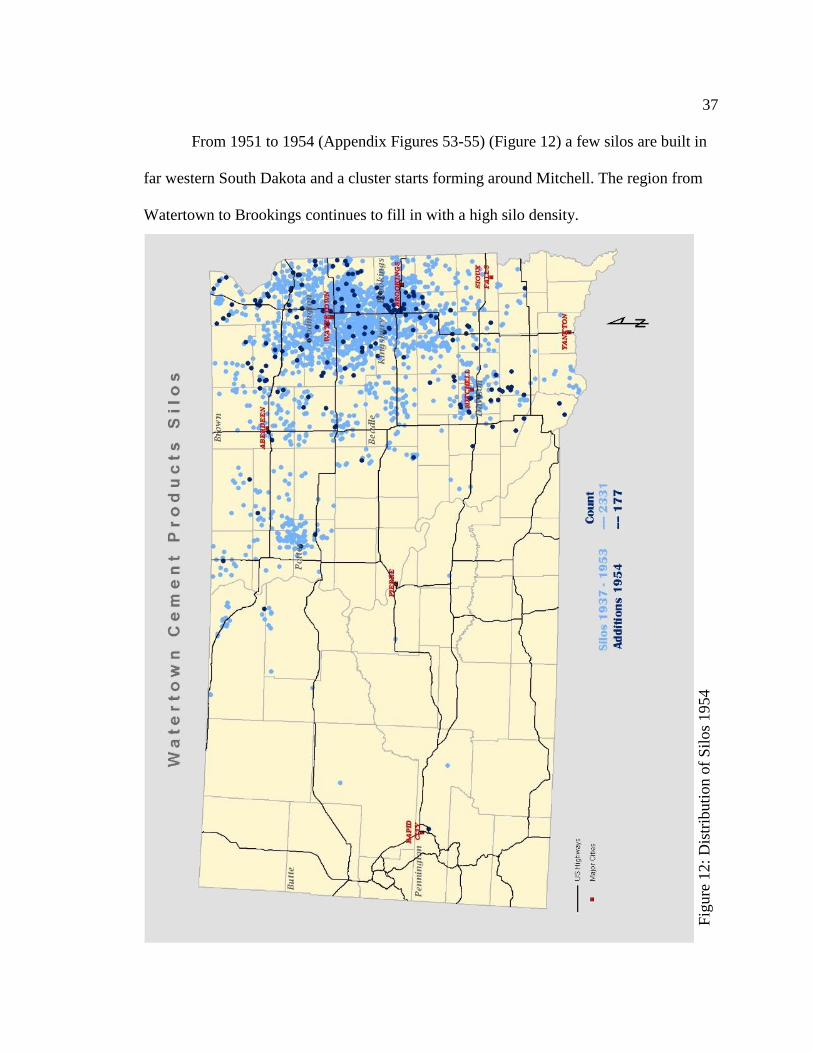
From 1951 to 1954 (Appendix Figures 53-55) (Figure 12) a few silos are built in
far western South Dakota and a cluster starts forming around Mitchell. The region from
Watertown to Brookings continues to fill in with a high silo density.
Fig
ure
12:
Dis
trib
uti
on o
f S
ilos
1954

38
Years 1955 through 1958 (Appendix Figures 56-58) (Figure 13) show a general
decline in WCPC silo sales except for a brief increase in 1958. Sales records in 1958
show a large number of small twenty foot tall silos built that were used for grain storage
(Belden, 2012).
Fig
ure
13:
Dis
trib
uti
on o
f S
ilos
19
58
39
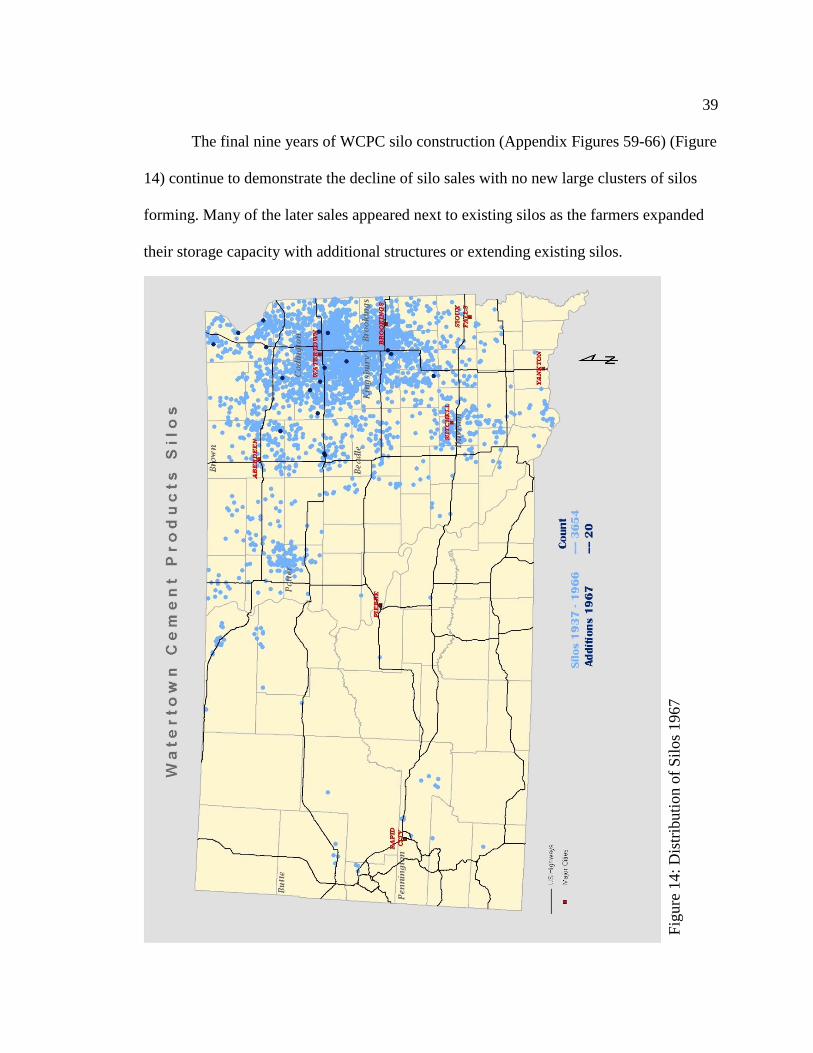
The final nine years of WCPC silo construction (Appendix Figures 59-66) (Figure
14) continue to demonstrate the decline of silo sales with no new large clusters of silos
forming. Many of the later sales appeared next to existing silos as the farmers expanded
their storage capacity with additional structures or extending existing silos.
Fig
ure
14:
Dis
trib
uti
on o
f S
ilos
196
7

40
Four areas are studied in detail to observe the effects of diffusion. The first area is
in Codington County around Watertown (Figure 15), centered on the company
headquarters and one of the first areas where WCPC silos were built. The second area of
interest is Brookings and Kingsbury Counties (Figure 16) which had the greatest density
of silo construction. The third area of study is around Hoven, SD (Figure 17). This is an
area of moderate silo density, but separated from the main concentration of silos in the
eastern part of the state. The fourth area is in southeastern Brown County focused on
Figure 15: Codington County

41
Groton (Figure 18). The four areas were studied primarily with maps of silo placement.
Personal interviews in person or by phone were conducted with people associated with
Watertown Cement Products and farmers that were either end users or related to the
original silo purchaser. Finding an original owner of a silo built even as late as 1960 was
difficult. The silos of most interest in this study were built before 1951. The sons and
daughters of those farmers are now in their 60s and 70s.
Figure 16: Brookings/Kingsbury Counties

42
Figure 17: Hoven Area
Figure 18: Southeast Brown County

43
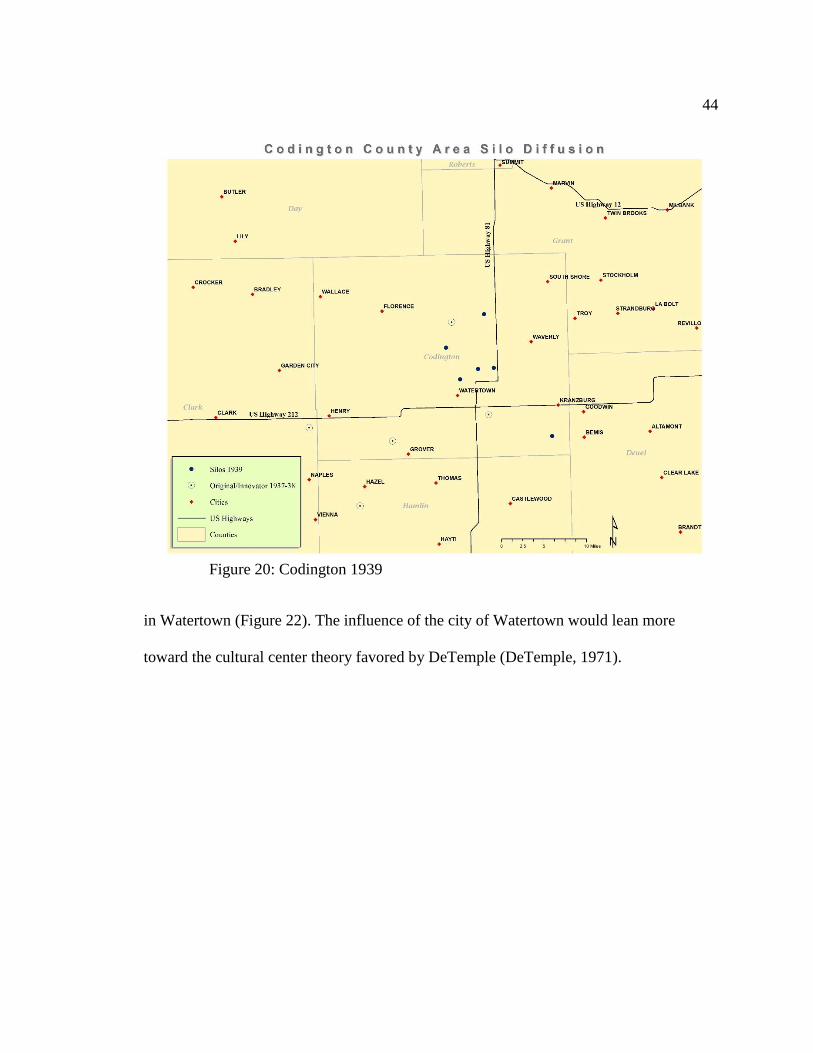
Codington County
Codington County is an important area to analyze because of the possible
influence of the company headquarters in Watertown. The Watertown area also has some
of the first silos built by WCPC. Two early adopters were north of Watertown and
southeast of Watertown (Figure 19) and three others southwest of Watertown. A
Hägerstrand style diffusion should show new silos being constructed around these early
innovators. Figures 20 and 21show that subsequent silos are positioned closer to
Watertown than the two early adopters. There may have been some influence by those
early adopters, since silos appear between those early farms and the manufacturing center
Figure 19: Codington 1937-38
44
in Watertown (Figure 22). The influence of the city of Watertown would lean more
toward the cultural center theory favored by DeTemple (DeTemple, 1971).
Figure 20: Codington 1939

45
Figure 22: Codington 1941
Figure 21: Codington 1940

46
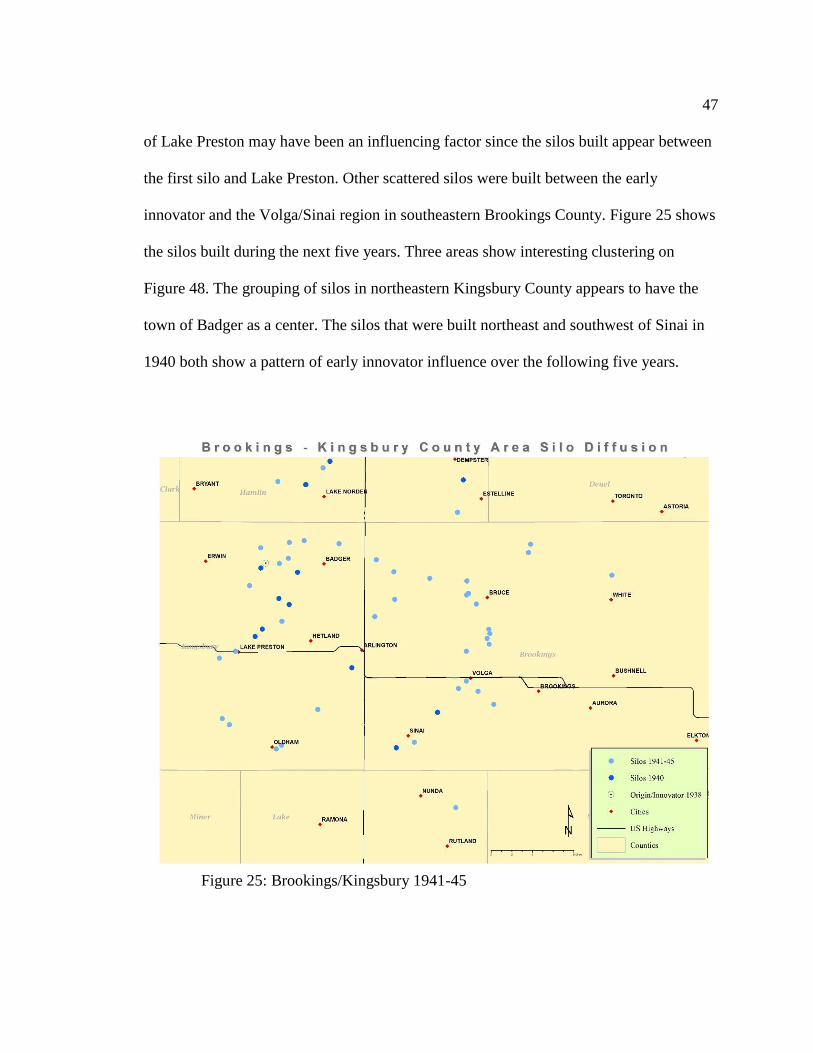
Brookings - Kingsbury Counties
The Brookings - Kingsbury Counties study area shows a single early innovator in
Kingsbury County between Erwin and Badger (23). Silos built in that area in 1940
(Figure 24), show a cluster of silos near the early innovator, but also show that the town
Figure 23: Brookings/Kingsbury 1938
Figure 24: Brookings/Kingsbury 1940
47
of Lake Preston may have been an influencing factor since the silos built appear between
the first silo and Lake Preston. Other scattered silos were built between the early
innovator and the Volga/Sinai region in southeastern Brookings County. Figure 25 shows
the silos built during the next five years. Three areas show interesting clustering on
Figure 48. The grouping of silos in northeastern Kingsbury County appears to have the
town of Badger as a center. The silos that were built northeast and southwest of Sinai in
1940 both show a pattern of early innovator influence over the following five years.
Figure 25: Brookings/Kingsbury 1941-45

48
A possible explanation for the high volume of silos in the Brookings - Kingsbury
area comes from the company salesman, Bob Kirby. Kirby stated that a local Brookings
banker, Horace Fishback, felt that a silo was an important piece of any farm operation.
He made the purchase of a silo a requirement for any loan from his bank. He also referred
farmers to Watertown Cement Products as a recommended silo company (Kirby, 2012).
Interviews with Brookings County farmers did not completely confirm this story, but
many understood why it could be true. Larry Diedrich stated that his father always
listened when Horace Fishback spoke (Diedrich, 2012). Jim Kleinjan said that Horace
Fishback was a “farmer's banker” (Kleinjan, 2012). An interview with Horace Fishback's
son Van confirmed that Horace was committed to agriculture in the area even though he
could not confirm the 'silos and loans' story (Fishback, 2013). One interviewed farmer,
Perry Sutton, had heard the same story and always wondered if Horace Fishback had
been an investor in Watertown Cement Products (Sutton, 2012). This possible connection
in a local community may have been as influential in the diffusion of silos as an
innovative silo owning neighbor.
49
Hoven
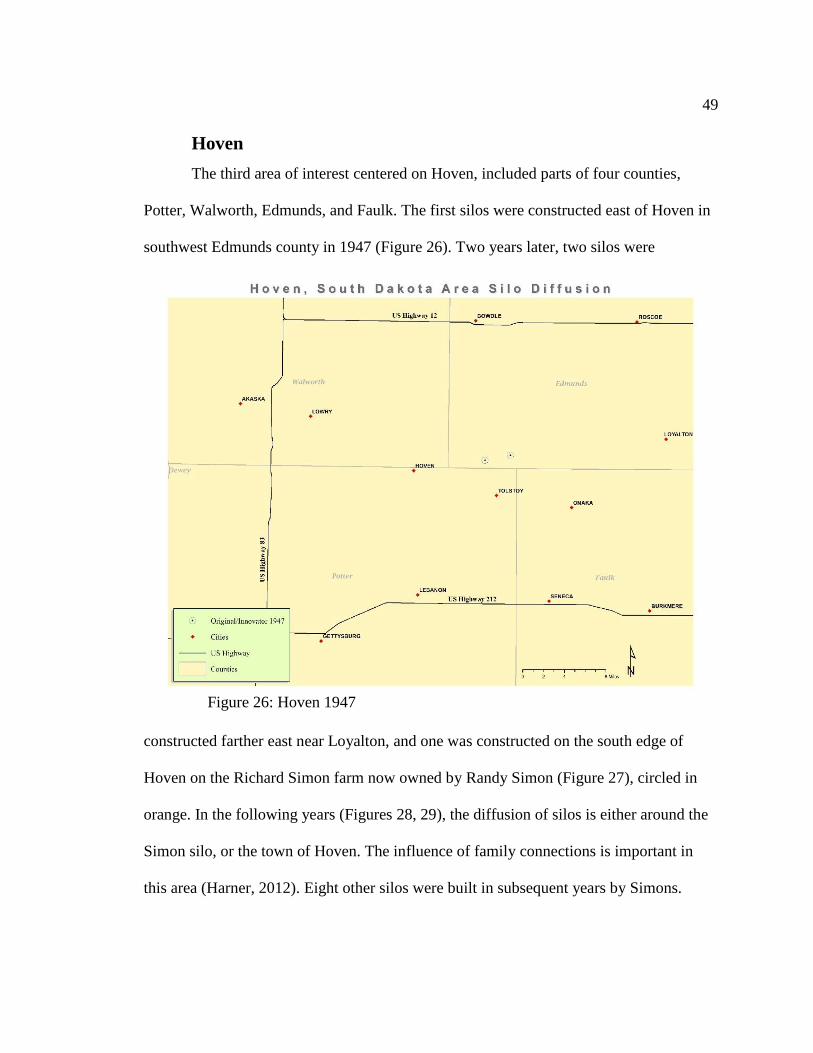
The third area of interest centered on Hoven, included parts of four counties,
Potter, Walworth, Edmunds, and Faulk. The first silos were constructed east of Hoven in
southwest Edmunds county in 1947 (Figure 26). Two years later, two silos were
constructed farther east near Loyalton, and one was constructed on the south edge of
Hoven on the Richard Simon farm now owned by Randy Simon (Figure 27), circled in
orange. In the following years (Figures 28, 29), the diffusion of silos is either around the
Simon silo, or the town of Hoven. The influence of family connections is important in
this area (Harner, 2012). Eight other silos were built in subsequent years by Simons.
Figure 26: Hoven 1947

50
The first two silos in southwest Edmunds County were built by Elmer Holweger and J. R.
Voegele, who were related by marriage (Harner, 2012). Another brother-in-law, John
Figure 27: Hoven 1949
Figure 28: Hoven 1950-51
51
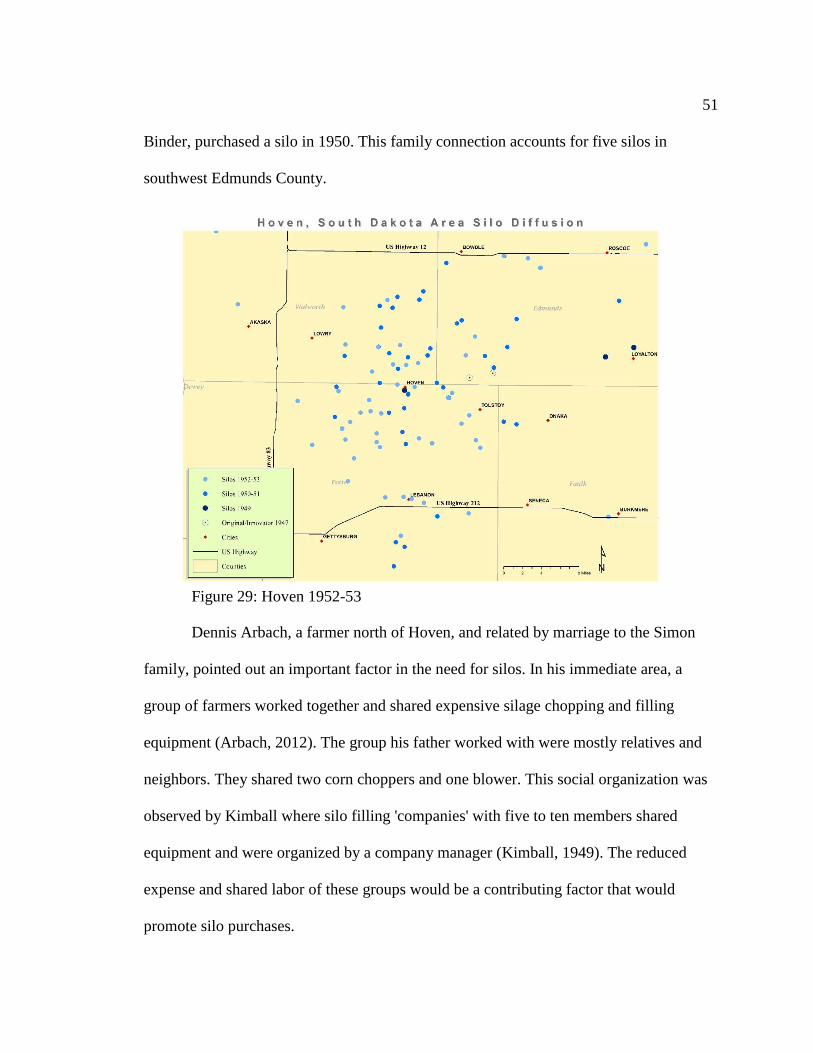
Binder, purchased a silo in 1950. This family connection accounts for five silos in
southwest Edmunds County.
Dennis Arbach, a farmer north of Hoven, and related by marriage to the Simon
family, pointed out an important factor in the need for silos. In his immediate area, a
group of farmers worked together and shared expensive silage chopping and filling
equipment (Arbach, 2012). The group his father worked with were mostly relatives and
neighbors. They shared two corn choppers and one blower. This social organization was
observed by Kimball where silo filling 'companies' with five to ten members shared
equipment and were organized by a company manager (Kimball, 1949). The reduced
expense and shared labor of these groups would be a contributing factor that would
promote silo purchases.
Figure 29: Hoven 1952-53
52
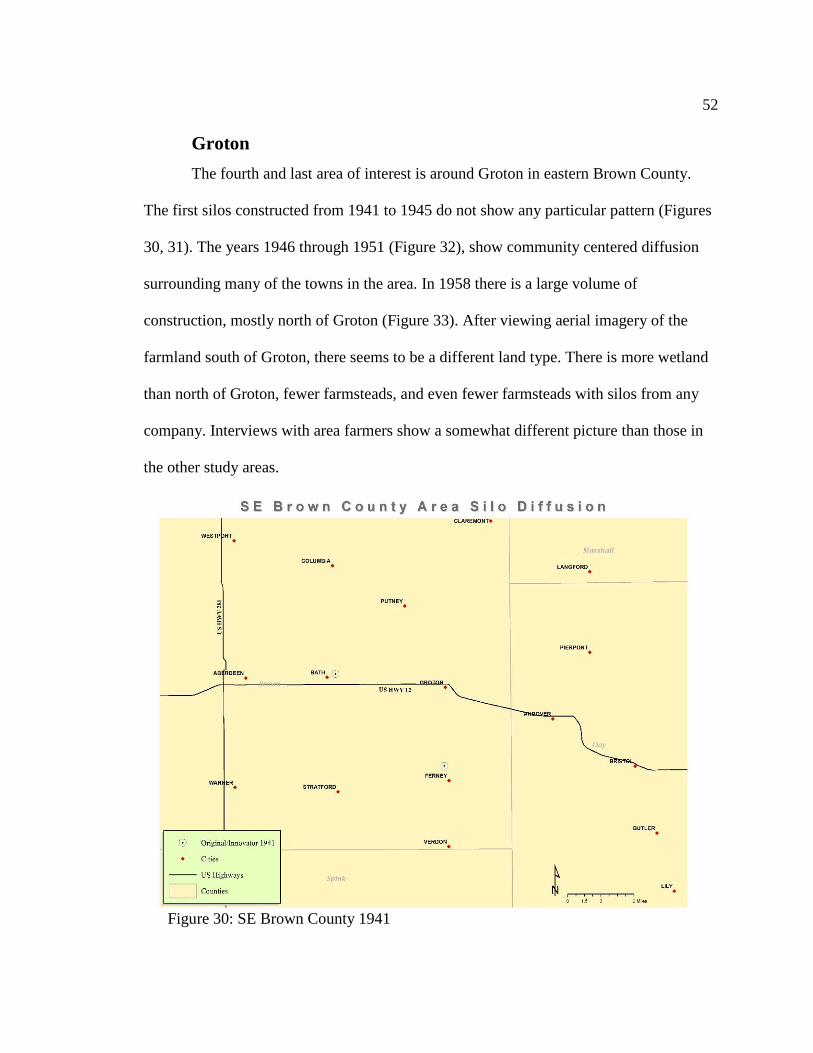
Groton
The fourth and last area of interest is around Groton in eastern Brown County.
The first silos constructed from 1941 to 1945 do not show any particular pattern (Figures
30, 31). The years 1946 through 1951 (Figure 32), show community centered diffusion
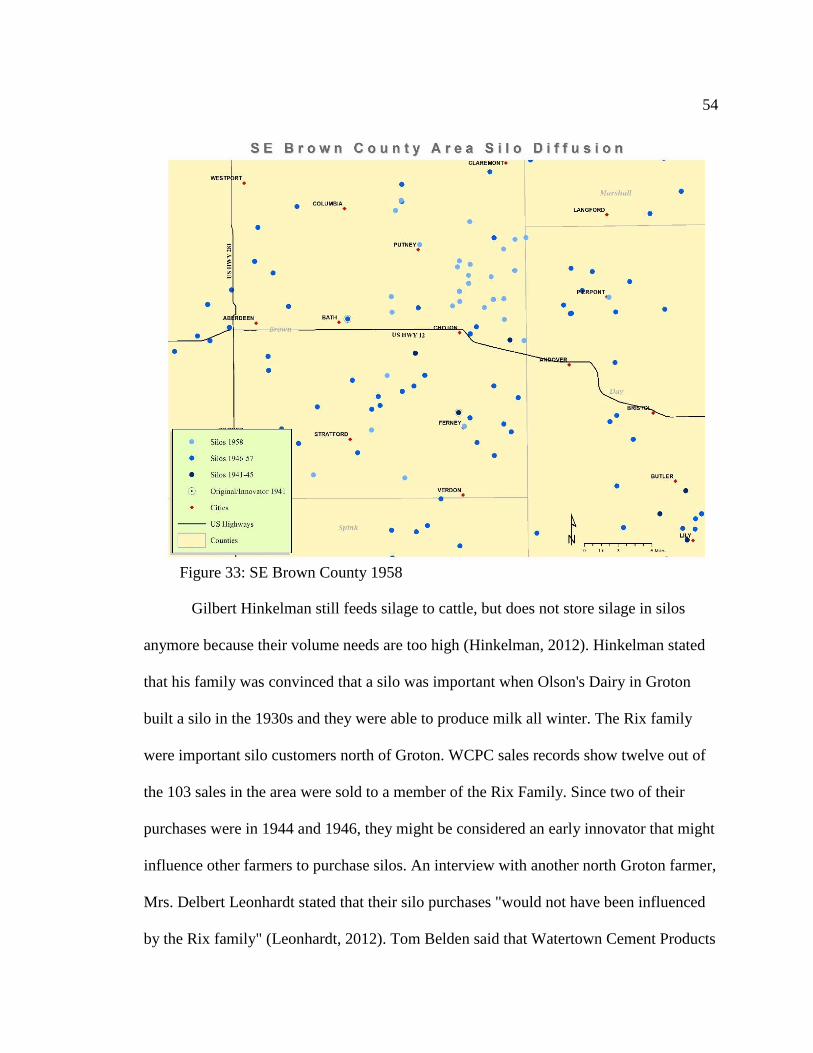
surrounding many of the towns in the area. In 1958 there is a large volume of
construction, mostly north of Groton (Figure 33). After viewing aerial imagery of the
farmland south of Groton, there seems to be a different land type. There is more wetland
than north of Groton, fewer farmsteads, and even fewer farmsteads with silos from any
company. Interviews with area farmers show a somewhat different picture than those in
the other study areas.
Figure 30: SE Brown County 1941

53
Figure 32: SE Brown County 1951
Figure 31: SE Brown County 1941-45
54
Gilbert Hinkelman still feeds silage to cattle, but does not store silage in silos
anymore because their volume needs are too high (Hinkelman, 2012). Hinkelman stated
that his family was convinced that a silo was important when Olson's Dairy in Groton
built a silo in the 1930s and they were able to produce milk all winter. The Rix family
were important silo customers north of Groton. WCPC sales records show twelve out of
the 103 sales in the area were sold to a member of the Rix Family. Since two of their
purchases were in 1944 and 1946, they might be considered an early innovator that might
influence other farmers to purchase silos. An interview with another north Groton farmer,
Mrs. Delbert Leonhardt stated that their silo purchases "would not have been influenced
by the Rix family" (Leonhardt, 2012). Tom Belden said that Watertown Cement Products
Figure 33: SE Brown County 1958
55
was the closest local dealer and no other companies tried to sell in the Groton area
(Belden, 2012). Belden also pointed to the high volume of twenty foot silos that were
built to be used as grain storage and not for silage. Twenty-six out of the 103 Groton area
silos match the description of a grain storage structure, including five at the Ferney
Farmer's Elevator. Four of the twelve Rix silos were probably grain storage structures
and twenty-one out of the thirty-four sales in 1958 could have been used for grain storage
only.
Observations in these four areas tend to show more influence from a community
than from an early innovator. The Hoven area is problematic since an early silo is built on
the south edge of the town. It would be impossible to separate the influence of the early
innovator from the community. The other study areas where the early silos are miles
away from the local cultural center give more value to the community/cultural center
theory posited by DeTemple (DeTemple, 1971). The high number of silos in the
Brookings area that may have been promoted by the Brookings banker Horace Fishback
could not be confirmed by interviews. The type of farming and the ability to grow quality
silage during the right time period and latitude may have as much influence on the high
numbers of silos.

56
Silo Decline
The decline of silo numbers is almost as interesting as the expansion and diffusion
of stave silos. The reasons for the decline in WCPC silo numbers may be the result of a
wide range of reasons. Cattle numbers, the improvements in pit silage methods,
competition, and/or corn as an important cash crop are all probably partially responsible
for declining silo sales. Even when silo numbers began declining after 1951 (Figure 34),
the volume of silage storage did not fall as fast since the size of silos was increasing in
the late 1950s and 1960s (Figure 35). A standard silo sold before 1950 was 14 feet in
diameter and 30 feet high (14 x 30). In 1960, a more common size was 20 x 50. The 14 x
Figure 34: Silo Sales per Year
Figure 35: Silo Volume per Year
0
100
200
300
400
1937 1939 1941 1943 1945 1947 1949 1951 1953 1955 1957 1959 1961 1963 1965 1967
Silo Sales
Count
57
30 silo holds 4618 cubic feet of feed, while a 20 x 50 silo can hold more than three times
as much with 15,707 cubic feet of storage volume.
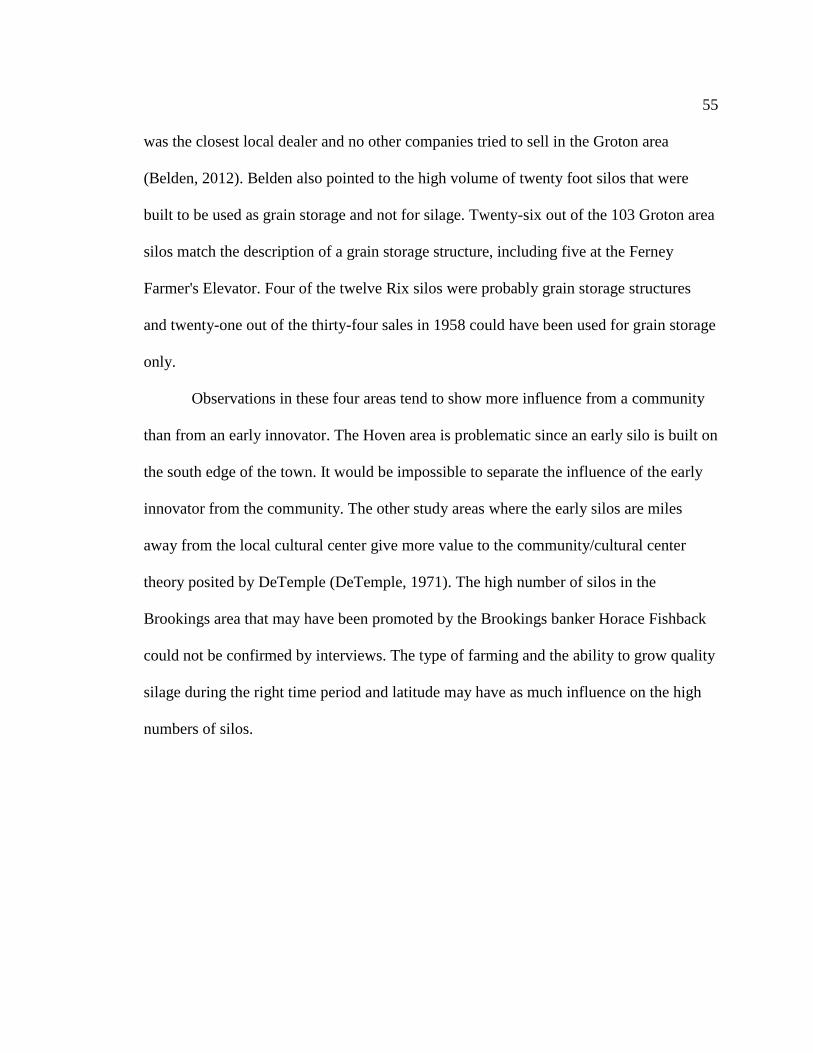
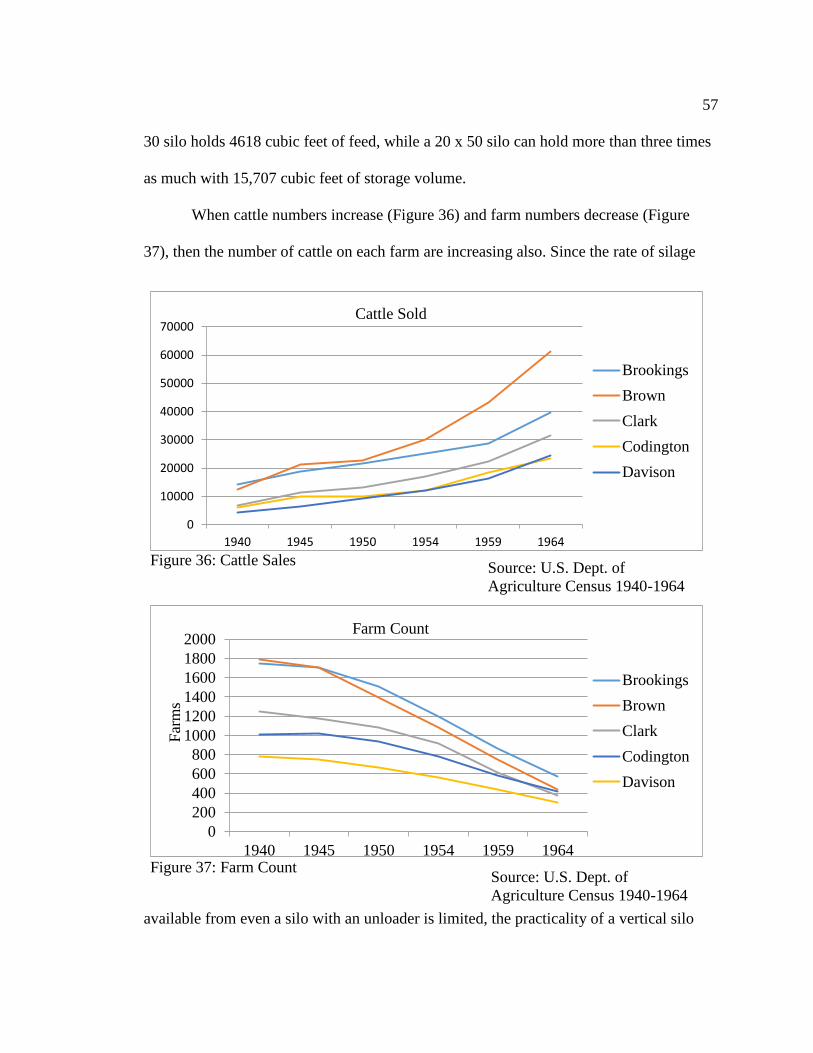
When cattle numbers increase (Figure 36) and farm numbers decrease (Figure
37), then the number of cattle on each farm are increasing also. Since the rate of silage
available from even a silo with an unloader is limited, the practicality of a vertical silo
Figure 36: Cattle Sales
Figure 37: Farm Count
0
10000
20000
30000
40000
50000
60000
70000
1940 1945 1950 1954 1959 1964
Brookings
Brown
Clark
Codington
Davison
Cattle Sold
0
200
400
600
800
1000
1200
1400
1600
1800
2000
1940 1945 1950 1954 1959 1964
Brookings
Brown
Clark
Codington
Davison
Farm Count
Far
ms
Source: U.S. Dept. of
Agriculture Census 1940-1964
Source: U.S. Dept. of
Agriculture Census 1940-1964
58
declines with higher cattle numbers if the farmer wishes to finish his feeding in a
reasonable amount of time each day. Wayne Berkland in Brookings County started
storing silage in pits because the process of feeding from a silo was too slow (Berkland,
2012). Depending on the size of the loader bucket, a farmer can move one-half to three
quarters of a ton of silage with each load.
Early pit silage had problems with spoilage from soil contamination when using a
hole in the ground or a notch cut into a hillside. Modern pit silage systems are generally
made with concrete walls and floors. An efficient system has a drainage system that
keeps liquids from collecting in the bottom of the pit and the pit is long and narrow to
keep the air exposure of silage to a minimum. A pit system requires large, heavy
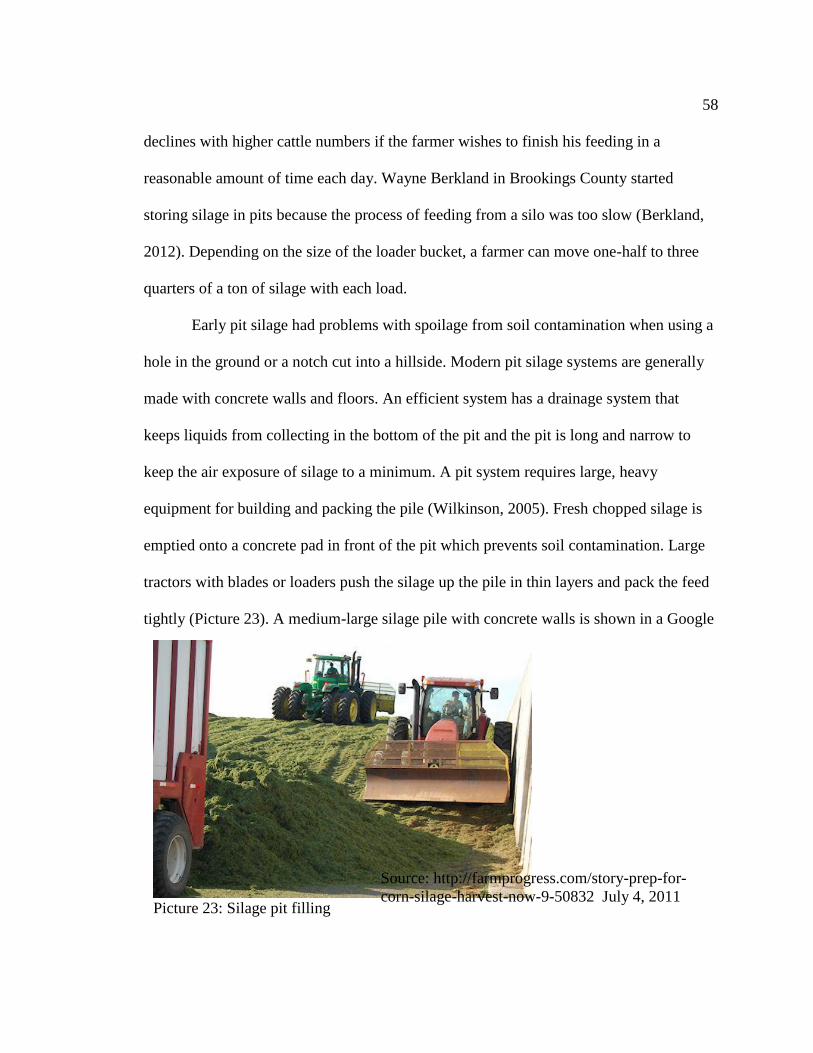
equipment for building and packing the pile (Wilkinson, 2005). Fresh chopped silage is
emptied onto a concrete pad in front of the pit which prevents soil contamination. Large
tractors with blades or loaders push the silage up the pile in thin layers and pack the feed
tightly (Picture 23). A medium-large silage pile with concrete walls is shown in a Google
Picture 23: Silage pit filling
Source: http://farmprogress.com/story-prep-for-
corn-silage-harvest-now-9-50832 July 4, 2011
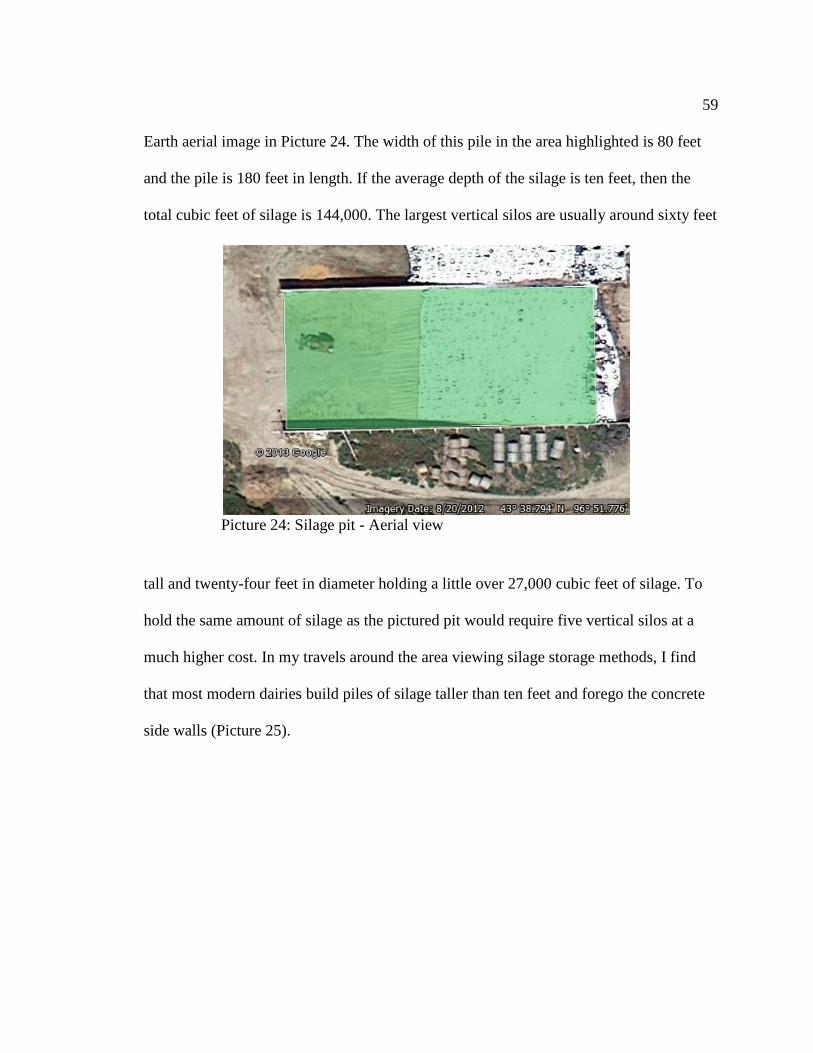
59
Earth aerial image in Picture 24. The width of this pile in the area highlighted is 80 feet
and the pile is 180 feet in length. If the average depth of the silage is ten feet, then the
total cubic feet of silage is 144,000. The largest vertical silos are usually around sixty feet
tall and twenty-four feet in diameter holding a little over 27,000 cubic feet of silage. To
hold the same amount of silage as the pictured pit would require five vertical silos at a
much higher cost. In my travels around the area viewing silage storage methods, I find
that most modern dairies build piles of silage taller than ten feet and forego the concrete
side walls (Picture 25).
Picture 24: Silage pit - Aerial view

60
Competition from other silo companies may have been an important factor in the
decline of WCPC silo production. In northeastern South Dakota, silos built after 1960 are
mostly built by Hanson Silo Company of Luverne, Minnesota, Madison Silo with the
closest plant in Detroit Lakes, Minnesota, or Appleton Silo in Marshall, Minnesota. It is
not clear whether these companies increased their sales because of the closing of
Watertown Cement Products in 1967 or if they were able to offer a better product at a
lower price and were partly responsible for declining WCPC sales. The fiberglass lined
steel silos (Picture 26) most commonly sold by the Harvestore Company were an
expensive but popular competitor to the stave silo.
Picture 25: Dairy Silage Pits
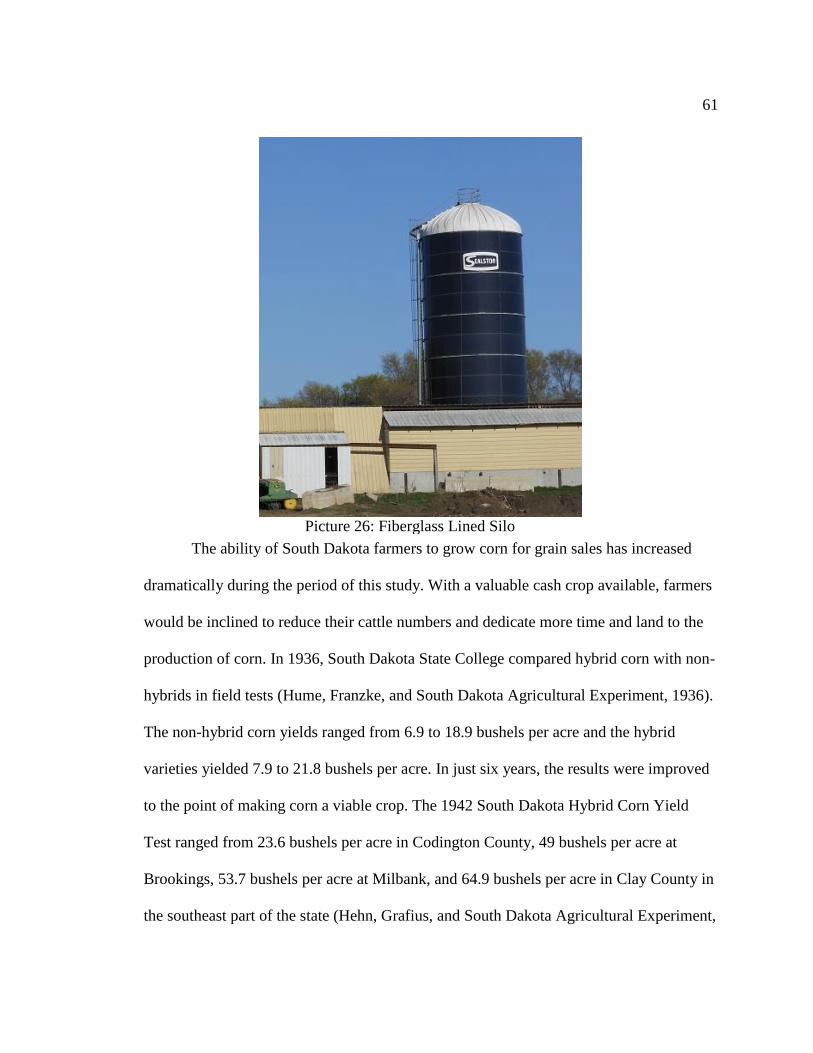
61
The ability of South Dakota farmers to grow corn for grain sales has increased
dramatically during the period of this study. With a valuable cash crop available, farmers
would be inclined to reduce their cattle numbers and dedicate more time and land to the
production of corn. In 1936, South Dakota State College compared hybrid corn with non-
hybrids in field tests (Hume, Franzke, and South Dakota Agricultural Experiment, 1936).
The non-hybrid corn yields ranged from 6.9 to 18.9 bushels per acre and the hybrid
varieties yielded 7.9 to 21.8 bushels per acre. In just six years, the results were improved
to the point of making corn a viable crop. The 1942 South Dakota Hybrid Corn Yield
Test ranged from 23.6 bushels per acre in Codington County, 49 bushels per acre at
Brookings, 53.7 bushels per acre at Milbank, and 64.9 bushels per acre in Clay County in
the southeast part of the state (Hehn, Grafius, and South Dakota Agricultural Experiment,
Picture 26: Fiberglass Lined Silo

62
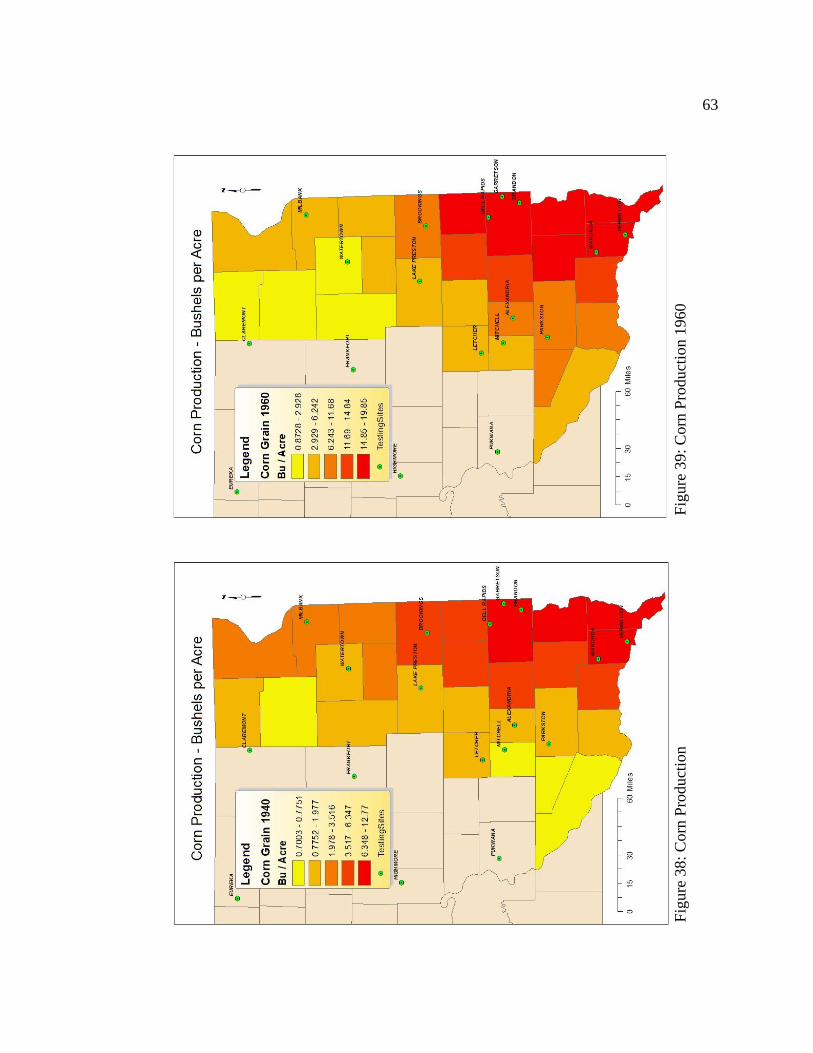
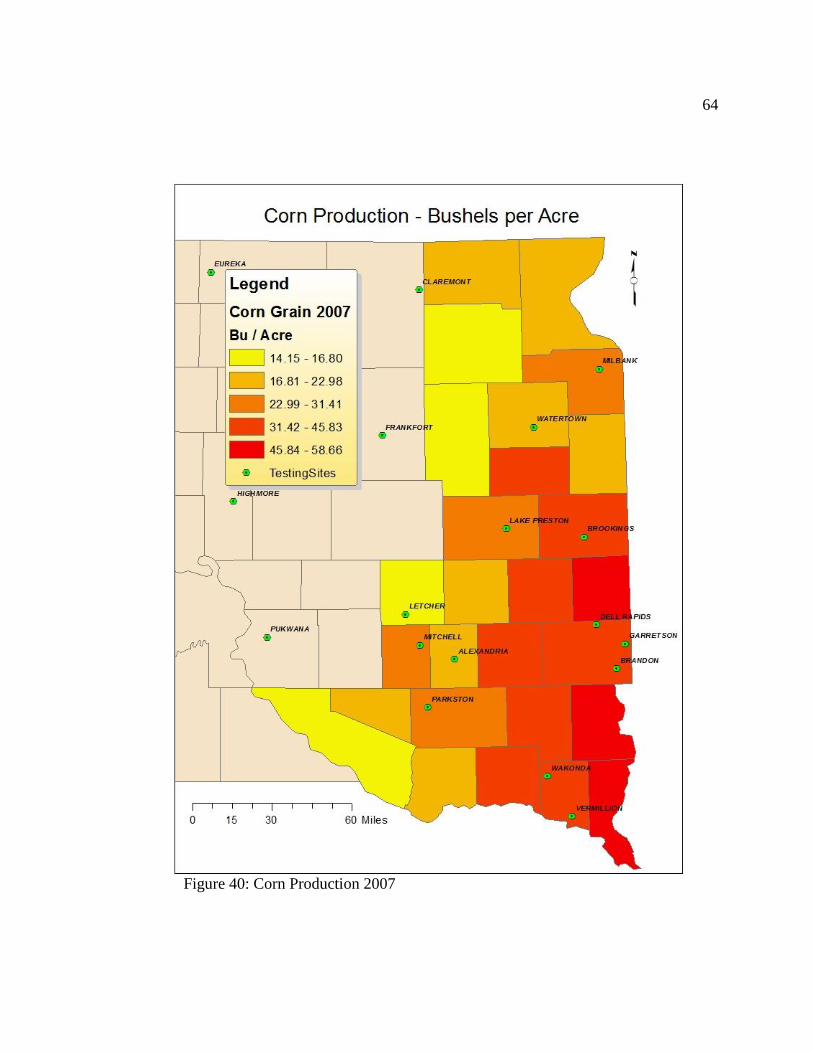
1943). Modern yields are generally over 100 bushels per acre even during dry years
(USDA, 2013). Figures 38, 39, and 40 compare the corn for grain harvests in 1940, 1960,
and 2007 in the most common corn producing counties in eastern South Dakota. The
maps also indicate testing sites used in the previously mentioned studies. The bushels per
acre numbers are calculated by dividing the total harvest of each county by the total acres
of land in that county. These numbers are lower than actual crop yields, but offer an
accurate comparison over the years studied. The lowest producing counties in 2007
produce more corn than the highest production counties in 1940.
63
Fig
ure
38:
Corn
Pro
duct
ion
1940
Fig
ure
39:
Corn
Pro
duct
ion 1
960
64
Figure 40: Corn Production 2007

65
As the silos were abandoned as silage storage, other uses for the structure were
sometimes found. The most common use was storage for high moisture shelled corn that
was also used for a cattle feed (Diedrich, 2012). Since WCPC silos were a prominent
structure in the farmyard with the farmer or farm name boldly displayed with large white
letters, the farmer may have kept them intact for advertising purposes. Many farms still
take the time to repaint the letters and date to keep them visible even though the silo is
not currently used. A Hoven area farmer spread hay and straw in the bottom of his silo
every year for the pigeons to use for nesting material (Arbach, 2012).
When the farmer no longer needs his silo, he may choose to have it torn down.
The Kleinjan farm north of Volga carefully dismantled a silo and used any undamaged
staves to extend the height of another silo by twelve feet (Kleinjan, 2012). A more
common method involves pulling the silo over with a caterpillar tractor and burying the
debris in the ground (Diedrich, 2012) (Picture 27). After many years of standing in South
Dakota, the chance of a tornado tearing the silo down is good. Two of the farmers
interviewed reported having a tornado destroy their silo (Hope, 2012; Naef, 2013).

66
Picture 27: Silo Destruction
Source: SD Agriculture
Museum 1992

67
South Dakota Agricultural Economies
An important factor in the makeup of farms in South Dakota is the change in farm
size and organization over the period of this study. From 1937 to 1967 the number of
farms in the study counties has fallen sharply (Figure 41). Assuming that the number of
acres being farmed in these counties remains constant, then the size of each farm must be
increasing. As farm size increases, then the farm is able to support a larger herd of cattle.
If the farmer is keeping dairy cattle, or trying to fatten beef cattle over the winter months,
then it would make sense to have a way to keep high quality feed during the winter.
Figure 41: Farm Count
Source: U.S. Dept. of Agriculture
Census 1940 -1964

68
Figures 42 and 43 show the trends in cattle over the period of this study. Dairy
cattle showed some decline until 1950 and a more rapid decline in numbers after 1950. At
the same time, total cattle numbers were on the rise which points to either larger numbers
Figure 42: Dairy Cows Milked
Figure 43: Cattle Sold
0
10000
20000
30000
40000
50000
60000
70000
1940 1945 1950 1954 1959 1964
Brookings
Brown
Clark
Codington
Davison
Cattle Sold
Source: U.S. Dept. of Agriculture
Census 1940 -1964
Source: U.S. Dept. of Agriculture
Census 1940 -1964
69
of cow/calf pairs or the more likely use of the farm as a feedlot to fatten cattle for sale to
a processing company. When dairy cattle numbers have been reduced, and cattle numbers
are rising, feeding operations are the only way to account for the increase in cattle sales.
A South Dakota State University economics report from 1983 stated the following:
The dairy production industry has been transformed in 20 years
from a large number of farms each milking a few cows to relatively few
highly specialized dairy farms. (Janssen and Edelman, 1983)
70
Chapter 5 – Discussion and Conclusions
Driving Questions Revisited
This chapter addresses the questions posed in Chapter 1 and presents some
conclusions of the complete thesis.
How has silage technology changed over time and how has this change impacted the
agricultural landscape of South Dakota?
Storage of silage has transitioned from pits in the ground to vertical silos of
various types and back to horizontal storage in concrete lined pits and large piles that are
now found in the large dairy operations in eastern South Dakota. Silage is still an
important animal feed source, and is seen in large quantities in the scattered dairies that
generally milk 3000 to 5000 cows. The visual landscape of the area is still dominated by
the now mostly empty vertical stave silo. New construction of vertical silo of any type
has essentially stopped. The most recently constructed silo encountered during this study
was a Hanson concrete stave silo built in 2010, but it appears to be a rare occurrence.
What factors have influenced the decline of silo construction in South Dakota?
The main factors reducing vertical silo construction are the changes in farm size
and the type of crop production available to the modern farmer. The importance of corn
and possibly soybeans as a cash crop has reduced the need for the farmer to want or need
to deal with cattle.
71
Why was the WCPC so historically successful, or was it?
Watertown Cement Products Company was conveniently situated to take
advantage of the need for silage storage when the popularity of silo was on the rise in the
state. A concrete stave silo built from precast staves was probably the most economical
and rapid method of silo construction during the thirty years of this study. The building of
over 3500 large farm structure in thirty years would qualify WCPC as a successful
business.
What is the geography of silo adoption and which diffusion theories best fit silo
adoption in South Dakota?
The spread of WCPC silos shows an obvious spread out from the company
headquarters in Watertown with multiple cluster expansions in various neighboring
counties. The diffusion tendencies appear to be a combination of the innovator centered
Hägerstrand model and the local cultural centered DeTemple model. Family connections
favor the innovator model in the Hoven cluster while much of the expansion in
Codington and Brookings counties tends to occur in the space between the early
innovator and a local community.
Is there a genuine clustering of silo construction in northeastern South Dakota?
This study focused on four varied clusters, but could have selected many other
clusters of various sizes. Clusters appeared and grew over various time periods, later
clusters tended to be farther from the Watertown center. The Silo Point Density map

72
(Figure 9) shows over a dozen clusters of various densities that were available for
analysis.
When traveling in time from 1937 to 1967 observing the spread of silos out from
the headquarters at Watertown, cluster patterns are obviously more than just random
placement.
In the Codington County analysis, the early silo construction appears to have a
similar or equal influence on subsequent silo placement. Small communities in the area
show a similar clustering influence.
The Brookings/Kingsbury County analysis demonstrates a similar pattern as
shown near Watertown. The early important cultural center appears to be Lake Preston,
but a wider view might give that status to the town of Arlington. A wider and later view
of the area cluster shows the center closer to Brookings.
The observation of the Hoven area cluster is different than the first two studies.
The first two silos built begin as the center of the three silos constructed two years later.
From 1950 on, those two early silos stay on the edge of the cluster and the town of Hoven
becomes the new center. The 1949 silo built by Richard Simon within the city limits of
Hoven may have been an important influence in the clustering process.
Southeastern Brown County cluster patterns are similar to those observed in
Codington County. Groups of silos form between early innovators and the communities
of Groton and Stratford. The first silo constructed near Ferney stands alone for a few
years until a number of silos are built on the opposite side of Ferney.

73
Conclusions
If you drive the roads of northeastern South Dakota, you can hardly miss the
presence of the concrete stave silo. Small, old, abandoned or large and still in use, silos
are found on almost every square mile in South Dakota farm country. Even some of the
western South Dakota ranches have a silo or two next to the barn. One hundred years ago,
a silo was a rare sight in the upper Midwest. This study shows the possible reasons for
silo appearance and dominance on the South Dakota farm landscape.
Watertown Cement Products Company silos along with those of other companies
have been an important fixture in a changing agricultural way of life. The diffusion of
these silos on the plains has demonstrated the influence of both innovative farmers and
local cultural centers. The changing farm moving to mostly grain production or large
scale dairy operations has made most vertical silo use obsolete.
New silo construction does not appear to be a current farming practice. Old
decaying silos will continue to be removed rather than be repaired. If our picture of the
northeast South Dakota farm landscape needs a silo in the frame, then we had better
record our images now.
Future Study
To validate the diffusion of silos observed during this study, it may be interesting
to look at sales by other silo companies in the upper Midwest. The ability to get
comparable results would depend on the quality of sales records. Many of the silo
companies mentioned early in this thesis are no longer in business and may have lost
those sales records.
74
Since the cultural centers appear to be an important diffusion influence, an
analysis of each of those areas would be interesting. The analysis would try to find the
institution in those cultural centers that provides the social structure that is important to
the diffusion process. That institution might be the local cafe, grain elevator, feed store,
or church.
Similar farm structures that are no longer being regularly used on the farm may be
of interest. Corn cribs were used when storing dried ears of corn was common. There are
many still in farm yards, but few are still being used. Most have vines or trees growing in
or around them. Another common farm structure no longer used in northeastern South
Dakota, but commonly used farther west is the windmill. Many farms still have the
windmill tower still standing, but the wind blades and vane are rarely intact.

75
APPENDIX
Figure 44: Distribution of Silos 1939
76
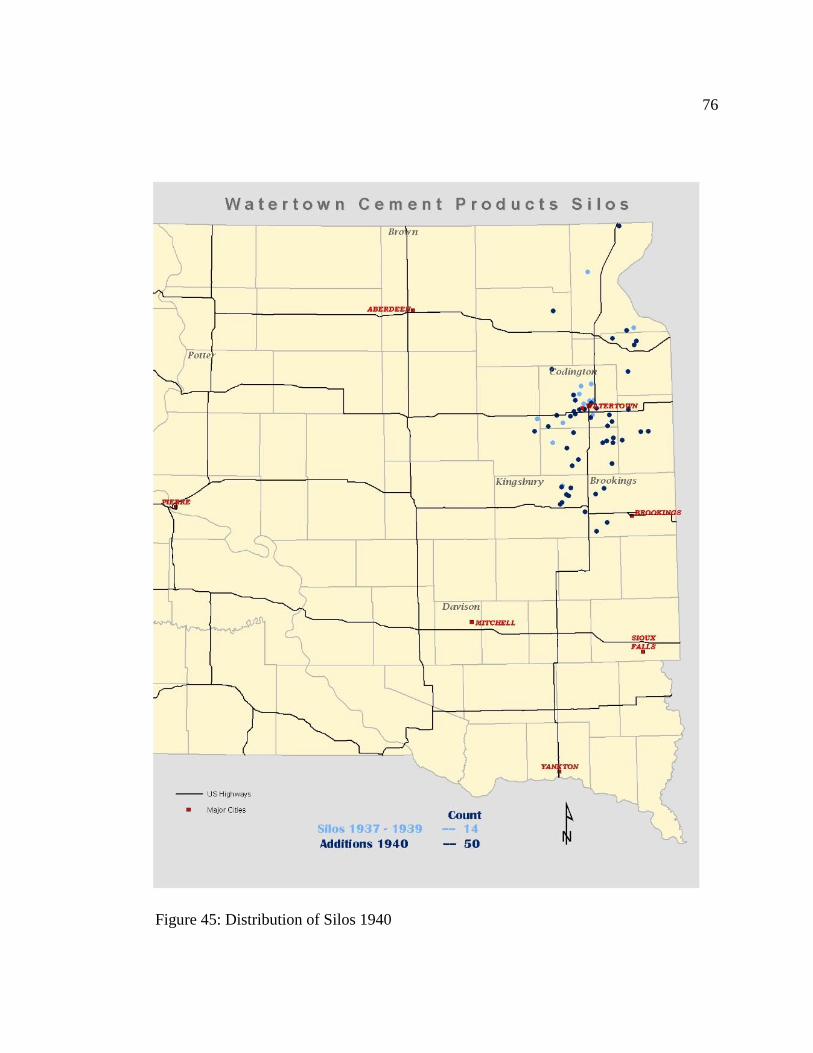
Figure 45: Distribution of Silos 1940
77
Figure 46: Distribution of Silos 1941

78
Figure 47: Distribution of Silos 1942

79
Figure 48: Distribution of Silos 1943
80
Figure 49: Distribution of Silos 1944
81
Figure 50: Distribution of Silos 1945
82
Figure 51: Distribution of Silos 1947

83
Fig
ure
52:
Dis
trib
uti
on o
f S
ilos
1950

84
Fig
ure
53:
Dis
trib
uti
on o
f S
ilos
1951

85
Fig
ure
54:
Dis
trib
uti
on o
f S
ilos
1952
86
Fig
ure
55:
Dis
trib
uti
on o
f S
ilos
1953

87
Fig
ure
56:
Dis
trib
uti
on o
f S
ilos
1955
88
Fig
ure
57:
Dis
trib
uti
on o
f S
ilos
1956

89
Fig
ure
58:
Dis
trib
uti
on o
f S
ilos
1957

90
Fig
ure
59:
Dis
trib
uti
on o
f S
ilos
1959

91
Fig
ure
60:
Dis
trib
uti
on o
f S
ilos
1960
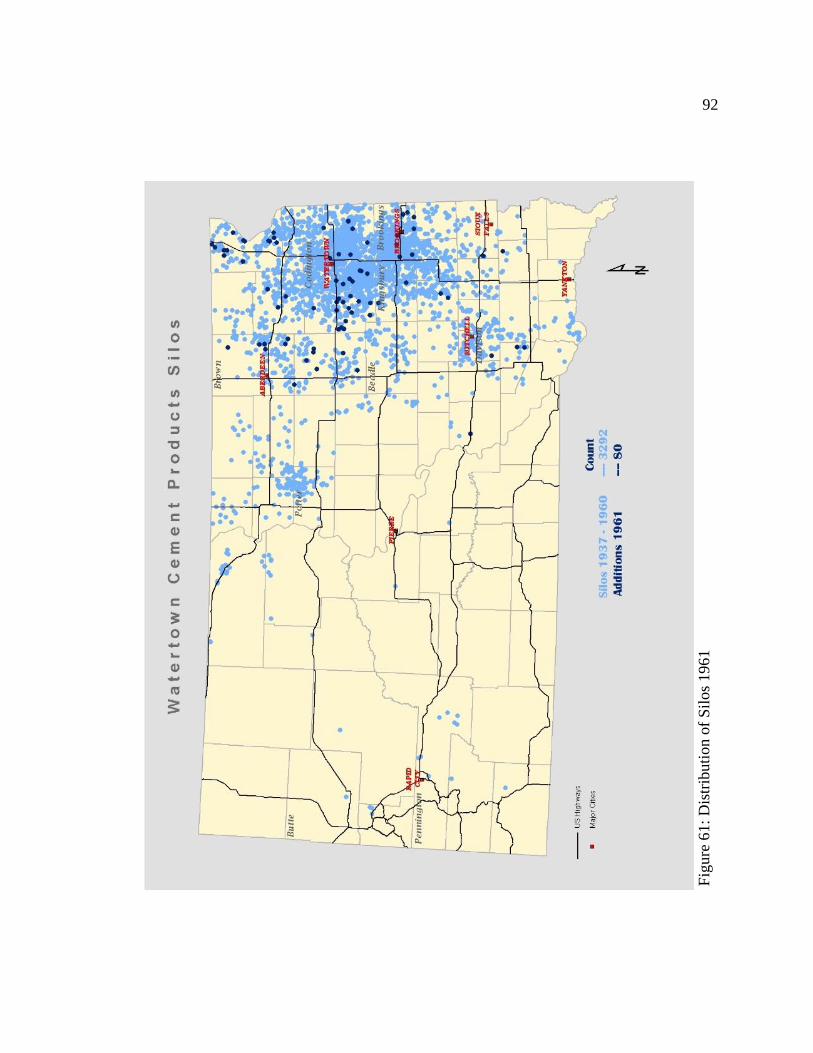
92
Fig
ure
61:
Dis
trib
uti
on o
f S
ilos
1961
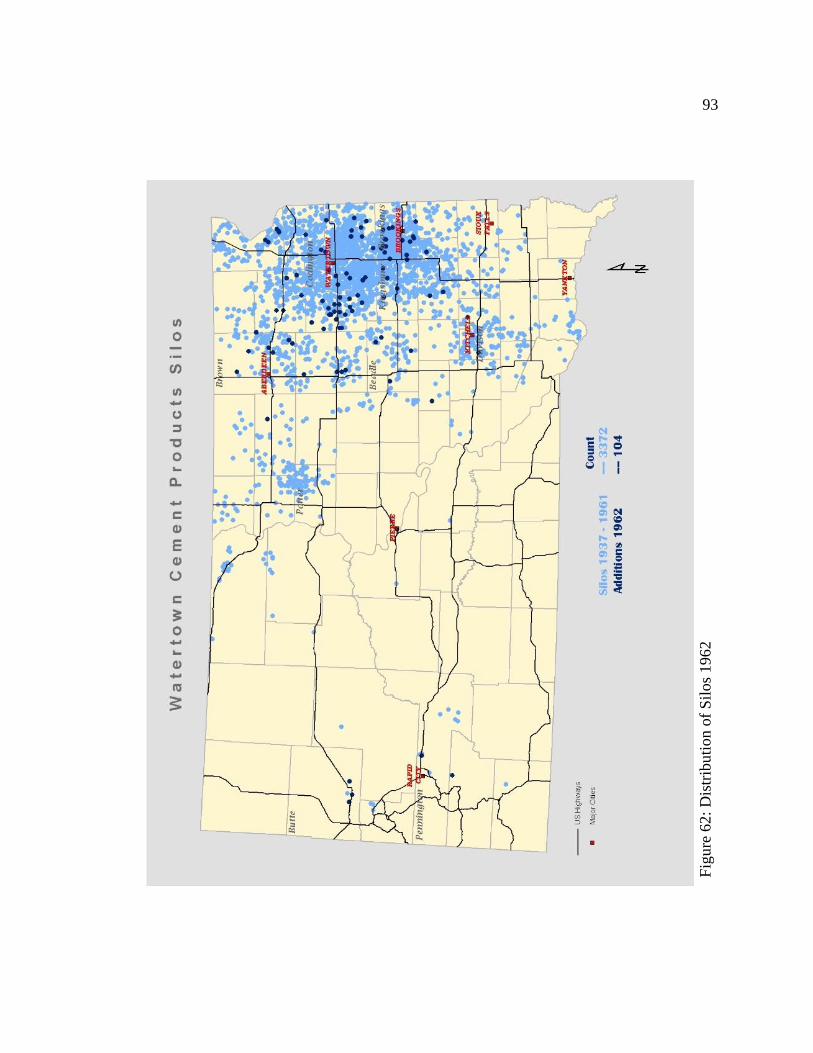
93
Fig
ure
62:
Dis
trib
uti
on o
f S
ilos
1962

94
Fig
ure
63:
Dis
trib
uti
on o
f S
ilos
1963

95
Fig
ure
64:
Dis
trib
uti
on o
f S
ilos
1964

96
Fig
ure
65:
Dis
trib
uti
on o
f S
ilos
1965

97
Fig
ure
66:
Dis
trib
uti
on o
f S
ilos
19
66

98

99
References
Arbach, Dennis (2012). Personal Interview.
Belden, Tom (2012). Personal Interview.
Berkland, Wayne (2012). Personal Interview.
Blaut, James M. (1977). Two Views of Diffusion. Annals of the Association of American
Geographers, 67(3), 343-349. doi: 10.1111/j.1467-8306.1977.tb01146.x
Conzen, Michael P. (2010). The Making of the American landscape (2nd ed.). New York:
Routledge.
Dakota-North Plains Corp. The Dakota farmer. Aberdeen, South Dakota: [Dakota-North
Plains Corp.].
DeTemple, David J. (1971). A space preference approach to the diffusion of innovations;
the spread of Harvestore Systems through northeast Iowa. Bloomington: Dept. of
Geography, Indiana University.
Diedrich, Larry (2012). Personal Interview.
Esser, Irene (2013). Personal Interview.
Farm and ranch directory. (1970) (pp. v.). Algona, Iowa: Directory Service Co.
Fishback, Van. (2013). Personal Interview.
Hägerstrand, Torsten. (1952). The propagation of innovation waves. London: Royal
University of Lund, Dept. of Geography.
Harner, Coleen (2012). Personal Interview.
Hart, John Fraser, and Ziegler, Susy S. (2008). Landscapes of Minnesota : a geography.
St. Paul: Minnesota Historical Society Press.
Hehn, E. R., Grafius, John Edward, and South Dakota Agricultural Experiment, Station.
(1943). The 1942 South Dakota hybrid corn yield test (Vol. 45, pp. 23 p.).
Brookings, S.D.: Agricultural Experiment Station, South Dakota State College.
Hinkelman, Gilbert (2012). Personal Interview.
Hope, Arnold (2012). Personal Interview.
Hudson, John C. (2010). Settlement of the American Grassland. In M. P. Conzen (Ed.),
The Making of the American Landscape. New York: Routledge.

100
Hume, A. N., Franzke, Clifford J., and South Dakota Agricultural Experiment, Station.
(1936). Hybrid corn (Vol. no. 299, pp. 28 p.). Brookings, S.D.: Agronomy Dept.,
Agricultural Experiment Station, South Dakota State College of Agriculture and
Mechanic Arts.
Jackson, John Brinckerhoff. (1994). A sense of place, a sense of time (pp. ix, 212 p.).
New Haven: Yale University Press.
Janssen, Larry, and Edelman, Mark A. (1983). The changing structure of South Dakota
agriculture (Vol. 83-2, pp. vi, 93 p.). Brookings, S.D.: Economics Dept., South
Dakota State University.
Jordan, Terry G., and Rowntree, Lester. (1990). The human mosaic : a thematic
introduction to cultural geography (5th ed.). New York: Harper and Row.
Kimball, Solon Toothaker. (1949). Rural Social Organization and Co-operative Labor.
American Journal of Sociology, 55(1), 38 - 49.
Kirby, Robert. (2006). Watertown Cement Products Sales Log.
Kirby, Robert (2012). Personal Interview.
Kleinjan, James (2012). Personal Interview.
Leonhardt, Mrs. Delbert (2012). Personal Interview.
McCalmont, J. R. (1960). USDA Publication #810 Farm Silos. Washington, D. C.:
United States Department of Agriculture.
Midland Atlas Company. (1975). Atlas of Codington County, South Dakota. Milbank:
The Company.
Naef, Jo (2013). Personal Interview.
Nelson (Thomas O.) Company Fergus Falls Minn. [from old catalog]. (1963). Atlas of
Brookings County, South Dakota. Fergus Falls,.
Noble, Allen G. (1981). The Diffusion of Silos. Landscape, 25(1), 11-14.
Noble, Allen G. (1980). The Evolution of American Farm Silos. Journal of Cultural
Geography, 1(1), 138-148. doi: 10.1080/08873638009478657
Noble, Allen George, and Willhelm, Hubert G. H. (1995). Barns of the Midwest. Athens,
Ohio: Ohio University Press.
Portland Cement Association. (1957). Concrete Stave Silos. In P. C. Association (Ed.).

101
Shaw, Thomas. (1910). Soiling crops and the silo : how to cultivate and harvest the crops;
how to build and fill the silo; and how to use silage (pp. xii, 366 p.). New York:
Orange Judd Co.
Stevens, H. R. (1881). On ensilage of green forage crops in silos : experience with
ensilage at Echo Dale Farm; also the practical experience of twenty-five practical
farmers with ensilage and silos (pp. 120 p.). Boston: Henry R. Stevens.
Sutton, Perry (2012). Personal Interview.
United States. National Park Service. Interagency Resources Division. (1990). Guidelines
for evaluating and documenting rural historic landscapes. Washington, D.C.?:
U.S. Dept. of the Interior, National Park Service, Interagency Resources Division.
Universal Portland Cement Co. (1911). Concrete silos; a booklet of practical information
for the farmer and the rural contractor (1st ed.). Chicago,: Pittsburg, Universal
Portland cement co.
Universal Portland Cement Company. (1914). Concrete silos; a booklet of practical
information for the farmer and the rural contractor (7th ed.). Chicago, Pittsburgh
etc.: Universal Portland Cement Co.
USDA. (2013). Corn and Soybean Production Down in 2012. South Dakota Field
Office: USDA Retrieved from
http://www.nass.usda.gov/Statistics_by_State/South_Dakota/Publications/Field_C
rops_Press_Release/2013/cropan13.pdf.
Watson, Stephen John, and Smith, Alexander Martin joint author. (1956). Silage ([2d]
ed., pp. 144 p.). London: Lockwood.
Wilkinson, J. M. (2005). Silage (pp. viii, 254 p.). Lincoln, U.K.: Chalcombe Publications.