Embed Size (px)
Citation preview
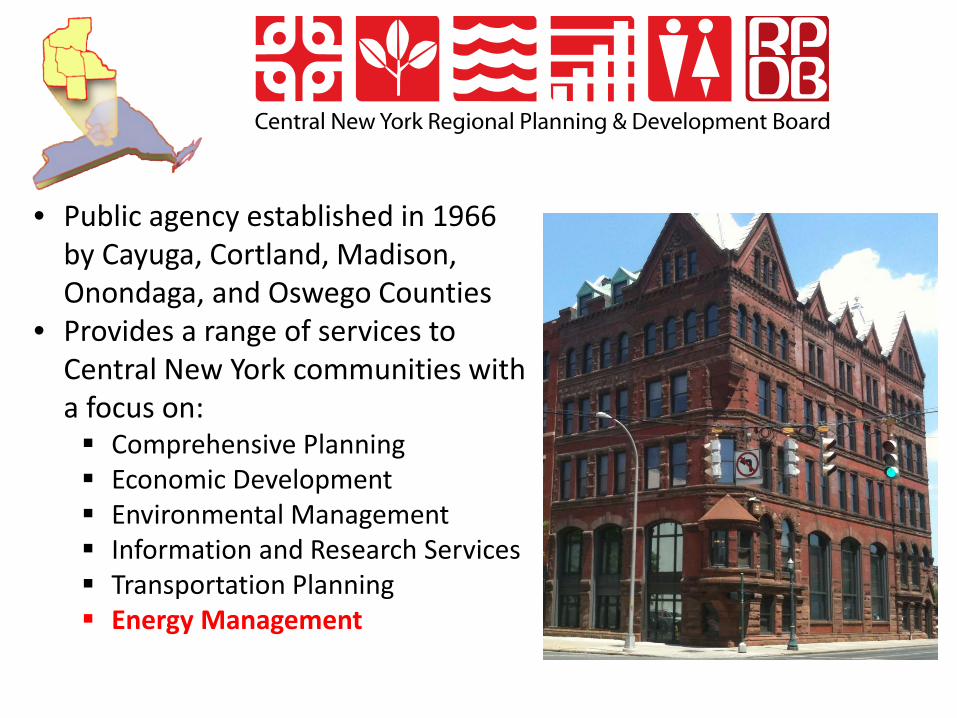
• Public agency established in 1966 by Cayuga, Cortland, Madison, Onondaga, and Oswego Counties
• Provides a range of services to Central New York communities with a focus on: Comprehensive Planning Economic Development Environmental Management Information and Research Services Transportation Planning Energy Management
3
Going Solar Together with SolarizeCNY
How is the Solar Market Changing?How Can Municipalities Prepare and Support It?
Permitting and ZoningNew Construction Guidelines / ChecklistProperty-Assessed Clean Energy (PACE) FinanceSolarize Campaigns
What Support is Available?NYSERDA – Community Solar NY ProgramU.S. Dept. of Energy – SPARC ProgramCNY RPDB – Solarize CNY Program
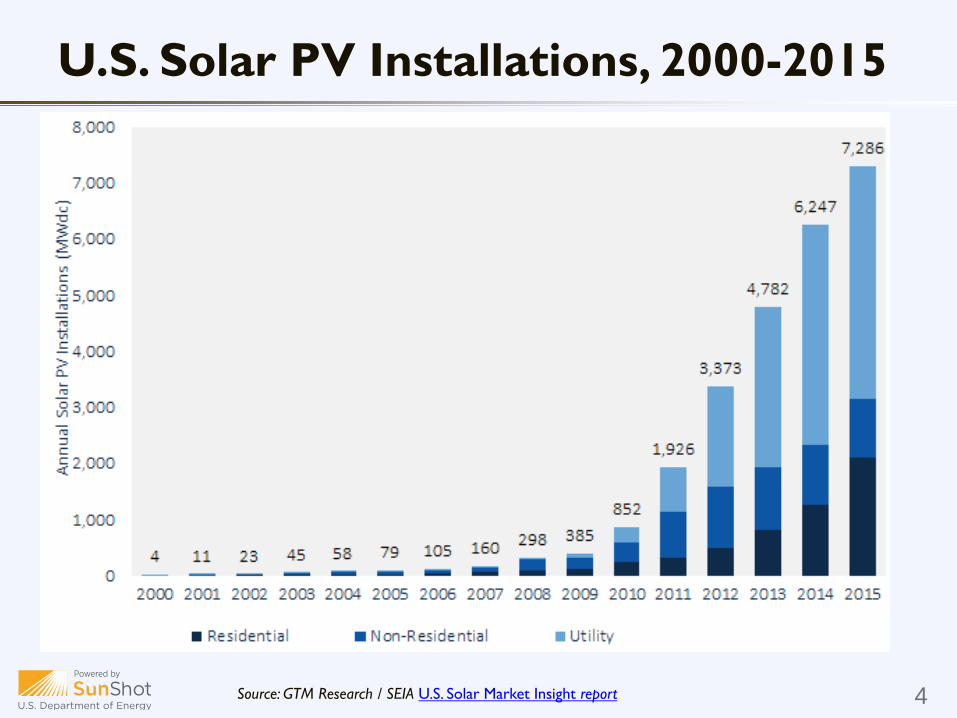
U.S. Solar PV Installations, 2000-2015
4Source: GTM Research / SEIA U.S. Solar Market Insight report
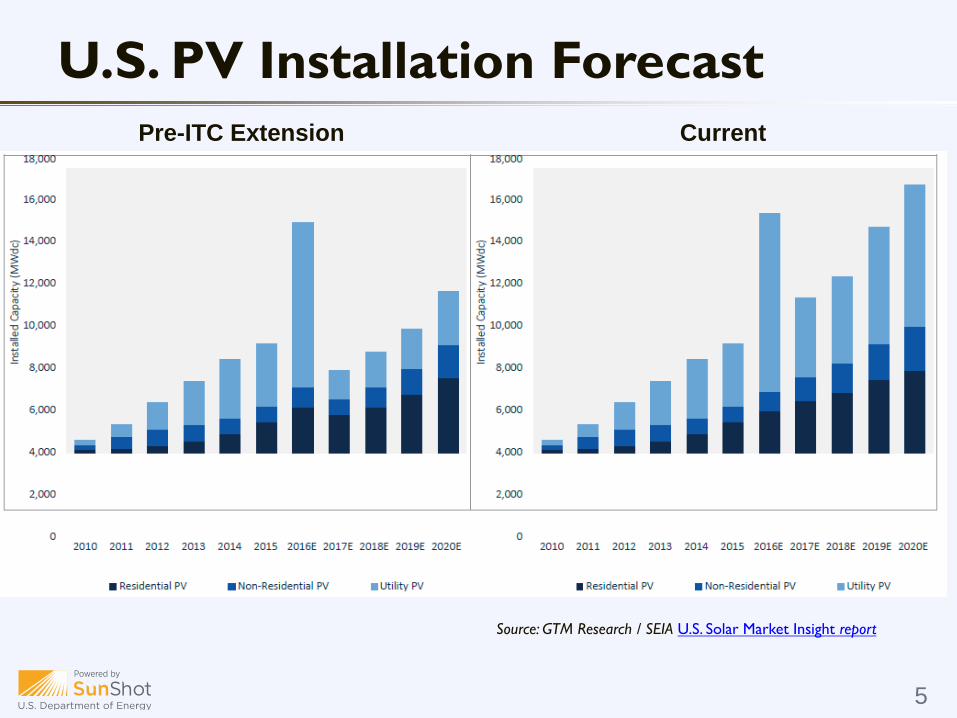
U.S. PV Installation Forecast
5
Pre-ITC Extension Current
Source: GTM Research / SEIA U.S. Solar Market Insight report
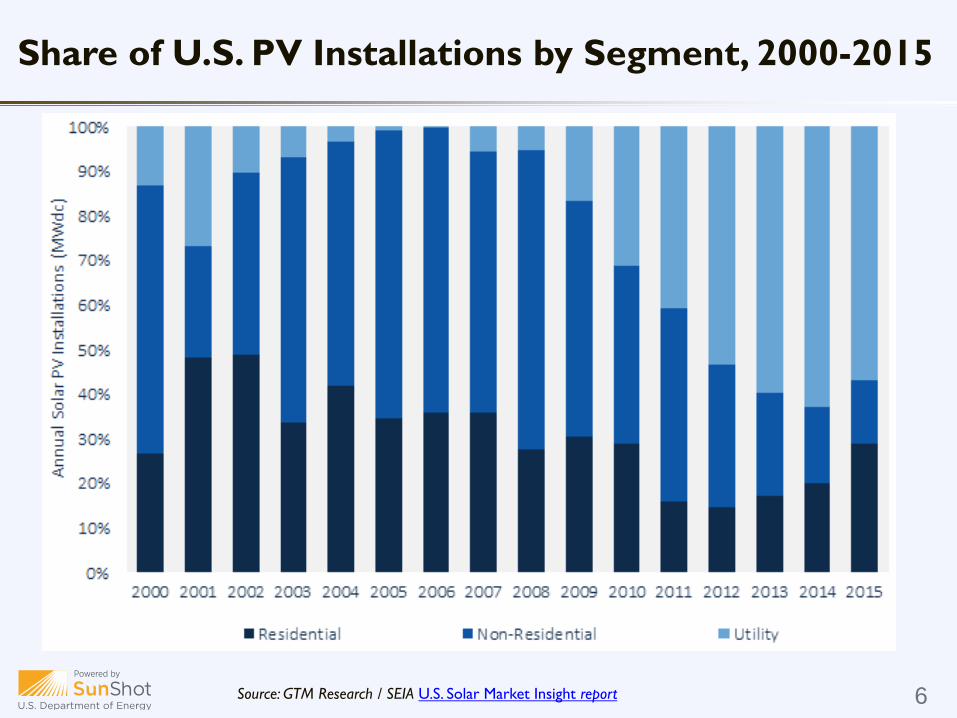
Share of U.S. PV Installations by Segment, 2000-2015
6Source: GTM Research / SEIA U.S. Solar Market Insight report
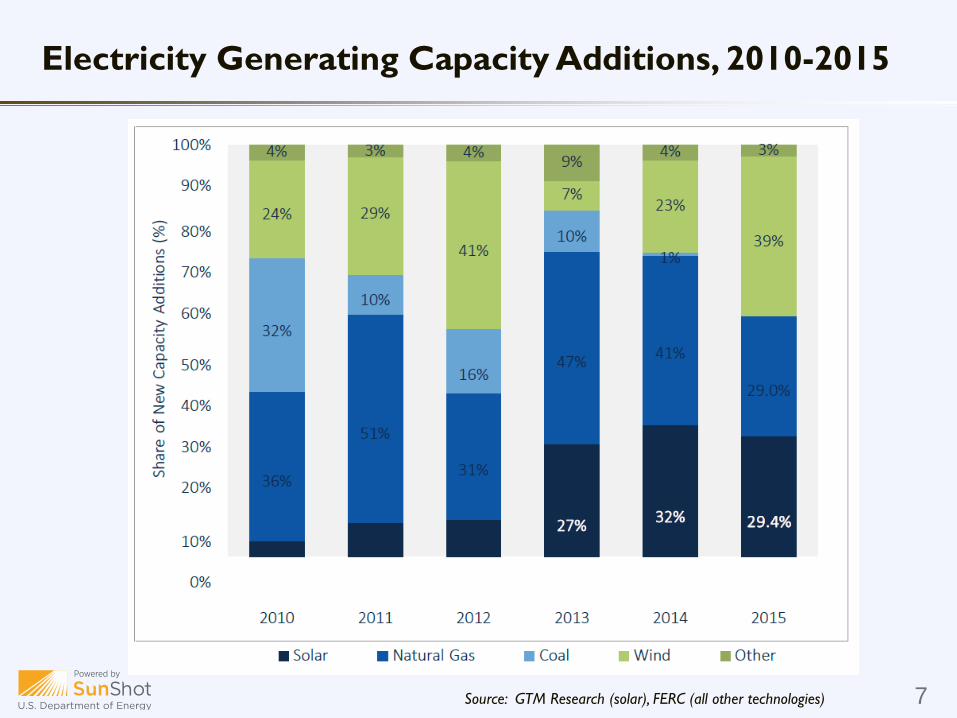
Electricity Generating Capacity Additions, 2010-2015
Source: GTM Research (solar), FERC (all other technologies) 7
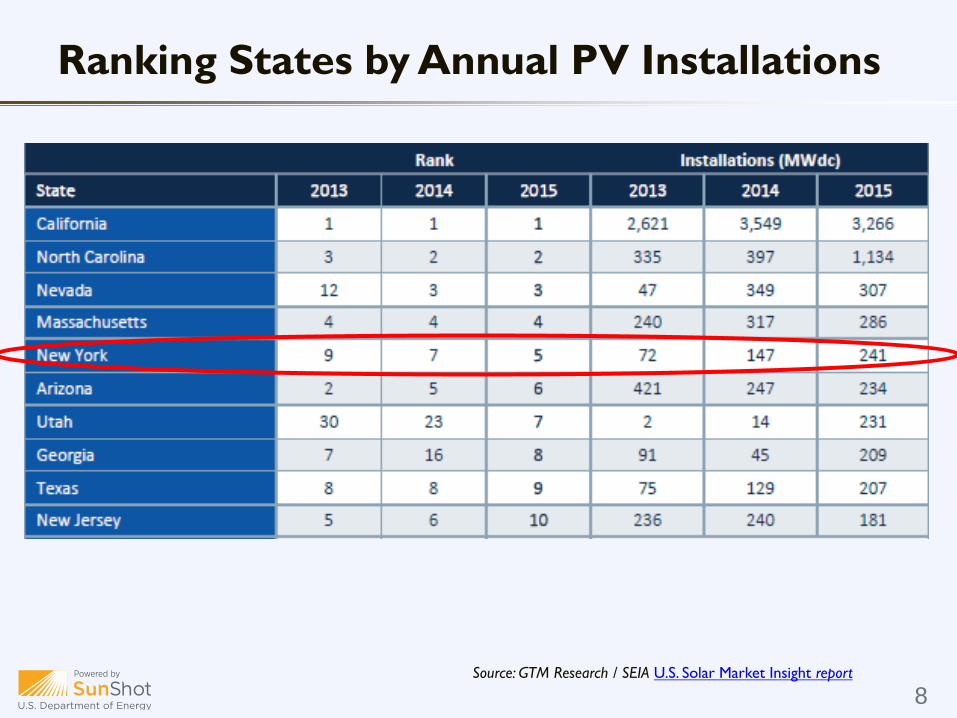
Ranking States by Annual PV Installations
Source: GTM Research / SEIA U.S. Solar Market Insight report
8
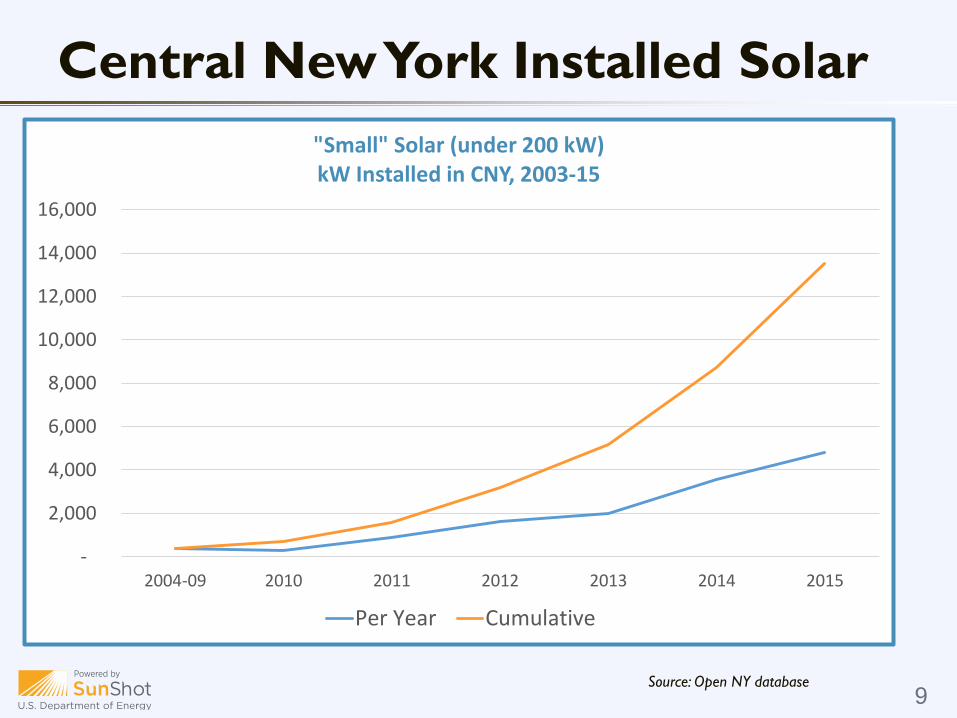
Central New York Installed Solar
Source: Open NY database9
-
2,000
4,000
6,000
8,000
10,000
12,000
14,000
16,000
2004-09 2010 2011 2012 2013 2014 2015
"Small" Solar (under 200 kW)kW Installed in CNY, 2003-15
Per Year Cumulative
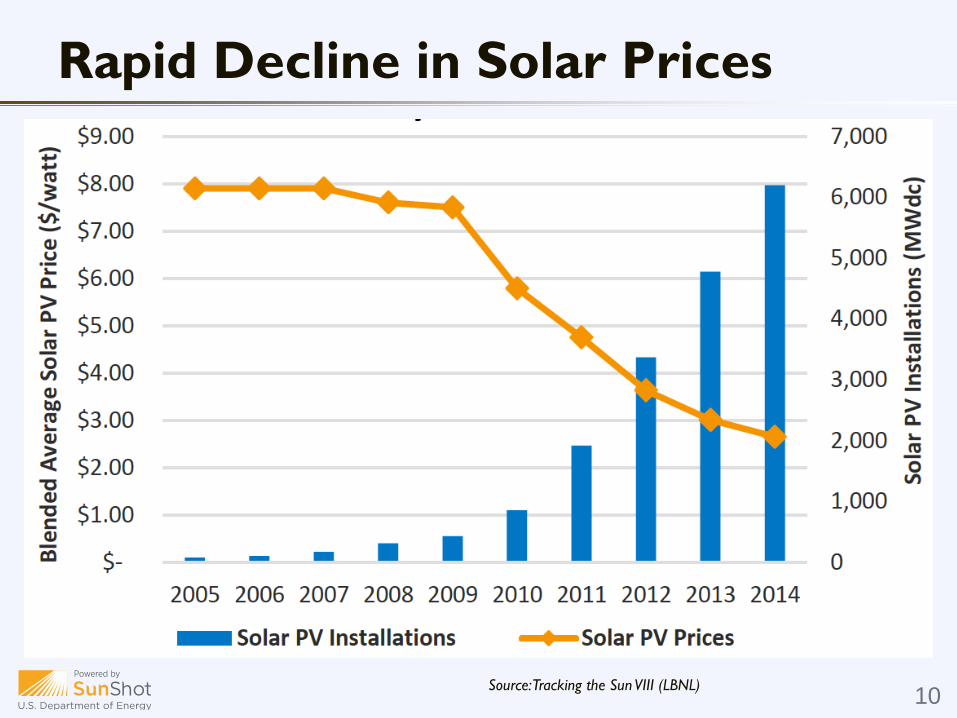
Rapid Decline in Solar Prices
10Source: Tracking the Sun VIII (LBNL)
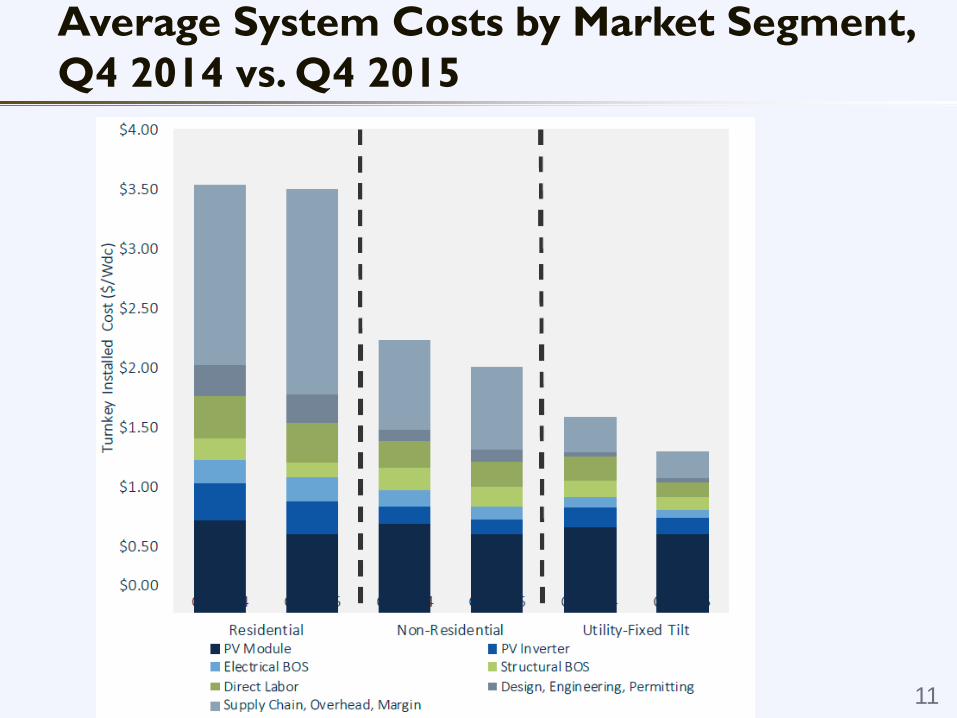
Average System Costs by Market Segment, Q4 2014 vs. Q4 2015
11
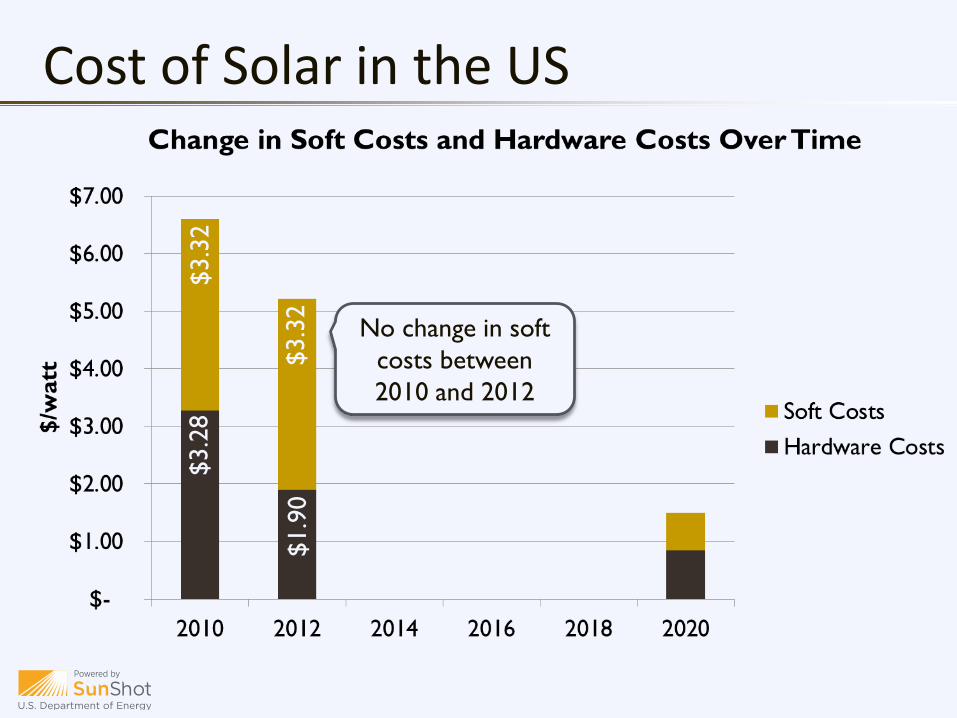
$3.3
2
$3.3
2
$3.2
8
$1.9
0No change in soft
costs between 2010 and 2012
Cost of Solar in the US
13
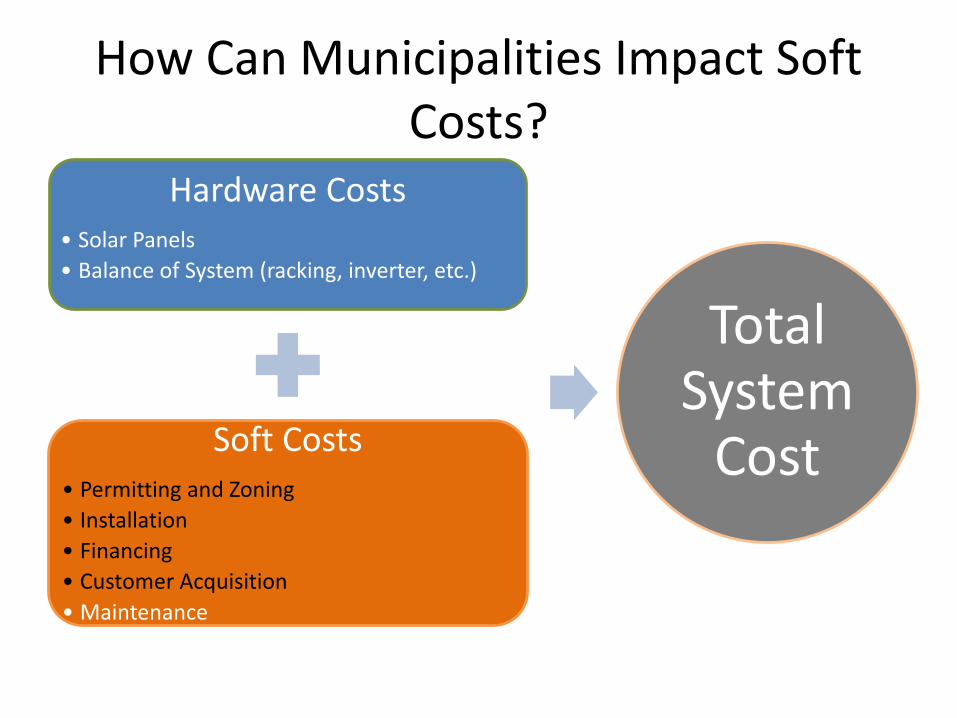
Hardware Costs• Solar Panels• Balance of System (racking, inverter, etc.)
Soft Costs• Permitting and Zoning• Installation• Financing• Customer Acquisition• Maintenance
Total System
Cost
How Can Municipalities Impact Soft Costs?
Why Plan for Solar Now?
More solar applications likely as market improves.
Proactively prepare your permit process for increase of solar permitting applications. • Will reduce municipal staff time and hassle• Will increase your confidence in the permitting process• Solar-friendly policies will encourage solar development and
aid market growth
The CNY RPDB provides free technical assistance, guidance
15
How can municipalities prepare and support?
Best practices are standard, clear, supportive:
Permitting: Transparent, standard, streamlinedZoning: Supportive, standard, appropriate
16
www.SolarizeCNY.org
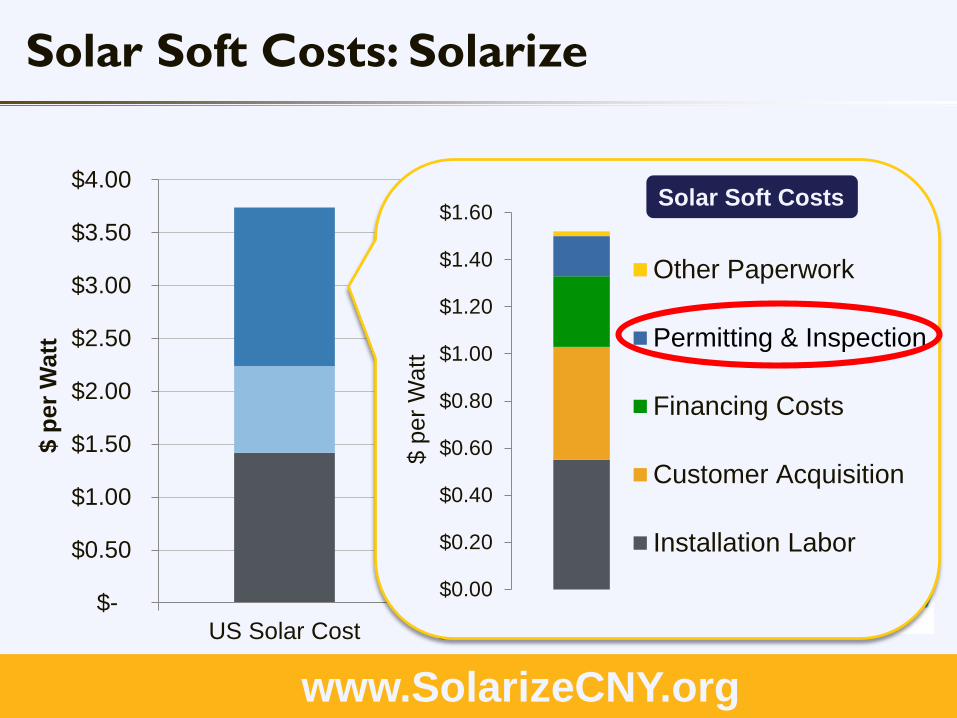
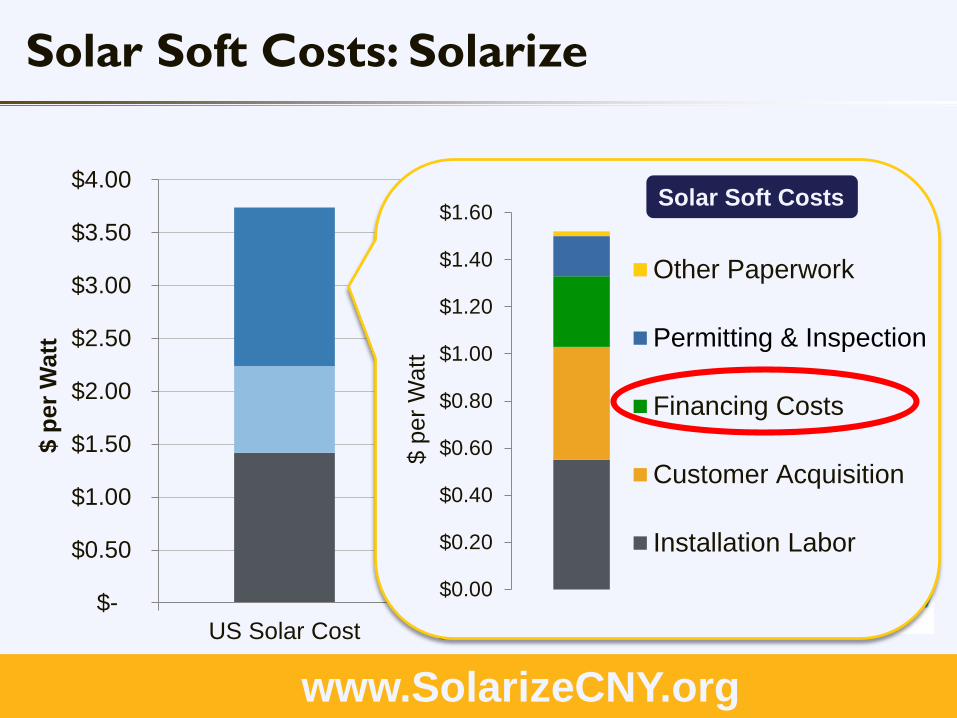
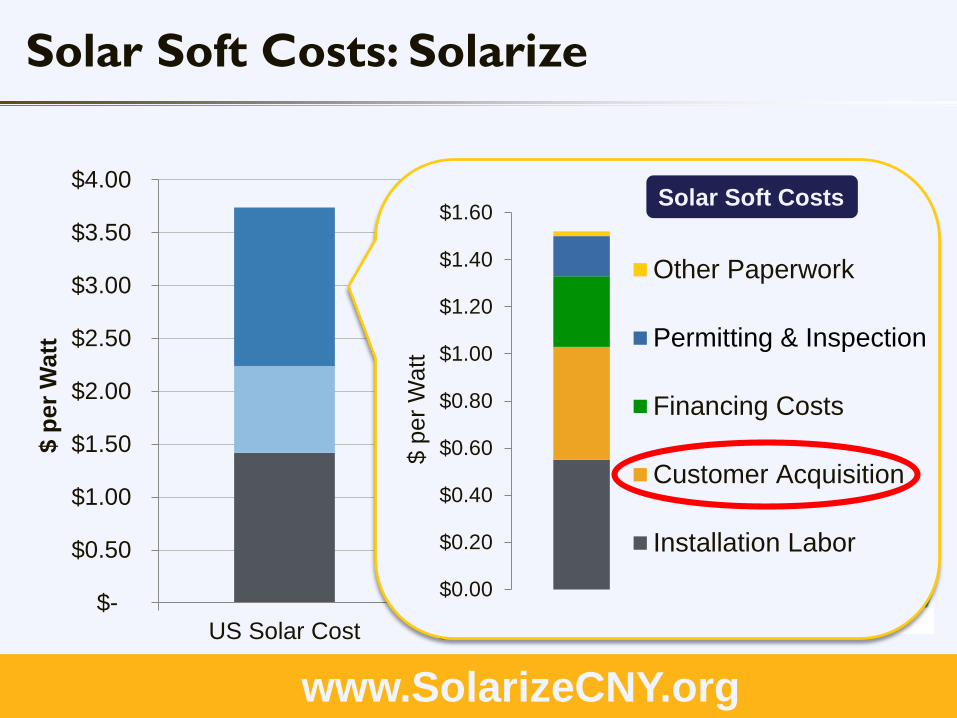
Solar Soft Costs: Solarize
Source: NREL , LBNL $-
$0.50
$1.00
$1.50
$2.00
$2.50
$3.00
$3.50
$4.00
US Solar Cost German Solar Cost
$ pe
r Wat
t Column1Non-Hardware CostHardware Cost
$0.00
$0.20
$0.40
$0.60
$0.80
$1.00
$1.20
$1.40
$1.60
$ pe
r Wat
t
Other Paperwork
Permitting & Inspection
Financing Costs
Customer Acquisition
Installation Labor
Solar Soft Costs
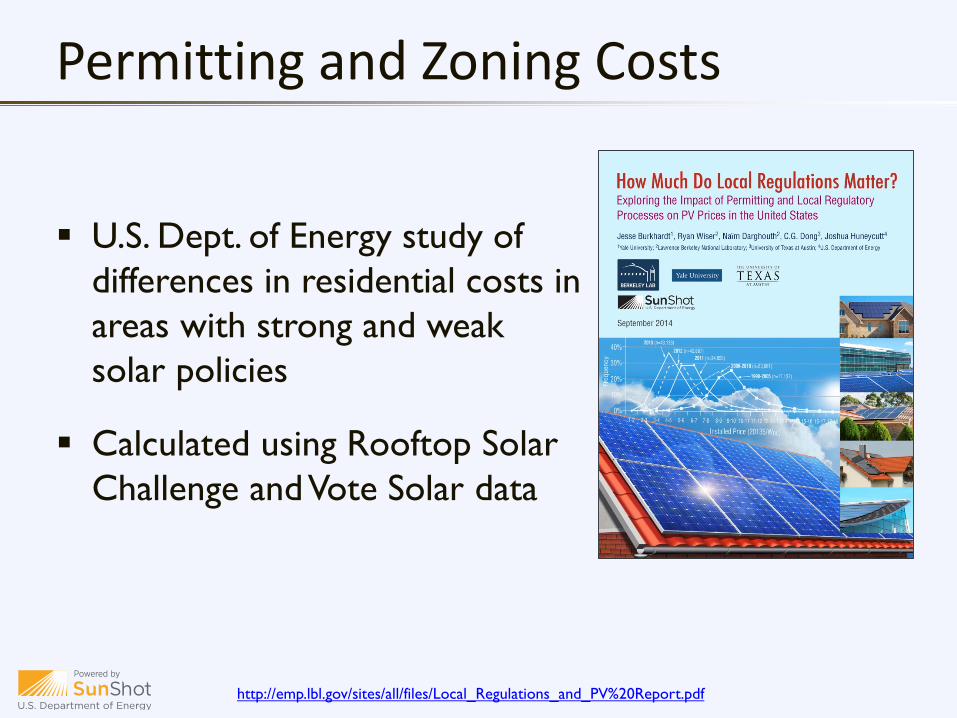
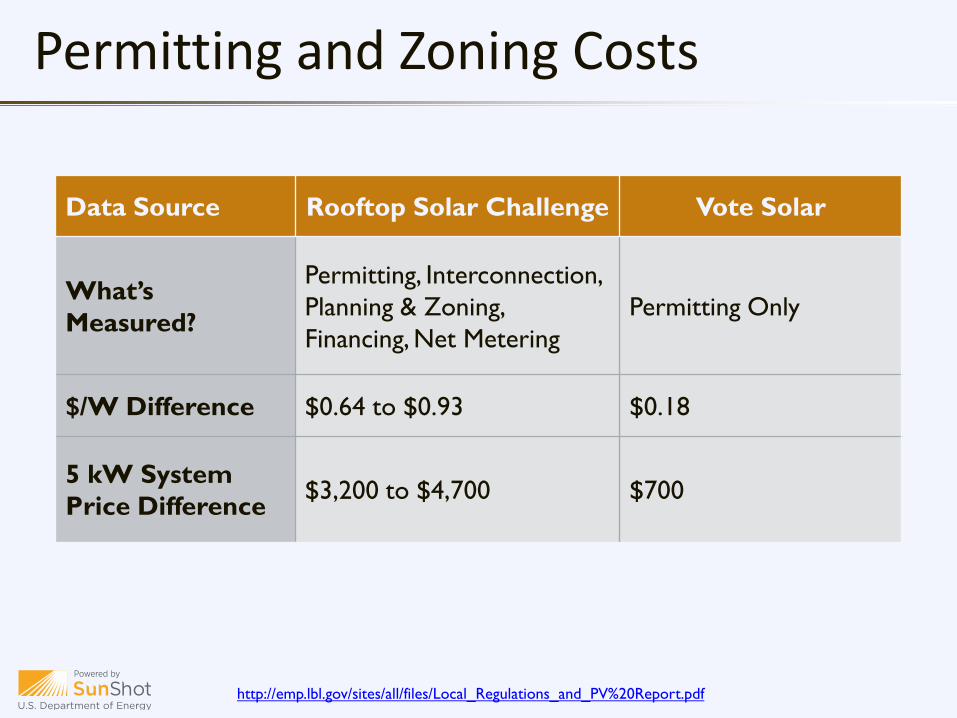
U.S. Dept. of Energy study of differences in residential costs in areas with strong and weak solar policies
Calculated using Rooftop Solar Challenge and Vote Solar data
http://emp.lbl.gov/sites/all/files/Local_Regulations_and_PV%20Report.pdf
Permitting and Zoning Costs
http://emp.lbl.gov/sites/all/files/Local_Regulations_and_PV%20Report.pdf
Data Source Rooftop Solar Challenge Vote Solar
What’s Measured?
Permitting, Interconnection, Planning & Zoning,Financing, Net Metering
Permitting Only
$/W Difference $0.64 to $0.93 $0.18
5 kW System Price Difference $3,200 to $4,700 $700
Permitting and Zoning Costs
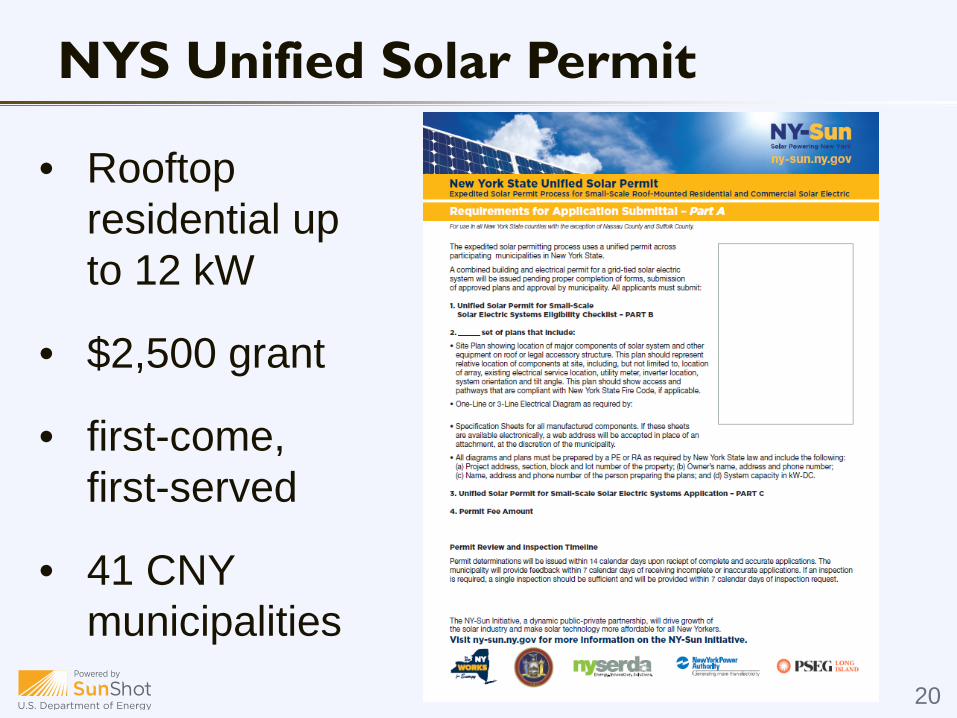
NYS Unified Solar Permit
20
• Rooftop residential up to 12 kW
• $2,500 grant
• first-come, first-served
• 41 CNY municipalities
Supportive, Standard, Appropriate
Zoning Best Practices
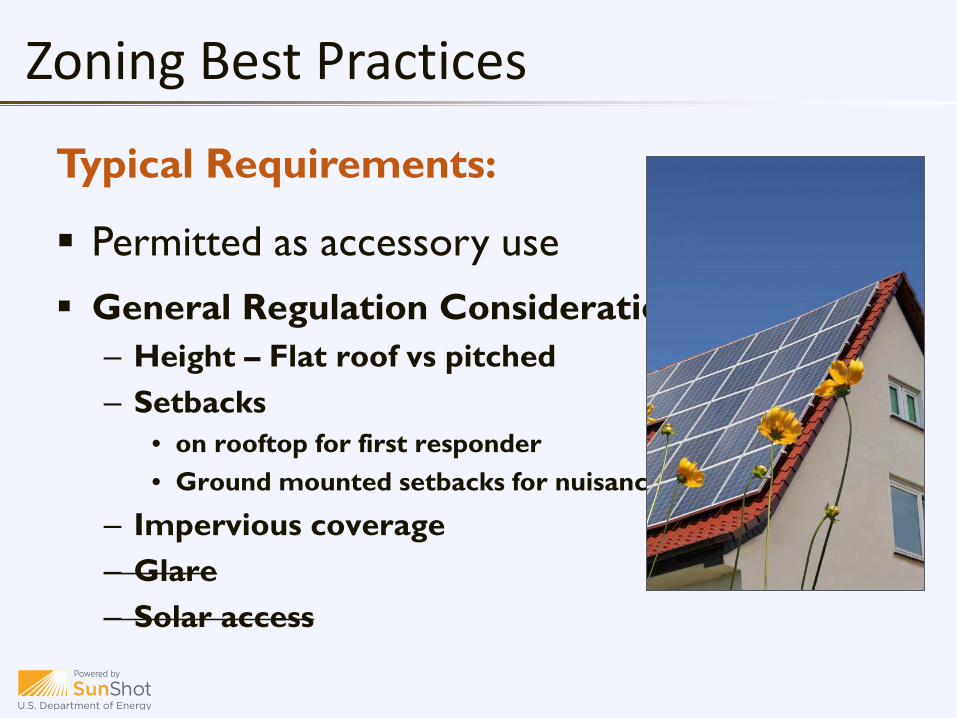
Typical Requirements:
Permitted as accessory use General Regulation Considerations
– Height – Flat roof vs pitched– Setbacks
• on rooftop for first responder • Ground mounted setbacks for nuisance
– Impervious coverage– Glare– Solar access
Zoning Best Practices
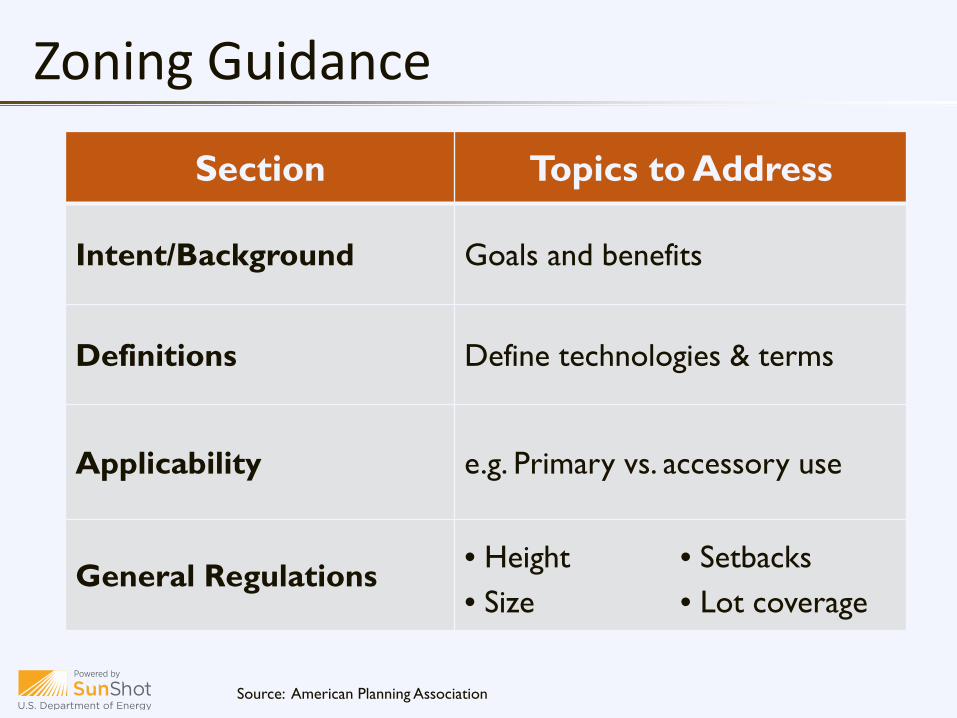
Source: American Planning Association
Section Topics to Address
Intent/Background Goals and benefits
Definitions Define technologies & terms
Applicability e.g. Primary vs. accessory use
General Regulations • Height• Size
• Setbacks• Lot coverage
Zoning Guidance
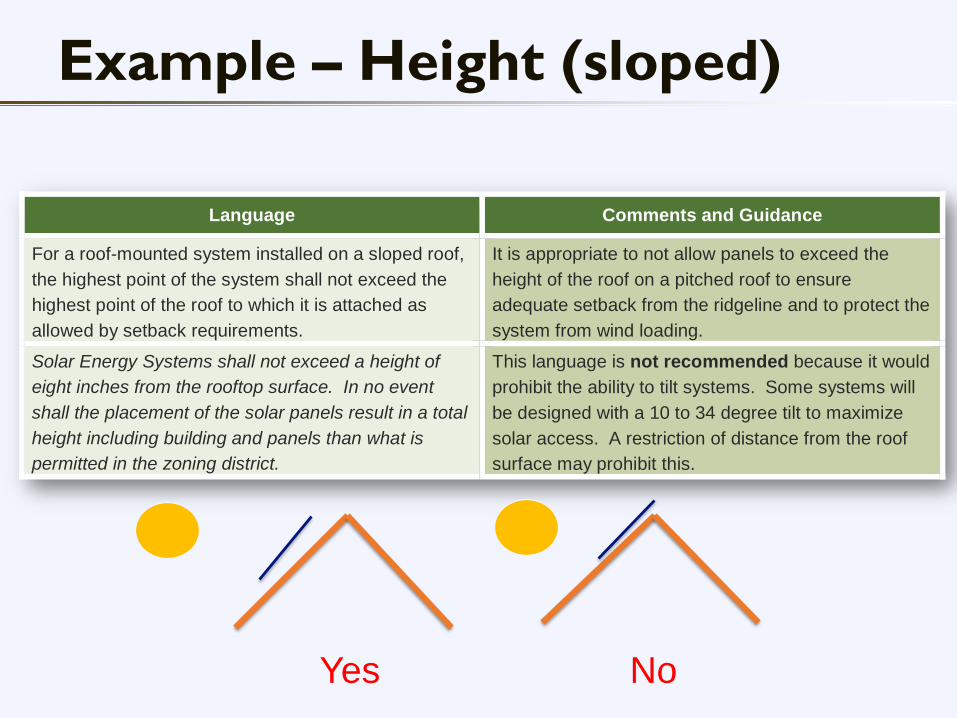
Language Comments and Guidance
For a roof-mounted system installed on a sloped roof, the highest point of the system shall not exceed the highest point of the roof to which it is attached as allowed by setback requirements.
It is appropriate to not allow panels to exceed the height of the roof on a pitched roof to ensure adequate setback from the ridgeline and to protect the system from wind loading.
Solar Energy Systems shall not exceed a height of eight inches from the rooftop surface. In no event shall the placement of the solar panels result in a total height including building and panels than what is permitted in the zoning district.
This language is not recommended because it would prohibit the ability to tilt systems. Some systems will be designed with a 10 to 34 degree tilt to maximize solar access. A restriction of distance from the roof surface may prohibit this.
Yes No
Example – Height (sloped)
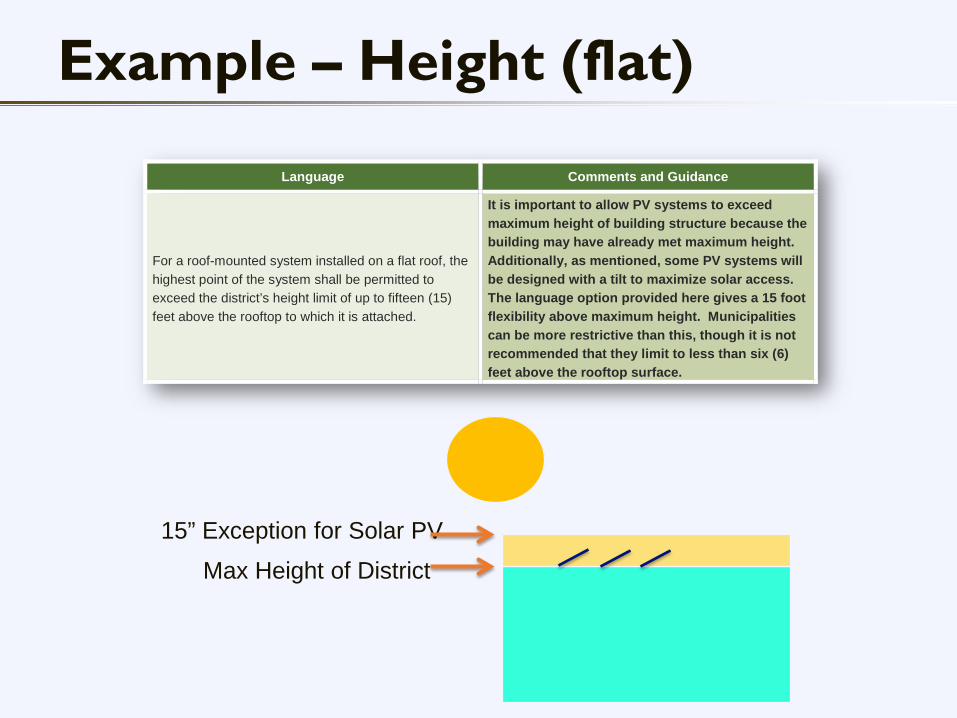
Language Comments and Guidance
For a roof-mounted system installed on a flat roof, the highest point of the system shall be permitted to exceed the district’s height limit of up to fifteen (15) feet above the rooftop to which it is attached.
It is important to allow PV systems to exceed maximum height of building structure because the building may have already met maximum height. Additionally, as mentioned, some PV systems will be designed with a tilt to maximize solar access. The language option provided here gives a 15 foot flexibility above maximum height. Municipalities can be more restrictive than this, though it is not recommended that they limit to less than six (6) feet above the rooftop surface.
Max Height of District15” Exception for Solar PV
Example – Height (flat)
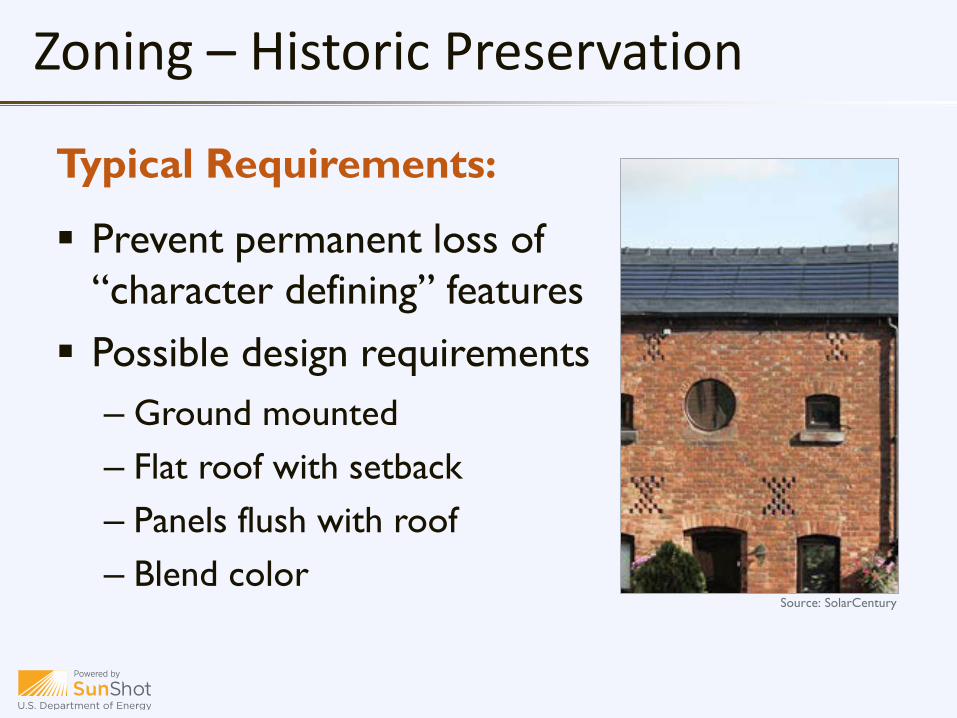
Typical Requirements:
Prevent permanent loss of “character defining” features Possible design requirements
– Ground mounted– Flat roof with setback– Panels flush with roof– Blend color
Source: SolarCentury
Zoning – Historic Preservation
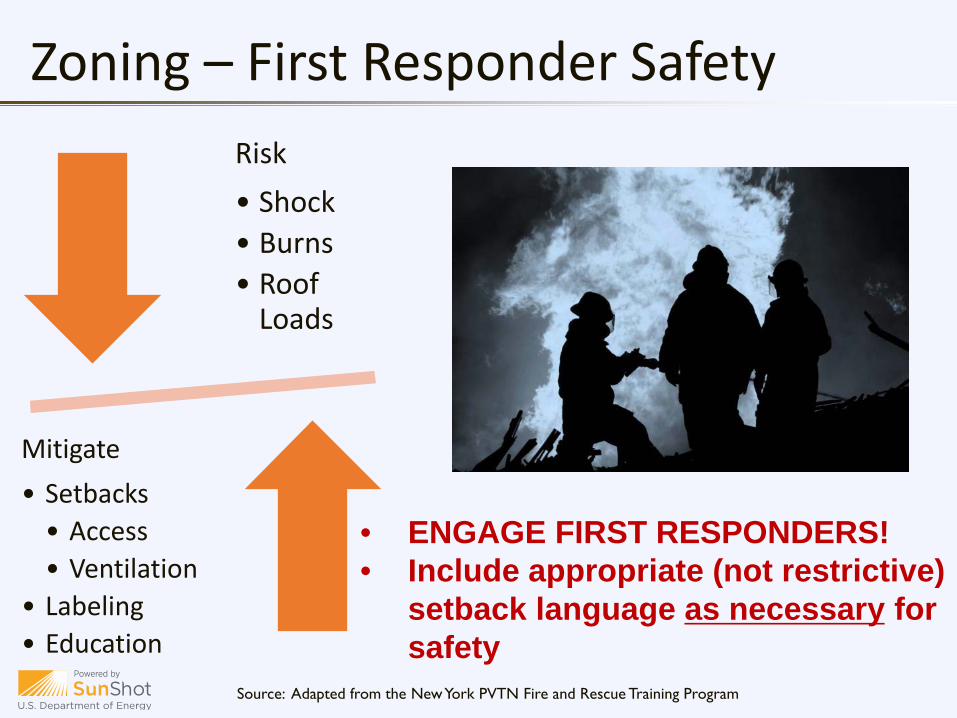
Risk• Shock• Burns• Roof
Loads
Mitigate• Setbacks• Access• Ventilation
• Labeling• Education
Source: Adapted from the New York PVTN Fire and Rescue Training Program
• ENGAGE FIRST RESPONDERS!• Include appropriate (not restrictive)
setback language as necessary for safety
Zoning – First Responder Safety
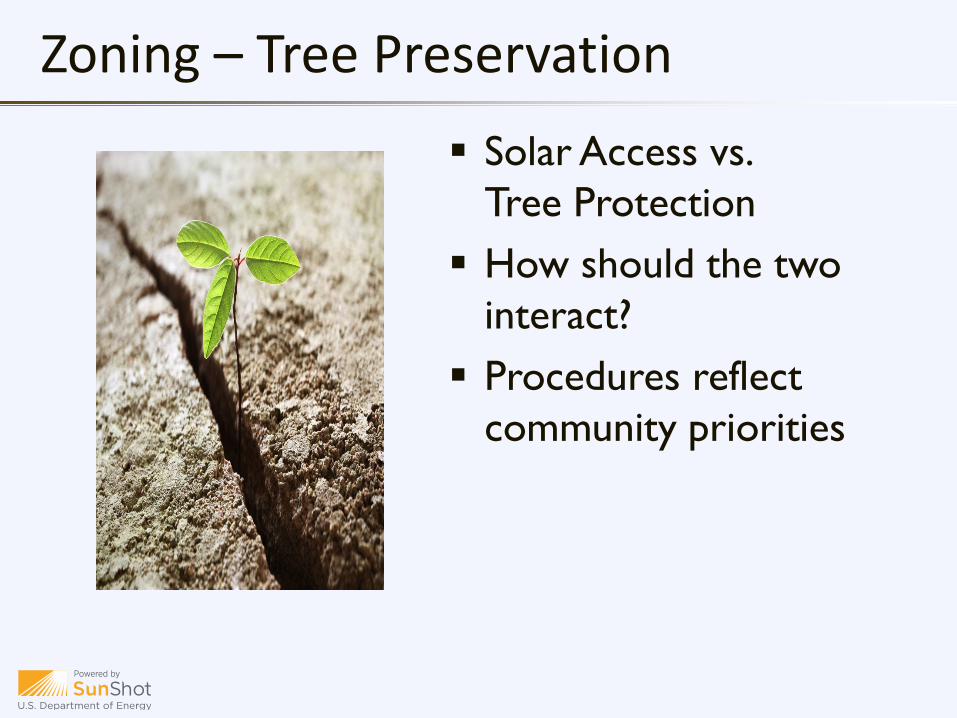
Solar Access vs. Tree Protection How should the two
interact? Procedures reflect
community priorities
Zoning – Tree Preservation
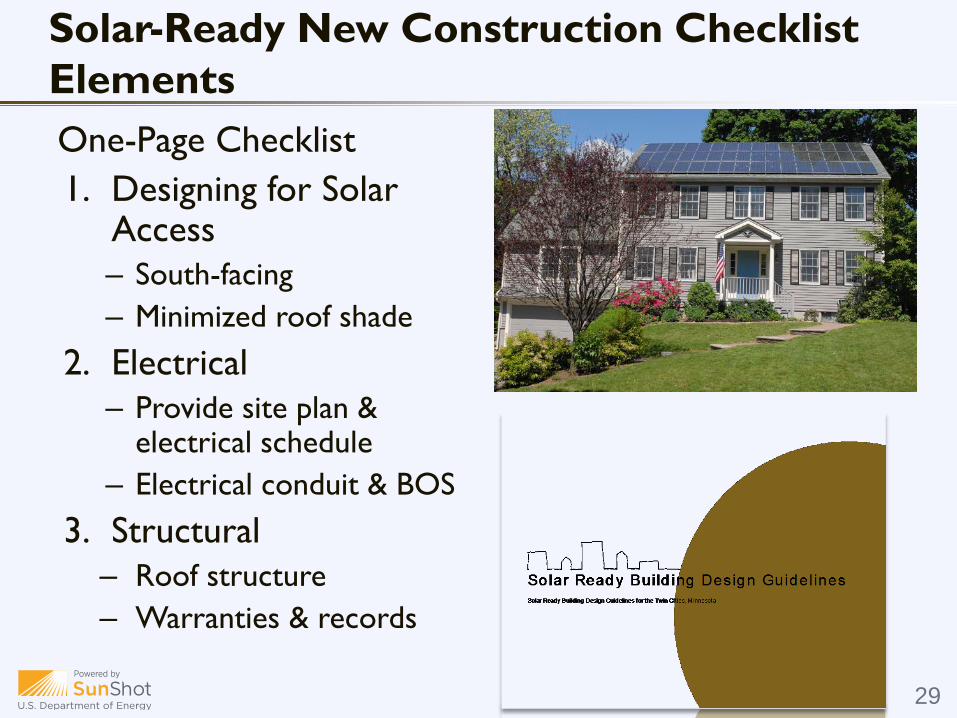
One-Page Checklist 1. Designing for Solar
Access– South-facing– Minimized roof shade
2. Electrical– Provide site plan &
electrical schedule– Electrical conduit & BOS
3. Structural– Roof structure– Warranties & records
Solar-Ready New Construction Checklist Elements
29
www.SolarizeCNY.org
Solar Soft Costs: Solarize
Source: NREL , LBNL $-
$0.50
$1.00
$1.50
$2.00
$2.50
$3.00
$3.50
$4.00
US Solar Cost German Solar Cost
$ pe
r Wat
t Column1Non-Hardware CostHardware Cost
$0.00
$0.20
$0.40
$0.60
$0.80
$1.00
$1.20
$1.40
$1.60
$ pe
r Wat
t
Other Paperwork
Permitting & Inspection
Financing Costs
Customer Acquisition
Installation Labor
Solar Soft Costs
Property Assessed Clean EnergyThe local government finances the up-front costsof the energy investment, which is repaidthrough a special property tax assessment.
PACE Finance
Source: Department of Energy
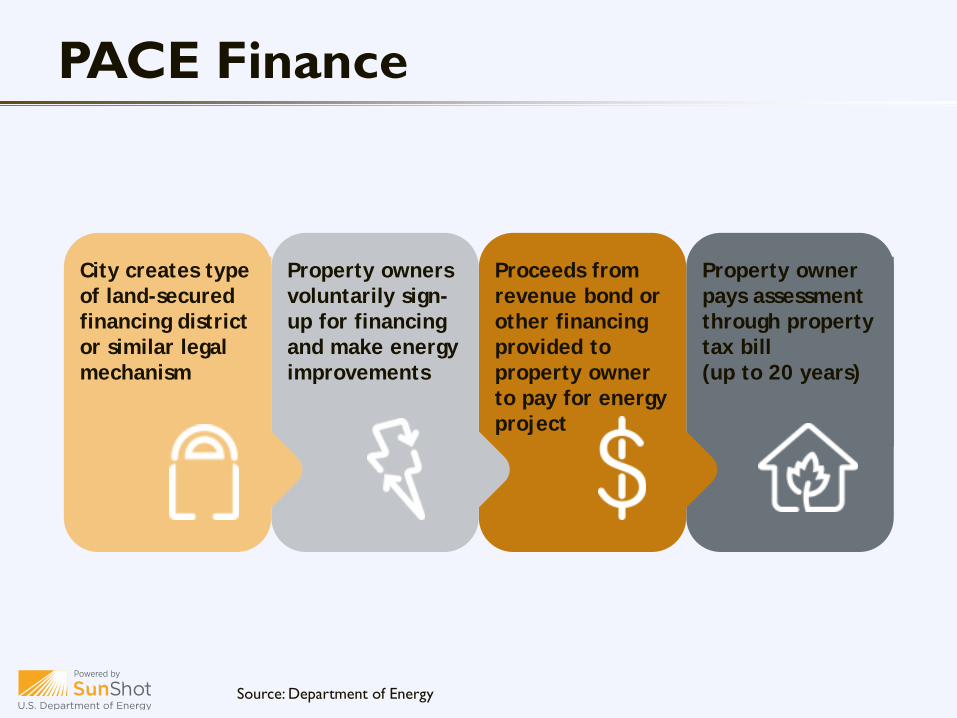
Property ownerpays assessment through propertytax bill (up to 20 years)
Proceeds fromrevenue bond or other financing provided to property ownerto pay for energy project
Property ownersvoluntarily sign-up for financing and make energy improvements
City creates type of land-securedfinancing districtor similar legalmechanism
Source: Department of Energy
PACE Finance
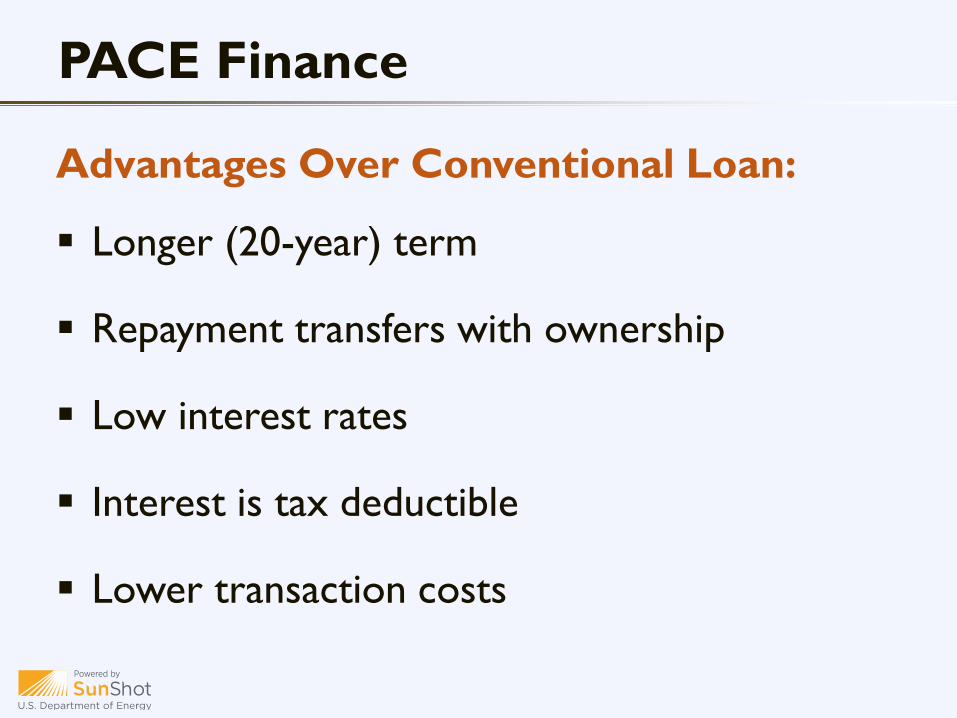
Advantages Over Conventional Loan:
Longer (20-year) term
Repayment transfers with ownership
Low interest rates
Interest is tax deductible
Lower transaction costs
PACE Finance
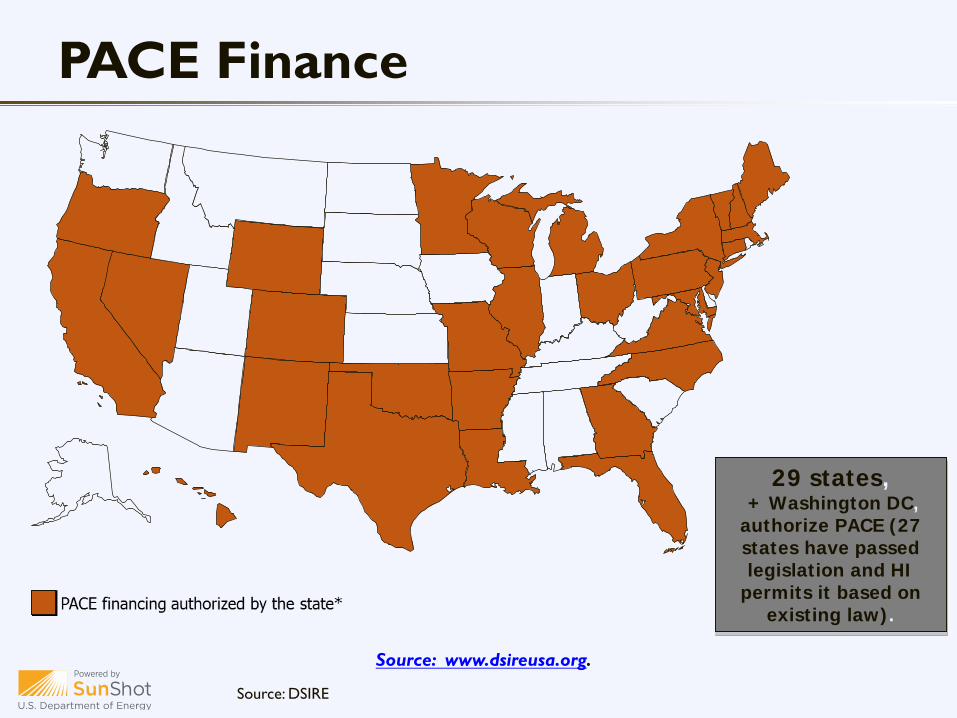
Source: DSIRE
Source: www.dsireusa.org.
29 states,+ Washington DC,
authorize PACE (27 states have passed legislation and HI
permits it based on existing law).
PACE Finance
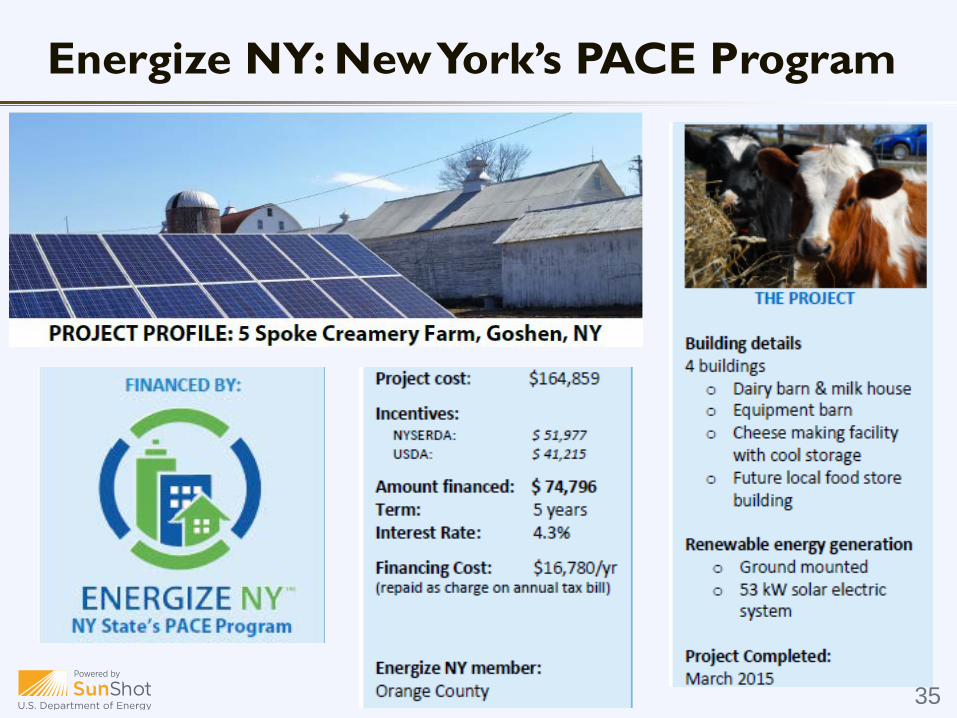
Energize NY: New York’s PACE Program
35
www.SolarizeCNY.org
Solar Soft Costs: Solarize
Source: NREL , LBNL $-
$0.50
$1.00
$1.50
$2.00
$2.50
$3.00
$3.50
$4.00
US Solar Cost German Solar Cost
$ pe
r Wat
t Column1Non-Hardware CostHardware Cost
$0.00
$0.20
$0.40
$0.60
$0.80
$1.00
$1.20
$1.40
$1.60
$ pe
r Wat
t
Other Paperwork
Permitting & Inspection
Financing Costs
Customer Acquisition
Installation Labor
Solar Soft Costs
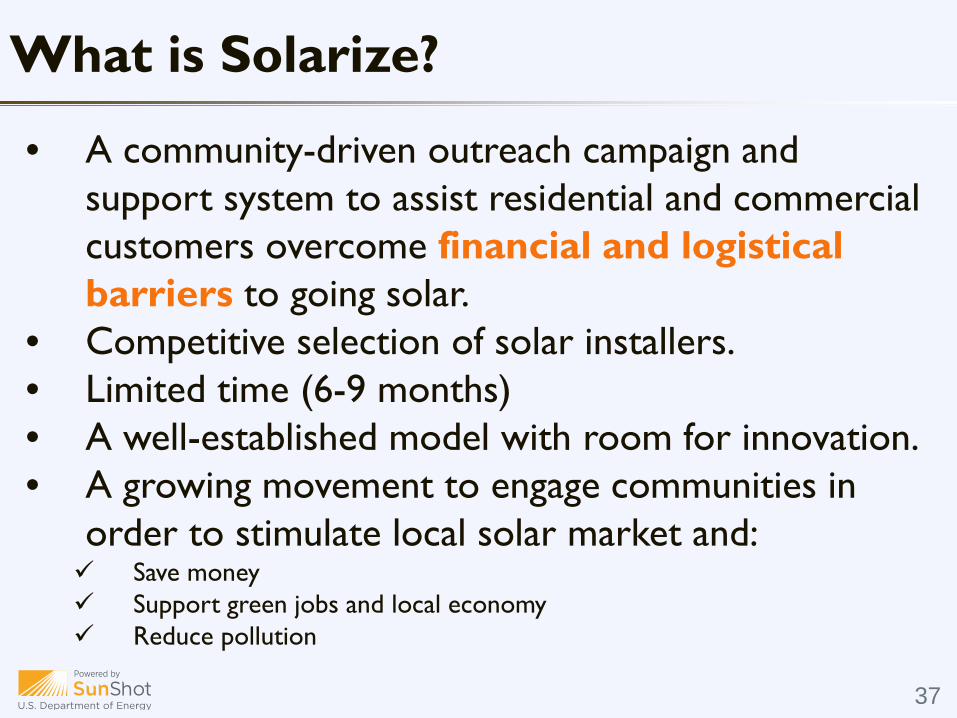
What is Solarize?
• A community-driven outreach campaign and support system to assist residential and commercial customers overcome financial and logistical barriers to going solar.
• Competitive selection of solar installers.• Limited time (6-9 months)• A well-established model with room for innovation.• A growing movement to engage communities in
order to stimulate local solar market and: Save money Support green jobs and local economy Reduce pollution
37
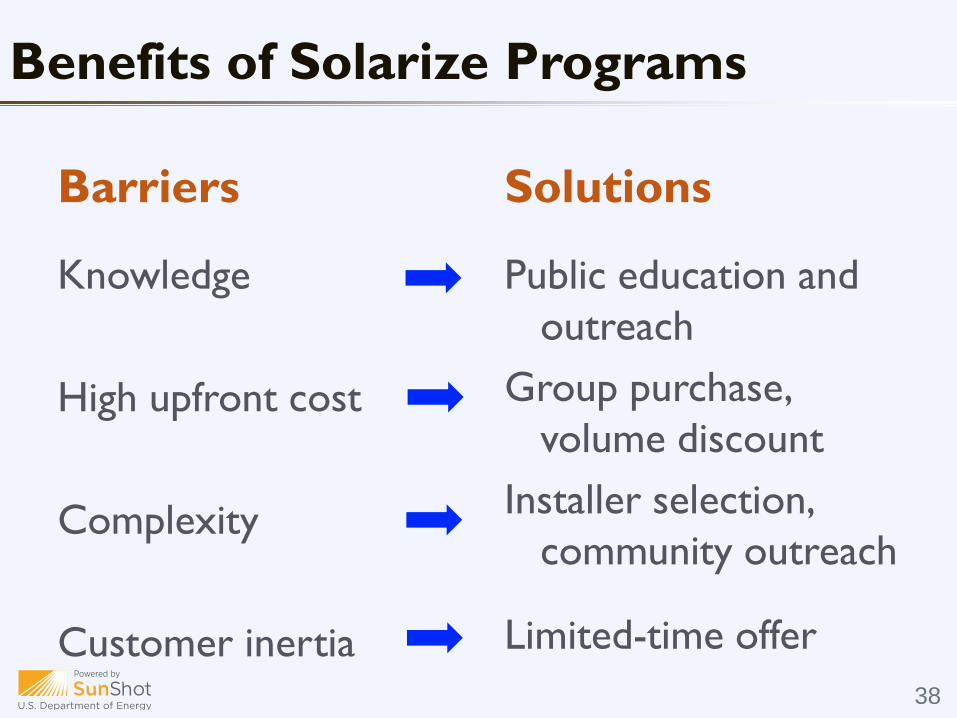
Barriers
Knowledge
High upfront cost
Complexity
Customer inertia
Solutions
Public education and outreach
Group purchase, volume discount
Installer selection, community outreach
Limited-time offer
Benefits of Solarize Programs
38
Solarize Programs
39www1.eere.energy.gov/solar/pdfs/54738.pdf
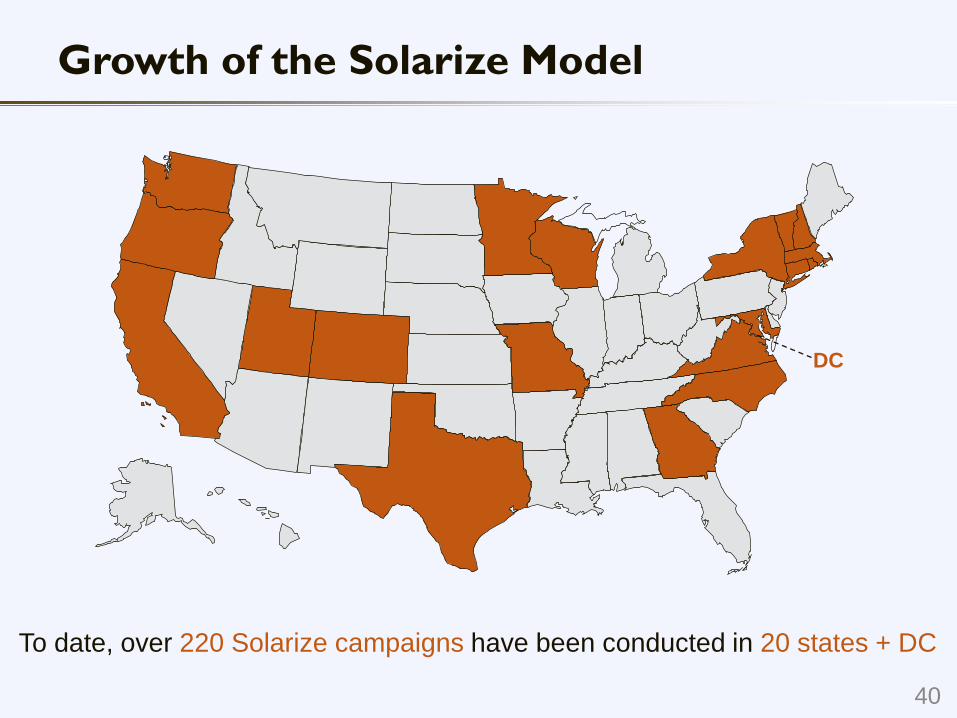
Growth of the Solarize Model
DC
To date, over 220 Solarize campaigns have been conducted in 20 states + DC
40
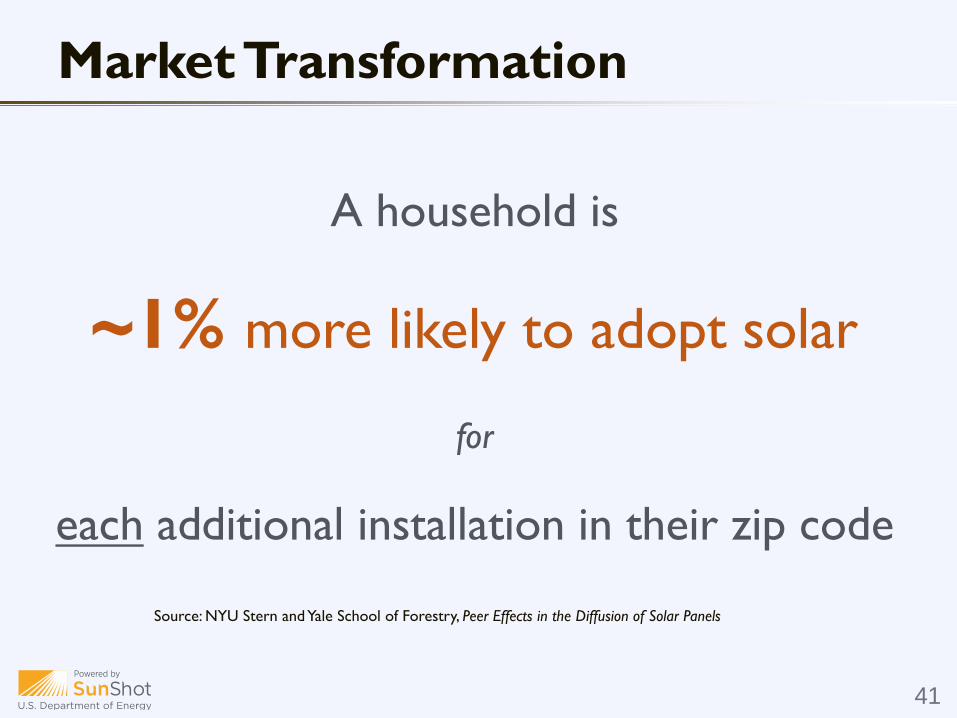
A household is
~1% more likely to adopt solar
for
each additional installation in their zip code
Market Transformation
Source: NYU Stern and Yale School of Forestry, Peer Effects in the Diffusion of Solar Panels
41
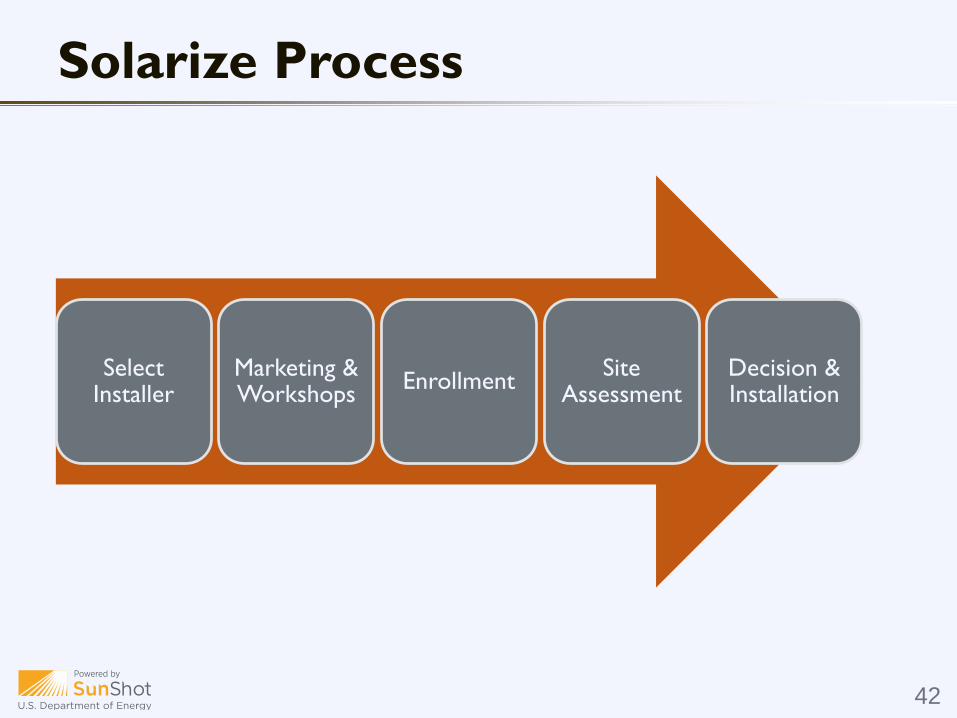
Solarize Process
Select Installer
Marketing & Workshops Enrollment Site
AssessmentDecision & Installation
42
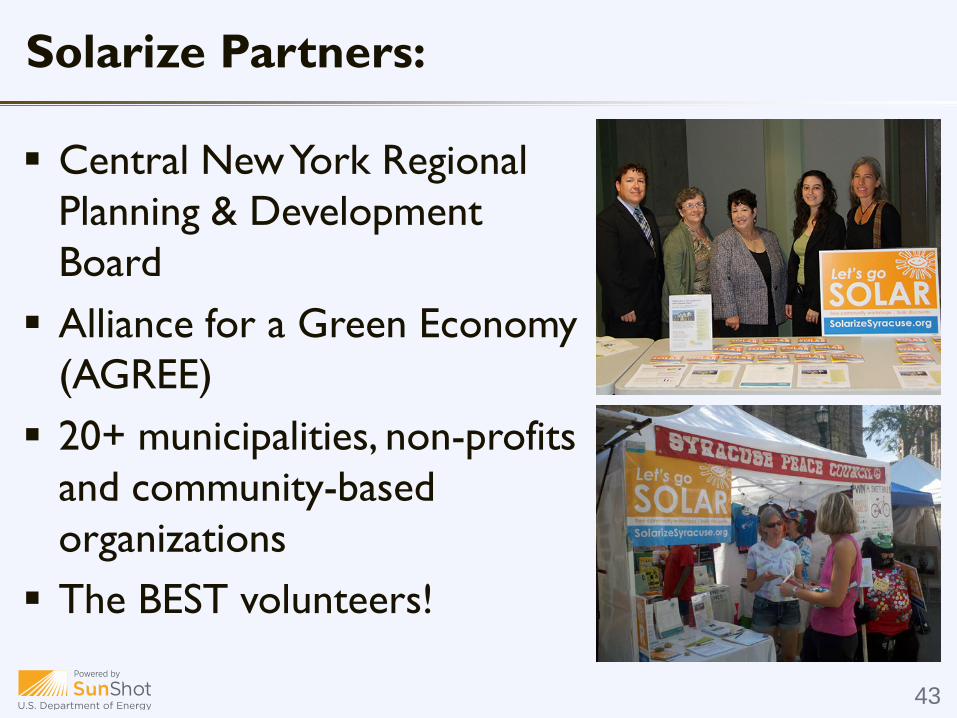
Central New York Regional Planning & Development Board Alliance for a Green Economy
(AGREE) 20+ municipalities, non-profits
and community-based organizations The BEST volunteers!
Solarize Partners:
43
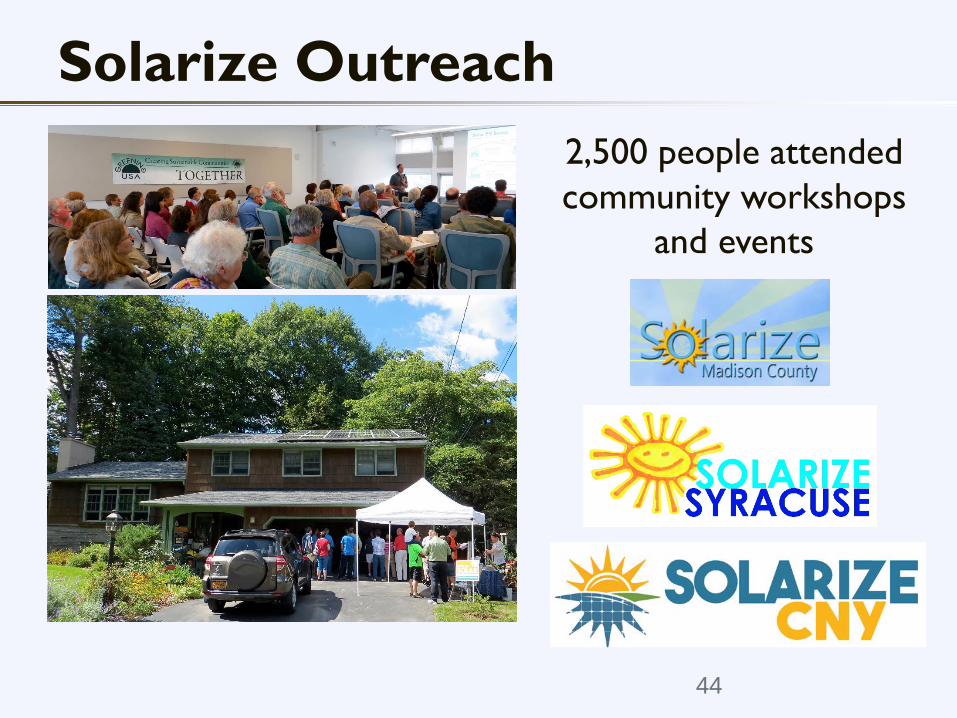
Solarize Outreach2,500 people attended community workshops
and events
44
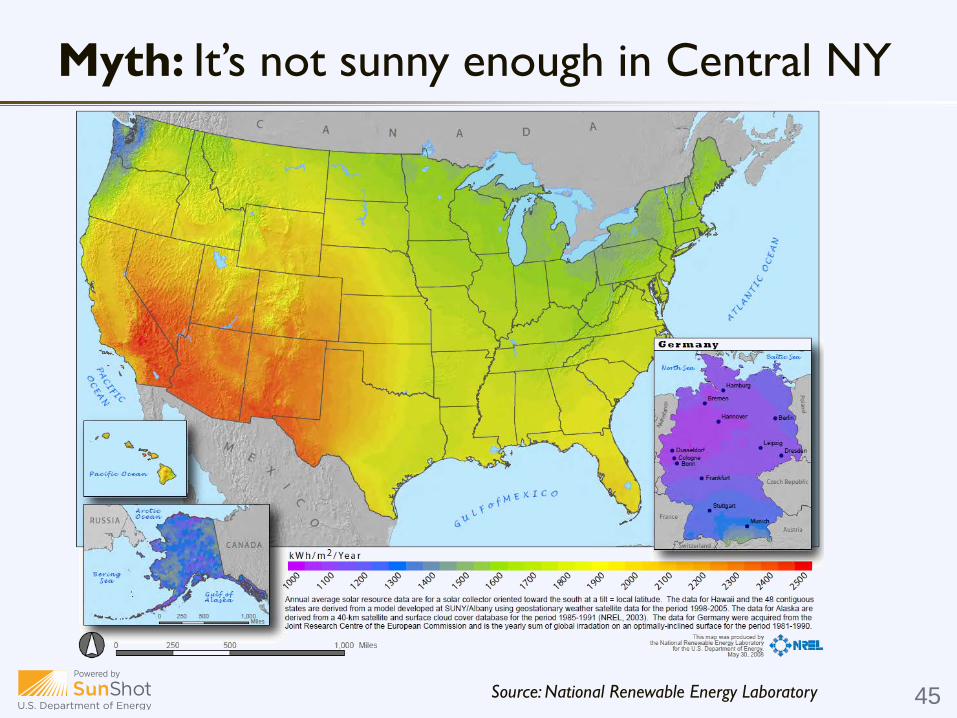
Myth: It’s not sunny enough in Central NY
Source: National Renewable Energy Laboratory 45
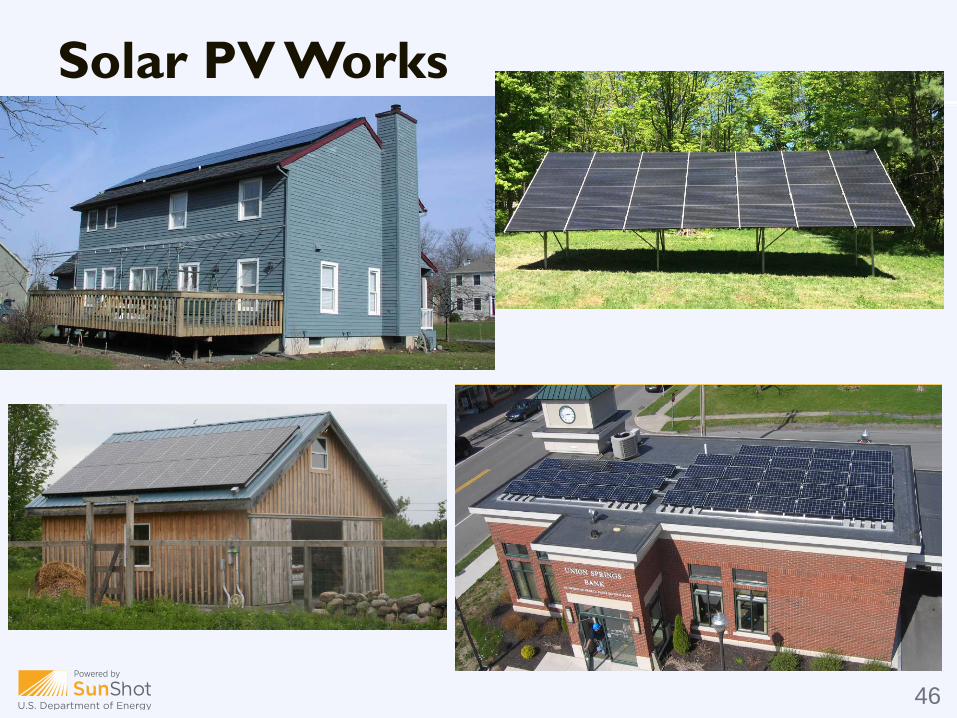
Solar PV Works
46
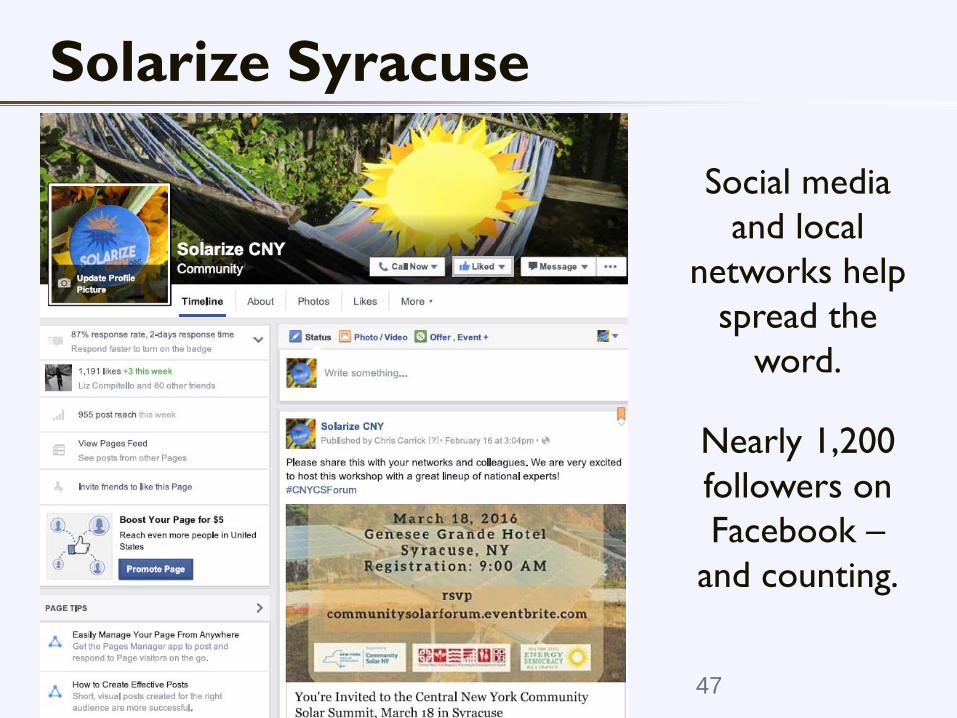
Solarize Syracuse
Social media and local
networks help spread the
word.
Nearly 1,200 followers on Facebook –
and counting.
47
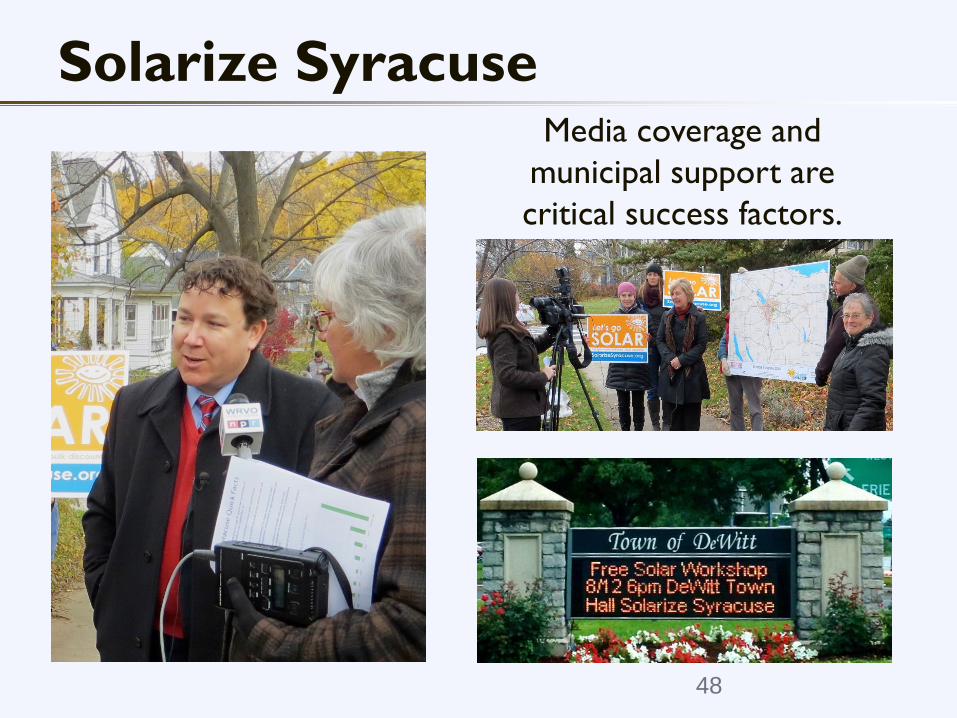
Solarize SyracuseMedia coverage and
municipal support are critical success factors.
48
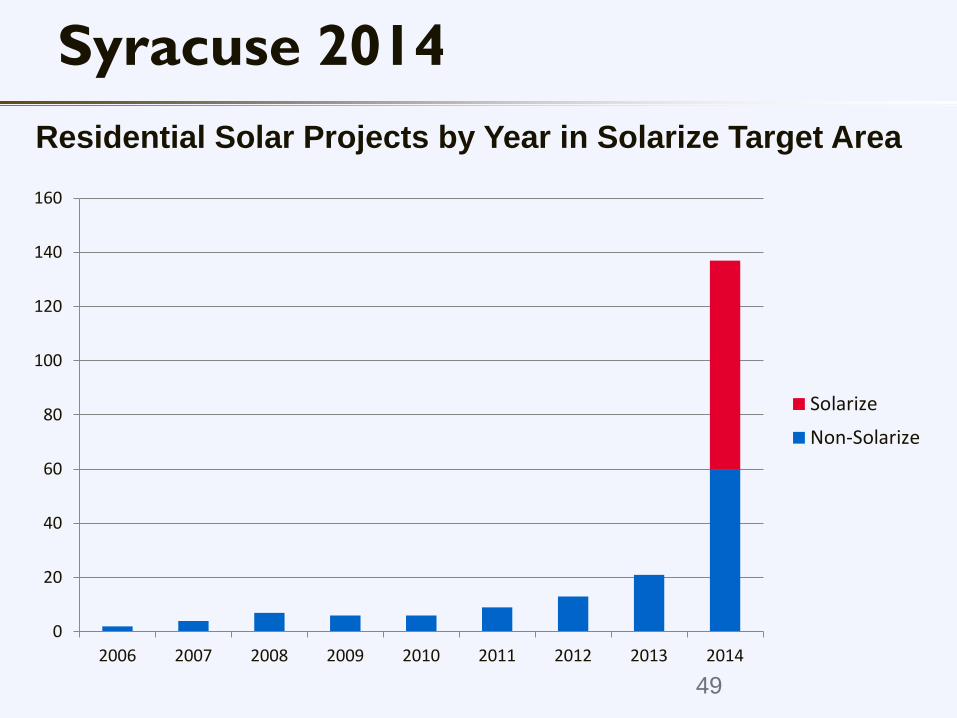
Syracuse 2014Residential Solar Projects by Year in Solarize Target Area
0
20
40
60
80
100
120
140
160
2006 2007 2008 2009 2010 2011 2012 2013 2014
Solarize
Non-Solarize
49
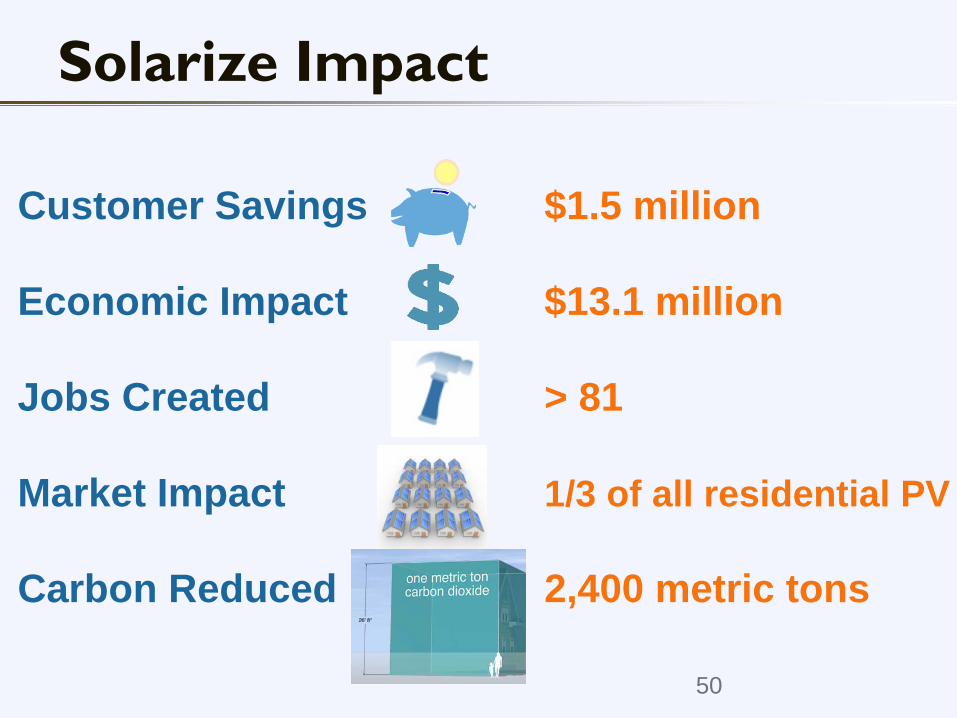
Solarize Impact
50
Customer Savings $1.5 million
Economic Impact $13.1 million
Jobs Created > 81
Market Impact 1/3 of all residential PV
Carbon Reduced 2,400 metric tons
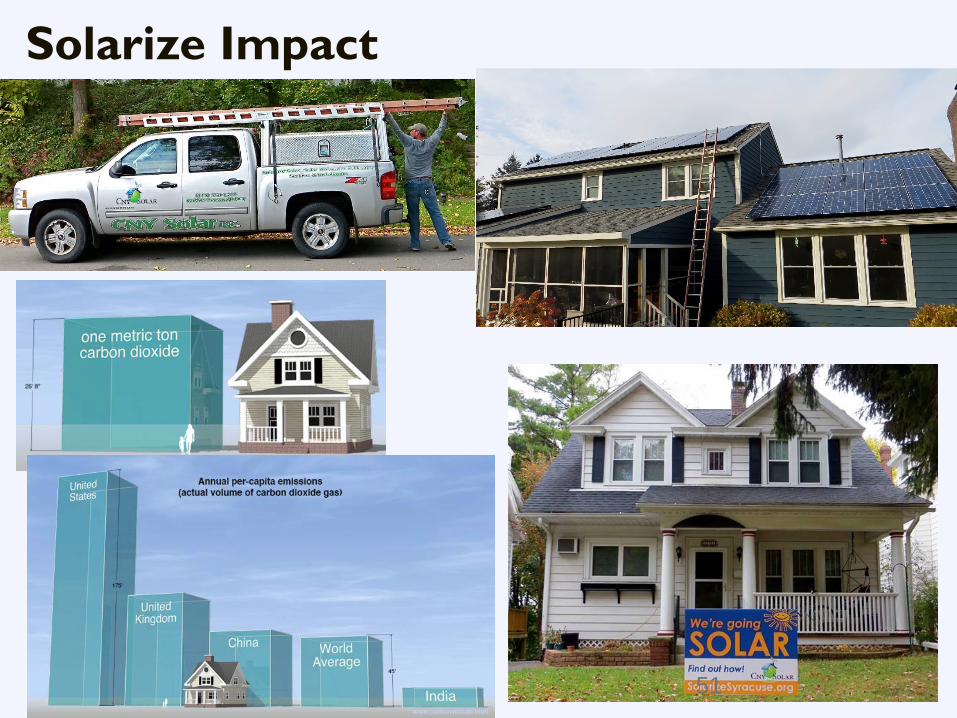
Solarize Impact
51
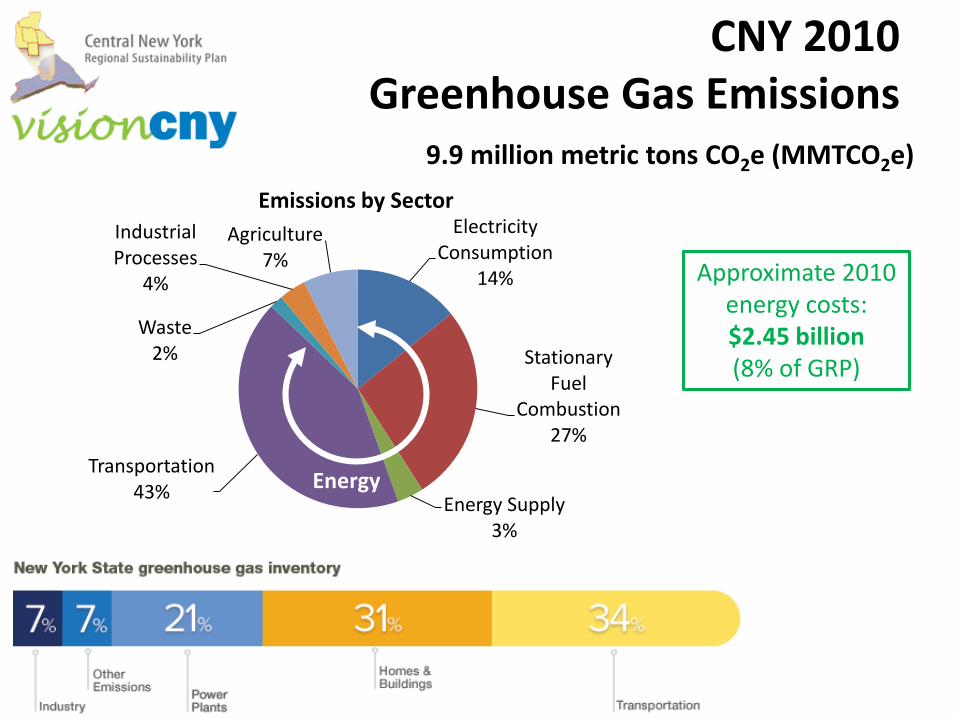
CNY 2010 Greenhouse Gas Emissions
9.9 million metric tons CO2e (MMTCO2e)
Electricity Consumption
14%
Stationary Fuel
Combustion27%
Energy Supply3%
Transportation43%
Waste2%
Industrial Processes
4%
Agriculture7%
Emissions by Sector
Energy
Approximate 2010 energy costs: $2.45 billion(8% of GRP)
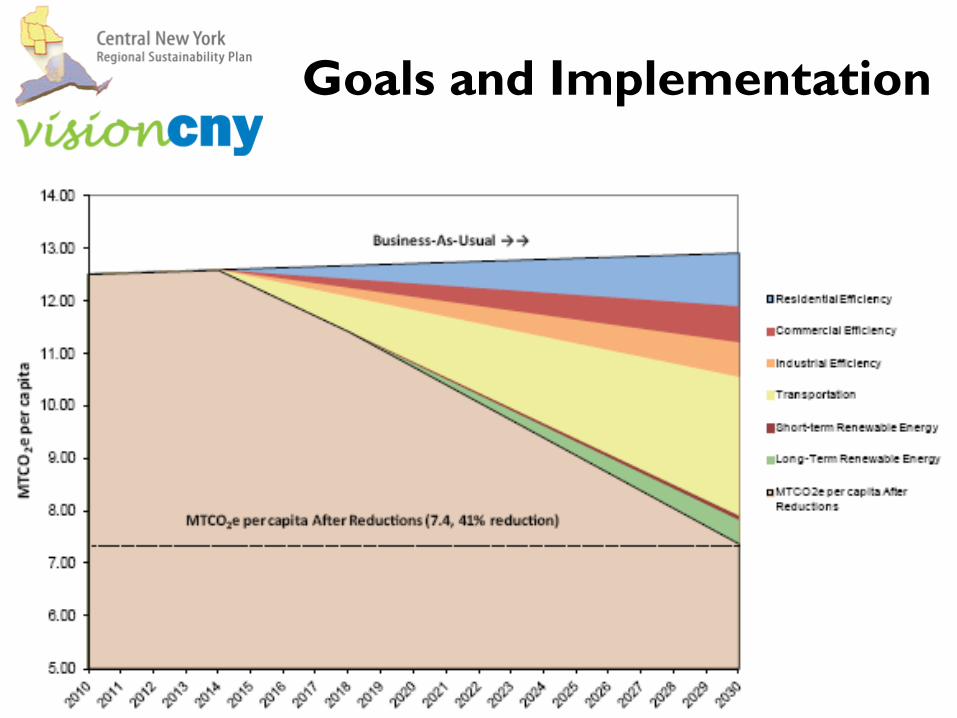
Goals and Implementation
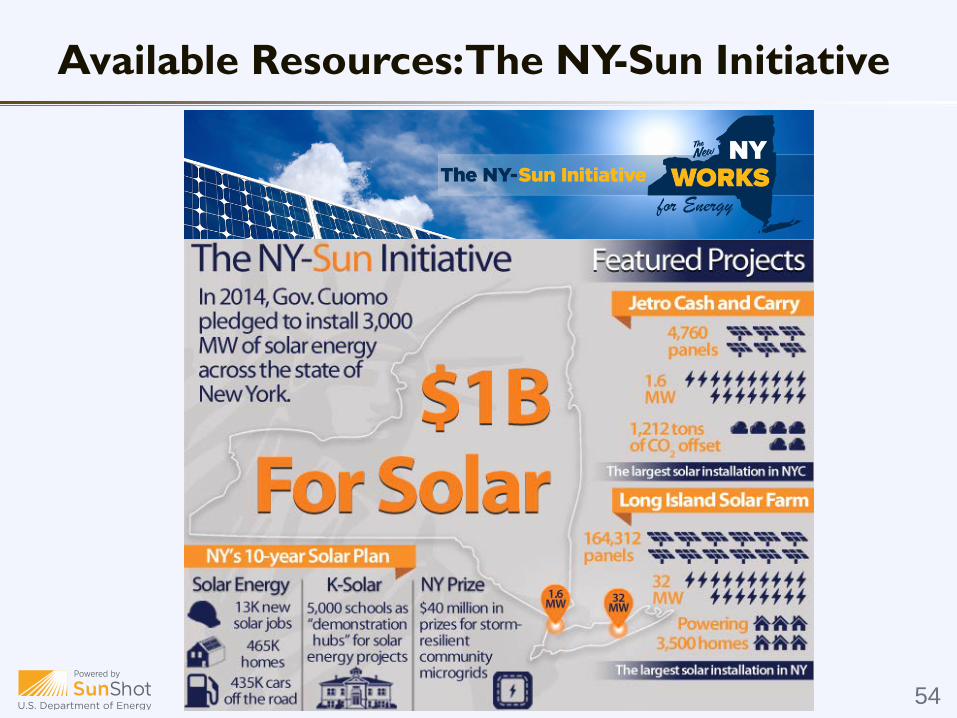
Available Resources: The NY-Sun Initiative
54
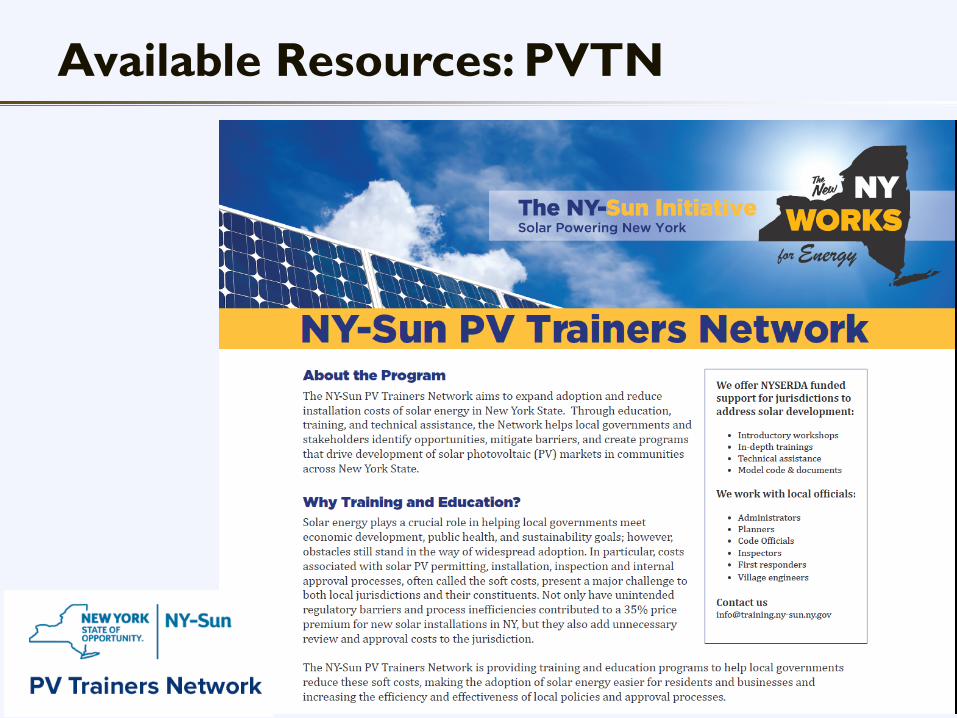
Available Resources: PVTN
55
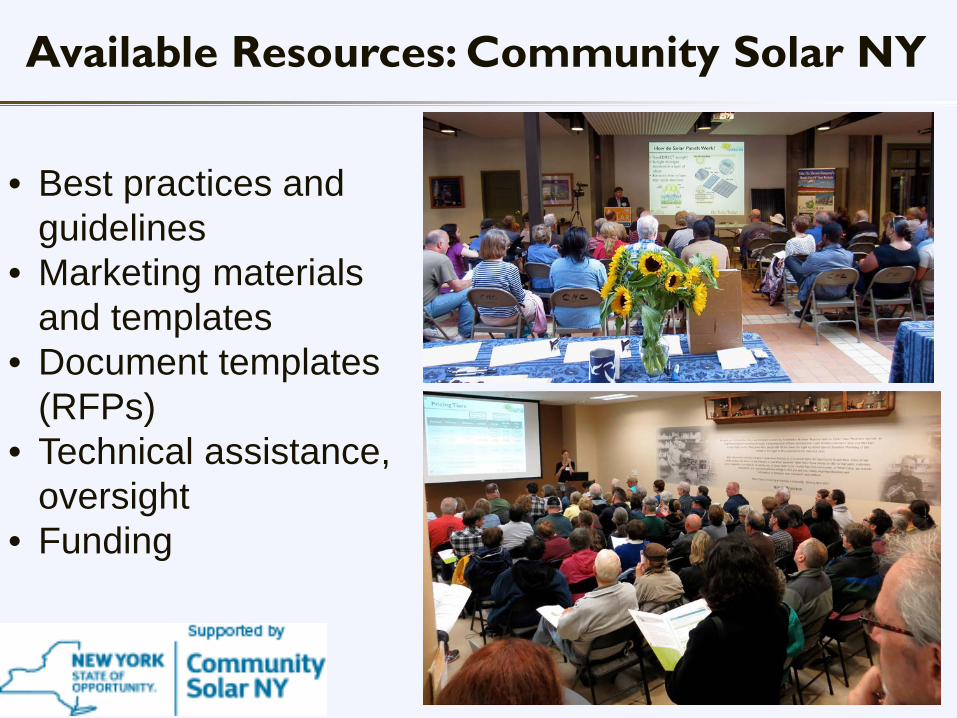
Available Resources: Community Solar NY
56
• Best practices and guidelines
• Marketing materials and templates
• Document templates (RFPs)
• Technical assistance, oversight
• Funding
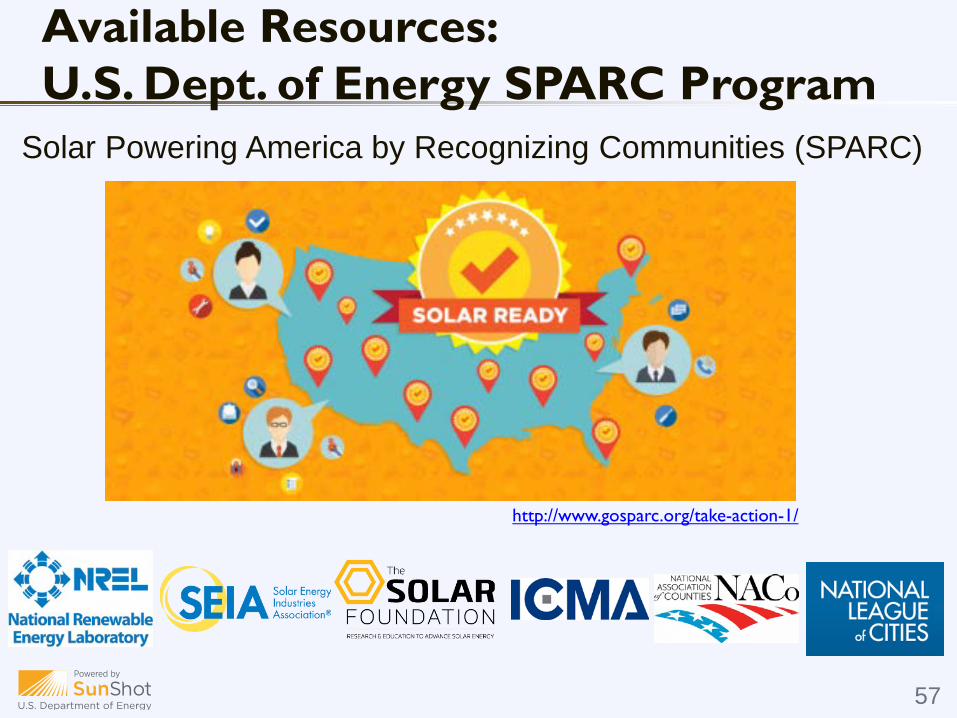
Available Resources: U.S. Dept. of Energy SPARC Program
http://www.gosparc.org/take-action-1/
57
Solar Powering America by Recognizing Communities (SPARC)
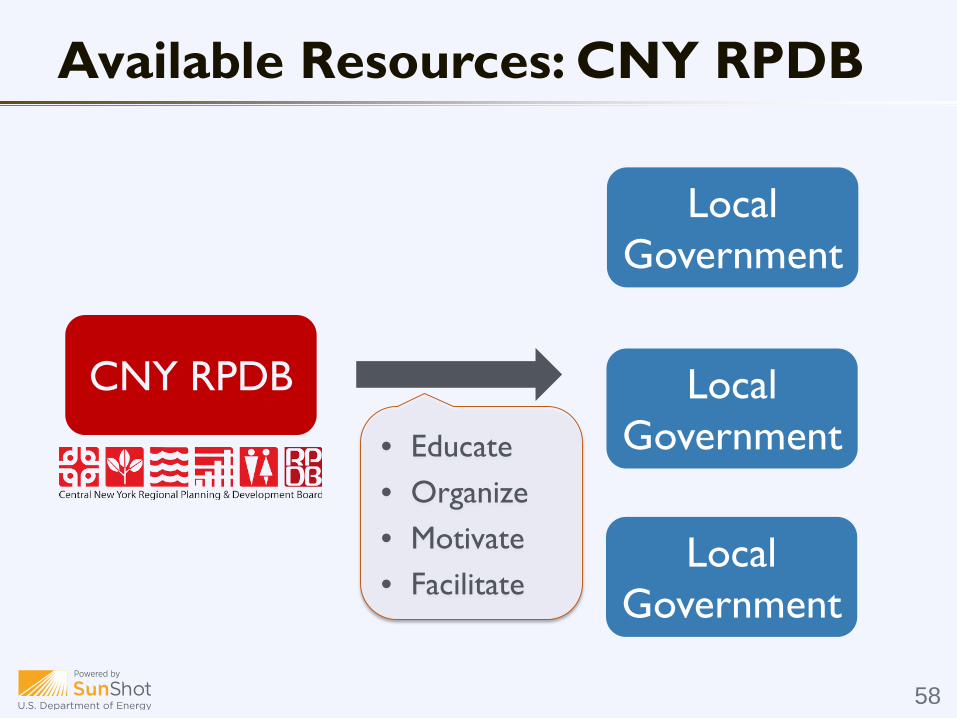
Available Resources: CNY RPDB
58
CNY RPDB
• Educate• Organize• Motivate• Facilitate
Local Government
Local Government
Local Government
Climate Smart Communities
• Partnership between New York State and local governments
• Provides resources and services to:- Reduce energy use and greenhouse gas emissions- Save taxpayer dollars- Advance community goals for:
- health and safety- economic vitality- energy independence- quality of life
CNY RPDB is the regional Climate Smart Communities Coordinator
59
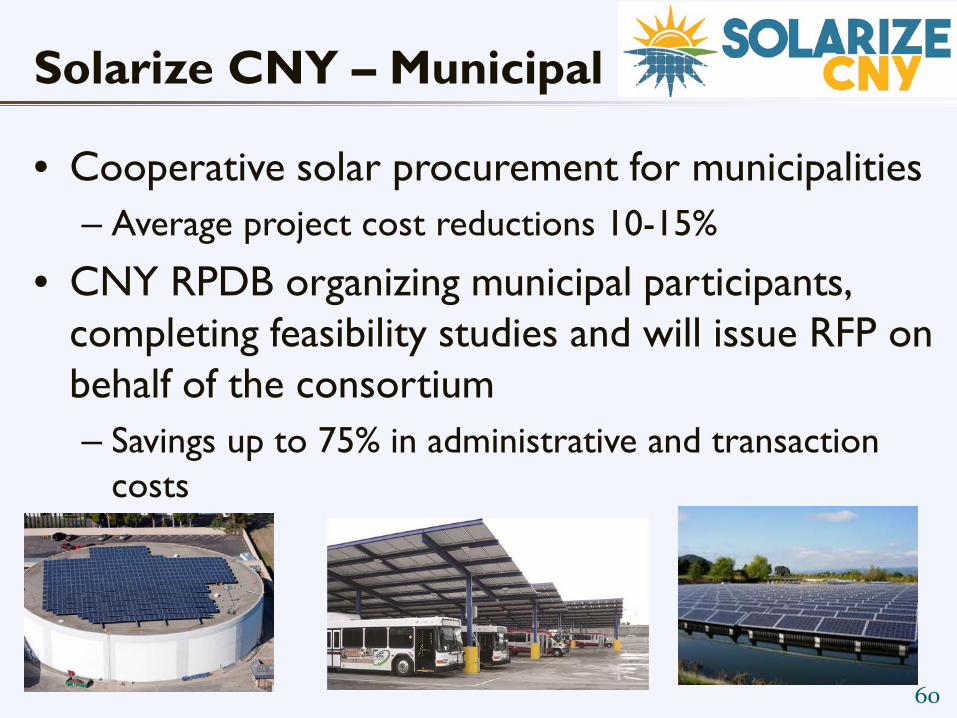
Solarize CNY – Municipal
• Cooperative solar procurement for municipalities– Average project cost reductions 10-15%
• CNY RPDB organizing municipal participants, completing feasibility studies and will issue RFP on behalf of the consortium– Savings up to 75% in administrative and transaction
costs
60
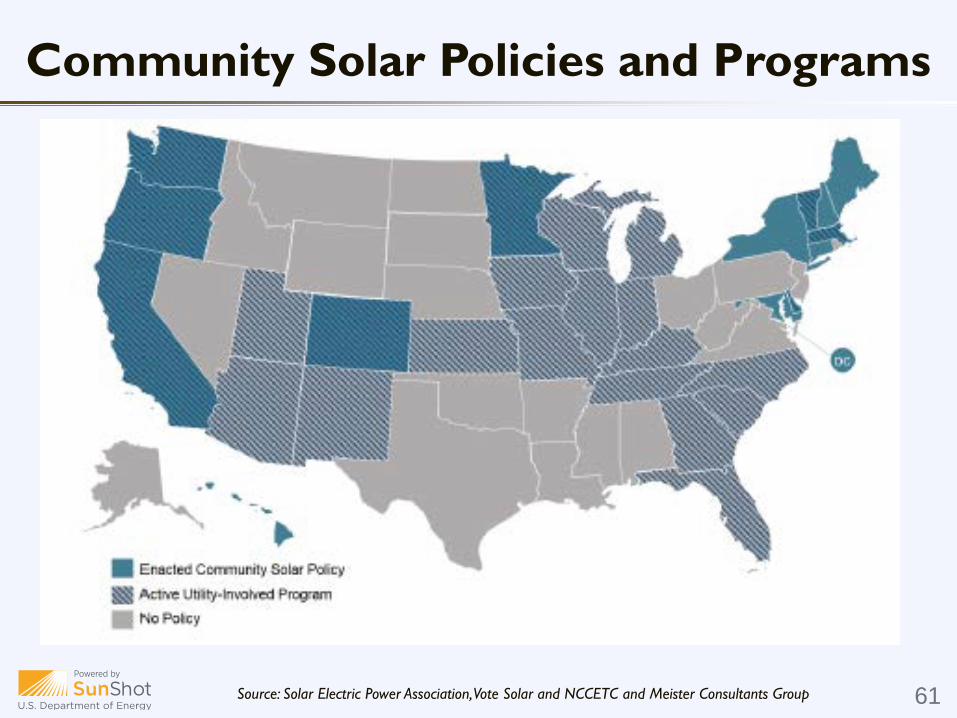
Community Solar Policies and Programs
Source: Solar Electric Power Association, Vote Solar and NCCETC and Meister Consultants Group 61
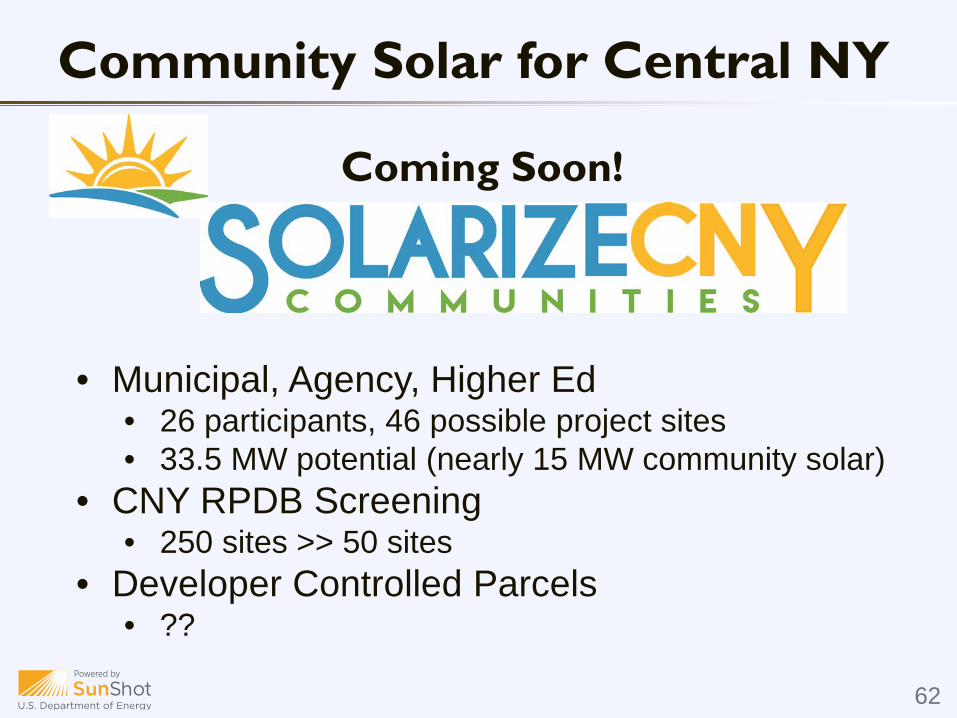
Community Solar for Central NY
62
Coming Soon!
• Municipal, Agency, Higher Ed • 26 participants, 46 possible project sites • 33.5 MW potential (nearly 15 MW community solar)
• CNY RPDB Screening• 250 sites >> 50 sites
• Developer Controlled Parcels• ??
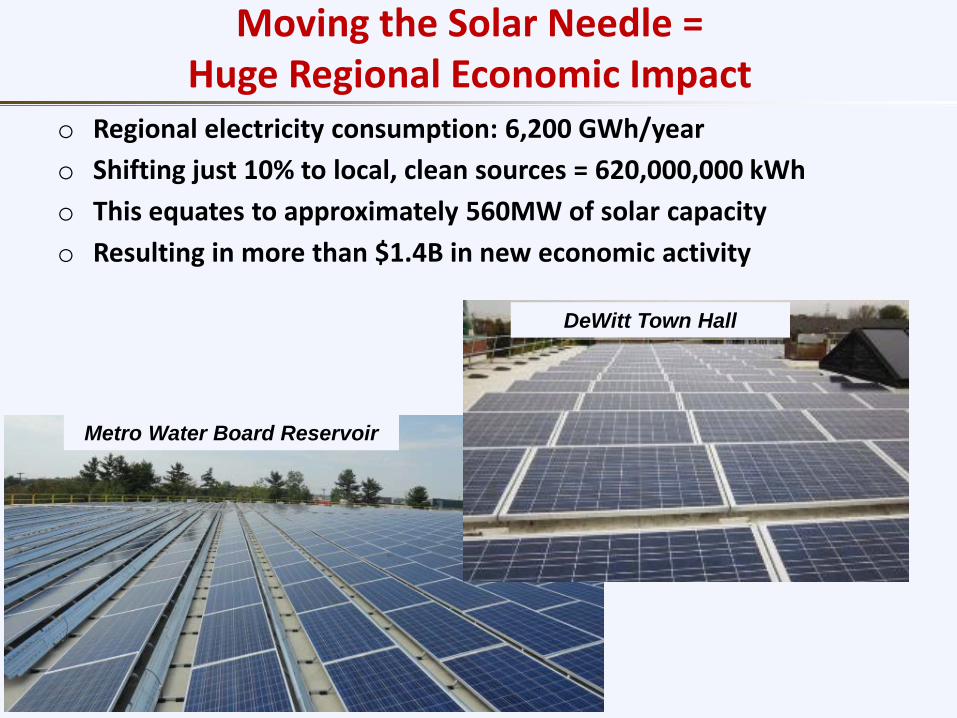
Moving the Solar Needle = Huge Regional Economic Impact
o Regional electricity consumption: 6,200 GWh/yearo Shifting just 10% to local, clean sources = 620,000,000 kWh o This equates to approximately 560MW of solar capacityo Resulting in more than $1.4B in new economic activity
63
Metro Water Board Reservoir
DeWitt Town Hall
64
Thank You!Chris Carrick, Energy Program Manager
[email protected] 315-422-8276 ext. 213
Tweet us!#solarizecny
Follow us on Facebook!