Embed Size (px)
Citation preview

fraserinstitute.org
2017 • Fraser Institute
Waiting Your Turn Wait Times for Health Care
in Canada, 2017 Report
by Bacchus Barua

fraserinstitute.org
Barua • Waiting Your Turn: 2017 Report • i
fraserinstitute.org
Contents
Executive summary / iii
Findings / 1
Method / 11
Comparisons of Data from Other Sources / 14
Conclusion / 17
Selected graphs / 18
Selected tables / 33
Appendix A: Links to Wait Times Data Published by Provincial Government Agencies / 69
Appendix B: Psychiatry Waiting List Survey, 2017 Report / 70
Appendix C: The Fraser Institute National Waiting List Survey questionnaire (2014) / 78
Appendix D: The Fraser Institute Annual Study of Wait Times for Health Care
in Canada (2017) / 80
References / 81
About the Author / 83
Acknowledgments / 84
Publishing Information / 85
Supporting the Fraser Institute / 86
About the Fraser Institute / 87
Editorial Advisory Board / 88

fraserinstitute.org

Barua • Waiting Your Turn: 2017 Report • iii
fraserinstitute.org
Executive summary
Waiting for treatment has become a defining characteristic of Canadian health care. In order to document the lengthy queues for visits to specialists and for diagnostic and surgical procedures in the country, the Fraser Institute has—for over two decades—surveyed specialist physicians across 12 specialties and 10 provinces.
This edition of Waiting Your Turn indicates that, overall, waiting times for medically necessary treatment have increased since last year. Specialist physicians surveyed report a median waiting time of 21.2 weeks between referral from a general practitioner and receipt of treatment—longer than the wait of 20.0 weeks reported in 2016. This year’s wait time—the longest ever recorded in this survey’s history—is 128% longer than in 1993, when it was just 9.3 weeks.
There is a great deal of variation in the total waiting time faced by patients across the provinces. Ontario reports the shortest total wait (15.4 weeks), while New Brunswick reports the longest (41.7 weeks). There is also a great deal of variation among special-ties. Patients wait longest between a GP referral and orthopaedic surgery (41.7 weeks), while those waiting for medical oncology begin treatment in 3.2 weeks.
The total wait time that patients face can be examined in two consecutive segments.
1 From referral by a general practitioner to consultation with a specialist. The waiting time in this segment increased from 9.4 weeks in 2016 to 10.2 weeks this year. This wait time is 177% longer than in 1993, when it was 3.7 weeks. The shortest waits for specialist consultations are in Ontario (6.7 weeks) while the longest occur in New Brunswick (26.6 weeks).
2 From the consultation with a specialist to the point at which the patient receives
treatment. The waiting time in this segment increased from 10.6 weeks in 2016 to 10.9 weeks this year. This wait time is 95% longer than in 1993 when it was 5.6 weeks, and more than three weeks longer than what physicians consider to be clinically “reasonable” (7.2 weeks). The shortest specialist-to-treatment waits are found in Ontario (8.6 weeks), while the longest are in Manitoba (16.3 weeks).

iv • Waiting Your Turn: 2017 Report • Barua
fraserinstitute.org
It is estimated that, across the 10 provinces, the total number of procedures for which people are waiting in 2017 is 1,040,791. This means that, assuming that each person waits for only one procedure, 2.9% of Canadians are waiting for treatment in 2017. The proportion of the population waiting for treatment varies from a low of 1.7% in Quebec to a high of 5.7% in Nova Scotia. It is important to note that physicians report that only about 11.5% of their patients are on a waiting list because they requested a delay or postponement.
Patients also experience significant waiting times for various diagnostic technologies across the provinces. This year, Canadians could expect to wait 4.1 weeks for a computed tomography (CT) scan, 10.8 weeks for a magnetic resonance imaging (MRI) scan, and 3.9 weeks for an ultrasound.
Research has repeatedly indicated that wait times for medically necessary treatment are not benign inconveniences. Wait times can, and do, have serious consequences such as increased pain, suffering, and mental anguish. In certain instances, they can also result in poorer medical outcomes—transforming potentially reversible illnesses or injuries into chronic, irreversible conditions, or even permanent disabilities. In many instances, patients may also have to forgo their wages while they wait for treatment, resulting in an economic cost to the individuals themselves and the economy in general.
The results of this year’s survey indicate that despite provincial strategies to reduce wait times and high levels of health expenditure, it is clear that patients in Canada continue to wait too long to receive medically necessary treatment.

Barua • Waiting Your Turn: 2017 Report • v
fraserinstitute.org
0 5 10 15 20 25 30 35 40 45
Canada
Newfoundland & Labrador
Prince Edward Island
Nova Scotia
New Brunswick
Quebec
Ontario
Manitoba
Saskatchewan
Alberta
British Columbia26.6
10.5
26.5
19.8
10.5
10.1
9.1
15.4
7.3
20.6
12.3
10.4
8.6
9.8
16.3 24.9
6.4
32.4
37.7
17.1
11.5
41.7
Weeks waited
Median wait from referral by GP to treatment, by province, 1993 and 2017
10.6
21.5
9.3
21.2
12.5 14.1
12.0 14.4
26.6 15.1
21.6 16.1
11.4 9.2
21.0 11.4
12.8 8.7
10.2 10.9
9.7
4.1
7.13.3
6.93.6
6.73.1
4.94.3
4.42.9
8.24.1
6.64.9
11.95.2
7.53.1
5.63.7
8.66.7
Source: The Fraser Institute’s national waiting list survey, 2017; Waiting Your Turn, 1997.
1993: GP to specialist specialist to treatment
2017: GP to specialist specialist to treatment

vi • Waiting Your Turn: 2017 Report • Barua
fraserinstitute.org
This publication has four series of illustrations and tabular material.
• Charts, which may be graphs or tables, will be found in the main text, pp. 1–17.
• Graphs will be found in “Selected graphs”, pp. 18–32.
• Tables will be found in “Selected tables”, pp. 33–68.
• “Appendix B: Psychiatry Waiting List Survey, 2016 Report”, pp. 71–78, has tables
and a graph labeled “B1” and so on.

Barua • Waiting Your Turn: 2017 Report • 1
fraserinstitute.org
Findings
Total wait timesThe Fraser Institute’s twenty-seventh annual waiting list survey finds that wait times [1] for surgical and other therapeutic treatments increased in 2017 (table 2; chart 1). The total waiting time between referral from a general practitioner and delivery of medic-ally necessary elective treatment by a specialist, averaged across all 12 specialties and 10 provinces surveyed, has risen from 20.0 weeks in 2016 to 21.2 weeks in 2017. This
1. For an explanation of how Waiting Your Turn measures wait times, see the “Method” section.
0 5 10 15 20 25 30 35 40 45
Canada
Newfoundland & Labrador
Prince Edward Island
Nova Scotia
New Brunswick
Quebec
Ontario
Manitoba
Saskatchewan
Alberta
British Columbia
Wait from specialist to treatmentWait from GP to specialist
12.5 14.1 26.6
12.0 14.4 26.5
9.7 10.1 19.8
8.6 16.3 24.9
6.7 8.6 15.4
11.4 9.2 20.6
26.6 15.1 41.7
21.6 16.1 37.7
21.0 11.4
8.7
32.4
12.8 21.5
10.2 10.9 21.2
Weeks waited
Note: Totals may not equal the sum of subtotals due to rounding.Source: The Fraser Institute’s national waiting list survey, 2017.
Chart 1: Median wait by province in 2017—weeks waited from
referral by GP to treatment
2 • Waiting Your Turn: 2017 Report • Barua
fraserinstitute.org
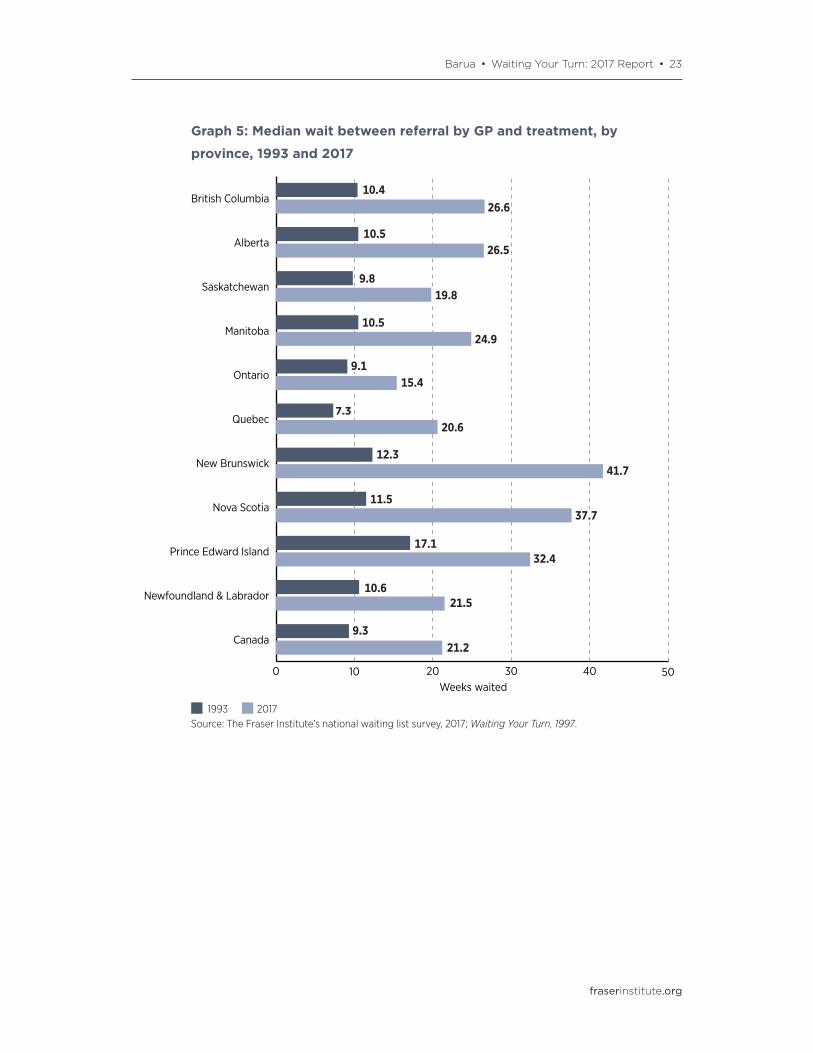
year’s wait time—the longest ever recorded in the survey’s history—is 128% longer than in 1993, when it was just 9.3 weeks. The deterioration in wait- times nationwide reflects increases in British Columbia, Alberta, Saskatchewan, Manitoba, Quebec, New Brunswick, Nova Scotia and Prince Edward Island while concealing improvements in Ontario and Newfoundland & Labrador.
Ontario reports the shortest total wait in 2017 (15.4 weeks), followed by Saskatchewan (19.8 weeks), and Quebec (20.6 weeks). New Brunswick has the longest total wait at 41.7 weeks, followed by Nova Scotia (37.7 weeks), and Prince Edward Island (32.4 weeks).
Wait time by segmentTotal wait time can be examined in two consecutive segments:
1 from referral by a general practitioner to consultation with a specialist; 2 from the consultation with a specialist to point at which patient receives treatment.
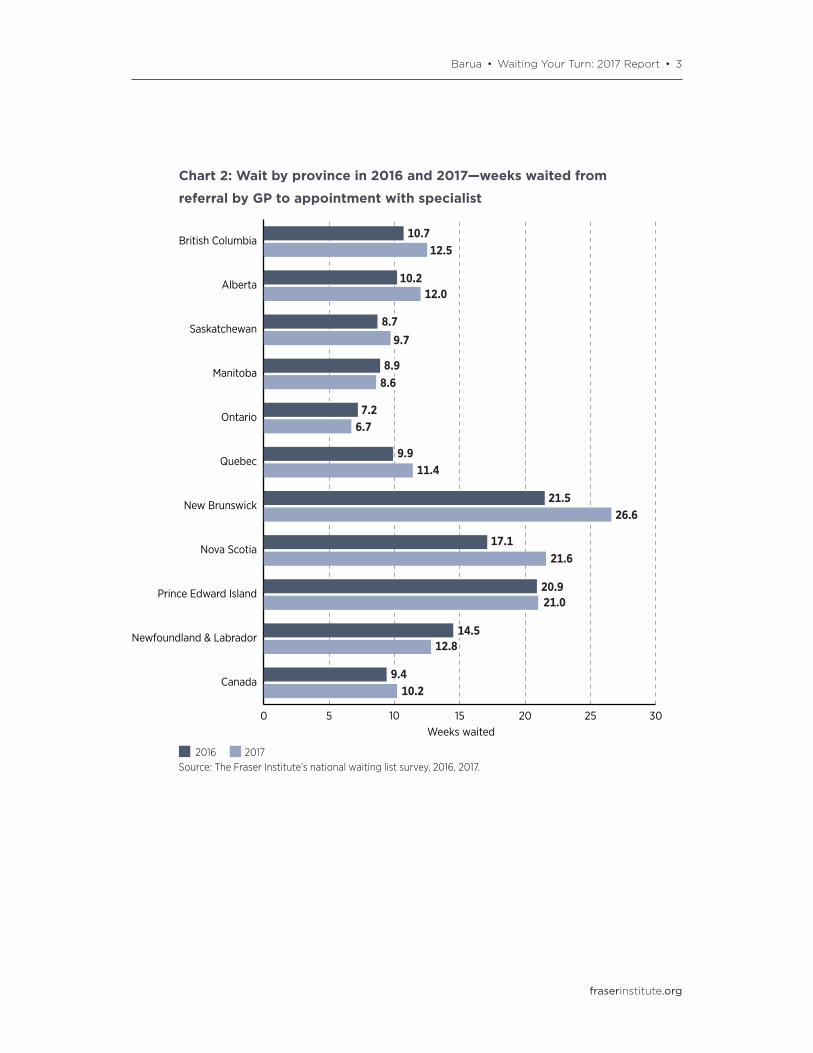
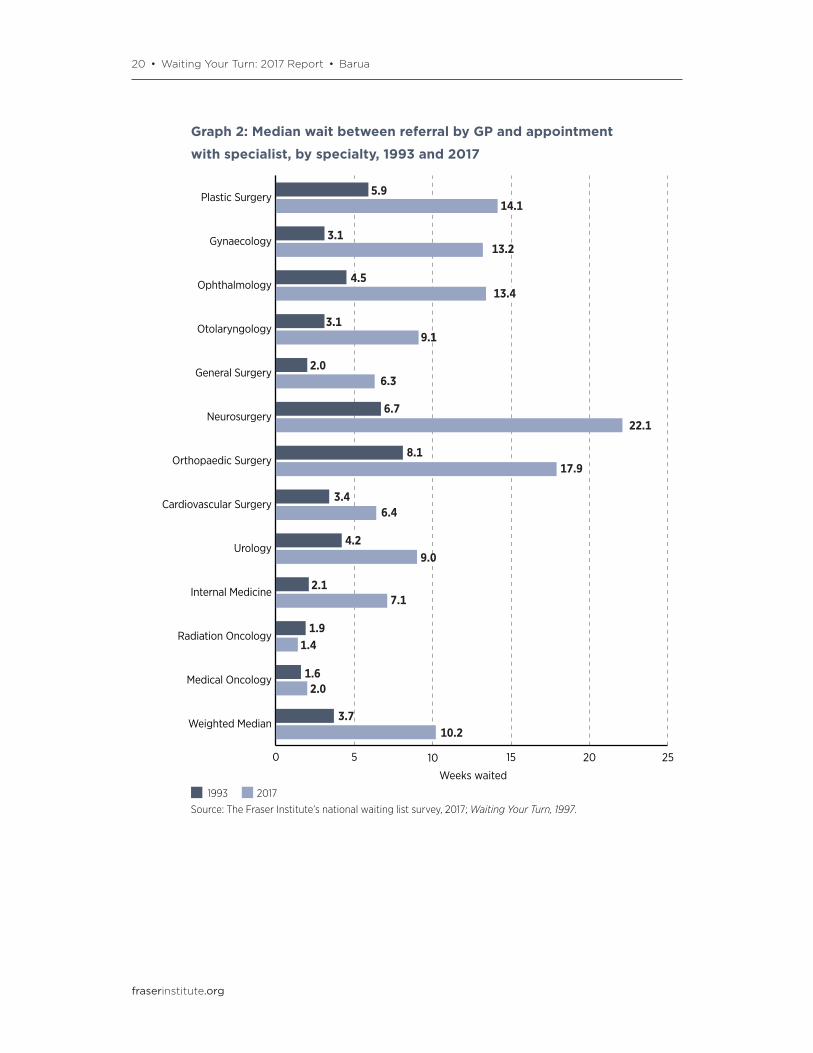
The increase in total waiting time between 2016 and 2017 results from an increase in both the first and second segments. The waiting time in the first segment—from refer-ral by a general practitioner to consultation with a specialist—has risen from 9.4 weeks in 2016 to 10.2 weeks in 2017. This wait time is 177% longer than in 1993, when it was 3.7 weeks (graph 1; graph 2). The waiting time to see a specialist has increased in seven provinces since 2016, but has fallen in Manitoba, Ontario, and Newfoundland & Labrador (chart 2). The shortest waits for specialist consultations are in Ontario (6.7 weeks), Manitoba (8.6 weeks), and Saskatchewan (9.7 weeks). The longest waits for spe-cialist consultations are found in New Brunswick (26.6 weeks), Nova Scotia (21.6 weeks), and Prince Edward Island (21.0 weeks) (see table 3).
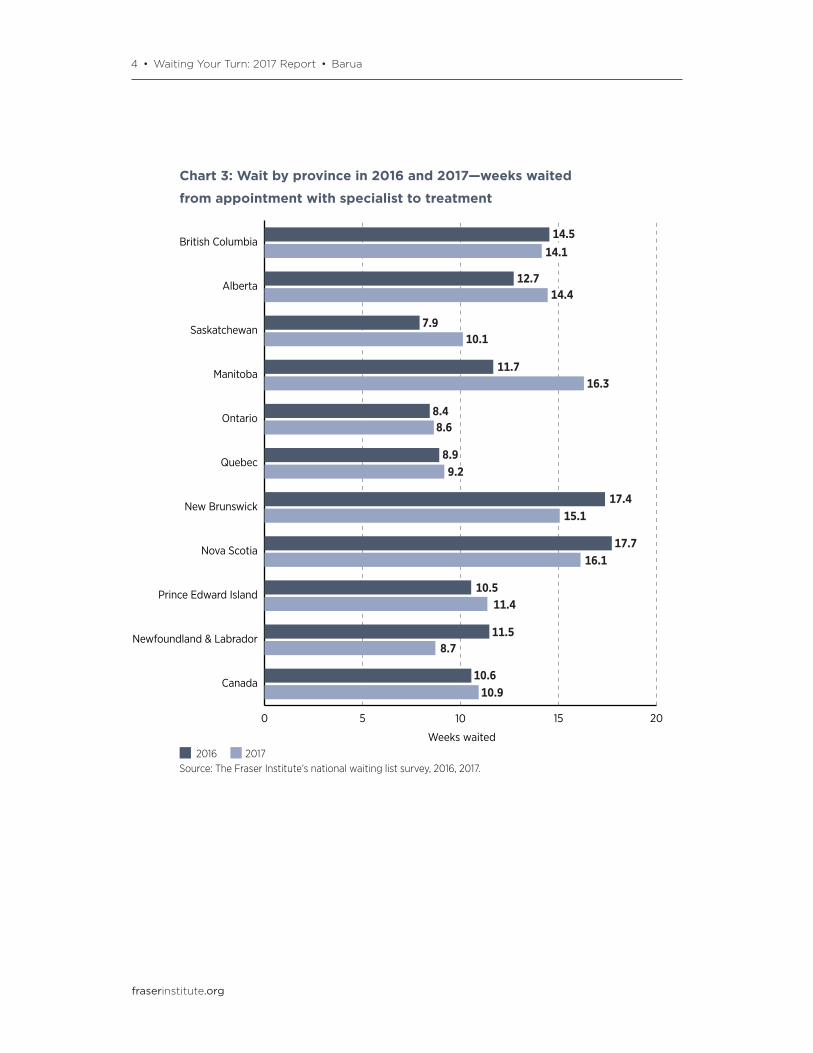
The waiting time in the second segment—from consultation with a specialist to the point at which the patient receives treatment—has risen from 10.6 weeks in 2016 to 10.9 weeks in 2017 (chart 3). This portion of waiting is 95% longer than in 1993 when it was 5.6 weeks (graph 3; graph 4). Waiting times from specialist consulta-tion to treatment have increased in six provinces, but decreased in British Columbia, New Brunswick, Nova Scotia, and Newfoundland & Labrador. The shortest specialist-to-treatment waits are found in Ontario (8.6 weeks), Newfoundland & Labrador (8.7 weeks), and Quebec (9.2 weeks), while the longest are in Manitoba (16.3 weeks), Nova Scotia (16.1 weeks), and New Brunswick (15.1 weeks) (table 4).
Barua • Waiting Your Turn: 2017 Report • 3
fraserinstitute.org
0 5 10 15 20 25 30
Canada
Newfoundland & Labrador
Prince Edward Island
Nova Scotia
New Brunswick
Quebec
Ontario
Manitoba
Saskatchewan
Alberta
British Columbia10.7
10.2
8.7
8.9
7.2
9.9
17.1
21.5
20.9
14.5
9.4
12.5
12.0
9.7
8.6
6.7
11.4
26.6
21.6
21.0
12.8
10.2
Weeks waited
Source: The Fraser Institute’s national waiting list survey, 2016, 2017.
Chart 2: Wait by province in 2016 and 2017—weeks waited from
referral by GP to appointment with specialist
20172016
4 • Waiting Your Turn: 2017 Report • Barua
fraserinstitute.org
0 5 10 15 20
Canada
Newfoundland & Labrador
Prince Edward Island
Nova Scotia
New Brunswick
Quebec
Ontario
Manitoba
Saskatchewan
Alberta
British Columbia
20172016
14.5
12.7
7.9
11.7
8.4
8.9
17.4
17.7
10.5
11.5
10.6
14.1
14.4
10.1
16.3
8.6
9.2
15.1
16.1
11.4
8.7
10.9
Weeks waited
Source: The Fraser Institute’s national waiting list survey, 2016, 2017.
Chart 3: Wait by province in 2016 and 2017—weeks waited
from appointment with specialist to treatment

Barua • Waiting Your Turn: 2017 Report • 5
fraserinstitute.org
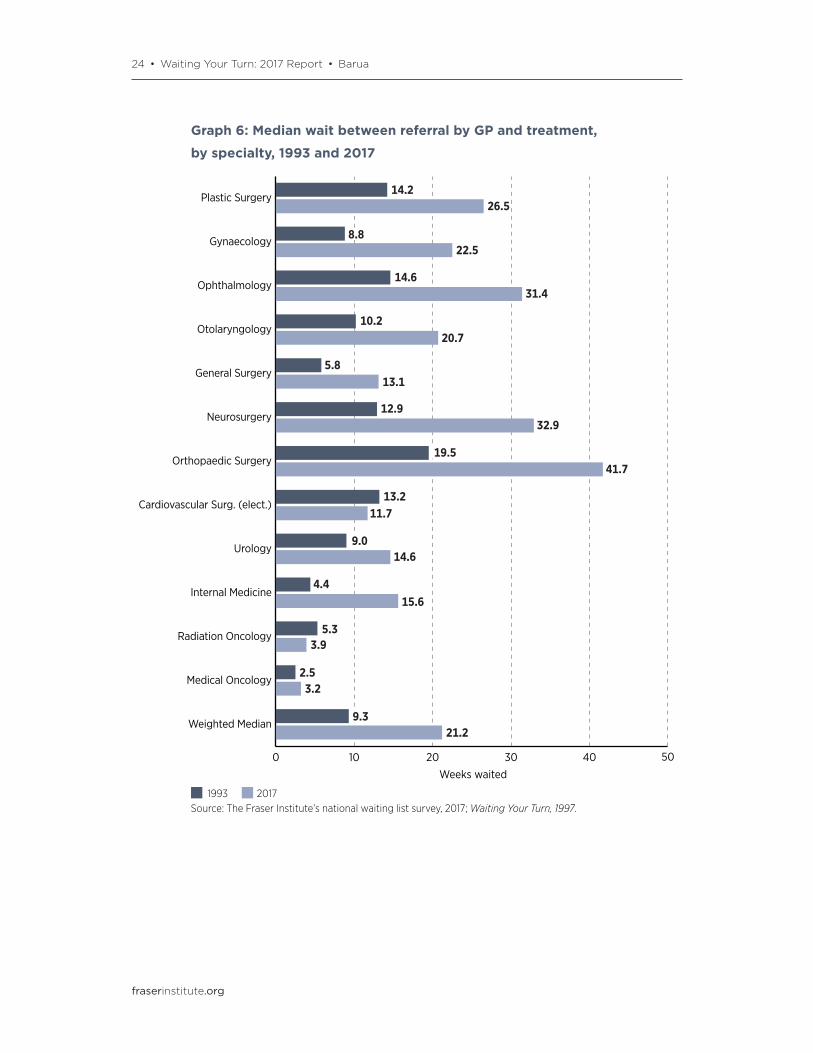
Waiting by specialtyAmong the various specialties, the shortest total waits exist for medical oncology (3.2 weeks), radiation oncology (3.9 weeks), and elective cardiovascular surgery (11.7 weeks). Conversely, patients wait longest between a referral by a GP and orthopaedic surgery (41.7 weeks), neurosurgery (32.9 weeks), and ophthalmology (31.4 weeks) (table 2; chart 4). The largest increases in waits between 2016 and 2017 have been for gynaecol-ogy (3.7 weeks), orthopaedic surgery (3.7 weeks), and elective cardivascular surgery (3.2 weeks). Such increases are offset by decreases in wait times for patients receiving treat-ment in the fields like neurosurgery (−14.0 weeks), otolaryngology (−2.0 weeks) and urology (−1.6 weeks).
0 5 10 15 20 25 30 35 40 45
Weighted Median
Medical Oncology
Radiation Oncology
Internal Medicine
Urology
Cardiovascular (Elec.)
Orthopaedic Surgery
Neurosurgery
General Surgery
Otolaryngology
Ophthalmology
Gynaecology
Plastic Surgery
Wait from specialist to treatmentWait from GP to specialist
14.1 12.4 26.5
13.2 9.3 22.5
13.4 18.0 31.4
9.1 11.6 20.7
6.3 6.8 13.1
22.1 10.8 32.9
17.9 23.8 41.7
6.4 5.3 11.7
7.1 8.4 15.6
3.9
3.2
10.2 10.9 21.2
Weeks waited
Note: Totals may not equal the sum of subtotals due to rounding.Source: The Fraser Institute’s national waiting list survey, 2017.
Chart 4: Median wait by specialty in 2017—weeks waited
from referral by GP to treatment
9.0 5.6 14.6
4.41.4 2.5
2.0 1.2
6 • Waiting Your Turn: 2017 Report • Barua
fraserinstitute.org
Breaking waiting time down into its two components, there is also variation among spe-cialties. The shortest waits from referral by a general practitioner to consultation with a specialist are in radiation oncology (1.4 weeks), medical oncology (2.0 weeks), and general surgery (6.3 weeks). The longest waits are for neurosurgery (22.1 weeks), ortho-paedic surgery (17.9 weeks), and plastic surgery (14.1 weeks) (table 3).
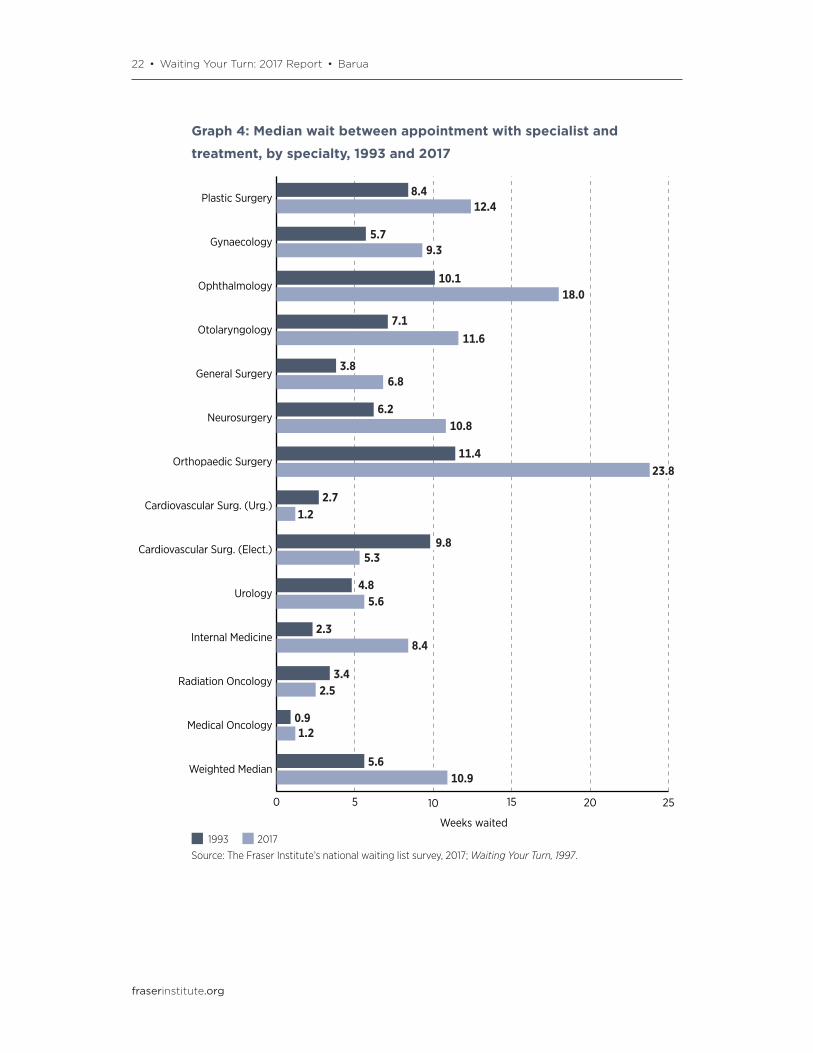
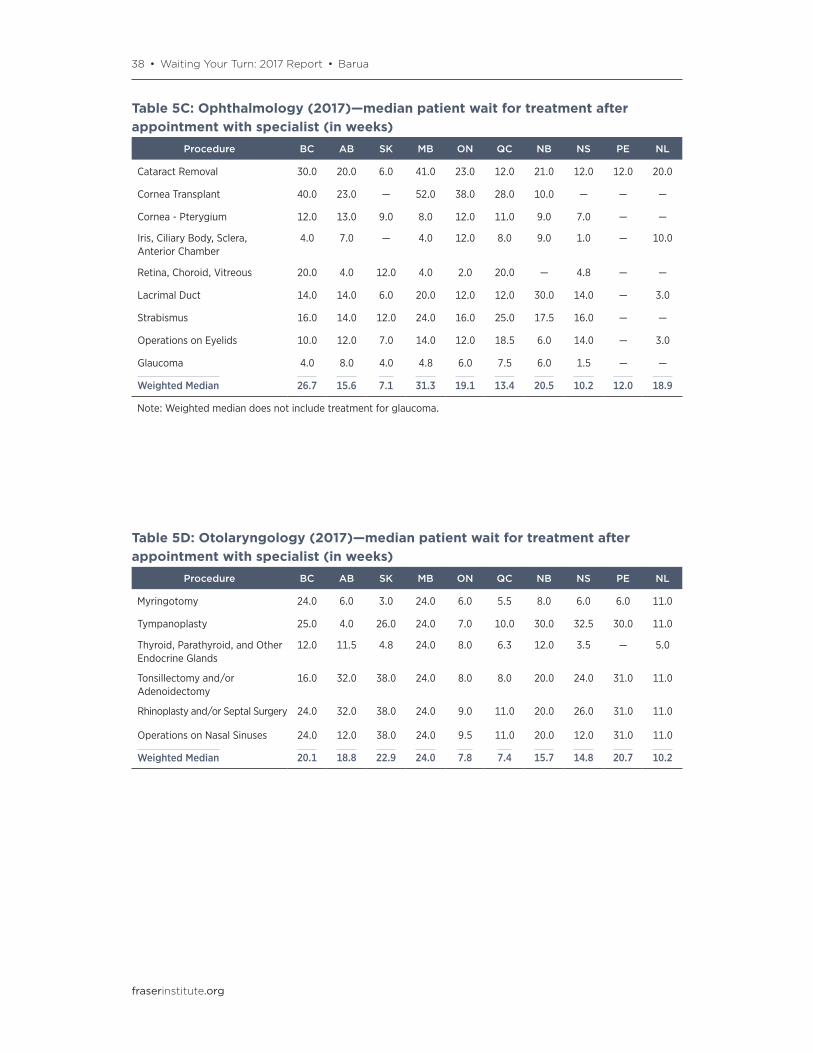
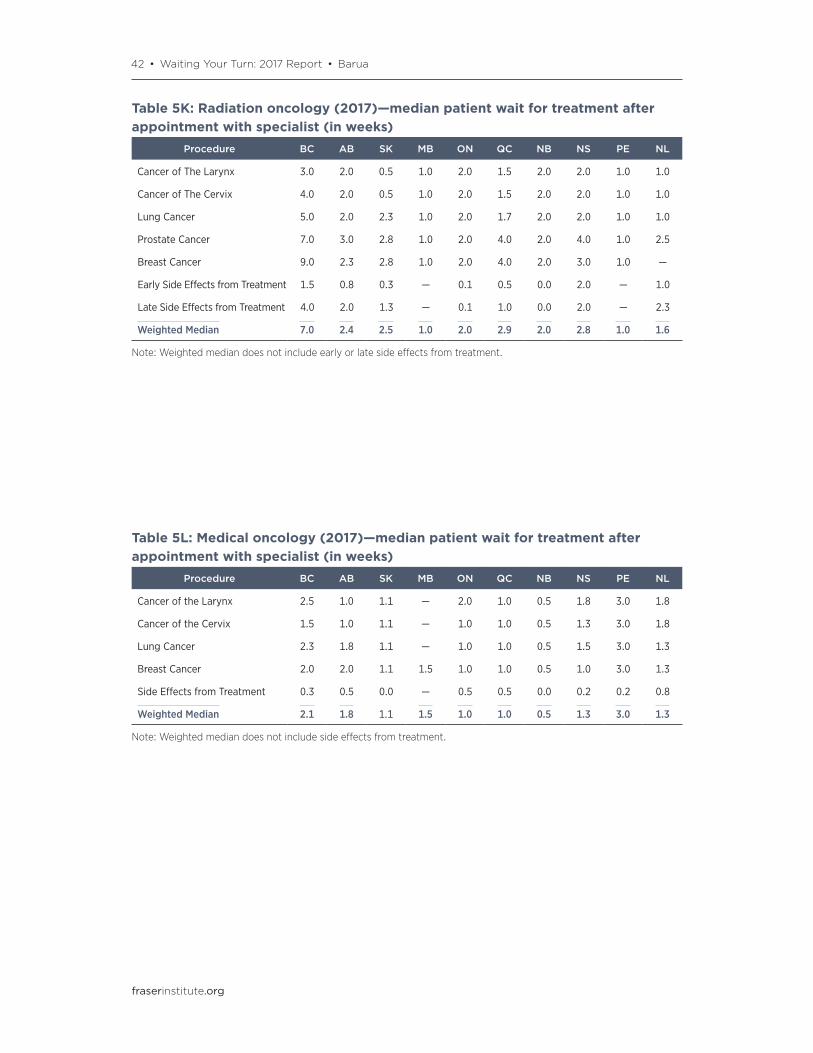
For the second segment—from consultation with a specialist to the point at which the patient receives treatment—patients wait the shortest intervals for medical onc-ology (1.2 weeks), urgent cardiovascular surgery (1.2 weeks), and radiation oncology (2.5 weeks). They wait longest for orthopaedic surgery (23.8 weeks), ophthalmology (18.0 weeks), and plastic surgery (12.4 weeks) (table 4; chart 5). Median wait times for specific procedures within a specialty, by province, are shown in tables 5A–5L.
Comparison between clinically “reasonable” and actual waiting timesSpecialists are also surveyed as to what they regard as clinically “reasonable” waiting times in the second segment covering the time spent from specialist consultation to delivery of treatment. Out of the 108 categories (some comparisons were precluded by missing data), actual waiting time (table 4) exceeds reasonable waiting time (table 8) in 62% of the comparisons. Averaged across all specialties, Quebec and Saskatchewan have come closest to meeting the standard of “reasonable” wait times. Their actual second-segment waits exceed the corresponding “reasonable” values by only 17% and 34%, respectively. It should be noted, however, that physicians in Prince Edward Island, Newfoundland & Labrador, Ontario, and Manitoba hold relatively more stringent stan-dards as to what is “reasonable” (table 10). The greatest difference between these two values across all provinces for a specialty is in orthopaedic surgery, where the actual waiting time is 11.8 weeks longer than what is considered to be “reasonable” by special-ists (chart 6). [2] Median reasonable wait times for specific procedures within a spe-cialty, by province, are shown in tables 9A–9L.
2. The greatest proportional difference for a specialty is in Internal Medicine, where the actual waiting time exceeds the corresponding reasonable value by 122%.

Barua • Waiting Your Turn: 2017 Report • 7
fraserinstitute.org
0 5 10 15 20 25
Weighted Median
Medical Oncology
Radiation Oncology
Internal Medicine
Urology
Cardiovascular Surg. (Elect.)
Cardiovascular Surg. (Urg.)
Orthopaedic Surgery
Neurosurgery
General Surgery
Otolaryngology
Ophthalmology
Gynaecology
Plastic Surgery16.0
8.79.3
16.518.0
12.611.6
6.46.8
14.410.8
22.523.8
1.61.2
5.45.6
7.98.4
2.72.5
1.71.2
10.610.9
Weeks waited
Source: The Fraser Institute’s national waiting list survey, 2016, 2017.
Chart 5: Wait by specialty in 2016 and 2017—weeks waited from
appointment with specialist to treatment
5.95.3
20172016
12.4

8 • Waiting Your Turn: 2017 Report • Barua
fraserinstitute.org
0 5 10 15 20 25
Weighted Median
Medical Oncology
Radiation Oncology
Internal Medicine
Urology
Cardiovascular Surg. (Elect.)
Cardiovascular Surg. (Urg.)
Orthopaedic Surgery
Neurosurgery
General Surgery
Otolaryngology
Ophthalmology
Gynaecology
Plastic Surgery12.4
9.37.6
18.010.4
11.610.3
6.85.8
10.86.5
23.812.0
1.21.0
5.64.8
8.43.8
2.53.0
1.22.0
10.97.2
Weeks waited
Source: The Fraser Institute’s national waiting list survey, 2017.
Chart 6: Median actual wait compared to median clinically reasonable
wait by specialty in Canada in 2017—weeks waited from appointment
with specialist to treatment
5.35.8
Median clinically reasonable waitMedian actual wait
13.8

Barua • Waiting Your Turn: 2017 Report • 9
fraserinstitute.org
Waiting for diagnostic and therapeutic technologyPatients also experience significant waiting times for various diagnostic technologies across the provinces. The wait for a computed tomography (CT) scan has increased to 4.1 weeks in 2017 from 3.7 weeks in 2016. Saskatchewan and Ontario have the short-est wait for a CT scan (3.0 weeks), while the longest waits occur in British Columbia, Alberta, and Nova Scotia (6.0 weeks). The wait for a magnetic resonance imaging (MRI) scan has decreased to 10.8 weeks in 2017 from 11.1 weeks in 2016. Patients in Ontario face the shortest wait for an MRI (6.0 weeks), while residents of British Columbia and Prince Edward Island wait longest (24.0 weeks). Finally, the wait for an ultra-sound has decreased to 3.9 weeks in 2017 from 4.0 weeks in 2016 and 2015. Alberta, Saskatchewan, and Ontario have the shortest wait for an ultrasound (2.0 weeks), while Quebec and Nova Scotia have the longest: 8.0 weeks (chart 7).
Chart 7: Waiting for technology: weeks waited to receive selected diagnostic
tests in 2017, 2016, and 2015
CT-Scan MRI Ultrasound
2017 2016 2015 2017 2016 2015 2017 2016 2015
British Columbia 6.0 5.0 5.0 24.0 24.0 24.0 5.0 5.5 4.0
Alberta 6.0 4.0 4.0 16.0 12.0 12.0 2.0 2.0 2.0
Saskatchewan 3.0 3.0 4.0 12.0 12.0 9.0 2.0 4.0 4.0
Manitoba 5.0 4.0 4.0 13.0 12.0 8.0 5.0 4.5 5.0
Ontario 3.0 3.0 3.0 6.0 6.0 5.0 2.0 2.0 2.0
Quebec 4.0 4.0 5.0 10.0 12.0 12.0 8.0 8.0 8.0
New Brunswick 4.0 4.0 4.0 8.0 8.0 8.0 6.0 6.0 7.0
Nova Scotia 6.0 4.0 5.0 9.0 12.0 12.0 8.0 4.0 5.0
Prince Edward Island 4.0 6.0 6.0 24.0 16.0 12.0 6.0 6.0 42.0
Newfoundland & Labrador 4.0 4.0 4.8 7.0 4.0 6.0 5.9 6.0 6.3
Canada 4.1 3.7 4.0 10.8 11.1 10.4 3.9 4.0 4.0
Note: Links to wait times data published by provincial government agencies can be found in Appendix A.

10 • Waiting Your Turn: 2017 Report • Barua
fraserinstitute.org
Numbers of procedures for which people are waitingThis study estimates that, across the 10 provinces, the total number of procedures for which people are waiting in 2017 is 1,040,791 (table 12; table 14 presents the numbers for the provinces on a population-adjusted basis), an increase of 6.9% from the estimated 973,505 procedures in 2016. The estimated number of procedures for which people are waiting increased in all provinces except New Brunswick, Nova Scotia, and Newfoundland & Labrador. Assuming that each person waits for only one procedure, 2.9% of Canadians are waiting for treatment in 2017, which varies from a low of 1.7% of the population in Quebec to a high of 5.7% in Nova Scotia. [3] Tables 13A–13L (pp. 55–60) show the num-ber of procedures for which people are waiting within a specialty, by province.
3. These numbers should be interpreted with caution, especially for Saskatchewan. As a result of dis-cussions with provincial authorities in 2002, counts of “the number of patients waiting for surgery” have been replaced with the “number of procedures for which patients are waiting”. There do not, however, appear to be significant systematic differences between the numbers of “procedures for which people are waiting” estimated in this edition of Waiting Your Turn and counts of “patients waiting” reported by provincial ministries.
Barua • Waiting Your Turn: 2017 Report • 11
fraserinstitute.org
Method
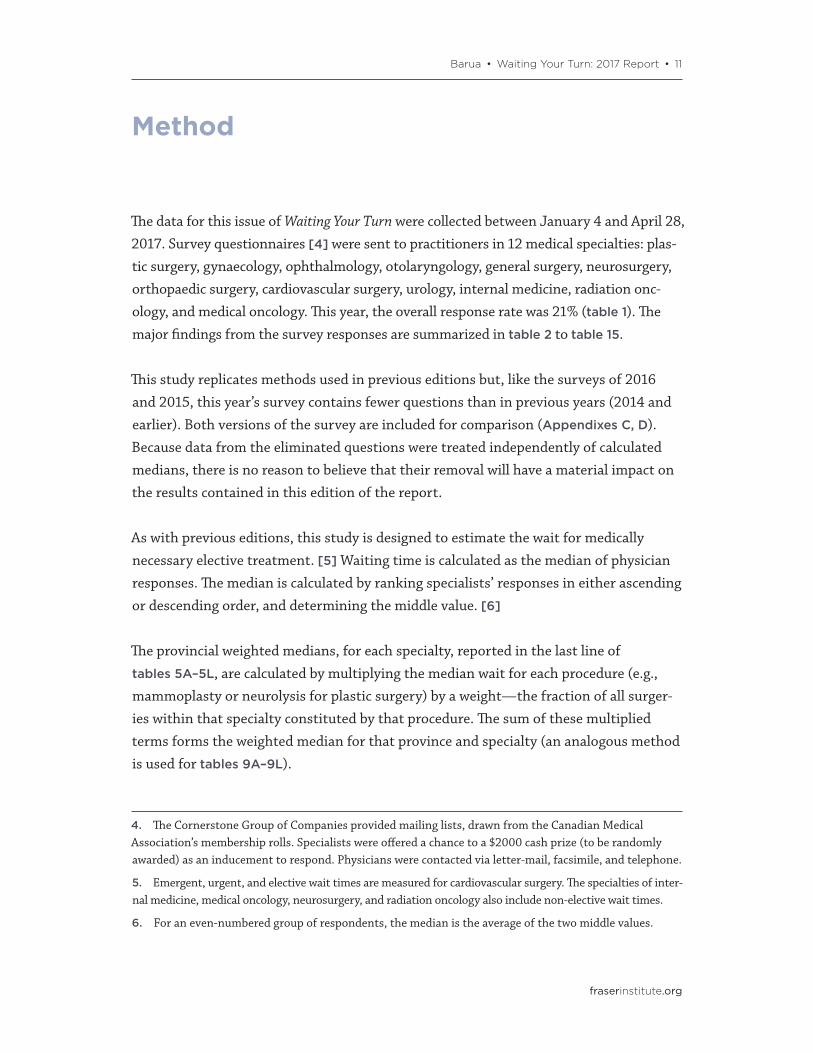
The data for this issue of Waiting Your Turn were collected between January 4 and April 28, 2017. Survey questionnaires [4] were sent to practitioners in 12 medical specialties: plas-tic surgery, gynaecology, ophthalmology, otolaryngology, general surgery, neurosurgery, orthopaedic surgery, cardiovascular surgery, urology, internal medicine, radiation onc-ology, and medical oncology. This year, the overall response rate was 21% (table 1). The major findings from the survey responses are summarized in table 2 to table 15.
This study replicates methods used in previous editions but, like the surveys of 2016 and 2015, this year’s survey contains fewer questions than in previous years (2014 and earlier). Both versions of the survey are included for comparison (Appendixes C, D). Because data from the eliminated questions were treated independently of calculated medians, there is no reason to believe that their removal will have a material impact on the results contained in this edition of the report.
As with previous editions, this study is designed to estimate the wait for medically necessary elective treatment. [5] Waiting time is calculated as the median of physician responses. The median is calculated by ranking specialists’ responses in either ascending or descending order, and determining the middle value. [6]
The provincial weighted medians, for each specialty, reported in the last line of tables 5A–5L, are calculated by multiplying the median wait for each procedure (e.g., mammoplasty or neurolysis for plastic surgery) by a weight—the fraction of all surger-ies within that specialty constituted by that procedure. The sum of these multiplied terms forms the weighted median for that province and specialty (an analogous method is used for tables 9A–9L).
4. The Cornerstone Group of Companies provided mailing lists, drawn from the Canadian Medical Association’s membership rolls. Specialists were offered a chance to a $2000 cash prize (to be randomly awarded) as an inducement to respond. Physicians were contacted via letter-mail, facsimile, and telephone.
5. Emergent, urgent, and elective wait times are measured for cardiovascular surgery. The specialties of inter-nal medicine, medical oncology, neurosurgery, and radiation oncology also include non-elective wait times.
6. For an even-numbered group of respondents, the median is the average of the two middle values.
12 • Waiting Your Turn: 2017 Report • Barua
fraserinstitute.org
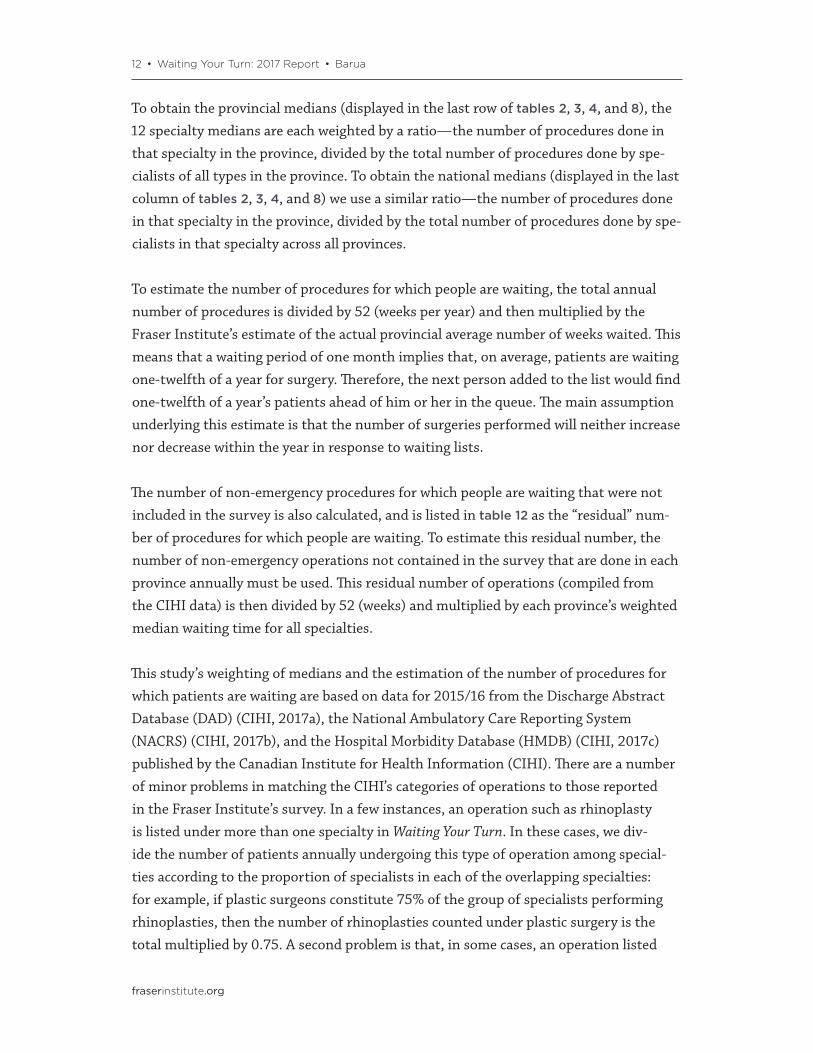
To obtain the provincial medians (displayed in the last row of tables 2, 3, 4, and 8), the 12 specialty medians are each weighted by a ratio—the number of procedures done in that specialty in the province, divided by the total number of procedures done by spe-cialists of all types in the province. To obtain the national medians (displayed in the last column of tables 2, 3, 4, and 8) we use a similar ratio—the number of procedures done in that specialty in the province, divided by the total number of procedures done by spe-cialists in that specialty across all provinces.
To estimate the number of procedures for which people are waiting, the total annual number of procedures is divided by 52 (weeks per year) and then multiplied by the Fraser Institute’s estimate of the actual provincial average number of weeks waited. This means that a waiting period of one month implies that, on average, patients are waiting one-twelfth of a year for surgery. Therefore, the next person added to the list would find one-twelfth of a year’s patients ahead of him or her in the queue. The main assumption underlying this estimate is that the number of surgeries performed will neither increase nor decrease within the year in response to waiting lists.
The number of non-emergency procedures for which people are waiting that were not included in the survey is also calculated, and is listed in table 12 as the “residual” num-ber of procedures for which people are waiting. To estimate this residual number, the number of non-emergency operations not contained in the survey that are done in each province annually must be used. This residual number of operations (compiled from the CIHI data) is then divided by 52 (weeks) and multiplied by each province’s weighted median waiting time for all specialties.
This study’s weighting of medians and the estimation of the number of procedures for which patients are waiting are based on data for 2015/16 from the Discharge Abstract Database (DAD) (CIHI, 2017a), the National Ambulatory Care Reporting System (NACRS) (CIHI, 2017b), and the Hospital Morbidity Database (HMDB) (CIHI, 2017c) published by the Canadian Institute for Health Information (CIHI). There are a number of minor problems in matching the CIHI’s categories of operations to those reported in the Fraser Institute’s survey. In a few instances, an operation such as rhinoplasty is listed under more than one specialty in Waiting Your Turn. In these cases, we div-ide the number of patients annually undergoing this type of operation among special-ties according to the proportion of specialists in each of the overlapping specialties: for example, if plastic surgeons constitute 75% of the group of specialists performing rhinoplasties, then the number of rhinoplasties counted under plastic surgery is the total multiplied by 0.75. A second problem is that, in some cases, an operation listed
Barua • Waiting Your Turn: 2017 Report • 13
fraserinstitute.org
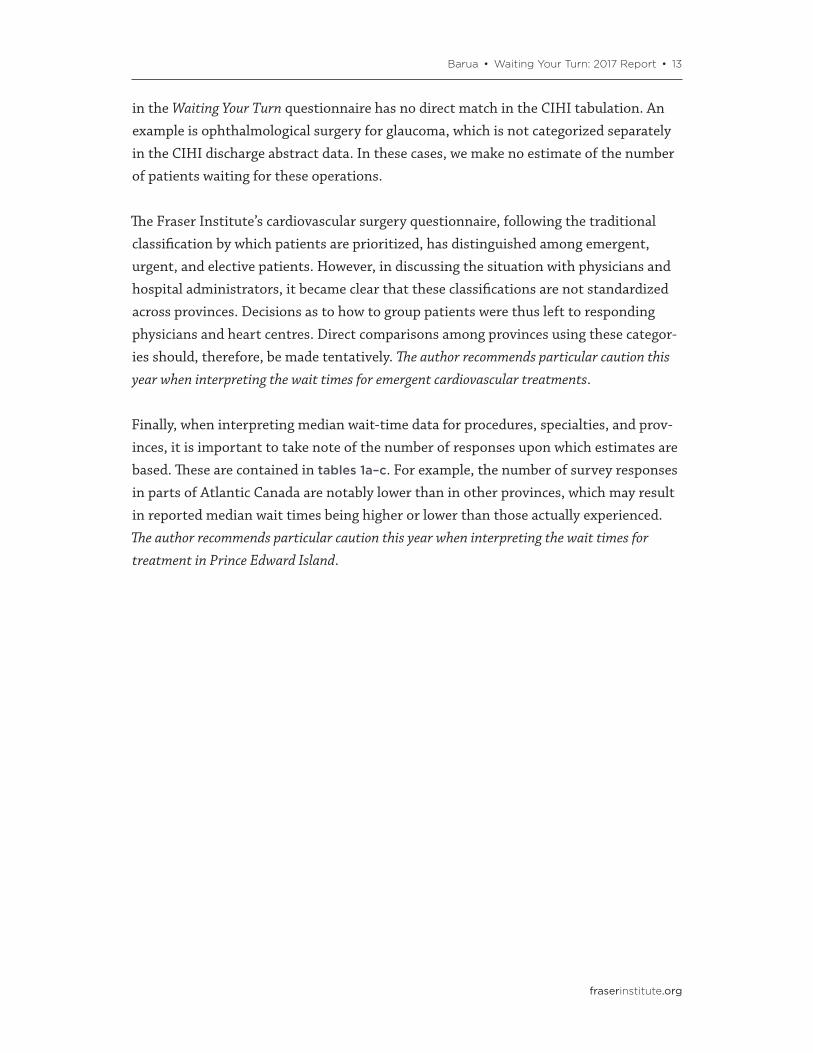
in the Waiting Your Turn questionnaire has no direct match in the CIHI tabulation. An example is ophthalmological surgery for glaucoma, which is not categorized separately in the CIHI discharge abstract data. In these cases, we make no estimate of the number of patients waiting for these operations.
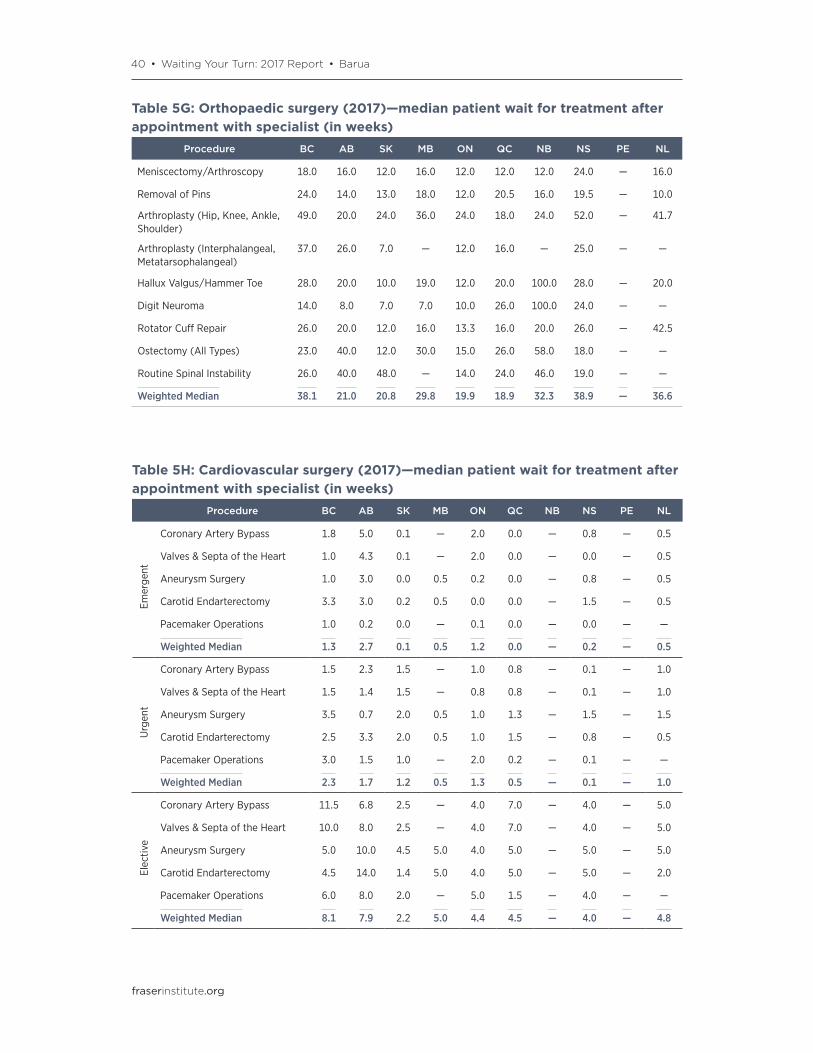
The Fraser Institute’s cardiovascular surgery questionnaire, following the traditional classification by which patients are prioritized, has distinguished among emergent, urgent, and elective patients. However, in discussing the situation with physicians and hospital administrators, it became clear that these classifications are not standardized across provinces. Decisions as to how to group patients were thus left to responding physicians and heart centres. Direct comparisons among provinces using these categor-ies should, therefore, be made tentatively. The author recommends particular caution this year when interpreting the wait times for emergent cardiovascular treatments.
Finally, when interpreting median wait-time data for procedures, specialties, and prov-inces, it is important to take note of the number of responses upon which estimates are based. These are contained in tables 1a–c. For example, the number of survey responses in parts of Atlantic Canada are notably lower than in other provinces, which may result in reported median wait times being higher or lower than those actually experienced. The author recommends particular caution this year when interpreting the wait times for treatment in Prince Edward Island.
14 • Waiting Your Turn: 2017 Report • Barua
fraserinstitute.org
Comparisons of Data from Other Sources
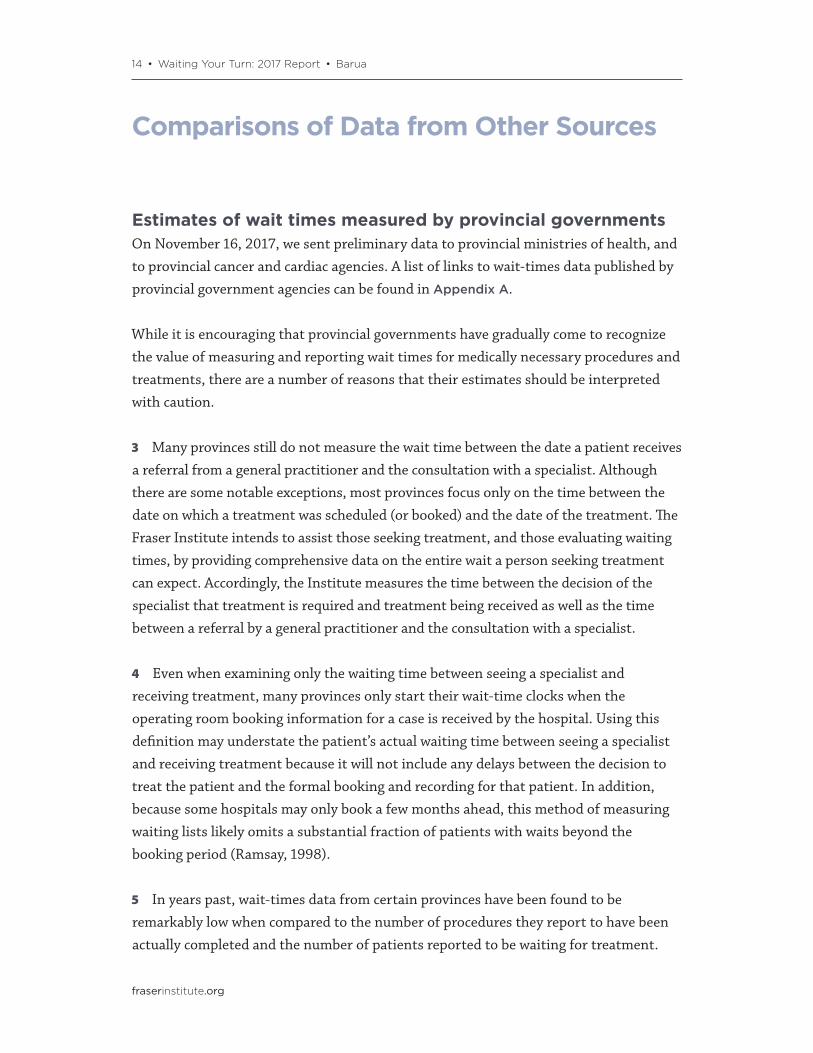
Estimates of wait times measured by provincial governmentsOn November 16, 2017, we sent preliminary data to provincial ministries of health, and to provincial cancer and cardiac agencies. A list of links to wait-times data published by provincial government agencies can be found in Appendix A.
While it is encouraging that provincial governments have gradually come to recognize the value of measuring and reporting wait times for medically necessary procedures and treatments, there are a number of reasons that their estimates should be interpreted with caution.
3 Many provinces still do not measure the wait time between the date a patient receives a referral from a general practitioner and the consultation with a specialist. Although there are some notable exceptions, most provinces focus only on the time between the date on which a treatment was scheduled (or booked) and the date of the treatment. The Fraser Institute intends to assist those seeking treatment, and those evaluating waiting times, by providing comprehensive data on the entire wait a person seeking treatment can expect. Accordingly, the Institute measures the time between the decision of the specialist that treatment is required and treatment being received as well as the time between a referral by a general practitioner and the consultation with a specialist.
4 Even when examining only the waiting time between seeing a specialist and receiving treatment, many provinces only start their wait-time clocks when the operating room booking information for a case is received by the hospital. Using this definition may understate the patient’s actual waiting time between seeing a specialist and receiving treatment because it will not include any delays between the decision to treat the patient and the formal booking and recording for that patient. In addition, because some hospitals may only book a few months ahead, this method of measuring waiting lists likely omits a substantial fraction of patients with waits beyond the booking period (Ramsay, 1998).
5 In years past, wait-times data from certain provinces have been found to be remarkably low when compared to the number of procedures they report to have been actually completed and the number of patients reported to be waiting for treatment.
Barua • Waiting Your Turn: 2017 Report • 15
fraserinstitute.org
Previous reports by the Fraser Institute (for example, Waiting Your Turn, 2009) have consistently demonstrated how, in those provinces, either there had to have been fewer people waiting or significantly more surgeries being completed, or the government’s reported wait time must have been incorrect.
6 Because of differences in the number of specialties and procedures included, as well as different definitions of how wait times are measured, estimates from provincial governments are usually not comparable among provinces or across time (usually only going back a few years). The Fraser Institute measures wait times for the same set of specialties across all provinces, employs a consistent methodology, and has published annual estimates for over two decades.
Comprehensive comparisons of wait time estimates from provincial governments with data from the Fraser Institute can be found in previous versions of Waiting Your Turn.
Verification and comparison of earlier data with independent sourcesThe waiting list data can be verified by comparison with independently computed esti-mates, primarily those found in academic journals. There exist 95 independent wait-ing-time estimates that can be compared with recent Fraser Institute’s figures. In 59 of the 95 cases, the Fraser Institute’s figures lie below the comparison values. In only 31 instances does the Institute value exceed the comparison value, and in five cases they are identical. This evidence strongly suggests that the Fraser Institute’s measurements are not biased upward but, if anything, may be biased downward, understating actual waiting times. (For further explanation, see Waiting Your Turn, 2009).
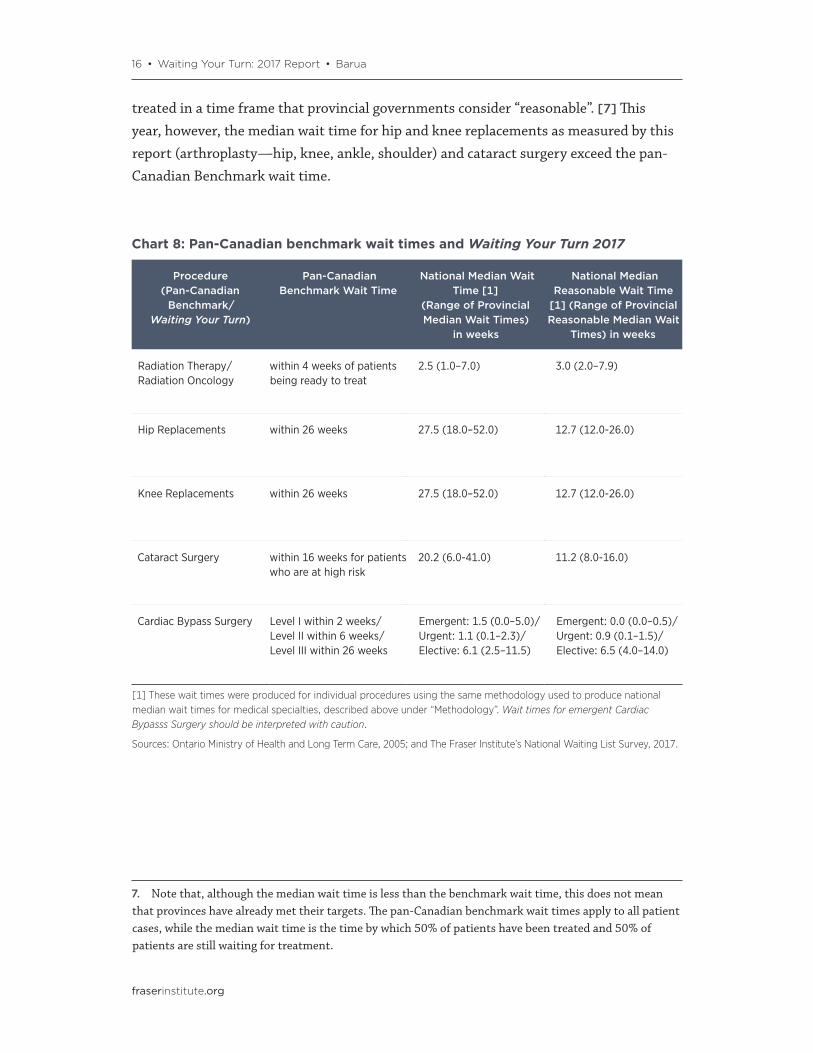
Pan-Canadian benchmarksCanada’s provincial, territorial, and federal governments agreed to a set of common benchmarks for medically necessary treatment on December 12, 2005 (Ontario Ministry of Health and Long Term Care, 2005). Chart 8 compares those benchmarks for which a similar comparator exists in Waiting Your Turn. Two observations arise from this com-parison. First, Canada’s physicians tend to have a lower threshold for reasonable wait times than do Canada’s provincial, territorial, and federal governments. Second, median wait times for radiation therapy and cardiac bypass surgery in many provinces are already within the benchmarks set by governments in Canada, which means that accord-ing to these benchmarks, more than 50% of patients in these provinces are already being
16 • Waiting Your Turn: 2017 Report • Barua
fraserinstitute.org
treated in a time frame that provincial governments consider “reasonable”. [7] This year, however, the median wait time for hip and knee replacements as measured by this report (arthroplasty—hip, knee, ankle, shoulder) and cataract surgery exceed the pan-Canadian Benchmark wait time.
7. Note that, although the median wait time is less than the benchmark wait time, this does not mean that provinces have already met their targets. The pan-Canadian benchmark wait times apply to all patient cases, while the median wait time is the time by which 50% of patients have been treated and 50% of patients are still waiting for treatment.
Chart 8: Pan-Canadian benchmark wait times and Waiting Your Turn 2017
Procedure (Pan-Canadian
Benchmark/ Waiting Your Turn)
Pan-Canadian Benchmark Wait Time
National Median Wait Time [1]
(Range of Provincial Median Wait Times)
in weeks
National Median Reasonable Wait Time
[1] (Range of Provincial Reasonable Median Wait
Times) in weeks
Radiation Therapy/ Radiation Oncology
within 4 weeks of patients being ready to treat
2.5 (1.0–7.0) 3.0 (2.0–7.9)
Hip Replacements within 26 weeks 27.5 (18.0–52.0) 12.7 (12.0-26.0)
Knee Replacements within 26 weeks 27.5 (18.0–52.0) 12.7 (12.0-26.0)
Cataract Surgery within 16 weeks for patients who are at high risk
20.2 (6.0-41.0) 11.2 (8.0-16.0)
Cardiac Bypass Surgery Level I within 2 weeks/ Level II within 6 weeks/ Level III within 26 weeks
Emergent: 1.5 (0.0–5.0)/Urgent: 1.1 (0.1–2.3)/Elective: 6.1 (2.5–11.5)
Emergent: 0.0 (0.0–0.5)/Urgent: 0.9 (0.1–1.5)/Elective: 6.5 (4.0–14.0)
[1] These wait times were produced for individual procedures using the same methodology used to produce national median wait times for medical specialties, described above under “Methodology”. Wait times for emergent Cardiac Bypasss Surgery should be interpreted with caution.
Sources: Ontario Ministry of Health and Long Term Care, 2005; and The Fraser Institute’s National Waiting List Survey, 2017.

Barua • Waiting Your Turn: 2017 Report • 17
fraserinstitute.org
Conclusion
The 2017 Waiting Your Turn survey indicates that, at 21.2 weeks, the total waiting time for elective, medically necessary, treatment across the provinces is the longest ever recorded in the history of this survey. Even if one debates the reliability of waiting-list data, this survey also reveals that wait times in Canada are longer than what physicians consider to be clinically reasonable.
From the standpoint of the Canadian economy, a study by Stokes and Somerville (2008) found that the cumulative total lost economic output that represents the cost of waiting longer than medically recommended for treatment for total joint replacement surgery, cataract surgery, coronary artery bypass graft surgery, and MRI scans in 2007 was an estimated $14.8 billion. More recently, Barua and Ren (2017) estimated the cost of wait-ing per patient in Canada to be approximately $1,759 in 2016 if only hours during the normal working week were considered “lost”, and as much as $5,360 if all hours of the week (excluding eight hours of sleep per night) were considered “lost”.
Further, there is a significant body of medical literature identifying adverse medical con-sequences from prolonged waiting (Waiting Your Turn, 2009; Day, 2013).
This year’s survey of specialists also found that an estimated 1.3% of patients received elective treatment in another country during 2016/17. Physicians also report that only about 11.5% of their patients are on a waiting list because they requested a delay or postponement, and that 46.3% would agree to have their procedure performed within a week [8] if an opening arose.
Thus, despite provincial strategies to reduce wait times and high levels of expenditure on health care, it is clear that patients in Canada are waiting too long to receive treatment.
8. The survey asks physicians what percentage of their patients currently waiting for treatment would agree to begin treatment tomorrow if an opening were to arise. However, comments by respondents of previous surveys indicate that at least some respondents answer the question as if it were “a few days”.
18 • Waiting Your Turn: 2017 Report • Barua
fraserinstitute.org
Selected graphs
Graphs 1–6: Median actual waiting times, 1993 and 2017
Graphs 7–8: Median reasonable waiting times, 1994 and 2017
Graphs 9–19: Actual versus reasonable waiting times, 1994 to 2017, by province

Barua • Waiting Your Turn: 2017 Report • 19
fraserinstitute.org
0 5 10 15 20 25 30
Canada
Newfoundland & Labrador
Prince Edward Island
Nova Scotia
New Brunswick
Quebec
Ontario
Manitoba
Saskatchewan
Alberta
British Columbia 3.3
3.6
3.1
4.1
4.3
2.9
4.1
4.9
5.2
3.1
3.7
12.5
12.0
9.7
8.6
6.7
11.4
26.6
21.6
21.0
12.8
10.2
Weeks waited
Source: The Fraser Institute’s national waiting list survey, 2017; Waiting Your Turn, 1997.
Graph 1: Median wait between referral by GP and appointment with
specialist, by province, 1993 and 2017
20171993
20 • Waiting Your Turn: 2017 Report • Barua
fraserinstitute.org
0 5 10 15 20 25
Weighted Median
Medical Oncology
Radiation Oncology
Internal Medicine
Urology
Cardiovascular Surgery
Orthopaedic Surgery
Neurosurgery
General Surgery
Otolaryngology
Ophthalmology
Gynaecology
Plastic Surgery 5.9
3.113.2
4.513.4
3.19.1
2.06.3
6.722.1
8.117.9
3.46.4
2.17.1
1.91.4
1.62.0
3.710.2
Weeks waited
Graph 2: Median wait between referral by GP and appointment
with specialist, by specialty, 1993 and 2017
4.29.0
14.1
Source: The Fraser Institute’s national waiting list survey, 2017; Waiting Your Turn, 1997.
20171993

Barua • Waiting Your Turn: 2017 Report • 21
fraserinstitute.org
0 5 10 15 20
Canada
Newfoundland & Labrador
Prince Edward Island
Nova Scotia
New Brunswick
Quebec
Ontario
Manitoba
Saskatchewan
Alberta
British Columbia 7.1
6.9
6.7
6.4
4.9
4.4
8.2
6.6
11.9
7.5
5.6
14.1
14.4
10.1
16.3
8.6
9.2
15.1
16.1
11.4
8.7
10.9
Weeks waited
Graph 3: Median wait between appointment with specialist and
treatment, by province, 1993 and 2017
Source: The Fraser Institute’s national waiting list survey, 2017; Waiting Your Turn, 1997.
20171993
22 • Waiting Your Turn: 2017 Report • Barua
fraserinstitute.org
0 5 10 15 20 25
Weighted Median
Medical Oncology
Radiation Oncology
Internal Medicine
Urology
Cardiovascular Surg. (Elect.)
Cardiovascular Surg. (Urg.)
Orthopaedic Surgery
Neurosurgery
General Surgery
Otolaryngology
Ophthalmology
Gynaecology
Plastic Surgery 8.4
5.79.3
10.118.0
7.111.6
3.86.8
6.210.8
11.423.8
2.71.2
4.85.6
2.38.4
3.42.5
0.91.2
5.6
Weeks waited
Graph 4: Median wait between appointment with specialist and
treatment, by specialty, 1993 and 2017
9.85.3
12.4
Source: The Fraser Institute’s national waiting list survey, 2017; Waiting Your Turn, 1997.
20171993
10.9
Barua • Waiting Your Turn: 2017 Report • 23
fraserinstitute.org
0 10 20 30 40 50
Canada
Newfoundland & Labrador
Prince Edward Island
Nova Scotia
New Brunswick
Quebec
Ontario
Manitoba
Saskatchewan
Alberta
British Columbia10.4
10.5
9.8
10.5
9.1
7.3
12.3
11.5
17.1
10.6
9.3
26.6
26.5
19.8
24.9
15.4
20.6
41.7
37.7
32.4
21.5
21.2
Weeks waited
Graph 5: Median wait between referral by GP and treatment, by
province, 1993 and 2017
Source: The Fraser Institute’s national waiting list survey, 2017; Waiting Your Turn, 1997.20171993
24 • Waiting Your Turn: 2017 Report • Barua
fraserinstitute.org
0 10 20 30 40 50
Weighted Median
Medical Oncology
Radiation Oncology
Internal Medicine
Urology
Cardiovascular Surg. (elect.)
Orthopaedic Surgery
Neurosurgery
General Surgery
Otolaryngology
Ophthalmology
Gynaecology
Plastic Surgery14.2
8.822.5
14.631.4
10.220.7
5.813.1
12.932.9
19.541.7
13.211.7
4.415.6
5.33.9
2.53.2
9.321.2
Weeks waited
Graph 6: Median wait between referral by GP and treatment,
by specialty, 1993 and 2017
9.014.6
26.5
Source: The Fraser Institute’s national waiting list survey, 2017; Waiting Your Turn, 1997.20171993
Barua • Waiting Your Turn: 2017 Report • 25
fraserinstitute.org
0 3 6 9 12
Canada
Newfoundland & Labrador
Prince Edward Island
Nova Scotia
New Brunswick
Quebec
Ontario
Manitoba
Saskatchewan
Alberta
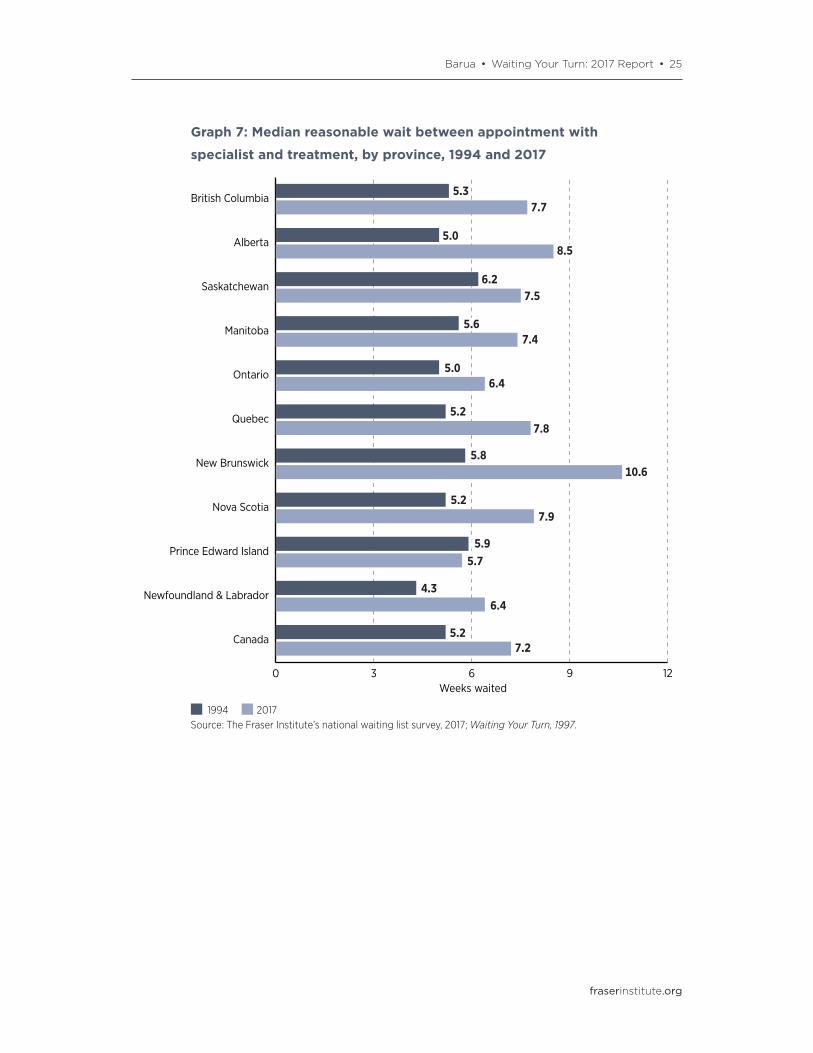
British Columbia5.3
5.0
6.2
5.6
5.0
5.2
5.8
5.2
5.9
4.3
5.2
7.7
8.5
7.5
7.4
6.4
7.8
10.6
7.9
5.7
6.4
7.2
Weeks waited
Graph 7: Median reasonable wait between appointment with
specialist and treatment, by province, 1994 and 2017
Source: The Fraser Institute’s national waiting list survey, 2017; Waiting Your Turn, 1997.20171994

26 • Waiting Your Turn: 2017 Report • Barua
fraserinstitute.org
0 5 10 15 20 25
Weighted Median
Medical Oncology
Radiation Oncology
Internal Medicine
Urology
Cardiovascular Surg. (Elect.)
Cardiovascular Surg. (Urg.)
Orthopaedic Surgery
Neurosurgery
General Surgery
Otolaryngology
Ophthalmology
Gynaecology
Plastic Surgery6.3
4.57.6
5.410.4
5.210.3
3.25.8
3.46.5
7.312.0
6.01.0
3.34.8
1.93.8
2.03.0
0.92.0
5.27.2
Weeks waited
Graph 8: Median reasonable wait between appointment with
specialist and treatment, by specialty, 1994 and 2017
24.05.8
13.8
Source: The Fraser Institute’s national waiting list survey, 2017; Waiting Your Turn, 1997.20171994
Barua • Waiting Your Turn: 2017 Report • 27
fraserinstitute.org
0
3
6
9
12
15
20172016
20152014
20132012
20112010
20092008
20072006
20052004
20032001/02
2000/011999
19981997
19961995
1994
18.2
Wee
ks w
aite
d
Source: The Fraser Institute’s national waiting list surveys, 1995–2017.
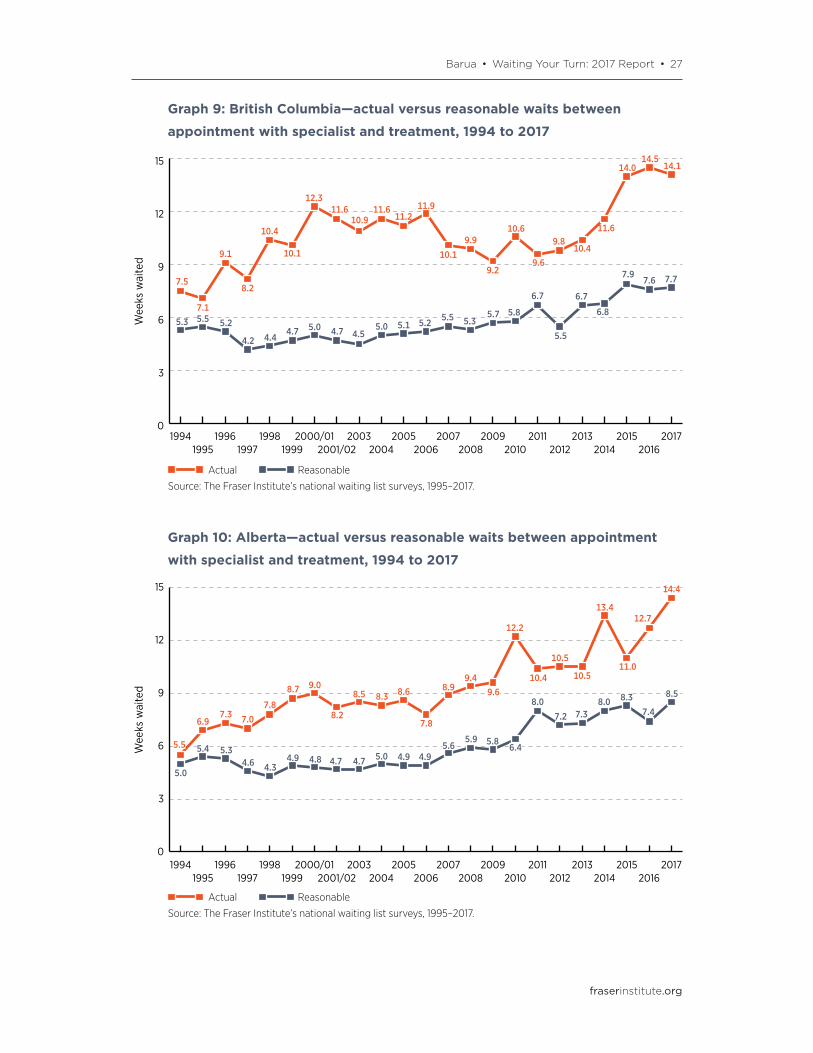
Graph 9: British Columbia—actual versus reasonable waits between
appointment with specialist and treatment, 1994 to 2017
ReasonableActual
5.3 5.5
7.5
7.1
9.1
10.4
10.1
12.311.6
10.911.6
11.211.9
10.1
9.9
9.2
10.6
9.6
9.810.4
11.6
14.014.5
14.1
8.2
5.2
4.44.7 5.0 4.7 4.5
5.0 5.1 5.2 5.5 5.35.7 5.8
6.7
5.5
6.7
6.8
7.97.6 7.7
4.2
0
3
6
9
12
15
20172016
20152014
20132012
20112010
20092008
20072006
20052004
20032001/02
2000/011999
19981997
19961995
1994
18.2
Wee
ks w
aite
d
Source: The Fraser Institute’s national waiting list surveys, 1995–2017.
Graph 10: Alberta—actual versus reasonable waits between appointment
with specialist and treatment, 1994 to 2017
ReasonableActual
5.0
5.45.5
6.97.3
7.8
8.7 9.0
8.2
8.5 8.3 8.6
7.8
8.99.4
9.6
12.2
10.4
10.5
10.5
13.4
11.0
12.7
14.4
7.0
5.3
4.34.9 4.8 4.7 4.7 5.0 4.9 4.9
5.65.9 5.8
6.4
8.0
7.2 7.38.0 8.3
7.4
8.5
4.6
28 • Waiting Your Turn: 2017 Report • Barua
fraserinstitute.org
0
6
12
18
24
30
20172016
20152014
20132012
20112010
20092008
20072006
20052004
20032001/02
2000/011999
19981997
19961995
1994
Wee
ks w
aite
d
Source: The Fraser Institute’s national waiting list surveys, 1995–2017.
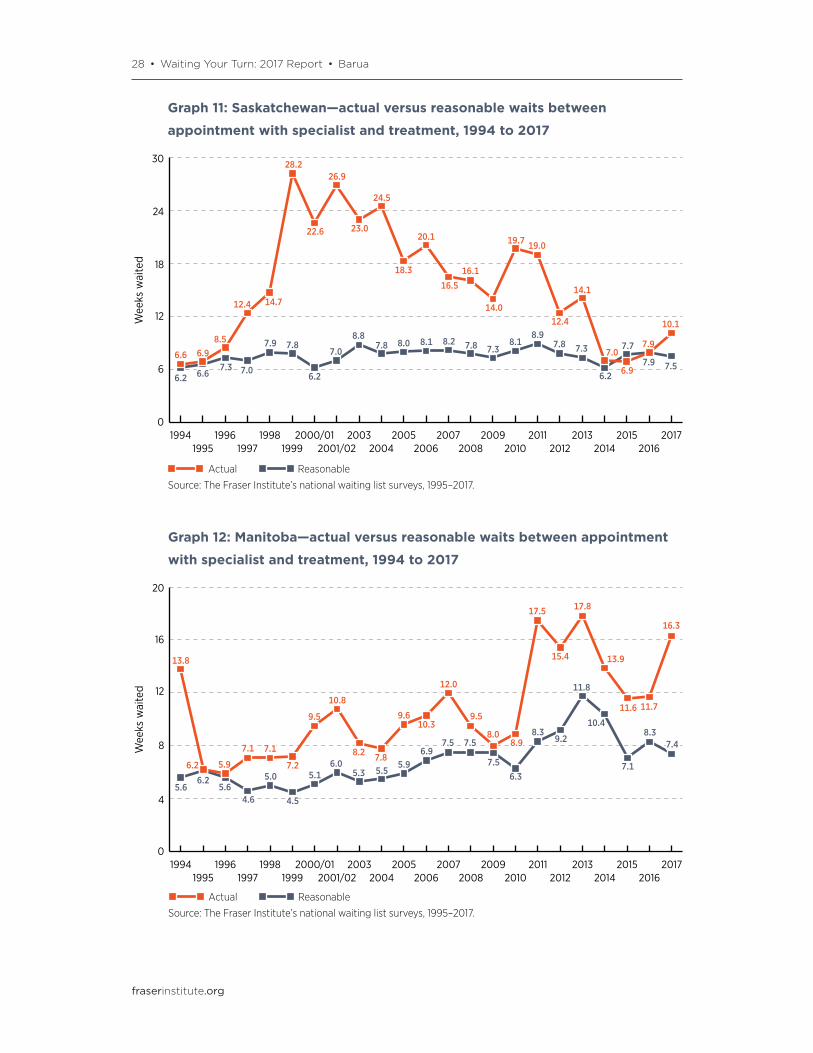
Graph 11: Saskatchewan—actual versus reasonable waits between
appointment with specialist and treatment, 1994 to 2017
6.2 6.6
6.6 6.98.5
14.7
28.2
22.6
26.9
23.0
24.5
18.3
20.1
16.5
16.1
14.0
19.7 19.0
12.4
14.1
7.0
6.9
7.9
10.1
12.4
7.3
7.9 7.8
6.2
7.0
8.87.8 8.0 8.1 8.2 7.8 7.3
8.18.9
7.8 7.3
6.2
7.7
7.9 7.57.0
18.2ReasonableActual
0
4
8
12
16
20
20172016
20152014
20132012
20112010
20092008
20072006
20052004
20032001/02
2000/011999
19981997
19961995
1994
18.2
Wee
ks w
aite
d
Source: The Fraser Institute’s national waiting list surveys, 1995–2017.
Graph 12: Manitoba—actual versus reasonable waits between appointment
with specialist and treatment, 1994 to 2017
ReasonableActual
5.66.2
13.8
6.2 5.9
7.1
7.2
9.5
10.8
8.2 7.8
9.610.3
12.0
9.5
8.08.9
17.5
15.4
17.8
13.9
7.1
5.65.0
4.5
5.16.0
5.3 5.55.9
6.97.5 7.5
7.56.3
8.39.2
11.8
10.4
4.6
7.1
8.37.4
11.6 11.7
16.3
Barua • Waiting Your Turn: 2017 Report • 29
fraserinstitute.org
0
2
4
6
8
10
20172016
20152014
20132012
20112010
20092008
20072006
20052004
20032001/02
2000/011999
19981997
19961995
1994
18.2
Wee
ks w
aite
d
Source: The Fraser Institute’s national waiting list surveys, 1995–2017.
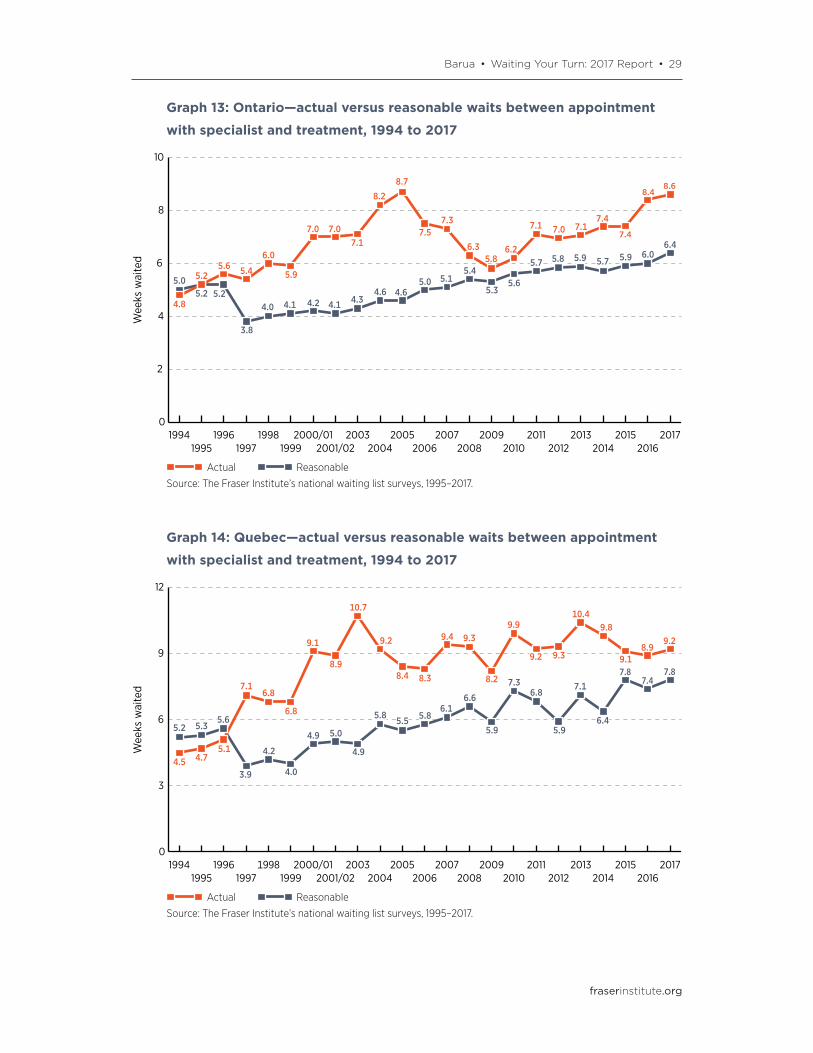
Graph 13: Ontario—actual versus reasonable waits between appointment
with specialist and treatment, 1994 to 2017
ReasonableActual
5.05.2
4.8
5.25.6
6.0
5.9
7.0 7.07.1
8.2
8.7
7.57.3
6.35.8
6.2
7.1 7.0 7.17.4
7.4
8.48.6
5.4
5.24.0 4.1 4.2 4.1 4.3
4.6 4.65.0 5.1
5.4
5.35.6
5.7 5.8 5.9 5.7 5.9 6.06.4
3.8
0
3
6
9
12
20172016
20152014
20132012
20112010
20092008
20072006
20052004
20032001/02
2000/011999
19981997
19961995
1994
18.2
Wee
ks w
aite
d
Source: The Fraser Institute’s national waiting list surveys, 1995–2017.
Graph 14: Quebec—actual versus reasonable waits between appointment
with specialist and treatment, 1994 to 2017
ReasonableActual
5.2 5.3
4.5 4.75.1
6.8
6.8
9.1
8.9
10.7
9.2
8.4 8.3
9.4 9.3
8.2
9.9
9.2 9.3
10.49.8
9.18.9
9.2
7.1
5.6
4.2
4.0
4.9 5.0
4.9
5.8 5.5 5.86.1
6.6
5.9
7.36.8
5.9
7.17.8
7.47.8
6.4
3.9

30 • Waiting Your Turn: 2017 Report • Barua
fraserinstitute.org
0
4
8
12
16
20
20172016
20152014
20132012
20112010
20092008
20072006
20052004
20032001/02
2000/011999
19981997
19961995
1994
18.2
Wee
ks w
aite
d
Source: The Fraser Institute’s national waiting list surveys, 1995–2017.
Graph 15: New Brunswick—actual versus reasonable waits between
appointment with specialist and treatment, 1994 to 2017
ReasonableActual
5.8 5.4
7.8 7.5 7.16.2
7.7
9.6 9.5
9.3
10.911.6
11.1
10.5
11.1 11.4
9.0
10.9
12.5
17.4
15.1
17.4
11.710.9
6.9
5.65.1
5.9 6.0 5.8 5.8 5.8
7.0 7.38.1 8.1
8.6
7.7 7.4
9.5 9.3
8.6
9.4 9.4
10.6
5.7
0
4
8
12
16
20
20172016
20152014
20132012
20112010
20092008
20072006
20052004
20032001/02
2000/011999
19981997
19961995
1994
18.2
Wee
ks w
aite
d
Source: The Fraser Institute’s national waiting list surveys, 1995–2017.
Graph 16: Nova Scotia—actual versus reasonable waits between
appointment with specialist and treatment, 1994 to 2017
ReasonableActual
5.2 5.3
8.1
6.25.7 5.6
6.5
7.8
9.4
10.6
8.9
11.1
11.3
13.7
15.4
10.9
15.5
15.7
17.6
13.7
16.4
12.9
17.7
16.1
6.0
5.0
3.6
5.4
5.2 4.9 5.2
5.3
7.4 7.66.8 7.2
6.6
8.6 8.4 8.2 8.3 7.98.4
11.3
7.9
4.8

Barua • Waiting Your Turn: 2017 Report • 31
fraserinstitute.org
0
5
10
15
20
25
20172016
20152014
20132012
20112010
20092008
20072006
20052004
20032001/02
2000/011999
19981997
19961995
1994
18.2
Wee
ks w
aite
d
Source: The Fraser Institute’s national waiting list surveys, 1995–2017.
Graph 17: Prince Edward Island—actual versus reasonable waits between
appointment with specialist and treatment, 1994 to 2017
ReasonableActual
5.9
6.3
13.9
9.4
6.55.2
10.3
8.77.9
11.1
15.7
10.7
14.0
11.9
13.2
12.2
22.4
12.3 12.4
15.3
17.6
7.3
4.1 3.8
5.1 4.6 4.3 4.8
6.2 6.35.6
5.1
6.8
6.6
9.9
7.7
8.1
7.7
14.2
5.4
11.2
6.95.7
14.9
10.5
11.4
0
4
8
12
16
20
24
20172016
20152014
20132012
20112010
20092008
20072006
20052004
20032001/02
2000/011999
19981997
19961995
1994
18.2
Wee
ks w
aite
d
Source: The Fraser Institute’s national waiting list surveys, 1995–2017.
Graph 18: Newfoundland & Labrador—actual versus reasonable waits
between appointment with specialist and treatment, 1994 to 2017
ReasonableActual
4.3 4.7
5.1 5.46.1
8.9
12.3
8.0
8.9 9.2 8.99.4
8.1
10.611.1
13.214.4
11.4
11.8
9.6
14.2
20.5
11.5
8.77.9
4.23.3
4.0 4.35.7
4.3 4.24.8 5.0 5.2 5.6
4.65.3 5.6
6.7 8.07.1
7.4
5.26.4
4.0

32 • Waiting Your Turn: 2017 Report • Barua
fraserinstitute.org
0
3
6
9
12
20172016
20152014
20132012
20112010
20092008
20072006
20052004
20032001/02
2000/011999
19981997
19961995
1994
18.2
Wee
ks w
aite
d
Source: The Fraser Institute’s national waiting list surveys, 1995–2017.
Graph 19: Canada—actual versus reasonable waits between appointment
with specialist and treatment, 1994 to 2017
ReasonableActual
5.2 5.4
5.8 5.76.2
7.3
8.2
9.0 9.29.5 9.5 9.4
9.0 9.18.7
8.0
9.3 9.59.3
9.6 9.8
6.8
5.4
4.3 4.5 4.74.7 4.85.2 5.2
5.55.8 6.0 5.8
6.46.7
6.26.8
6.57.1 7.0 7.2
4.2
9.8
10.610.9
Barua • Waiting Your Turn: 2017 Report • 33
fraserinstitute.org
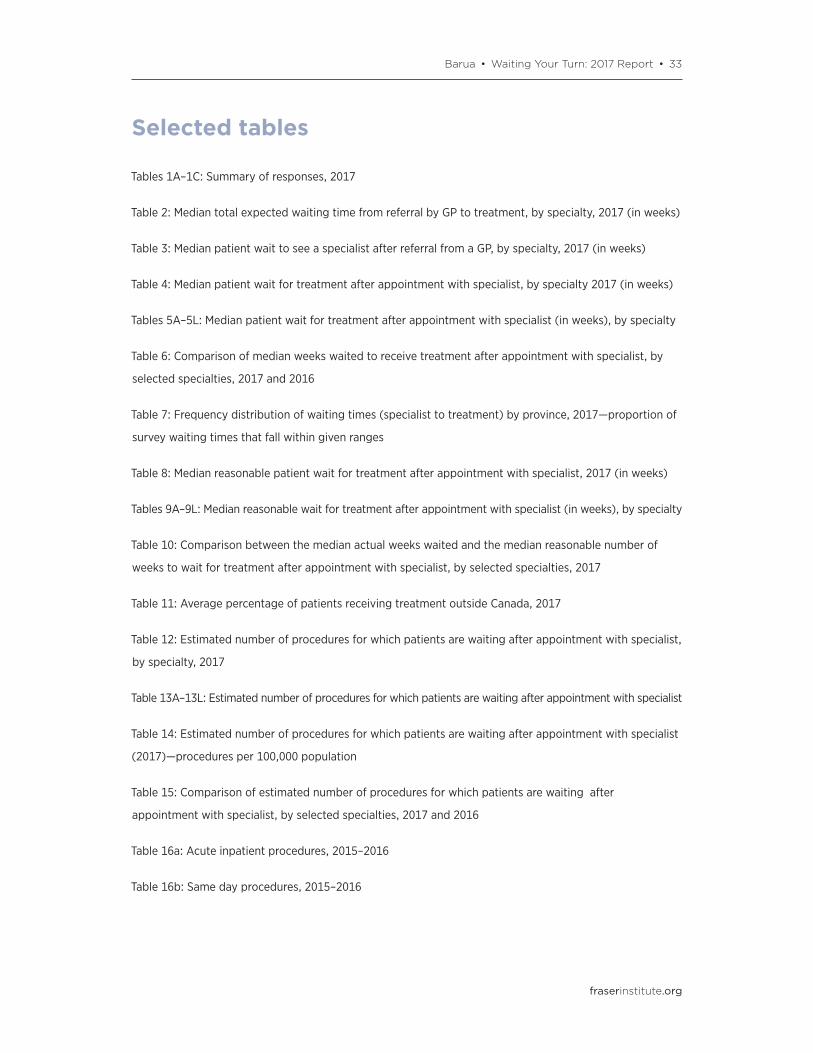
Selected tables
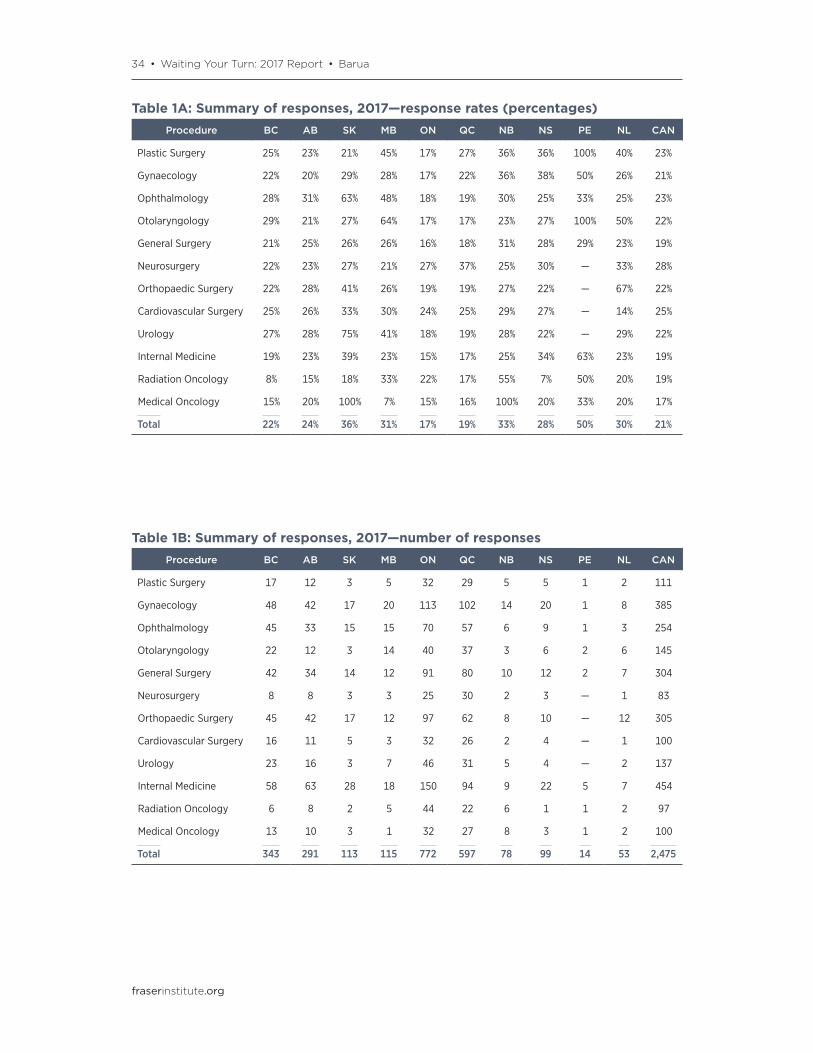
Tables 1A–1C: Summary of responses, 2017
Table 2: Median total expected waiting time from referral by GP to treatment, by specialty, 2017 (in weeks)
Table 3: Median patient wait to see a specialist after referral from a GP, by specialty, 2017 (in weeks)
Table 4: Median patient wait for treatment after appointment with specialist, by specialty 2017 (in weeks)
Tables 5A–5L: Median patient wait for treatment after appointment with specialist (in weeks), by specialty
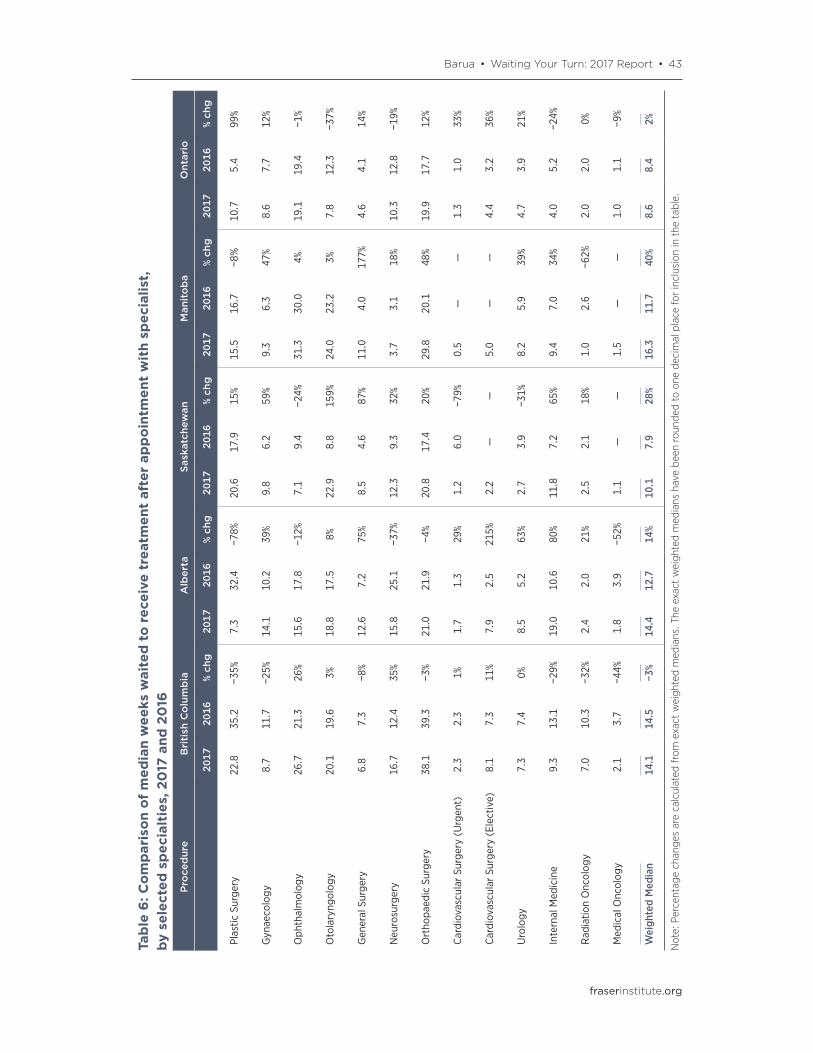
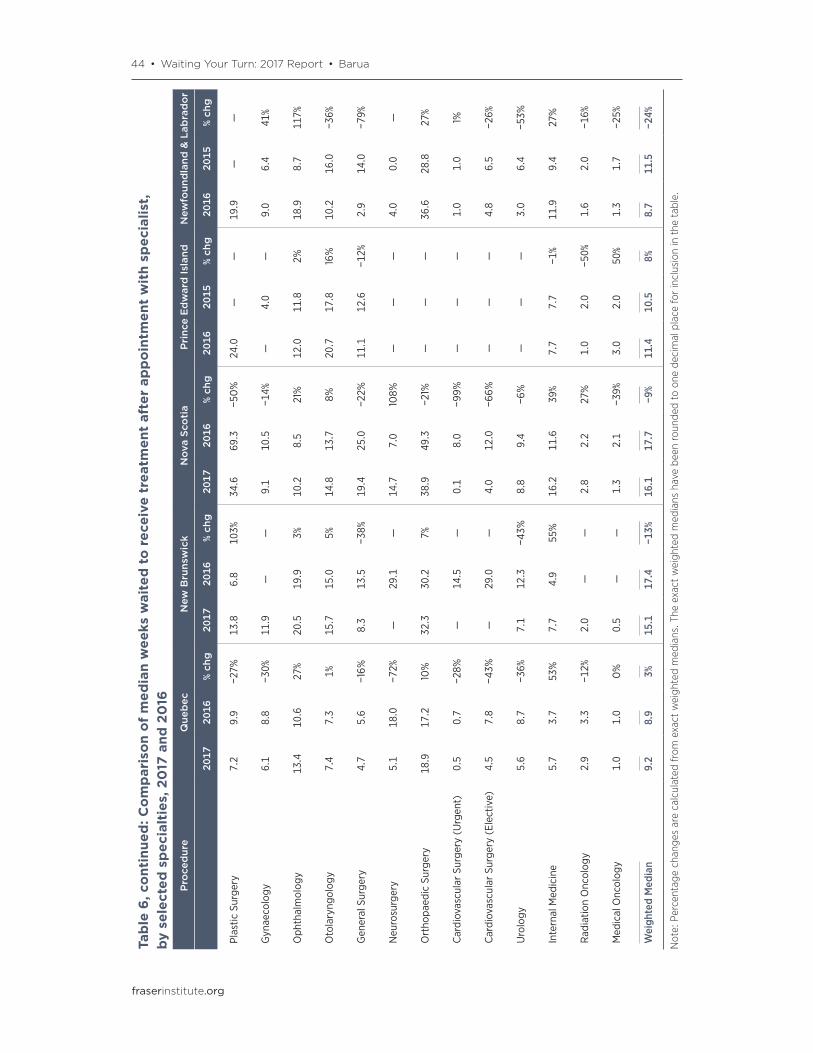
Table 6: Comparison of median weeks waited to receive treatment after appointment with specialist, by
selected specialties, 2017 and 2016
Table 7: Frequency distribution of waiting times (specialist to treatment) by province, 2017—proportion of
survey waiting times that fall within given ranges
Table 8: Median reasonable patient wait for treatment after appointment with specialist, 2017 (in weeks)
Tables 9A–9L: Median reasonable wait for treatment after appointment with specialist (in weeks), by specialty
Table 10: Comparison between the median actual weeks waited and the median reasonable number of
weeks to wait for treatment after appointment with specialist, by selected specialties, 2017
Table 11: Average percentage of patients receiving treatment outside Canada, 2017
Table 12: Estimated number of procedures for which patients are waiting after appointment with specialist,
by specialty, 2017
Table 13A–13L: Estimated number of procedures for which patients are waiting after appointment with specialist
Table 14: Estimated number of procedures for which patients are waiting after appointment with specialist
(2017)—procedures per 100,000 population
Table 15: Comparison of estimated number of procedures for which patients are waiting after
appointment with specialist, by selected specialties, 2017 and 2016
Table 16a: Acute inpatient procedures, 2015–2016
Table 16b: Same day procedures, 2015–2016
34 • Waiting Your Turn: 2017 Report • Barua
fraserinstitute.org
Table 1A: Summary of responses, 2017—response rates (percentages)Procedure BC AB SK MB ON QC NB NS PE NL CAN
Plastic Surgery 25% 23% 21% 45% 17% 27% 36% 36% 100% 40% 23%
Gynaecology 22% 20% 29% 28% 17% 22% 36% 38% 50% 26% 21%
Ophthalmology 28% 31% 63% 48% 18% 19% 30% 25% 33% 25% 23%
Otolaryngology 29% 21% 27% 64% 17% 17% 23% 27% 100% 50% 22%
General Surgery 21% 25% 26% 26% 16% 18% 31% 28% 29% 23% 19%
Neurosurgery 22% 23% 27% 21% 27% 37% 25% 30% — 33% 28%
Orthopaedic Surgery 22% 28% 41% 26% 19% 19% 27% 22% — 67% 22%
Cardiovascular Surgery 25% 26% 33% 30% 24% 25% 29% 27% — 14% 25%
Urology 27% 28% 75% 41% 18% 19% 28% 22% — 29% 22%
Internal Medicine 19% 23% 39% 23% 15% 17% 25% 34% 63% 23% 19%
Radiation Oncology 8% 15% 18% 33% 22% 17% 55% 7% 50% 20% 19%
Medical Oncology 15% 20% 100% 7% 15% 16% 100% 20% 33% 20% 17%
Total 22% 24% 36% 31% 17% 19% 33% 28% 50% 30% 21%
Table 1B: Summary of responses, 2017—number of responsesProcedure BC AB SK MB ON QC NB NS PE NL CAN
Plastic Surgery 17 12 3 5 32 29 5 5 1 2 111
Gynaecology 48 42 17 20 113 102 14 20 1 8 385
Ophthalmology 45 33 15 15 70 57 6 9 1 3 254
Otolaryngology 22 12 3 14 40 37 3 6 2 6 145
General Surgery 42 34 14 12 91 80 10 12 2 7 304
Neurosurgery 8 8 3 3 25 30 2 3 — 1 83
Orthopaedic Surgery 45 42 17 12 97 62 8 10 — 12 305
Cardiovascular Surgery 16 11 5 3 32 26 2 4 — 1 100
Urology 23 16 3 7 46 31 5 4 — 2 137
Internal Medicine 58 63 28 18 150 94 9 22 5 7 454
Radiation Oncology 6 8 2 5 44 22 6 1 1 2 97
Medical Oncology 13 10 3 1 32 27 8 3 1 2 100
Total 343 291 113 115 772 597 78 99 14 53 2,475

Barua • Waiting Your Turn: 2017 Report • 35
fraserinstitute.org
Table 1C: Summary of responses, 2017—number of questionnaires mailed outProcedure BC AB SK MB ON QC NB NS PE NL CAN
Plastic Surgery 68 53 14 11 193 106 14 14 1 5 479
Gynaecology 215 206 58 72 684 473 39 52 2 31 1,832
Ophthalmology 162 107 24 31 399 308 20 36 3 12 1,102
Otolaryngology 76 56 11 22 236 221 13 22 2 12 671
General Surgery 204 137 53 47 577 446 32 43 7 30 1,576
Neurosurgery 37 35 11 14 94 81 8 10 — 3 293
Orthopaedic Surgery 205 149 41 47 522 333 30 46 — 18 1,391
Cardiovascular Surgery 65 43 15 10 135 105 7 15 — 7 402
Urology 86 57 4 17 250 164 18 18 — 7 621
Internal Medicine 298 277 72 77 1,006 542 36 65 8 30 2,411
Radiation Oncology 71 53 11 15 199 130 11 14 2 10 516
Medical Oncology 89 49 3 14 214 173 8 15 3 10 578
Total 1,576 1,222 317 377 4,509 3,082 236 350 28 175 11,872
Table 2: Median total expected waiting time from referral by GP to treatment, by specialty, 2017 (in weeks)
Procedure BC AB SK MB ON QC NB NS PE NL CAN
Plastic Surgery 38.8 18.3 40.6 27.5 22.7 15.7 57.8 107.8 28.0 27.6 26.5
Gynaecology 20.7 32.1 17.3 16.3 18.6 14.6 77.4 27.1 — 20.0 22.5
Ophthalmology 38.7 22.6 13.1 43.3 27.1 34.4 30.5 40.2 42.0 63.9 31.4
Otolaryngology 33.1 30.8 24.4 33.0 15.8 14.9 40.7 26.8 47.7 15.2 20.7
General Surgery 18.8 21.1 13.5 16.0 8.6 7.2 20.3 31.4 15.1 6.9 13.1
Neurosurgery 64.7 43.5 27.4 11.7 21.8 11.1 — 62.2 — 56.0 32.9
Orthopaedic Surgery 66.1 45.0 32.8 53.8 31.9 30.9 68.3 90.9 — 48.6 41.7
Cardiovascular Surg. (Elec.) 12.8 9.9 4.2 8.5 8.1 14.5 — 16.0 — 8.8 11.7
Urology 16.8 25.0 14.7 16.2 11.7 16.6 31.1 16.8 — 6.8 14.6
Internal Medicine 14.3 27.0 35.8 13.4 8.0 12.7 13.7 36.2 32.7 33.9 15.6
Radiation Oncology 14.5 4.9 4.2 — 3.0 4.2 — — 3.0 3.1 3.9
Medical Oncology 4.6 4.3 4.1 — 3.0 2.5 2.5 3.3 6.0 3.0 3.2
Weighted Median 26.6 26.5 19.8 24.9 15.4 20.6 41.7 37.7 32.4 21.5 21.2
* Totals may not equal the sum of subtotals as a result of rounding.

36 • Waiting Your Turn: 2017 Report • Barua
fraserinstitute.org
Table 3: Median patient wait to see a specialist after referral from a GP, by specialty, 2017 (in weeks)
Procedure BC AB SK MB ON QC NB NS PE NL CAN
Plastic Surgery 16.0 11.0 20.0 12.0 12.0 8.5 44.0 73.3 4.0 7.8 14.1
Gynaecology 12.0 18.0 7.5 7.0 10.0 8.5 65.5 18.0 78.0 11.0 13.2
Ophthalmology 12.0 7.0 6.0 12.0 8.0 21.0 10.0 30.0 30.0 45.0 13.4
Otolaryngology 13.0 12.0 1.5 9.0 8.0 7.5 25.0 12.0 27.0 5.0 9.1
General Surgery 12.0 8.5 5.0 5.0 4.0 2.5 12.0 12.0 4.0 4.0 6.3
Neurosurgery 48.0 27.8 15.0 8.0 11.5 6.0 152.0 47.5 — 52.0 22.1
Orthopaedic Surgery 28.0 24.0 12.0 24.0 12.0 12.0 36.0 52.0 — 12.0 17.9
Cardiovascular Surgery 4.8 2.0 2.0 3.5 3.8 10.0 30.0 12.0 — 4.0 6.4
Urology 9.5 16.5 12.0 8.0 7.0 11.0 24.0 8.0 — 3.8 9.0
Internal Medicine 5.0 8.0 24.0 4.0 4.0 7.0 6.0 20.0 25.0 22.0 7.1
Radiation Oncology 7.5 2.5 1.8 — 1.0 1.3 — — 2.0 1.5 1.4
Medical Oncology 2.5 2.5 3.1 — 2.0 1.5 2.0 2.0 3.0 1.8 2.0
Weighted Median 12.5 12.0 9.7 8.6 6.7 11.4 26.6 21.6 21.0 12.8 10.2
Table 4: Median patient wait for treatment after appointment with specialist, by specialty, 2017 (in weeks)
Procedure BC AB SK MB ON QC NB NS PE NL CAN
Plastic Surgery 22.8 7.3 20.6 15.5 10.7 7.2 13.8 34.6 24.0 19.9 12.4
Gynaecology 8.7 14.1 9.8 9.3 8.6 6.1 11.9 9.1 — 9.0 9.3
Ophthalmology 26.7 15.6 7.1 31.3 19.1 13.4 20.5 10.2 12.0 18.9 18.0
Otolaryngology 20.1 18.8 22.9 24.0 7.8 7.4 15.7 14.8 20.7 10.2 11.6
General Surgery 6.8 12.6 8.5 11.0 4.6 4.7 8.3 19.4 11.1 2.9 6.8
Neurosurgery 16.7 15.8 12.3 3.7 10.3 5.1 — 14.7 — 4.0 10.8
Orthopaedic Surgery 38.1 21.0 20.8 29.8 19.9 18.9 32.3 38.9 — 36.6 23.8
Cardiovascular Surg. (Urg.) 2.3 1.7 1.2 0.5 1.3 0.5 — 0.1 — 1.0 1.2
Cardiovascular Surg. (Elec.) 8.1 7.9 2.2 5.0 4.4 4.5 — 4.0 — 4.8 5.3
Urology 7.3 8.5 2.7 8.2 4.7 5.6 7.1 8.8 — 3.0 5.6
Internal Medicine 9.3 19.0 11.8 9.4 4.0 5.7 7.7 16.2 7.7 11.9 8.4
Radiation Oncology 7.0 2.4 2.5 1.0 2.0 2.9 2.0 2.8 1.0 1.6 2.5
Medical Oncology 2.1 1.8 1.1 1.5 1.0 1.0 0.5 1.3 3.0 1.3 1.2
Weighted Median 14.1 14.4 10.1 16.3 8.6 9.2 15.1 16.1 11.4 8.7 10.9

Barua • Waiting Your Turn: 2017 Report • 37
fraserinstitute.org
Table 5A: Plastic surgery (2017)—median patient wait for treatment after appointment with specialist (in weeks)
Procedure BC AB SK MB ON QC NB NS PE NL
Mammoplasty 26.0 7.0 14.0 11.0 13.0 6.5 14.0 45.5 24.0 18.0
Neurolysis 16.0 6.3 — 12.0 8.0 11.0 11.0 15.0 24.0 39.0
Blepharoplasty 24.0 8.0 27.0 4.0 8.0 4.0 26.0 27.0 24.0 16.0
Rhinoplasty 23.5 5.5 27.0 5.5 7.0 5.0 26.0 56.0 24.0 8.0
Scar Revision 23.0 8.0 24.5 24.0 12.0 6.0 14.0 31.5 24.0 5.0
Hand Surgery 17.8 9.0 24.0 21.0 10.0 8.0 7.0 25.0 24.0 12.5
Craniofacial Procedures 18.0 15.0 22.5 9.5 4.3 38.0 — 104.0 24.0 5.0
Skin Cancers and other Tumors 5.0 4.5 22.8 6.0 4.0 3.5 3.0 3.5 50.0 4.0
Weighted Median 22.8 7.3 20.6 15.5 10.7 7.2 13.8 34.6 24.0 19.9
Note: Weighted median does not include craniofacial procedures or skin cancers and other tumors.
Table 5B: Gynaecology (2017)—median patient wait for treatment after appointment with specialist (in weeks)
Procedure BC AB SK MB ON QC NB NS PE NL
Dilation & Curettage 6.0 8.0 6.0 8.0 4.0 2.5 8.5 3.8 — 10.0
Tubal Ligation 10.0 20.0 10.0 8.0 10.0 6.0 24.0 10.0 — 12.5
Hysterectomy (Vaginal/Abdominal) 12.0 18.0 12.0 12.0 12.0 8.0 9.5 11.0 — 12.0
Vaginal Repair 12.0 16.0 12.0 12.0 12.0 6.0 9.5 11.0 — 12.0
Tuboplasty 6.0 18.0 7.8 8.0 11.0 15.0 18.5 12.0 — 18.0
Laparoscopic Procedures 8.5 16.0 11.0 8.0 10.5 8.0 9.0 10.0 — 12.0
Hysteroscopic Procedures 8.0 13.0 10.0 8.0 9.0 6.0 9.0 10.0 — 6.0
Weighted Median 8.7 14.1 9.8 9.3 8.6 6.1 11.9 9.1 — 9.0
38 • Waiting Your Turn: 2017 Report • Barua
fraserinstitute.org
Table 5C: Ophthalmology (2017)—median patient wait for treatment after appointment with specialist (in weeks)
Procedure BC AB SK MB ON QC NB NS PE NL
Cataract Removal 30.0 20.0 6.0 41.0 23.0 12.0 21.0 12.0 12.0 20.0
Cornea Transplant 40.0 23.0 — 52.0 38.0 28.0 10.0 — — —
Cornea - Pterygium 12.0 13.0 9.0 8.0 12.0 11.0 9.0 7.0 — —
Iris, Ciliary Body, Sclera, Anterior Chamber
4.0 7.0 — 4.0 12.0 8.0 9.0 1.0 — 10.0
Retina, Choroid, Vitreous 20.0 4.0 12.0 4.0 2.0 20.0 — 4.8 — —
Lacrimal Duct 14.0 14.0 6.0 20.0 12.0 12.0 30.0 14.0 — 3.0
Strabismus 16.0 14.0 12.0 24.0 16.0 25.0 17.5 16.0 — —
Operations on Eyelids 10.0 12.0 7.0 14.0 12.0 18.5 6.0 14.0 — 3.0
Glaucoma 4.0 8.0 4.0 4.8 6.0 7.5 6.0 1.5 — —
Weighted Median 26.7 15.6 7.1 31.3 19.1 13.4 20.5 10.2 12.0 18.9
Note: Weighted median does not include treatment for glaucoma.
Table 5D: Otolaryngology (2017)—median patient wait for treatment after appointment with specialist (in weeks)
Procedure BC AB SK MB ON QC NB NS PE NL
Myringotomy 24.0 6.0 3.0 24.0 6.0 5.5 8.0 6.0 6.0 11.0
Tympanoplasty 25.0 4.0 26.0 24.0 7.0 10.0 30.0 32.5 30.0 11.0
Thyroid, Parathyroid, and Other Endocrine Glands
12.0 11.5 4.8 24.0 8.0 6.3 12.0 3.5 — 5.0
Tonsillectomy and/or Adenoidectomy
16.0 32.0 38.0 24.0 8.0 8.0 20.0 24.0 31.0 11.0
Rhinoplasty and/or Septal Surgery 24.0 32.0 38.0 24.0 9.0 11.0 20.0 26.0 31.0 11.0
Operations on Nasal Sinuses 24.0 12.0 38.0 24.0 9.5 11.0 20.0 12.0 31.0 11.0
Weighted Median 20.1 18.8 22.9 24.0 7.8 7.4 15.7 14.8 20.7 10.2

Barua • Waiting Your Turn: 2017 Report • 39
fraserinstitute.org
Table 5E: General surgery (2017)—median patient wait for treatment after appointment with specialist (in weeks)
Procedure BC AB SK MB ON QC NB NS PE NL
Hernia/Hydrocele 10.0 25.5 15.0 20.0 5.0 6.0 9.0 4.0 8.0 6.0
Cholecystectomy 10.0 24.0 12.0 15.5 5.0 4.0 8.0 4.0 8.0 5.0
Colonoscopy 10.0 8.0 9.0 12.0 6.0 10.0 12.0 21.0 17.0 3.0
Intestinal Operations 4.0 7.0 6.0 6.0 4.0 4.0 5.5 30.0 8.0 2.0
Haemorrhoidectomy 12.0 24.0 12.0 30.0 6.0 7.0 24.0 5.0 8.0 5.0
Breast Biopsy 3.5 2.5 2.0 3.3 2.0 3.5 4.0 2.5 5.0 1.3
Mastectomy 3.0 2.5 3.0 3.3 3.0 3.0 4.0 2.5 8.0 1.5
Bronchus and Lung 12.0 — — — 3.5 2.0 — 12.0 — —
Aneurysm Surgery 18.0 — — — 12.5 0.5 — — — —
Varicose Veins 11.5 42.0 6.0 7.0 6.8 5.0 24.0 4.5 — 52.0
Weighted Median 6.8 12.6 8.5 11.0 4.6 4.7 8.3 19.4 11.1 2.9
Table 5F: Neurosurgery (2017)—median patient wait for treatment after appointment with specialist (in weeks)
Procedure BC AB SK MB ON QC NB NS PE NL
Neurolysis 14.0 12.0 52.0 3.0 9.0 — — 11.0 — —
Disc Surgery/ Laminectomy 28.0 28.0 18.0 3.0 16.0 6.0 — 14.0 — 7.0
Elective Cranial Bone Flap 6.0 12.0 4.0 4.0 8.0 5.0 — 16.0 — 2.5
Aneurysm Surgery 7.0 12.0 2.0 4.5 26.0 — — 19.0 — —
Carotid endarterectomy — 2.0 — 2.5 8.0 1.0 — 8.0 — —
Weighted Median 16.7 15.8 12.3 3.7 10.3 5.1 — 14.7 — 4.0
40 • Waiting Your Turn: 2017 Report • Barua
fraserinstitute.org
Table 5G: Orthopaedic surgery (2017)—median patient wait for treatment after appointment with specialist (in weeks)
Procedure BC AB SK MB ON QC NB NS PE NL
Meniscectomy/Arthroscopy 18.0 16.0 12.0 16.0 12.0 12.0 12.0 24.0 — 16.0
Removal of Pins 24.0 14.0 13.0 18.0 12.0 20.5 16.0 19.5 — 10.0
Arthroplasty (Hip, Knee, Ankle, Shoulder)
49.0 20.0 24.0 36.0 24.0 18.0 24.0 52.0 — 41.7
Arthroplasty (Interphalangeal, Metatarsophalangeal)
37.0 26.0 7.0 — 12.0 16.0 — 25.0 — —
Hallux Valgus/Hammer Toe 28.0 20.0 10.0 19.0 12.0 20.0 100.0 28.0 — 20.0
Digit Neuroma 14.0 8.0 7.0 7.0 10.0 26.0 100.0 24.0 — —
Rotator Cuff Repair 26.0 20.0 12.0 16.0 13.3 16.0 20.0 26.0 — 42.5
Ostectomy (All Types) 23.0 40.0 12.0 30.0 15.0 26.0 58.0 18.0 — —
Routine Spinal Instability 26.0 40.0 48.0 — 14.0 24.0 46.0 19.0 — —
Weighted Median 38.1 21.0 20.8 29.8 19.9 18.9 32.3 38.9 — 36.6
Table 5H: Cardiovascular surgery (2017)—median patient wait for treatment after appointment with specialist (in weeks)
Procedure BC AB SK MB ON QC NB NS PE NL
Emer
gent
Coronary Artery Bypass 1.8 5.0 0.1 — 2.0 0.0 — 0.8 — 0.5
Valves & Septa of the Heart 1.0 4.3 0.1 — 2.0 0.0 — 0.0 — 0.5
Aneurysm Surgery 1.0 3.0 0.0 0.5 0.2 0.0 — 0.8 — 0.5
Carotid Endarterectomy 3.3 3.0 0.2 0.5 0.0 0.0 — 1.5 — 0.5
Pacemaker Operations 1.0 0.2 0.0 — 0.1 0.0 — 0.0 — —
Weighted Median 1.3 2.7 0.1 0.5 1.2 0.0 — 0.2 — 0.5
Urg
ent
Coronary Artery Bypass 1.5 2.3 1.5 — 1.0 0.8 — 0.1 — 1.0
Valves & Septa of the Heart 1.5 1.4 1.5 — 0.8 0.8 — 0.1 — 1.0
Aneurysm Surgery 3.5 0.7 2.0 0.5 1.0 1.3 — 1.5 — 1.5
Carotid Endarterectomy 2.5 3.3 2.0 0.5 1.0 1.5 — 0.8 — 0.5
Pacemaker Operations 3.0 1.5 1.0 — 2.0 0.2 — 0.1 — —
Weighted Median 2.3 1.7 1.2 0.5 1.3 0.5 — 0.1 — 1.0
Elec
tive
Coronary Artery Bypass 11.5 6.8 2.5 — 4.0 7.0 — 4.0 — 5.0
Valves & Septa of the Heart 10.0 8.0 2.5 — 4.0 7.0 — 4.0 — 5.0
Aneurysm Surgery 5.0 10.0 4.5 5.0 4.0 5.0 — 5.0 — 5.0
Carotid Endarterectomy 4.5 14.0 1.4 5.0 4.0 5.0 — 5.0 — 2.0
Pacemaker Operations 6.0 8.0 2.0 — 5.0 1.5 — 4.0 — —
Weighted Median 8.1 7.9 2.2 5.0 4.4 4.5 — 4.0 — 4.8
Barua • Waiting Your Turn: 2017 Report • 41
fraserinstitute.org
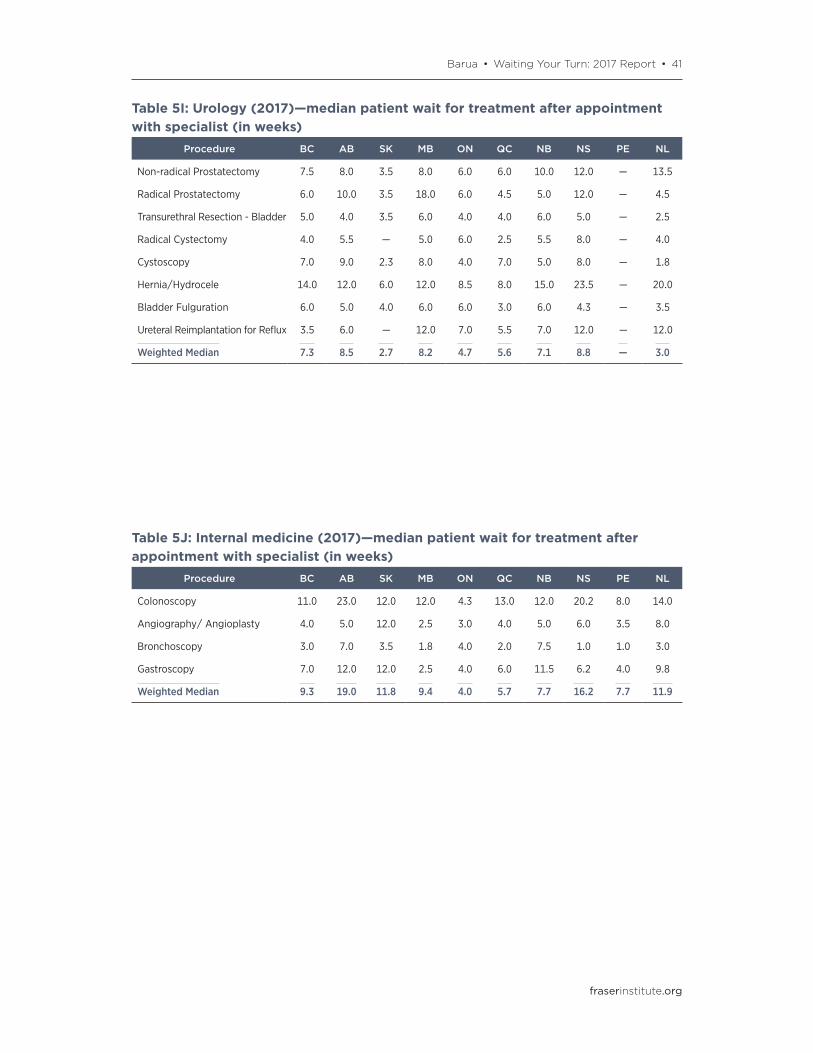
Table 5I: Urology (2017)—median patient wait for treatment after appointment with specialist (in weeks)
Procedure BC AB SK MB ON QC NB NS PE NL
Non-radical Prostatectomy 7.5 8.0 3.5 8.0 6.0 6.0 10.0 12.0 — 13.5
Radical Prostatectomy 6.0 10.0 3.5 18.0 6.0 4.5 5.0 12.0 — 4.5
Transurethral Resection - Bladder 5.0 4.0 3.5 6.0 4.0 4.0 6.0 5.0 — 2.5
Radical Cystectomy 4.0 5.5 — 5.0 6.0 2.5 5.5 8.0 — 4.0
Cystoscopy 7.0 9.0 2.3 8.0 4.0 7.0 5.0 8.0 — 1.8
Hernia/Hydrocele 14.0 12.0 6.0 12.0 8.5 8.0 15.0 23.5 — 20.0
Bladder Fulguration 6.0 5.0 4.0 6.0 6.0 3.0 6.0 4.3 — 3.5
Ureteral Reimplantation for Reflux 3.5 6.0 — 12.0 7.0 5.5 7.0 12.0 — 12.0
Weighted Median 7.3 8.5 2.7 8.2 4.7 5.6 7.1 8.8 — 3.0
Table 5J: Internal medicine (2017)—median patient wait for treatment after appointment with specialist (in weeks)
Procedure BC AB SK MB ON QC NB NS PE NL
Colonoscopy 11.0 23.0 12.0 12.0 4.3 13.0 12.0 20.2 8.0 14.0
Angiography/ Angioplasty 4.0 5.0 12.0 2.5 3.0 4.0 5.0 6.0 3.5 8.0
Bronchoscopy 3.0 7.0 3.5 1.8 4.0 2.0 7.5 1.0 1.0 3.0
Gastroscopy 7.0 12.0 12.0 2.5 4.0 6.0 11.5 6.2 4.0 9.8
Weighted Median 9.3 19.0 11.8 9.4 4.0 5.7 7.7 16.2 7.7 11.9
42 • Waiting Your Turn: 2017 Report • Barua
fraserinstitute.org
Table 5K: Radiation oncology (2017)—median patient wait for treatment after appointment with specialist (in weeks)
Procedure BC AB SK MB ON QC NB NS PE NL
Cancer of The Larynx 3.0 2.0 0.5 1.0 2.0 1.5 2.0 2.0 1.0 1.0
Cancer of The Cervix 4.0 2.0 0.5 1.0 2.0 1.5 2.0 2.0 1.0 1.0
Lung Cancer 5.0 2.0 2.3 1.0 2.0 1.7 2.0 2.0 1.0 1.0
Prostate Cancer 7.0 3.0 2.8 1.0 2.0 4.0 2.0 4.0 1.0 2.5
Breast Cancer 9.0 2.3 2.8 1.0 2.0 4.0 2.0 3.0 1.0 —
Early Side Effects from Treatment 1.5 0.8 0.3 — 0.1 0.5 0.0 2.0 — 1.0
Late Side Effects from Treatment 4.0 2.0 1.3 — 0.1 1.0 0.0 2.0 — 2.3
Weighted Median 7.0 2.4 2.5 1.0 2.0 2.9 2.0 2.8 1.0 1.6
Note: Weighted median does not include early or late side effects from treatment.
Table 5L: Medical oncology (2017)—median patient wait for treatment after appointment with specialist (in weeks)
Procedure BC AB SK MB ON QC NB NS PE NL
Cancer of the Larynx 2.5 1.0 1.1 — 2.0 1.0 0.5 1.8 3.0 1.8
Cancer of the Cervix 1.5 1.0 1.1 — 1.0 1.0 0.5 1.3 3.0 1.8
Lung Cancer 2.3 1.8 1.1 — 1.0 1.0 0.5 1.5 3.0 1.3
Breast Cancer 2.0 2.0 1.1 1.5 1.0 1.0 0.5 1.0 3.0 1.3
Side Effects from Treatment 0.3 0.5 0.0 — 0.5 0.5 0.0 0.2 0.2 0.8
Weighted Median 2.1 1.8 1.1 1.5 1.0 1.0 0.5 1.3 3.0 1.3
Note: Weighted median does not include side effects from treatment.
Barua • Waiting Your Turn: 2017 Report • 43
fraserinstitute.org
Tab
le 6
: Co
mp
aris
on
of
med
ian
wee
ks w
aite
d t
o r
ecei
ve t
reat
men
t af
ter
app
oin
tmen
t w
ith
spec
ialis
t,
by s
elec
ted
sp
ecia
ltie
s, 2
017
and
20
16P
roce
dur
eB
riti
sh C
olu
mb
iaA
lber
taSa
skat
chew
anM
anit
ob
aO
ntar
io
2017
2016
% ch
g20
1720
16%
chg
2017
2016
% ch
g20
1720
16%
chg
2017
2016
% ch
g
Plas
tic S
urge
ry22
.835
.2−3
5%7.
332
.4−7
8%20
.617
.915
%15
.516
.7−8
%10
.75.
499
%
Gyn
aeco
logy
8.7
11.7
−25%
14.1
10.2
39%
9.8
6.2
59%
9.3
6.3
47%
8.6
7.7
12%
Oph
thal
mol
ogy
26.7
21.3
26%
15.6
17.8
−12%
7.1
9.4
−24%
31.3
30.0
4%19
.119
.4−1
%
Oto
lary
ngol
ogy
20.1
19.6
3%18
.817
.58%
22.9
8.8
159%
24.0
23.2
3%7.
812
.3−3
7%
Gen
eral
Sur
gery
6.8
7.3
−8%
12.6
7.2
75%
8.5
4.6
87%
11.0
4.0
177%
4.6
4.1
14%
Neu
rosu
rger
y16
.712
.435
%15
.825
.1−3
7%12
.39.
332
%3.
73.
118
%10
.312
.8−1
9%
Ort
hopa
edic
Sur
gery
38.1
39.3
−3%
21.0
21.9
−4%
20.8
17.4
20%
29.8
20.1
48%
19.9
17.7
12%
Car
diov
ascu
lar
Surg
ery
(Urg
ent)
2.3
2.3
1%1.
71.
329
%1.
26.
0−7
9%0.
5—
—1.
31.
033
%
Car
diov
ascu
lar
Surg
ery
(Ele
ctiv
e)8.
17.
311
%7.
92.
521
5%2.
2—
—5.
0—
—4.
43.
236
%
Uro
logy
7.3
7.4
0%8.
55.
263
%2.
73.
9−3
1%8.
25.
939
%4.
73.
921
%
Inte
rnal
Med
icin
e9.
313
.1−2
9%19
.010
.680
%11
.87.
265
%9.
47.
034
%4.
05.
2−2
4%
Rad
iatio
n O
ncol
ogy
7.0
10.3
−32%
2.4
2.0
21%
2.5
2.1
18%
1.0
2.6
−62%
2.0
2.0
0%
Med
ical
Onc
olog
y2.
13.
7−4
4%1.
83.
9−5
2%1.
1—
—1.
5—
—1.
01.
1−9
%
Wei
ghte
d M
edia
n14
.114
.5−3
%14
.412
.714
%10
.17.
928
%16
.311
.740
%8.
68.
42%
Note: Percentag
e ch
ange
s are calculated
from
exact weigh
ted med
ians. T
he exact weigh
ted med
ians have be
en ro
unde
d to one
decim
al place fo
r inclusion in the
tab
le.
44 • Waiting Your Turn: 2017 Report • Barua
fraserinstitute.org
Tab
le 6
, co
ntin
ued
: Co
mp
aris
on
of
med
ian
wee
ks w
aite
d t
o r
ecei
ve t
reat
men
t af
ter
app
oin
tmen
t w
ith
spec
ialis
t,
by s
elec
ted
sp
ecia
ltie
s, 2
017
and
20
16P
roce
dur
eQ
ueb
ecN
ew B
runs
wic
kN
ova
Sco
tia
Pri
nce
Ed
war
d Is
land
New
foun
dla
nd &
Lab
rad
or
2017
2016
% ch
g20
1720
16%
chg
2017
2016
% ch
g20
1620
15%
chg
2016
2015
% ch
g
Plas
tic S
urge
ry7.
29.
9−2
7%13
.86.
810
3%34
.669
.3−5
0%
24.0
——
19.9
——
Gyn
aeco
logy
6.1
8.8
−30%
11.9
——
9.1
10.5
−14%
—4.
0—
9.0
6.4
41%
Oph
thal
mol
ogy
13.4
10.6
27%
20.5
19.9
3%10
.28.
521
%12
.011
.82%
18.9
8.7
117%
Oto
lary
ngol
ogy
7.4
7.3
1%15
.715
.05%
14.8
13.7
8%20
.717
.816
%10
.216
.0−3
6%
Gen
eral
Sur
gery
4.7
5.6
−16%
8.3
13.5
−38%
19.4
25.0
−22%
11.1
12.6
−12%
2.9
14.0
−79%
Neu
rosu
rger
y5.
118
.0−7
2%—
29.1
—14
.77.
010
8%—
——
4.0
0.0
—
Ort
hopa
edic
Sur
gery
18.9
17.2
10%
32.3
30.2
7%38
.949
.3−2
1%—
——
36.6
28.8
27%
Car
diov
ascu
lar
Surg
ery
(Urg
ent)
0.5
0.7
−28%
—14
.5—
0.1
8.0
−99%
——
—1.
01.
01%
Car
diov
ascu
lar
Surg
ery
(Ele
ctiv
e)4.
57.
8−4
3%—
29.0
—4.
012
.0−6
6%—
——
4.8
6.5
−26%
Uro
logy
5.6
8.7
−36%
7.1
12.3
−43%
8.8
9.4
−6%
——
—3.
06.
4−5
3%
Inte
rnal
Med
icin
e5.
73.
753
%7.
74.
955
%16
.211
.639
%7.
77.
7−1
%11
.99.
427
%
Rad
iatio
n O
ncol
ogy
2.9
3.3
−12%
2.0
——
2.8
2.2
27%
1.0
2.0
−50%
1.6
2.0
−16%
Med
ical
Onc
olog
y1.
01.
00
%0.
5—
—1.
32.
1−3
9%3.
02.
050
%1.
31.
7−2
5%
Wei
ghte
d M
edia
n9.
28.
93%
15.1
17.4
−13%
16.1
17.7
−9%
11.4
10.5
8%8.
711
.5−2
4%
Note: Percentag
e ch
ange
s are calculated
from
exact weigh
ted med
ians. T
he exact weigh
ted med
ians have be
en ro
unde
d to one
decim
al place fo
r inclusion in the
tab
le.

Barua • Waiting Your Turn: 2017 Report • 45
fraserinstitute.org
Table 7: Frequency distribution of waiting times (specialist to treatment) by province, 2017—proportion of survey waiting times that fall within given ranges
Procedure BC AB SK MB ON QC NB NS PE NL
0–3.99 Weeks 17.5% 16.5% 25.8% 16.1% 31.7% 34.2% 28.2% 22.8% 31.8% 32.8%
4–7.99 Weeks 25.4% 20.6% 26.9% 25.2% 25.0% 24.4% 18.5% 18.9% 6.8% 20.8%
8–12.99 Weeks 16.5% 21.7% 24.2% 19.5% 22.7% 17.9% 23.4% 25.4% 22.7% 26.0%
13–25.99 Weeks 20.4% 22.0% 10.4% 26.1% 11.8% 10.3% 13.3% 13.9% 18.2% 11.5%
26–51.99 Weeks 11.9% 12.7% 7.7% 6.5% 5.4% 10.7% 11.0% 12.1% 20.5% 3.1%
1 year plus 8.3% 6.5% 5.1% 6.5% 3.4% 2.5% 5.5% 6.8% 0.0% 5.7%
Note: Columns do not necessarily sum to 100 as a result of rounding.
Table 8: Median reasonable patient wait for treatment after appointment with specialist, 2017 (in weeks)
Procedure BC AB SK MB ON QC NB NS PE NL CAN
Plastic Surgery 20.8 15.3 — — 10.1 14.8 13.0 — 12.0 24.1 13.8
Gynaecology 5.9 9.2 6.7 8.9 6.4 8.3 15.6 9.1 — 8.2 7.6
Ophthalmology 11.6 11.3 16.7 13.1 10.2 8.4 10.1 10.1 — 8.0 10.4
Otolaryngology 11.8 16.2 8.4 10.0 10.3 8.1 10.7 12.2 8.4 7.1 10.3
General Surgery 7.1 5.0 5.9 4.7 5.2 7.5 8.8 2.2 — 4.3 5.8
Neurosurgery 6.0 7.8 6.7 4.5 6.7 4.3 — 17.8 — — 6.5
Orthopaedic Surgery 12.2 11.7 10.4 14.0 10.7 13.1 18.6 11.9 — 28.0 12.0
Cardiovascular Surg. (Urg.) 1.3 0.9 1.5 — 1.1 0.8 — 0.1 — 1.0 1.0
Cardiovascular Surg. (Elec.) 9.8 7.4 4.9 — 4.4 5.6 — 4.0 — 4.8 5.8
Urology 4.9 6.3 2.7 5.9 4.3 4.9 5.5 7.5 — 5.1 4.8
Internal Medicine 3.6 5.9 3.8 2.7 3.4 3.9 4.2 4.0 4.0 3.3 3.8
Radiation Oncology 4.2 3.3 7.9 — 2.9 3.1 — 2.5 — 2.0 3.0
Medical Oncology 2.1 2.0 — — 2.0 2.0 2.5 2.0 4.0 1.8 2.0
Weighted Median 7.7 8.5 7.5 7.4 6.4 7.8 10.6 7.9 5.7 6.4 7.2

46 • Waiting Your Turn: 2017 Report • Barua
fraserinstitute.org
Table 9A: Plastic surgery (2017)—median reasonable wait for treatment after appointment with specialist (in weeks)
Procedure BC AB SK MB ON QC NB NS PE NL
Mammoplasty 25.0 16.0 — — 12.0 16.0 17.0 — 12.0 26.5
Neurolysis 7.5 12.0 — — 8.0 12.0 15.0 — 12.0 21.0
Blepharoplasty 24.0 16.0 — — 8.0 8.0 3.0 — 12.0 25.5
Rhinoplasty 24.0 16.0 — — 12.0 17.0 8.0 — 12.0 34.0
Scar Revision 24.0 16.0 — — 9.0 22.0 7.0 — 12.0 29.8
Hand Surgery 12.0 11.0 — — 6.5 8.0 7.0 — 12.0 12.5
Craniofacial Procedures 10.0 — — — 6.0 10.0 — — 12.0 13.0
Skin Cancers and other Tumors 4.5 4.0 — — 4.0 4.0 2.5 — 12.0 6.5
Weighted Median 20.8 15.3 — — 10.1 14.8 13.0 — 12.0 24.1
Note: Weighted median does not include craniofacial procedures or skin cancers and other tumors.
Table 9B: Gynaecology (2017)—median reasonable wait for treatment after appointment with specialist (in weeks)
Procedure BC AB SK MB ON QC NB NS PE NL
Dilation & Curettage 4.0 5.0 3.0 4.0 4.0 3.0 12.0 5.0 — 6.0
Tubal Ligation 8.0 12.0 10.0 10.0 8.0 12.0 12.0 10.0 — 12.0
Hysterectomy (Vaginal/Abdominal) 9.0 12.0 9.0 12.0 8.0 9.0 24.0 12.0 — 12.0
Vaginal Repair 8.0 14.0 8.0 12.0 8.0 12.0 24.0 12.0 — 12.0
Tuboplasty 8.0 16.0 12.0 11.0 8.0 12.0 — 14.0 — 12.0
Laparoscopic Procedures 8.0 12.0 8.0 11.0 8.0 8.0 24.0 12.0 — 8.0
Hysteroscopic Procedures 4.0 8.0 3.5 10.0 6.0 8.0 12.0 7.0 — 8.0
Weighted Median 5.9 9.2 6.7 8.9 6.4 8.3 15.6 9.1 — 8.2
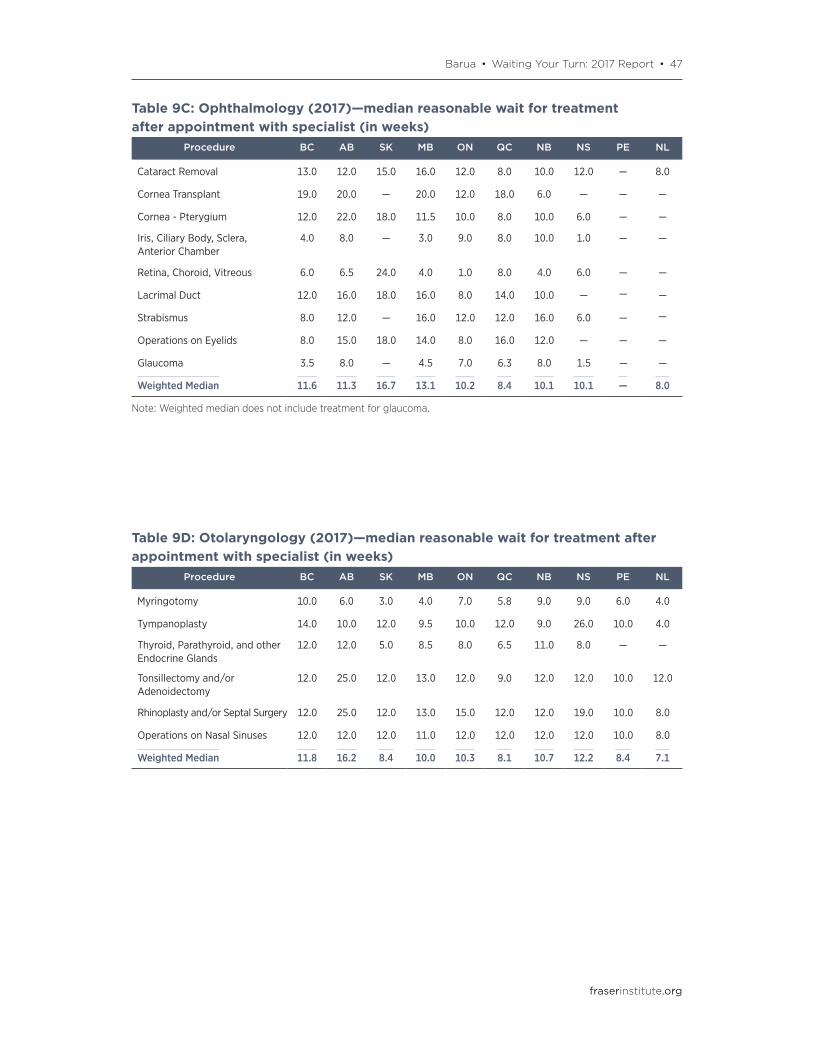
Barua • Waiting Your Turn: 2017 Report • 47
fraserinstitute.org
Table 9C: Ophthalmology (2017)—median reasonable wait for treatment after appointment with specialist (in weeks)
Procedure BC AB SK MB ON QC NB NS PE NL
Cataract Removal 13.0 12.0 15.0 16.0 12.0 8.0 10.0 12.0 — 8.0
Cornea Transplant 19.0 20.0 — 20.0 12.0 18.0 6.0 — — —
Cornea - Pterygium 12.0 22.0 18.0 11.5 10.0 8.0 10.0 6.0 — —
Iris, Ciliary Body, Sclera, Anterior Chamber
4.0 8.0 — 3.0 9.0 8.0 10.0 1.0 — —
Retina, Choroid, Vitreous 6.0 6.5 24.0 4.0 1.0 8.0 4.0 6.0 — —
Lacrimal Duct 12.0 16.0 18.0 16.0 8.0 14.0 10.0 — — —
Strabismus 8.0 12.0 — 16.0 12.0 12.0 16.0 6.0 — —
Operations on Eyelids 8.0 15.0 18.0 14.0 8.0 16.0 12.0 — — —
Glaucoma 3.5 8.0 — 4.5 7.0 6.3 8.0 1.5 — —
Weighted Median 11.6 11.3 16.7 13.1 10.2 8.4 10.1 10.1 — 8.0
Note: Weighted median does not include treatment for glaucoma.
Table 9D: Otolaryngology (2017)—median reasonable wait for treatment after appointment with specialist (in weeks)
Procedure BC AB SK MB ON QC NB NS PE NL
Myringotomy 10.0 6.0 3.0 4.0 7.0 5.8 9.0 9.0 6.0 4.0
Tympanoplasty 14.0 10.0 12.0 9.5 10.0 12.0 9.0 26.0 10.0 4.0
Thyroid, Parathyroid, and other Endocrine Glands
12.0 12.0 5.0 8.5 8.0 6.5 11.0 8.0 — —
Tonsillectomy and/or Adenoidectomy
12.0 25.0 12.0 13.0 12.0 9.0 12.0 12.0 10.0 12.0
Rhinoplasty and/or Septal Surgery 12.0 25.0 12.0 13.0 15.0 12.0 12.0 19.0 10.0 8.0
Operations on Nasal Sinuses 12.0 12.0 12.0 11.0 12.0 12.0 12.0 12.0 10.0 8.0
Weighted Median 11.8 16.2 8.4 10.0 10.3 8.1 10.7 12.2 8.4 7.1
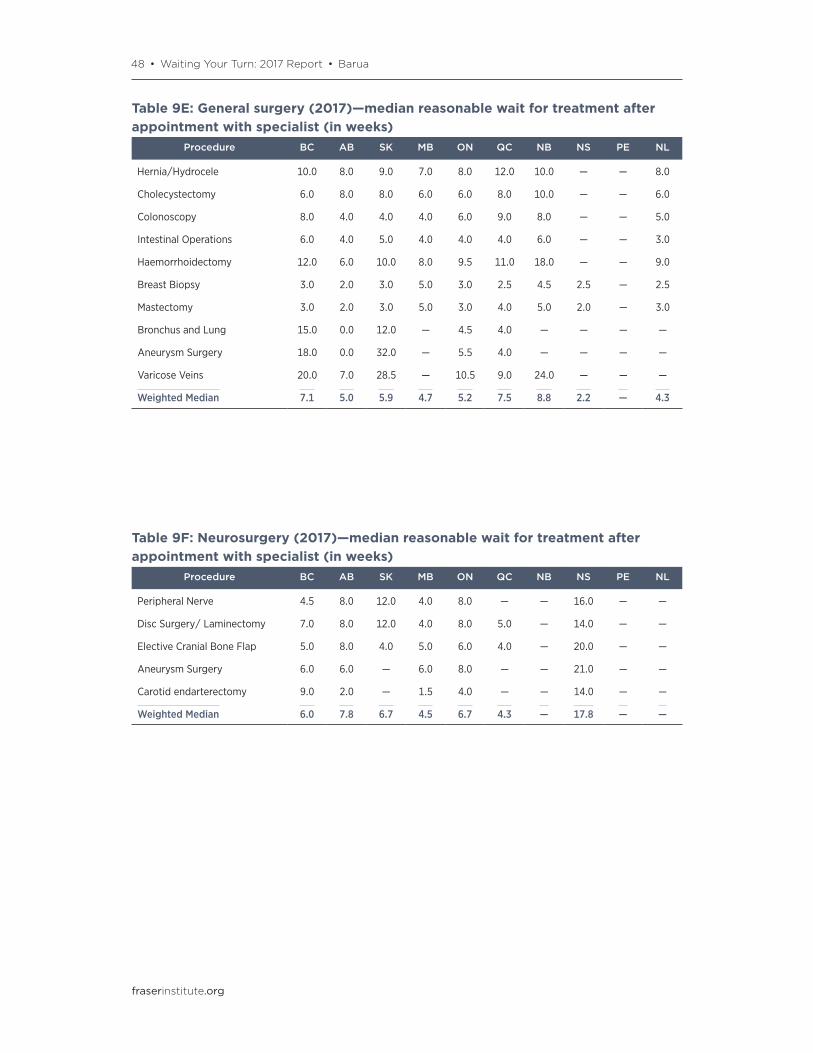
48 • Waiting Your Turn: 2017 Report • Barua
fraserinstitute.org
Table 9E: General surgery (2017)—median reasonable wait for treatment after appointment with specialist (in weeks)
Procedure BC AB SK MB ON QC NB NS PE NL
Hernia/Hydrocele 10.0 8.0 9.0 7.0 8.0 12.0 10.0 — — 8.0
Cholecystectomy 6.0 8.0 8.0 6.0 6.0 8.0 10.0 — — 6.0
Colonoscopy 8.0 4.0 4.0 4.0 6.0 9.0 8.0 — — 5.0
Intestinal Operations 6.0 4.0 5.0 4.0 4.0 4.0 6.0 — — 3.0
Haemorrhoidectomy 12.0 6.0 10.0 8.0 9.5 11.0 18.0 — — 9.0
Breast Biopsy 3.0 2.0 3.0 5.0 3.0 2.5 4.5 2.5 — 2.5
Mastectomy 3.0 2.0 3.0 5.0 3.0 4.0 5.0 2.0 — 3.0
Bronchus and Lung 15.0 0.0 12.0 — 4.5 4.0 — — — —
Aneurysm Surgery 18.0 0.0 32.0 — 5.5 4.0 — — — —
Varicose Veins 20.0 7.0 28.5 — 10.5 9.0 24.0 — — —
Weighted Median 7.1 5.0 5.9 4.7 5.2 7.5 8.8 2.2 — 4.3
Table 9F: Neurosurgery (2017)—median reasonable wait for treatment after appointment with specialist (in weeks)
Procedure BC AB SK MB ON QC NB NS PE NL
Peripheral Nerve 4.5 8.0 12.0 4.0 8.0 — — 16.0 — —
Disc Surgery/ Laminectomy 7.0 8.0 12.0 4.0 8.0 5.0 — 14.0 — —
Elective Cranial Bone Flap 5.0 8.0 4.0 5.0 6.0 4.0 — 20.0 — —
Aneurysm Surgery 6.0 6.0 — 6.0 8.0 — — 21.0 — —
Carotid endarterectomy 9.0 2.0 — 1.5 4.0 — — 14.0 — —
Weighted Median 6.0 7.8 6.7 4.5 6.7 4.3 — 17.8 — —
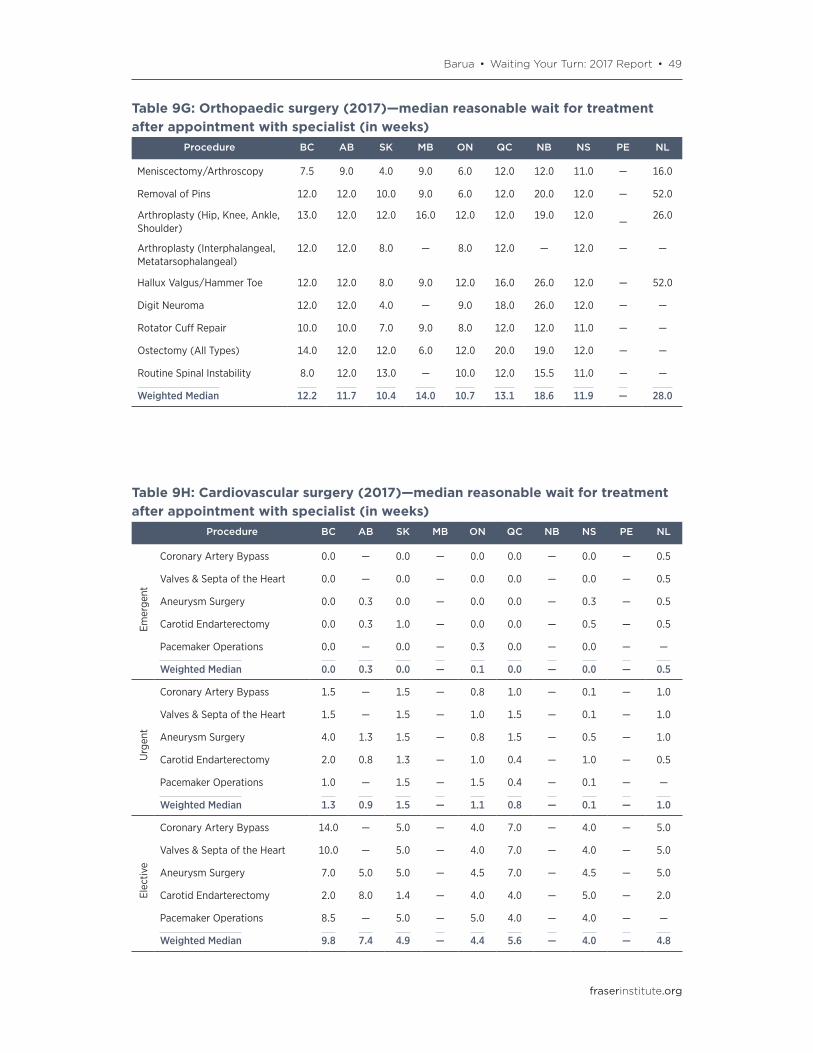
Barua • Waiting Your Turn: 2017 Report • 49
fraserinstitute.org
Table 9G: Orthopaedic surgery (2017)—median reasonable wait for treatment after appointment with specialist (in weeks)
Procedure BC AB SK MB ON QC NB NS PE NL
Meniscectomy/Arthroscopy 7.5 9.0 4.0 9.0 6.0 12.0 12.0 11.0 — 16.0
Removal of Pins 12.0 12.0 10.0 9.0 6.0 12.0 20.0 12.0 — 52.0
Arthroplasty (Hip, Knee, Ankle, Shoulder)
13.0 12.0 12.0 16.0 12.0 12.0 19.0 12.0—
26.0
Arthroplasty (Interphalangeal, Metatarsophalangeal)
12.0 12.0 8.0 — 8.0 12.0 — 12.0 — —
Hallux Valgus/Hammer Toe 12.0 12.0 8.0 9.0 12.0 16.0 26.0 12.0 — 52.0
Digit Neuroma 12.0 12.0 4.0 — 9.0 18.0 26.0 12.0 — —
Rotator Cuff Repair 10.0 10.0 7.0 9.0 8.0 12.0 12.0 11.0 — —
Ostectomy (All Types) 14.0 12.0 12.0 6.0 12.0 20.0 19.0 12.0 — —
Routine Spinal Instability 8.0 12.0 13.0 — 10.0 12.0 15.5 11.0 — —
Weighted Median 12.2 11.7 10.4 14.0 10.7 13.1 18.6 11.9 — 28.0
Table 9H: Cardiovascular surgery (2017)—median reasonable wait for treatment after appointment with specialist (in weeks)
Procedure BC AB SK MB ON QC NB NS PE NL
Emer
gent
Coronary Artery Bypass 0.0 — 0.0 — 0.0 0.0 — 0.0 — 0.5
Valves & Septa of the Heart 0.0 — 0.0 — 0.0 0.0 — 0.0 — 0.5
Aneurysm Surgery 0.0 0.3 0.0 — 0.0 0.0 — 0.3 — 0.5
Carotid Endarterectomy 0.0 0.3 1.0 — 0.0 0.0 — 0.5 — 0.5
Pacemaker Operations 0.0 — 0.0 — 0.3 0.0 — 0.0 — —
Weighted Median 0.0 0.3 0.0 — 0.1 0.0 — 0.0 — 0.5
Urg
ent
Coronary Artery Bypass 1.5 — 1.5 — 0.8 1.0 — 0.1 — 1.0
Valves & Septa of the Heart 1.5 — 1.5 — 1.0 1.5 — 0.1 — 1.0
Aneurysm Surgery 4.0 1.3 1.5 — 0.8 1.5 — 0.5 — 1.0
Carotid Endarterectomy 2.0 0.8 1.3 — 1.0 0.4 — 1.0 — 0.5
Pacemaker Operations 1.0 — 1.5 — 1.5 0.4 — 0.1 — —
Weighted Median 1.3 0.9 1.5 — 1.1 0.8 — 0.1 — 1.0
Elec
tive
Coronary Artery Bypass 14.0 — 5.0 — 4.0 7.0 — 4.0 — 5.0
Valves & Septa of the Heart 10.0 — 5.0 — 4.0 7.0 — 4.0 — 5.0
Aneurysm Surgery 7.0 5.0 5.0 — 4.5 7.0 — 4.5 — 5.0
Carotid Endarterectomy 2.0 8.0 1.4 — 4.0 4.0 — 5.0 — 2.0
Pacemaker Operations 8.5 — 5.0 — 5.0 4.0 — 4.0 — —
Weighted Median 9.8 7.4 4.9 — 4.4 5.6 — 4.0 — 4.8
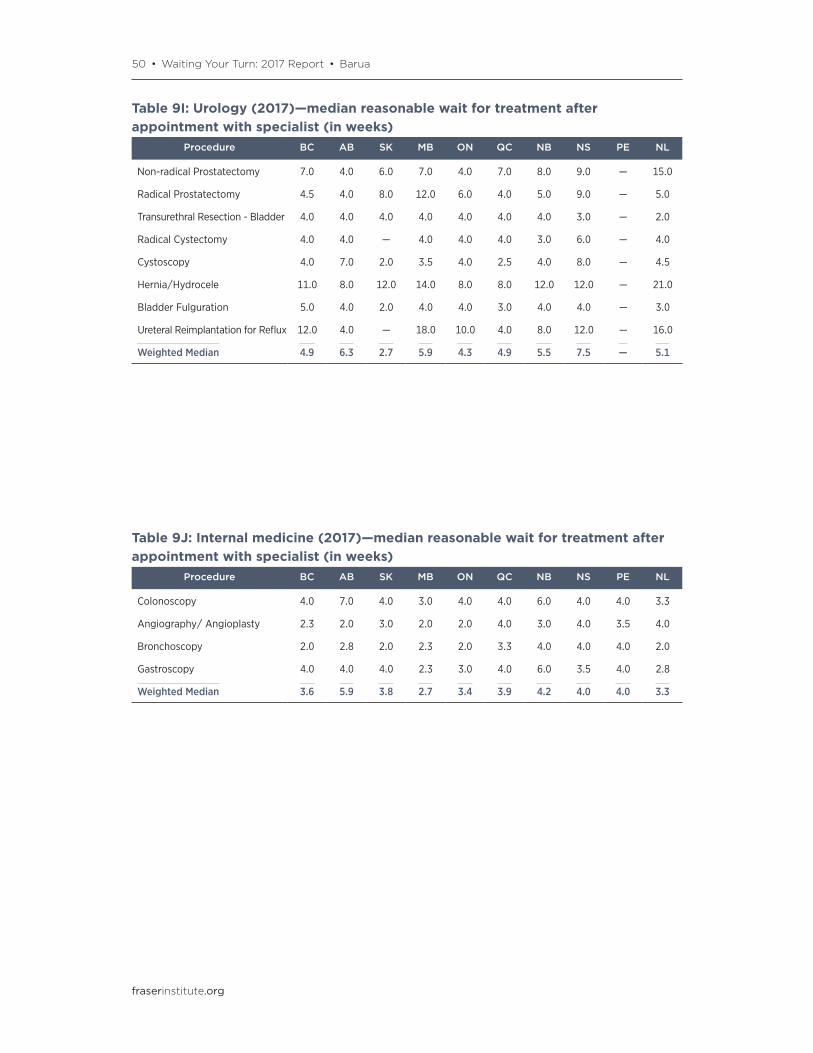
50 • Waiting Your Turn: 2017 Report • Barua
fraserinstitute.org
Table 9I: Urology (2017)—median reasonable wait for treatment after appointment with specialist (in weeks)
Procedure BC AB SK MB ON QC NB NS PE NL
Non-radical Prostatectomy 7.0 4.0 6.0 7.0 4.0 7.0 8.0 9.0 — 15.0
Radical Prostatectomy 4.5 4.0 8.0 12.0 6.0 4.0 5.0 9.0 — 5.0
Transurethral Resection - Bladder 4.0 4.0 4.0 4.0 4.0 4.0 4.0 3.0 — 2.0
Radical Cystectomy 4.0 4.0 — 4.0 4.0 4.0 3.0 6.0 — 4.0
Cystoscopy 4.0 7.0 2.0 3.5 4.0 2.5 4.0 8.0 — 4.5
Hernia/Hydrocele 11.0 8.0 12.0 14.0 8.0 8.0 12.0 12.0 — 21.0
Bladder Fulguration 5.0 4.0 2.0 4.0 4.0 3.0 4.0 4.0 — 3.0
Ureteral Reimplantation for Reflux 12.0 4.0 — 18.0 10.0 4.0 8.0 12.0 — 16.0
Weighted Median 4.9 6.3 2.7 5.9 4.3 4.9 5.5 7.5 — 5.1
Table 9J: Internal medicine (2017)—median reasonable wait for treatment after appointment with specialist (in weeks)
Procedure BC AB SK MB ON QC NB NS PE NL
Colonoscopy 4.0 7.0 4.0 3.0 4.0 4.0 6.0 4.0 4.0 3.3
Angiography/ Angioplasty 2.3 2.0 3.0 2.0 2.0 4.0 3.0 4.0 3.5 4.0
Bronchoscopy 2.0 2.8 2.0 2.3 2.0 3.3 4.0 4.0 4.0 2.0
Gastroscopy 4.0 4.0 4.0 2.3 3.0 4.0 6.0 3.5 4.0 2.8
Weighted Median 3.6 5.9 3.8 2.7 3.4 3.9 4.2 4.0 4.0 3.3
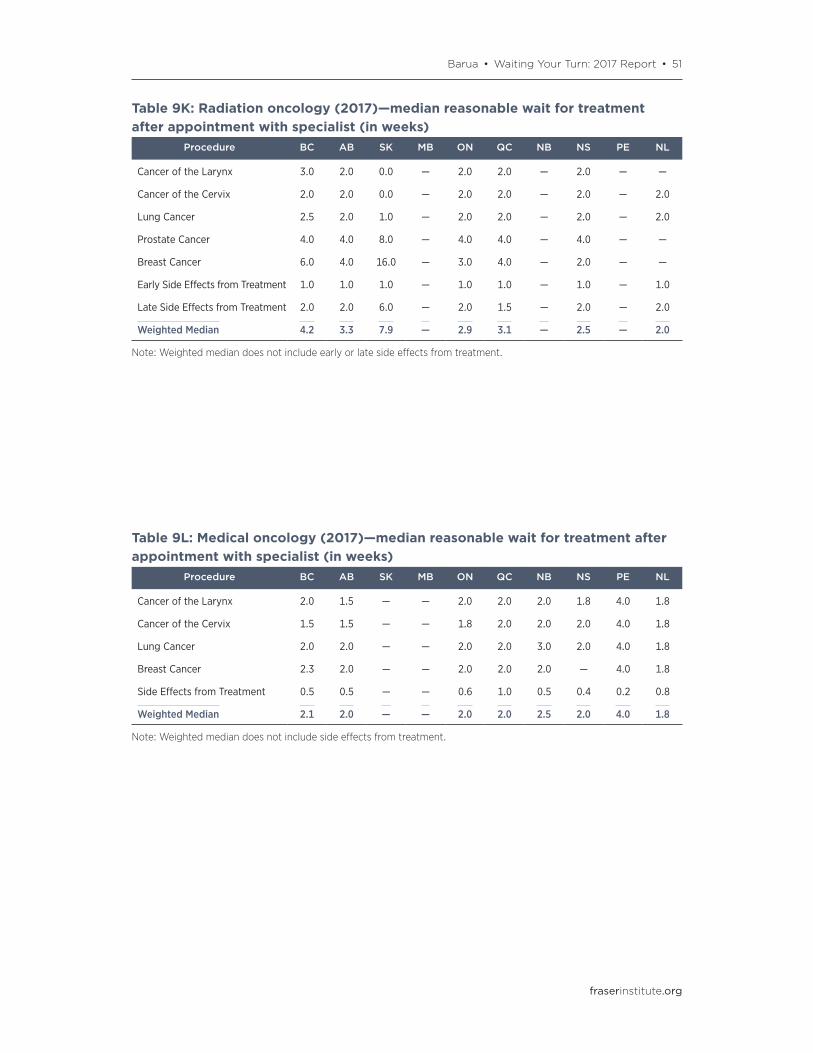
Barua • Waiting Your Turn: 2017 Report • 51
fraserinstitute.org
Table 9K: Radiation oncology (2017)—median reasonable wait for treatment after appointment with specialist (in weeks)
Procedure BC AB SK MB ON QC NB NS PE NL
Cancer of the Larynx 3.0 2.0 0.0 — 2.0 2.0 — 2.0 — —
Cancer of the Cervix 2.0 2.0 0.0 — 2.0 2.0 — 2.0 — 2.0
Lung Cancer 2.5 2.0 1.0 — 2.0 2.0 — 2.0 — 2.0
Prostate Cancer 4.0 4.0 8.0 — 4.0 4.0 — 4.0 — —
Breast Cancer 6.0 4.0 16.0 — 3.0 4.0 — 2.0 — —
Early Side Effects from Treatment 1.0 1.0 1.0 — 1.0 1.0 — 1.0 — 1.0
Late Side Effects from Treatment 2.0 2.0 6.0 — 2.0 1.5 — 2.0 — 2.0
Weighted Median 4.2 3.3 7.9 — 2.9 3.1 — 2.5 — 2.0
Note: Weighted median does not include early or late side effects from treatment.
Table 9L: Medical oncology (2017)—median reasonable wait for treatment after appointment with specialist (in weeks)
Procedure BC AB SK MB ON QC NB NS PE NL
Cancer of the Larynx 2.0 1.5 — — 2.0 2.0 2.0 1.8 4.0 1.8
Cancer of the Cervix 1.5 1.5 — — 1.8 2.0 2.0 2.0 4.0 1.8
Lung Cancer 2.0 2.0 — — 2.0 2.0 3.0 2.0 4.0 1.8
Breast Cancer 2.3 2.0 — — 2.0 2.0 2.0 — 4.0 1.8
Side Effects from Treatment 0.5 0.5 — — 0.6 1.0 0.5 0.4 0.2 0.8
Weighted Median 2.1 2.0 — — 2.0 2.0 2.5 2.0 4.0 1.8
Note: Weighted median does not include side effects from treatment.
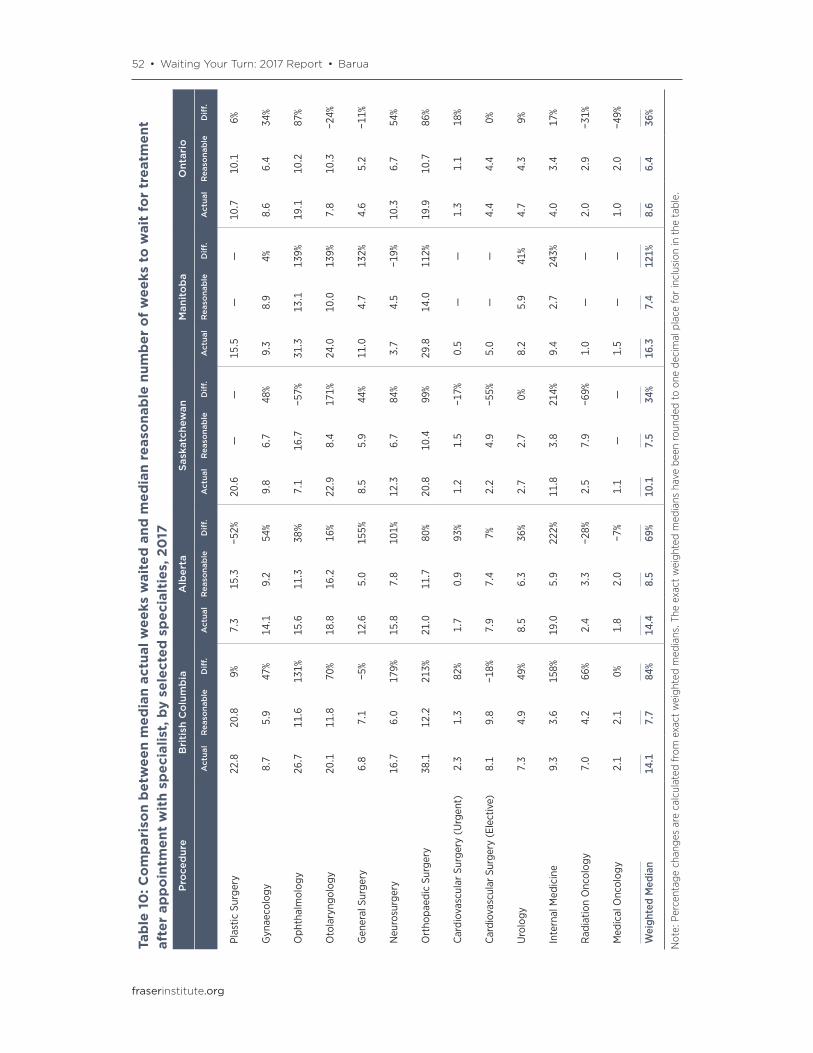
52 • Waiting Your Turn: 2017 Report • Barua
fraserinstitute.org
Tab
le 1
0: C
om
par
iso
n b
etw
een
med
ian
actu
al w
eeks
wai
ted
and
med
ian
reas
ona
ble
num
ber
of
wee
ks t
o w
ait
for
trea
tmen
t af
ter
app
oin
tmen
t w
ith
spec
ialis
t, b
y se
lect
ed s
pec
ialt
ies,
20
17P
roce
dur
eB
riti
sh C
olu
mb
iaA
lber
taSa
skat
chew
anM
anit
ob
aO
ntar
io
Act
ual
Rea
sona
ble
Diff
.A
ctua
lR
easo
nab
leD
iff.
Act
ual
Rea
sona
ble
Diff
.A
ctua
lR
easo
nab
leD
iff.
Act
ual
Rea
sona
ble
Diff
.
Plas
tic S
urge
ry22
.820
.89%
7.3
15.3
−52%
20.6
——
15.5
——
10.7
10.1
6%
Gyn
aeco
logy
8.7
5.9
47%
14.1
9.2
54%
9.8
6.7
48%
9.3
8.9
4%8.
66.
434
%
Oph
thal
mol
ogy
26.7
11.6
131%
15.6
11.3
38%
7.1
16.7
−57%
31.3
13.1
139%
19.1
10.2
87%
Oto
lary
ngol
ogy
20.1
11.8
70%
18.8
16.2
16%
22.9
8.4
171%
24.0
10.0
139%
7.8
10.3
−24%
Gen
eral
Sur
gery
6.8
7.1
−5%
12.6
5.0
155%
8.5
5.9
44%
11.0
4.7
132%
4.6
5.2
−11%
Neu
rosu
rger
y16
.76.
017
9%15
.87.
810
1%12
.36.
784
%3.
74.
5−1
9%10
.36.
754
%
Ort
hopa
edic
Sur
gery
38.1
12.2
213%
21.0
11.7
80%
20.8
10.4
99%
29.8
14.0
112%
19.9
10.7
86%
Car
diov
ascu
lar
Surg
ery
(Urg
ent)
2.3
1.3
82%
1.7
0.9
93%
1.2
1.5
−17%
0.5
——
1.3
1.1
18%
Car
diov
ascu
lar S
urge
ry (
Elec
tive)
8.1
9.8
−18%
7.9
7.4
7%2.
24.
9−5
5%5.
0—
—4.
44.
40%
Uro
logy
7.3
4.9
49%
8.5
6.3
36%
2.7
2.7
0%8.
25.
941
%4.
74.
39%
Inte
rnal
Med
icin
e9.
33.
615
8%19
.05.
922
2%11
.83.
821
4%9.
42.
724
3%4.
03.
417
%
Rad
iatio
n O
ncol
ogy
7.0
4.2
66%
2.4
3.3
−28%
2.5
7.9
−69%
1.0
——
2.0
2.9
−31%
Med
ical
Onc
olog
y2.
12.
10%
1.8
2.0
−7%
1.1
——
1.5
——
1.0
2.0
−49%
Wei
ghte
d M
edia
n14
.17.
784
%14
.48.
569
%10
.17.
534
%16
.37.
412
1%8.
66.
436
%
Note: Percentag
e ch
ange
s are calculated
from
exact weigh
ted med
ians. T
he exact weigh
ted med
ians have be
en ro
unde
d to one
decim
al place fo
r inclusion in the
tab
le.

Barua • Waiting Your Turn: 2017 Report • 53
fraserinstitute.org
Tab
le 1
0, c
ont
inue
d: C
om
par
iso
n b
etw
een
med
ian
actu
al w
eeks
wai
ted
and
med
ian
reas
ona
ble
num
ber
of
wee
ks t
o w
ait
for
trea
tmen
t af
ter
app
oin
tmen
t w
ith
spec
ialis
t, b
y se
lect
ed s
pec
ialt
ies,
20
17P
roce
dur
eQ
ueb
ecN
ew B
runs
wic
kN
ova
Sco
tia
Pri
nce
Ed
war
d Is
land
New
foun
dlan
d &
Lab
rado
r
Act
ual
Rea
sona
ble
Diff
.A
ctua
lR
easo
nab
leD
iff.
Act
ual
Rea
sona
ble
Diff
.A
ctua
lR
easo
nab
leD
iff.
Act
ual
Rea
sona
ble
Diff
.
Plas
tic S
urge
ry7.
214
.8−5
2%13
.813
.06%
34.6
——
24.0
12.0
100%
19.9
24.1
−18%
Gyn
aeco
logy
6.1
8.3
−26%
11.9
15.6
−24%
9.1
9.1
−1%
——
—9.
08.
210
%
Oph
thal
mol
ogy
13.4
8.4
59%
20.5
10.1
103%
10.2
10.1
1%12
.0—
—18
.98.
013
6%
Oto
lary
ngol
ogy
7.4
8.1
−8%
15.7
10.7
46%
14.8
12.2
21%
20.7
8.4
147%
10.2
7.1
44%
Gen
eral
Sur
gery
4.7
7.5
−37%
8.3
8.8
−5%
19.4
2.2
767%
11.1
——
2.9
4.3
−32%
Neu
rosu
rger
y5.
14.
319
%—
——
14.7
17.8
−17%
——
—4.
0—
—
Ort
hopa
edic
Sur
gery
18.9
13.1
44%
32.3
18.6
73%
38.9
11.9
228%
——
—36
.628
.031
%
Car
diov
ascu
lar
Surg
ery
(Urg
ent)
0.5
0.8
−35%
——
—0.
10.
1−3
%—
——
1.0
1.0
0%
Car
diov
ascu
lar S
urge
ry (
Elec
tive)
4.5
5.6
−20%
——
—4.
04.
00%
——
—4.
84.
80%
Uro
logy
5.6
4.9
14%
7.1
5.5
29%
8.8
7.5
17%
——
—3.
05.
1−4
1%
Inte
rnal
Med
icin
e5.
73.
946
%7.
74.
285
%16
.24.
030
8%7.
74.
093
%11
.93.
325
9%
Rad
iatio
n O
ncol
ogy
2.9
3.1
−5%
2.0
——
2.8
2.5
12%
1.0
——
1.6
2.0
−18%
Med
ical
Onc
olog
y1.
02.
0−5
0%
0.5-
2.5
−80%
1.3
2.0
−35%
3.0
4.0
−25%
1.3
1.8
−27%
Wei
ghte
d M
edia
n9.
27.
817
%15
.110
.642
%16
.17.
910
4%11
.45.
710
1%8.
76.
437
%
Note: Percentag
e ch
ange
s are calculated
from
exact weigh
ted med
ians. T
he exact weigh
ted med
ians have be
en ro
unde
d to one
decim
al place fo
r inclusion in the
tab
le.

54 • Waiting Your Turn: 2017 Report • Barua
fraserinstitute.org
Table 11: Average percentage of patients receiving treatment outside Canada, 2017Procedure BC AB SK MB ON QC NB NS PE NL CAN
Plastic Surgery 1.2% 1.0% 0.0% — 0.2% 0.2% 0.0% 0.0% 0.0% 0.0% 0.5%
Gynaecology 2.1% 1.4% 1.0% 0.7% 1.5% 1.5% 0.0% 0.3% — 0.0% 1.4%
Ophthalmology 0.8% 1.1% 0.1% 1.3% 1.5% 1.0% 0.3% 0.5% — 3.0% 1.1%
Otolaryngology 1.1% 1.3% 0.0% 1.6% 1.9% 0.4% 0.5% 0.3% 0.0% 2.0% 1.1%
General Surgery 1.2% 1.5% 0.7% 0.5% 1.0% 0.3% 0.3% 3.0% — 0.0% 0.9%
Neurosurgery 1.0% 1.8% 3.0% 2.5% 2.2% 0.0% 0.0% 3.3% — 0.0% 1.9%
Orthopaedic Surgery 1.6% 1.8% 2.4% 1.9% 1.8% 0.0% 1.2% 2.1% — 0.3% 1.5%
Cardiovascular Surgery 1.7% 0.7% 0.5% 0.0% 1.4% 0.9% — 1.0% — 5.0% 1.2%
Urology 1.6% 1.6% 5.0% 1.8% 1.1% 1.2% 2.3% 0.0% — 0.3% 1.4%
Internal Medicine 2.1% 2.2% 0.4% 0.3% 3.2% 0.2% 1.2% 1.2% 0.5% 0.0% 2.1%
Radiation Oncology 1.2% 1.5% 1.5% — 0.4% 0.1% 0.0% 0.0% — 0.0% 0.6%
Medical Oncology 2.1% 0.5% 0.0% — 1.2% 0.0% 1.0% 0.0% 1.0% 0.5% 1.0%
All Specialties 1.5% 1.5% 1.3% 1.2% 1.6% 0.6% 1.0% 1.1% 0.3% 0.8% 1.3%
Table 12: Estimated number of procedures for which patients are waiting after appointment with specialist, by specialty, 2017
Procedure BC AB SK MB ON QC NB NS PE NL
Plastic Surgery 3,566 1,072 642 516 5,010 1,793 468 940 137 381
Gynaecology 3,311 6,644 1,233 1,151 9,954 3,105 1,004 831 — 1,067
Ophthalmology 38,122 17,297 2,329 9,562 62,194 33,567 3,382 3,634 390 2,731
Otolaryngology 5,333 4,833 2,418 2,184 8,243 5,121 1,057 1,024 185 536
General Surgery 17,423 15,491 4,930 6,399 26,255 7,170 1,406 10,005 928 1,255
Neurosurgery 2,388 1,611 374 101 4,136 909 — 350 — 42
Orthopaedic Surgery 29,728 13,994 4,902 6,347 46,456 22,229 4,961 7,384 — 2,089
Cardiovascular Surgery 552 213 56 1 715 220 — 5 — 12
Urology 7,672 5,111 666 1,152 18,320 3,568 1,064 2,231 — 644
Internal Medicine 12,508 14,425 3,295 3,364 10,445 2,982 544 4,235 271 2,380
Radiation Oncology 108 34 3 1 387 189 22 26 1 9
Medical Oncology 151 102 22 18 406 153 9 23 3 13
Residual 79,581 62,488 16,049 24,683 163,375 62,265 12,112 23,476 1,547 10,655
Total 200,443 143,315 36,919 55,477 355,896 143,271 26,030 54,163 3,463 21,814
Proportion of Population 4.21% 3.38% 3.21% 4.21% 2.55% 1.72% 3.44% 5.71% 2.32% 4.11%
Canada: Total number of procedures for which patients are waiting in 2017 — 1,040,791
Percentage of Population — 2.87%
Notes: Totals may not match sums of numbers for individual procedures as a result of rounding. • All data regarding oncol-ogy refer only to procedures done in hospitals. Most cancer patients are treated in cancer agencies. Therefore, the oncology data must be regarded as incomplete.
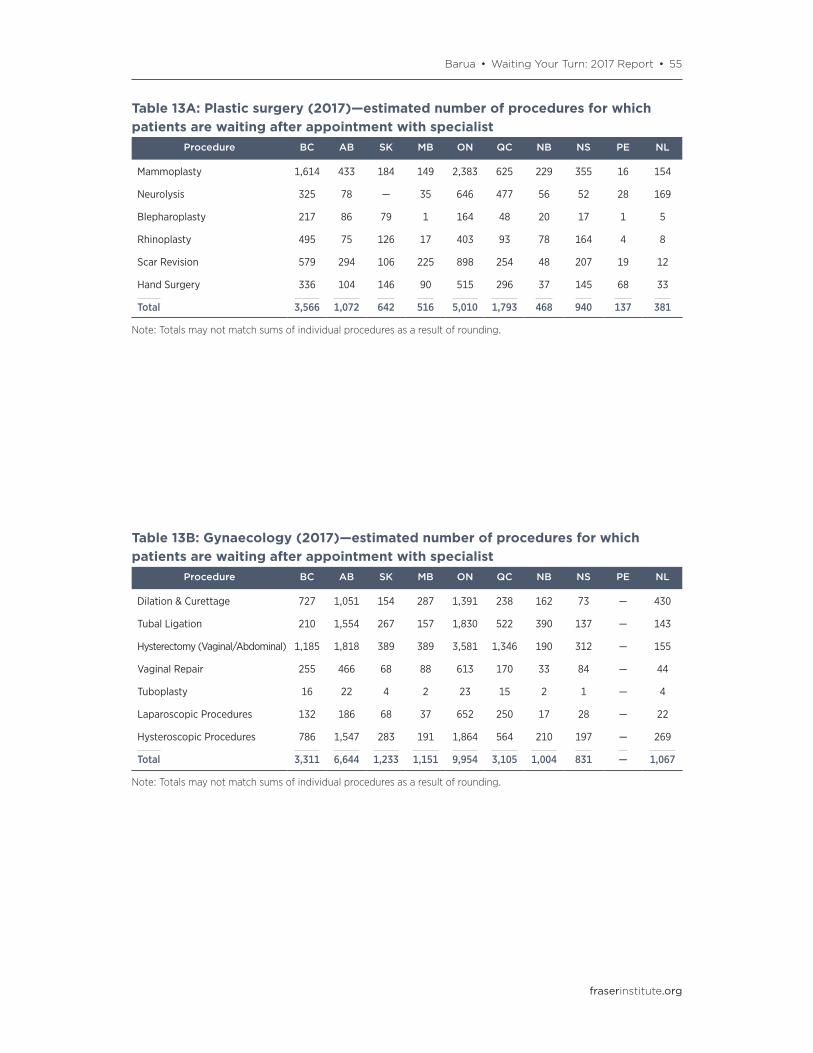
Barua • Waiting Your Turn: 2017 Report • 55
fraserinstitute.org
Table 13A: Plastic surgery (2017)—estimated number of procedures for which patients are waiting after appointment with specialist
Procedure BC AB SK MB ON QC NB NS PE NL
Mammoplasty 1,614 433 184 149 2,383 625 229 355 16 154
Neurolysis 325 78 — 35 646 477 56 52 28 169
Blepharoplasty 217 86 79 1 164 48 20 17 1 5
Rhinoplasty 495 75 126 17 403 93 78 164 4 8
Scar Revision 579 294 106 225 898 254 48 207 19 12
Hand Surgery 336 104 146 90 515 296 37 145 68 33
Total 3,566 1,072 642 516 5,010 1,793 468 940 137 381
Note: Totals may not match sums of individual procedures as a result of rounding.
Table 13B: Gynaecology (2017)—estimated number of procedures for which patients are waiting after appointment with specialist
Procedure BC AB SK MB ON QC NB NS PE NL
Dilation & Curettage 727 1,051 154 287 1,391 238 162 73 — 430
Tubal Ligation 210 1,554 267 157 1,830 522 390 137 — 143
Hysterectomy (Vaginal/Abdominal) 1,185 1,818 389 389 3,581 1,346 190 312 — 155
Vaginal Repair 255 466 68 88 613 170 33 84 — 44
Tuboplasty 16 22 4 2 23 15 2 1 — 4
Laparoscopic Procedures 132 186 68 37 652 250 17 28 — 22
Hysteroscopic Procedures 786 1,547 283 191 1,864 564 210 197 — 269
Total 3,311 6,644 1,233 1,151 9,954 3,105 1,004 831 — 1,067
Note: Totals may not match sums of individual procedures as a result of rounding.

56 • Waiting Your Turn: 2017 Report • Barua
fraserinstitute.org
Table 13C: Ophthalmology (2017)—estimated number of procedures for which patients are waiting after appointment with specialist
Procedure BC AB SK MB ON QC NB NS PE NL
Cataract Removal 32,261 14,155 1,468 8,889 55,913 23,495 3,261 3,039 390 2,693
Cornea Transplant 396 220 — 101 759 414 0 — — —
Cornea - Pterygium 141 151 15 5 319 216 10 13 — —
Iris, Ciliary Body, Sclera, Anterior Chamber
127 262 — 36 1,516 500 14 19 — 12
Retina, Choroid, Vitreous 3,987 849 639 253 872 6,083 — 309 — —
Lacrimal Duct 233 395 25 53 518 259 44 29 — 8
Strabismus 445 386 63 176 1,224 1,079 26 142 — —
Operations on Eyelids 532 880 120 48 1,072 1,521 27 83 — 18
Total 38,122 17,297 2,329 9,562 62,194 33,567 3,382 3,634 390 2,731
Note: Totals may not match sums of individual procedures as a result of rounding. • The procedure data reported generally includes only those procedures performed in public facilities. A large number of ophthalmological surgeries are performed in private facilities. The distribution of surgeries between public and private facilities varies significantly among provinces. There are also differences among provinces regarding payment or reimbursement for ophthalmo-logical surgery at a private facility.
Table 13D: Otolaryngology (2017)—estimated number of procedures for which patients are waiting after appointment with specialist
Procedure BC AB SK MB ON QC NB NS PE NL
Myringotomy 1,008 307 103 408 1,520 1,426 177 123 22 186
Tympanoplasty 375 54 152 111 322 307 113 209 15 65
Thyroid, Parathyroid, and other Endocrine Glands
471 472 47 293 1,359 573 98 38 — 37
Tonsillectomy and/or Adenoidectomy
1,153 3,034 1,287 667 2,583 1,555 448 424 89 133
Rhinoplasty and/or Septal Surgery 565 463 140 144 634 426 56 119 11 27
Operations on Nasal Sinuses 1,761 503 690 560 1,825 835 166 111 48 89
Total 5,333 4,833 2,418 2,184 8,243 5,121 1,057 1,024 185 536
Note: Totals may not match sums of individual procedures as a result of rounding.

Barua • Waiting Your Turn: 2017 Report • 57
fraserinstitute.org
Table 13E: General surgery (2017)—estimated number of procedures for which patients are waiting after appointment with specialist
Procedure BC AB SK MB ON QC NB NS PE NL
Hernia/Hydrocele 2,053 4,592 1,006 1,245 3,292 2,420 336 191 65 167
Cholecystectomy 1,583 3,897 644 1,015 2,686 1,258 343 208 52 135
Colonoscopy 6,909 2,270 1,407 1,908 6,194 883 213 2,688 491 416
Intestinal Operations 5,188 3,385 1,479 1,471 11,410 1,415 237 6,656 289 395
Haemorrhoidectomy 688 623 287 647 1,018 281 75 37 4 43
Breast Biopsy 12 3 1 2 21 17 3 58 1 21
Mastectomy 337 191 68 73 926 629 77 63 27 23
Bronchus and Lung 292 — — — 300 144 — 95 — —
Aneurysm Surgery 76 — — — 164 4 — — — —
Varicose Veins 286 531 37 39 246 119 122 9 — 55
Total 17,423 15,491 4,930 6,399 26,255 7,170 1,406 10,005 928 1,255
Note: Totals may not match sums of individual procedures as a result of rounding.
Table 13F: Neurosurgery (2017)—estimated number of procedures for which patients are waiting after appointment with specialist
Procedure BC AB SK MB ON QC NB NS PE NL
Peripheral Nerve 155 99 168 11 354 — — 27 — —
Disc Surgery/ Laminectomy 1,837 717 126 9 1,710 266 — 89 — 25
Elective Cranial Bone Flap 392 781 80 75 1,934 635 — 224 — 18
Aneurysm Surgery 5 8 0 1 56 — — 3 — —
Carotid endarterectomy — 5 — 4 84 8 — 7 — —
Total 2,388 1,611 374 101 4,136 909 — 350 — 42
Note: Totals may not match sums of individual procedures as a result of rounding.
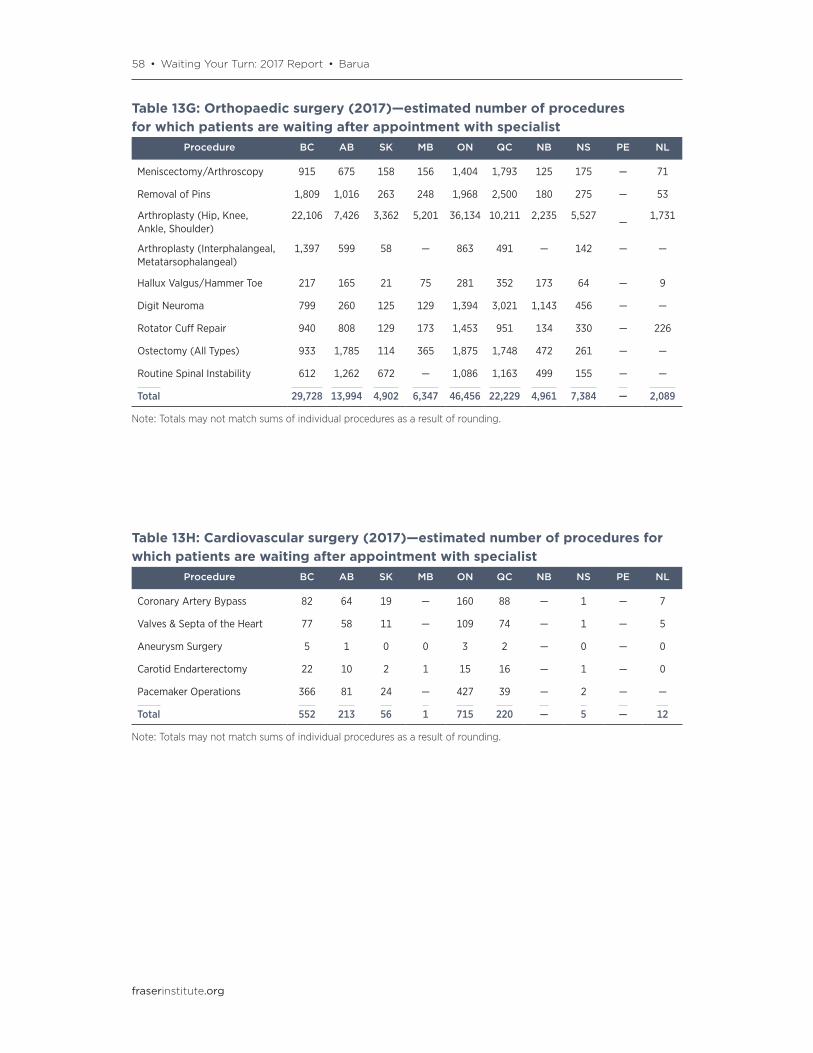
58 • Waiting Your Turn: 2017 Report • Barua
fraserinstitute.org
Table 13G: Orthopaedic surgery (2017)—estimated number of procedures for which patients are waiting after appointment with specialist
Procedure BC AB SK MB ON QC NB NS PE NL
Meniscectomy/Arthroscopy 915 675 158 156 1,404 1,793 125 175 — 71
Removal of Pins 1,809 1,016 263 248 1,968 2,500 180 275 — 53
Arthroplasty (Hip, Knee, Ankle, Shoulder)
22,106 7,426 3,362 5,201 36,134 10,211 2,235 5,527—
1,731
Arthroplasty (Interphalangeal, Metatarsophalangeal)
1,397 599 58 — 863 491 — 142 — —
Hallux Valgus/Hammer Toe 217 165 21 75 281 352 173 64 — 9
Digit Neuroma 799 260 125 129 1,394 3,021 1,143 456 — —
Rotator Cuff Repair 940 808 129 173 1,453 951 134 330 — 226
Ostectomy (All Types) 933 1,785 114 365 1,875 1,748 472 261 — —
Routine Spinal Instability 612 1,262 672 — 1,086 1,163 499 155 — —
Total 29,728 13,994 4,902 6,347 46,456 22,229 4,961 7,384 — 2,089
Note: Totals may not match sums of individual procedures as a result of rounding.
Table 13H: Cardiovascular surgery (2017)—estimated number of procedures for which patients are waiting after appointment with specialist
Procedure BC AB SK MB ON QC NB NS PE NL
Coronary Artery Bypass 82 64 19 — 160 88 — 1 — 7
Valves & Septa of the Heart 77 58 11 — 109 74 — 1 — 5
Aneurysm Surgery 5 1 0 0 3 2 — 0 — 0
Carotid Endarterectomy 22 10 2 1 15 16 — 1 — 0
Pacemaker Operations 366 81 24 — 427 39 — 2 — —
Total 552 213 56 1 715 220 — 5 — 12
Note: Totals may not match sums of individual procedures as a result of rounding.

Barua • Waiting Your Turn: 2017 Report • 59
fraserinstitute.org
Table 13I: Urology (2017)—estimated number of procedures for which patients are waiting after appointment with specialist
Procedure BC AB SK MB ON QC NB NS PE NL
Non-radical Prostatectomy 667 397 51 88 1,094 538 128 151 — 112
Radical Prostatectomy 105 132 13 53 285 129 15 31 — 11
Transurethral Resection - Bladder 443 210 58 96 1,055 591 102 90 — 33
Radical Cystectomy 20 18 — 3 66 19 4 8 — 2
Cystoscopy 4,765 3,169 416 470 10,571 800 378 1,340 — 281
Hernia/Hydrocele 1,211 899 30 270 2,424 1,186 315 471 — 130
Bladder Fulguration 454 268 98 166 2,794 280 120 134 — 72
Ureteral Reimplantation for Reflux 6 19 — 6 29 24 1 6 — 3
Total 7,672 5,111 666 1,152 18,320 3,568 1,064 2,231 — 644
Note: Totals may not match sums of individual procedures as a result of rounding.
Table 13J: Internal medicine (2017)—estimated number of procedures for which patients are waiting after appointment with specialist
Procedure BC AB SK MB ON QC NB NS PE NL
Colonoscopy 11,101 13,195 2,549 3,125 7,649 1,395 240 3,902 264 1,942
Angiography /Angioplasty 1,079 448 636 201 1,467 1,304 198 235 1 342
Bronchoscopy 106 490 20 14 873 131 42 15 1 35
Gastroscopy 222 292 89 24 455 153 63 83 5 62
Total 12,508 14,425 3,295 3,364 10,445 2,982 544 4,235 271 2,380
Note: Totals may not match sums of individual procedures as a result of rounding.

60 • Waiting Your Turn: 2017 Report • Barua
fraserinstitute.org
Table 13K: Radiation oncology (2017)—estimated number of procedures for which patients are waiting after appointment with specialist
Procedure BC AB SK MB ON QC NB NS PE NL
Radiotherapy 108 34 3 1 387 189 22 26 1 9
Note: All data regarding oncology refer only to procedures done in hospitals. Most cancer patients are treated in cancer agencies. Therefore, the oncology data must be regarded as incomplete.
Table 13L: Medical oncology (2017)—estimated number of procedures for which patients are waiting after appointment with specialist
Procedure BC AB SK MB ON QC NB NS PE NL
Chemotherapy 151 102 22 18 406 153 9 23 3 13
Note: All data regarding oncology refer only to procedures done in hospitals. Most cancer patients are treated in cancer agencies. Therefore, the oncology data must be regarded as incomplete.
Table 14: Estimated number of procedures for which patients are waiting after appointment with specialist (2017)—procedures per 100,000 population
Procedure BC AB SK MB ON QC NB NS PE NL
Plastic Surgery 75 25 56 39 36 22 62 99 92 72
Gynaecology 70 157 107 87 71 37 133 88 — 201
Ophthalmology 801 408 203 725 445 403 447 383 261 515
Otolaryngology 112 114 210 166 59 62 140 108 124 101
General Surgery 366 366 429 485 188 86 186 1,055 621 237
Neurosurgery 50 38 33 8 30 11 — 37 — 8
Orthopaedic Surgery 625 330 427 482 332 267 655 778 — 394
Cardiovascular Surgery 12 5 5 — 5 3 — 1 — 2
Urology 161 121 58 87 131 43 140 235 — 121
Internal Medicine 263 340 287 255 75 36 72 446 181 449
Radiation Oncology 2 1 — — 3 2 3 3 1 2
Medical Oncology 3 2 2 1 3 2 1 2 2 2
Note: All data regarding oncology refer only to procedures done in hospitals. Most cancer patients are treated in cancer agencies. Therefore, the oncology data must be regarded as incomplete.
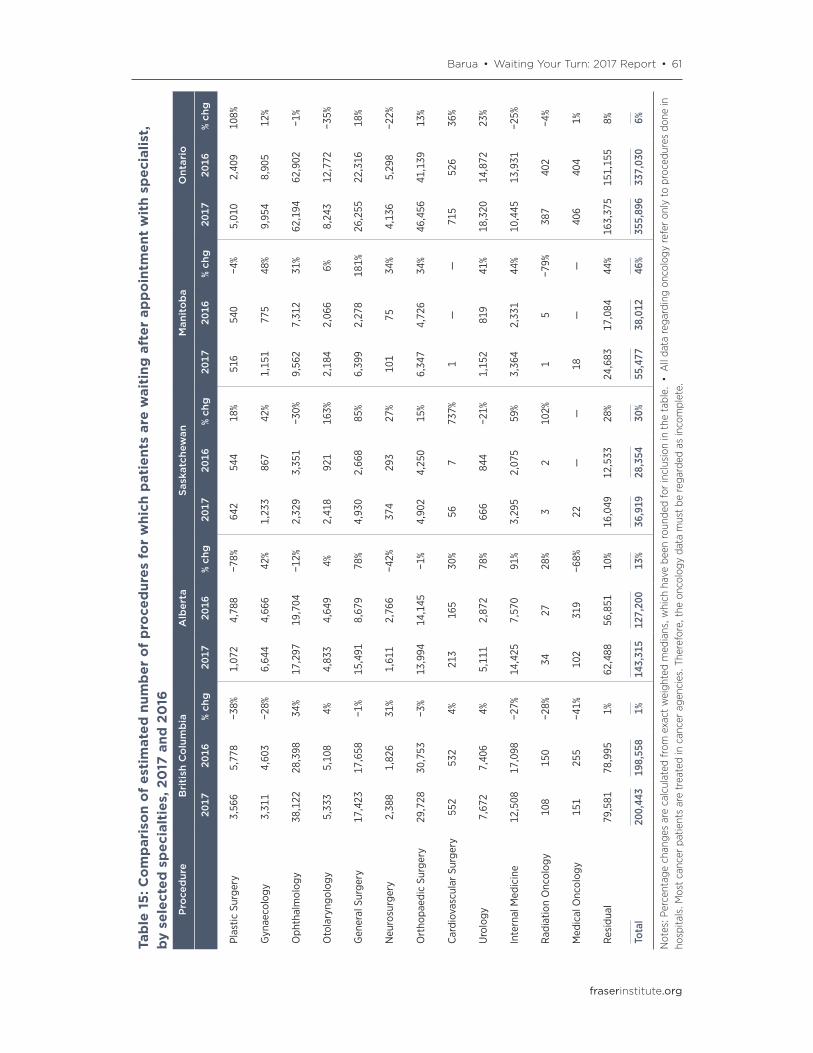
Barua • Waiting Your Turn: 2017 Report • 61
fraserinstitute.org
Tab
le 1
5: C
om
par
iso
n o
f es
tim
ated
num
ber
of
pro
ced
ures
fo
r w
hich
pat
ient
s ar
e w
aiti
ng a
fter
ap
po
intm
ent
wit
h sp
ecia
list,
by
sel
ecte
d s
pec
ialt
ies,
20
17 a
nd 2
016
Pro
ced
ure
Bri
tish
Co
lum
bia
Alb
erta
Sask
atch
ewan
Man
ito
ba
Ont
ario
2017
2016
% ch
g20
1720
16%
chg
2017
2016
% ch
g20
1720
16%
chg
2017
2016
% ch
g
Plas
tic S
urge
ry3,
566
5,77
8−3
8%1,
072
4,78
8−7
8%64
254
418
%51
654
0−4
%5,
010
2,40
910
8%
Gyn
aeco
logy
3,31
14,
603
−28%
6,64
44,
666
42%
1,23
386
742
%1,
151
775
48%
9,95
48,
905
12%
Oph
thal
mol
ogy
38,1
2228
,398
34%
17,2
9719
,704
−12%
2,32
93,
351
−30%
9,56
27,
312
31%
62,1
9462
,902
−1%
Oto
lary
ngol
ogy
5,33
35,
108
4%4,
833
4,64
94%
2,41
892
116
3%2,
184
2,06
66%
8,24
312
,772
−35%
Gen
eral
Sur
gery
17,4
2317
,658
−1%
15,4
918,
679
78%
4,93
02,
668
85%
6,39
92,
278
181%
26,2
5522
,316
18%
Neu
rosu
rger
y2,
388
1,82
631
%1,
611
2,76
6−4
2%37
429
327
%10
175
34%
4,13
65,
298
−22%
Ort
hopa
edic
Sur
gery
29,7
2830
,753
−3%
13,9
9414
,145
−1%
4,90
24,
250
15%
6,34
74,
726
34%
46,4
5641
,139
13%
Car
diov
ascu
lar
Surg
ery
552
532
4%21
316
530
%56
773
7%1
——
715
526
36%
Uro
logy
7,67
27,
406
4%5,
111
2,87
278
%66
684
4−2
1%1,
152
819
41%
18,3
2014
,872
23%
Inte
rnal
Med
icin
e12
,508
17,0
98−2
7%14
,425
7,57
091
%3,
295
2,07
559
%3,
364
2,33
144
%10
,445
13,9
31−2
5%
Rad
iatio
n O
ncol
ogy
108
150
−28%
3427
28%
32
102%
15
−79%
387
402
−4%
Med
ical
Onc
olog
y15
125
5−4
1%10
231
9−6
8%22
——
18—
—40
640
41%
Res
idua
l79
,581
78,9
951%
62,4
8856
,851
10%
16,0
4912
,533
28%
24,6
8317
,084
44%
163,
375
151,
155
8%
Tota
l20
0,44
319
8,55
81%
143,
315
127,
200
13%
36,9
1928
,354
30%
55,4
7738
,012
46%
355,
896
337,
030
6%
Notes: P
ercentag
e ch
ange
s are calculated
from
exact weigh
ted med
ians, w
hich
have be
en ro
unde
d for inclusion in the
tab
le. • All da
ta re
garding on
cology
refer on
ly to proc
edures don
e in
hospita
ls. M
ost cancer patients are treated in can
cer ag
encies. T
herefore, the
oncolog
y da
ta m
ust be
rega
rded
as inco
mplete.

62 • Waiting Your Turn: 2017 Report • Barua
fraserinstitute.org
Tab
le 1
5, c
ont
inue
d: C
om
par
iso
n o
f es
tim
ated
num
ber
of
pro
ced
ures
fo
r w
hich
pat
ient
s ar
e w
aiti
ng a
fter
ap
po
intm
ent
wit
h sp
ecia
list,
by
sele
cted
sp
ecia
ltie
s, 2
017
and
20
16P
roce
dur
eQ
ueb
ecN
ew B
runs
wic
kN
ova
Sco
tia
Pri
nce
Ed
war
d Is
land
New
foun
dla
nd &
Lab
rad
or
2017
2016
% ch
g20
1720
16%
chg
2017
2016
% ch
g20
1720
16%
chg
2017
2016
% ch
g
Plas
tic S
urge
ry1,
793
2,49
4−2
8%46
823
996
%94
01,
342
−30%
137
——
381
——
Gyn
aeco
logy
3,10
54,
405
−30%
1,00
4—
—83
199
7−1
7%—
67—
1,06
745
913
3%
Oph
thal
mol
ogy
33,5
6726
,214
28%
3,38
23,
246
4%3,
634
2,93
924
%39
043
0−9
%2,
731
1,15
413
7%
Oto
lary
ngol
ogy
5,12
15,
166
−1%
1,05
795
311
%1,
024
977
5%18
515
023
%53
677
2−3
1%
Gen
eral
Sur
gery
7,17
08,
051
−11%
1,40
62,
431
−42%
10,0
0510
,753
−7%
928
911
2%1,
255
5,61
6−7
8%
Neu
rosu
rger
y90
976
419
%—
570
—35
016
810
8%—
——
42—
—
Ort
hopa
edic
Sur
gery
22,2
2919
,676
13%
4,96
14,
568
9%7,
384
7,85
3−6
%—
——
2,08
92,
087
0%
Car
diov
ascu
lar
Surg
ery
220
302
−27%
—26
7—
537
7−9
9%—
——
1211
7%
Uro
logy
3,56
85,
347
−33%
1,06
41,
699
−37%
2,23
12,
335
−4%
——
—64
41,
245
−48%
Inte
rnal
Med
icin
e2,
982
1,97
751
%54
432
269
%4,
235
2,88
147
%27
132
3−1
6%2,
380
1,90
425
%
Rad
iatio
n O
ncol
ogy
189
229
−17%
22—
—26
2029
%1
4−6
1%9
12−2
6%
Med
ical
Onc
olog
y15
315
21%
9—
—23
34−3
3%3
321
%13
19−3
4%
Res
idua
l62
,265
57,3
099%
12,1
1213
,082
−7%
23,4
7624
,430
−4%
1,54
71,
311
18%
10,6
5513
,307
−20%
Tota
l14
3,27
113
2,08
48%
26,0
3027
,377
−5%
54,1
6355
,106
−2%
3,46
33,
198
8%21
,814
26,5
86−1
8%
Notes: P
ercentag
e ch
ange
s are calculated
from
exact weigh
ted med
ians, w
hich
have be
en ro
unde
d for inclusion in the
tab
le. • All da
ta re
garding on
cology
refer on
ly to proc
edures don
e in
hospita
ls. M
ost cancer patients are treated in can
cer ag
encies. T
herefore, the
oncolog
y da
ta m
ust be
rega
rded
as inco
mplete.
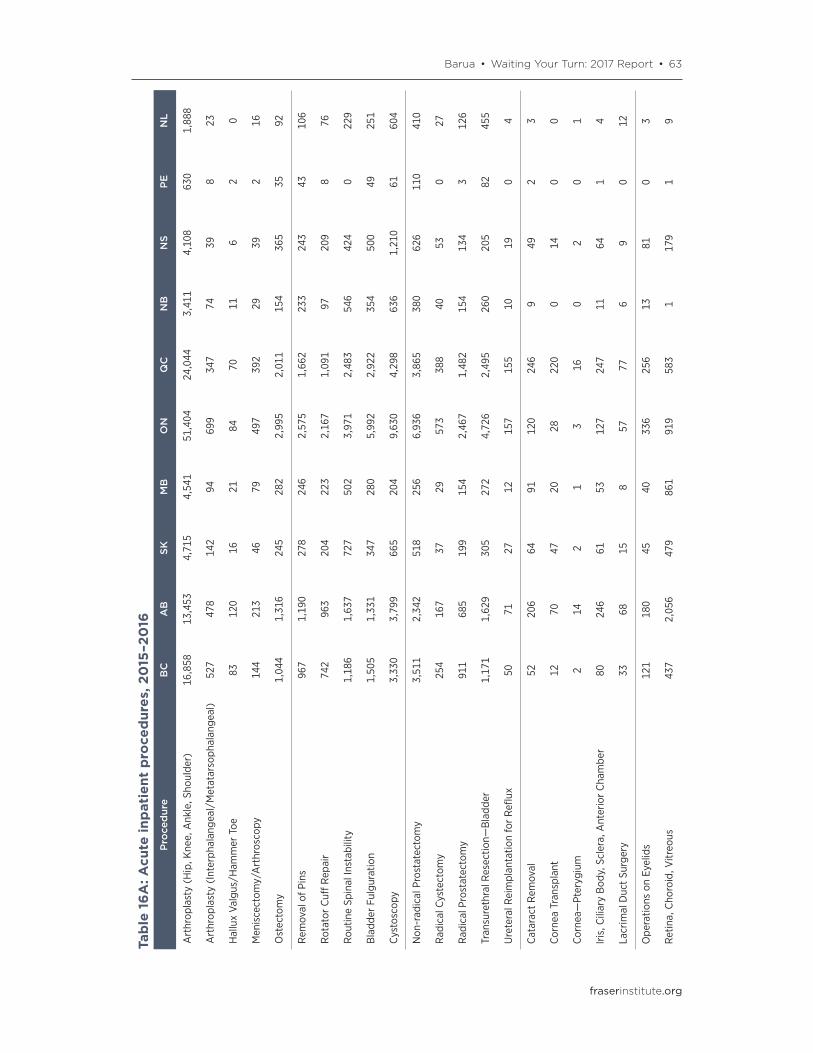
Barua • Waiting Your Turn: 2017 Report • 63
fraserinstitute.org
Tab
le 1
6A
: Acu
te in
pat
ient
pro
ced
ures
, 20
15–2
016
Pro
ced
ure
BC
AB
SKM
BO
NQ
CN
BN
SP
EN
L
Art
hrop
last
y (H
ip, K
nee,
Ank
le, S
houl
der)
16,8
5813
,453
4,71
54,
541
51,4
0424
,044
3,41
14,
108
630
1,88
8
Art
hrop
last
y (I
nter
phal
ange
al/M
etat
arso
phal
ange
al)
527
478
142
9469
934
774
398
23
Hal
lux
Valg
us/H
amm
er T
oe83
120
1621
8470
116
20
Men
isce
ctom
y/A
rthr
osco
py14
421
346
7949
739
229
392
16
Ost
ecto
my
1,04
41,
316
245
282
2,99
52,
011
154
365
3592
Rem
oval
of P
ins
967
1,19
027
824
62,
575
1,66
223
324
343
106
Rot
ator
Cuff
Rep
air
742
963
204
223
2,16
71,
091
9720
98
76
Rou
tine
Spin
al In
stab
ility
1,18
61,
637
727
502
3,97
12,
483
546
424
022
9
Bla
dder
Ful
gura
tion
1,50
51,
331
347
280
5,99
22,
922
354
500
4925
1
Cys
tosc
opy
3,33
03,
799
665
204
9,63
04,
298
636
1,21
061
604
Non
-rad
ical
Pro
stat
ecto
my
3,51
12,
342
518
256
6,93
63,
865
380
626
110
410
Rad
ical
Cys
tect
omy
254
167
3729
573
388
4053
027
Rad
ical
Pro
stat
ecto
my
911
685
199
154
2,46
71,
482
154
134
312
6
Tran
sure
thra
l Res
ectio
n—B
ladd
er1,
171
1,62
930
527
24,
726
2,49
526
020
582
455
Ure
tera
l Rei
mpl
anta
tion
for
Refl
ux50
7127
1215
715
510
190
4
Cat
arac
t R
emov
al52
206
6491
120
246
949
23
Cor
nea
Tran
spla
nt12
7047
2028
220
014
00
Cor
nea—
Pter
ygiu
m2
142
13
160
20
1
Iris
, Cili
ary
Bod
y, S
cler
a, A
nter
ior
Cha
mbe
r80
246
6153
127
247
1164
14
Lacr
imal
Duc
t Su
rger
y33
6815
857
776
90
12
Ope
ratio
ns o
n Ey
elid
s12
118
045
4033
625
613
810
3
Ret
ina,
Cho
roid
, Vitr
eous
437
2,05
647
986
191
958
31
179
19

64 • Waiting Your Turn: 2017 Report • Barua
fraserinstitute.org
Tab
le 1
6A
: Acu
te in
pat
ient
pro
ced
ures
, 20
15–2
016
Pro
ced
ure
BC
AB
SKM
BO
NQ
CN
BN
SP
EN
L
Stra
bism
us S
urge
ry22
262
147
290
40
0
Myr
ingo
tom
y24
124
767
106
1060
1165
7790
2049
Ope
ratio
ns o
n N
asal
Sin
uses
675
421
4537
711
3471
348
122
398
Thyr
oid,
Par
athy
roid
, and
Oth
er E
ndoc
rine
Gla
nds
1,56
11,
949
472
496
7,33
94,
266
415
547
3038
2
Tons
illec
tom
y an
d/or
Ade
noid
ecto
my
978
987
394
460
3,51
02,
066
263
251
105
342
Tym
pano
plas
ty85
101
109
271
191
1815
51
5
Rad
ioth
erap
y43
172
426
579,
859
2,67
738
948
274
278
Che
mot
hera
py3,
486
2,45
889
559
915
,408
7,27
389
790
250
516
Bre
ast
Bio
psy
9547
2110
263
175
267
212
Bro
nchu
s an
d Lu
ng1,
200
1107
213
414
4,33
83,
672
384
404
116
6
Cho
lecy
stec
tom
y3,
433
4,31
51,
333
1,66
28,
287
7,37
996
71,
392
165
460
Hae
mor
rhoi
dect
omy
6597
5456
191
133
1525
021
Inte
stin
al O
pera
tions
9,45
47,
189
2,35
62,
310
25,7
0616
,858
1,79
12,
513
317
1,51
6
Mas
tect
omy
1,81
91,
795
542
289
3,12
52,
157
203
442
5835
3
Varic
ose
Vein
s71
915
4641
344
40
10
Dis
k Su
rger
y/La
min
ecto
my
1,52
91,
129
269
131
4,49
41,
885
246
247
018
1
Elec
tive
Cra
nial
Bon
e Fl
ap3,
337
3,34
91,
026
956
12,4
116,
445
440
712
237
0
Ble
phar
opla
sty
96
01
2613
07
00
Mam
mop
last
y38
31,
054
8329
41,
315
685
167
136
2412
3
Scar
Rev
isio
n77
01,
384
145
332
1,61
61,
317
9819
87
94
Cor
onar
y A
rter
y B
ypas
s2,
826
1,48
564
263
28,
340
6,11
354
866
10
372
Pace
mak
er O
pera
tions
2,87
91,
914
800
778
7,05
38,
776
963
576
110
295
Tab
le 1
6A
, co
ntin
ued
: Acu
te in
pat
ient
pro
ced
ures
, 20
15–2
016
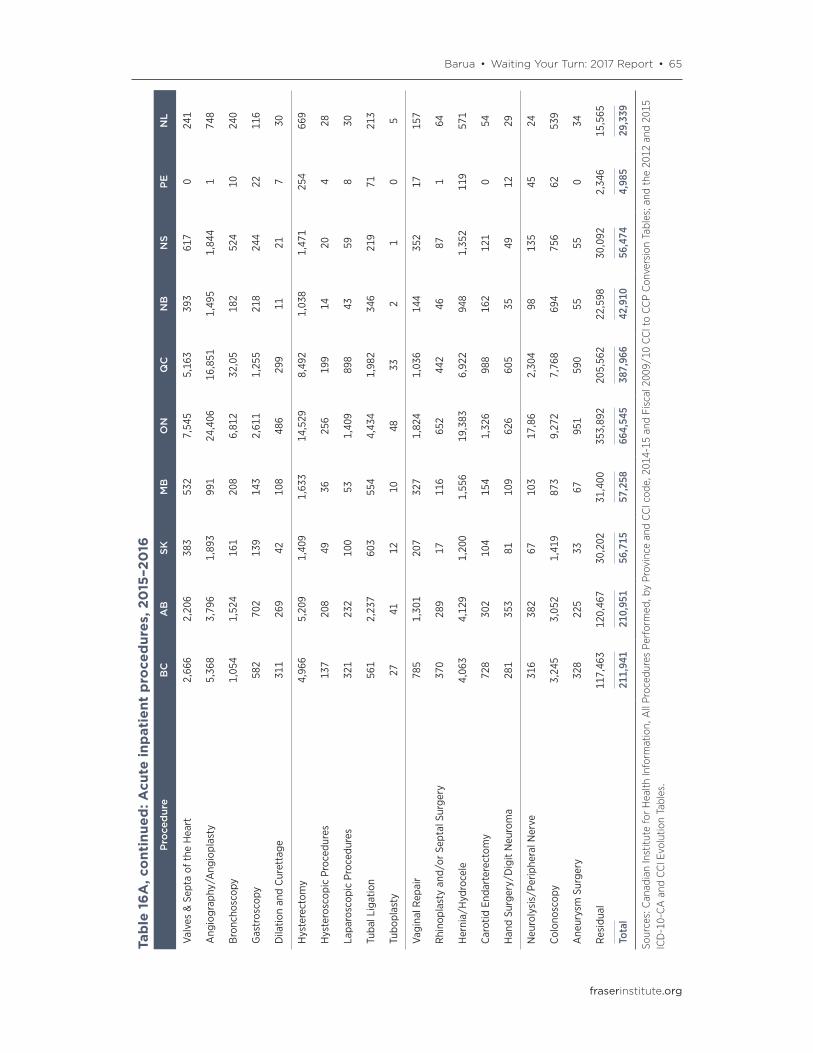
Barua • Waiting Your Turn: 2017 Report • 65
fraserinstitute.org
Tab
le 1
6A
: Acu
te in
pat
ient
pro
ced
ures
, 20
15–2
016
Pro
ced
ure
BC
AB
SKM
BO
NQ
CN
BN
SP
EN
L
Valv
es &
Sep
ta o
f the
Hea
rt2,
666
2,20
638
353
27,
545
5,16
339
361
70
241
Ang
iogr
aphy
/Ang
iopl
asty
5,36
83,
796
1,89
399
124
,406
16,8
511,
495
1,84
41
748
Bro
ncho
scop
y1,
054
1,52
416
120
86,
812
32,0
518
252
410
240
Gas
tros
copy
582
702
139
143
2,61
11,
255
218
244
2211
6
Dila
tion
and
Cur
etta
ge31
126
942
108
486
299
1121
730
Hys
tere
ctom
y4,
966
5,20
91,
409
1,63
314
,529
8,49
21,
038
1,47
125
466
9
Hys
tero
scop
ic P
roce
dure
s13
720
849
3625
619
914
204
28
Lapa
rosc
opic
Pro
cedu
res
321
232
100
531,
409
898
4359
830
Tuba
l Lig
atio
n56
12,
237
603
554
4,43
41,
982
346
219
7121
3
Tubo
plas
ty27
4112
1048
332
10
5
Vagi
nal R
epai
r78
51,
301
207
327
1,82
41,
036
144
352
1715
7
Rhi
nopl
asty
and
/or
Sept
al S
urge
ry37
028
917
116
652
442
4687
164
Her
nia/
Hyd
roce
le4,
063
4,12
91,
200
1,55
619
,383
6,92
294
81,
352
119
571
Car
otid
End
arte
rect
omy
728
302
104
154
1,32
698
816
212
10
54
Han
d Su
rger
y/D
igit
Neu
rom
a28
135
381
109
626
605
3549
1229
Neu
roly
sis/
Perip
hera
l Ner
ve31
638
267
103
17,8
62,
304
9813
545
24
Col
onos
copy
3,24
53,
052
1,41
987
39,
272
7,76
869
475
662
539
Ane
urys
m S
urge
ry32
822
533
6795
159
055
550
34
Res
idua
l11
7,46
312
0,46
730
,202
31,4
0035
3,89
220
5,56
222
,598
30,0
922,
346
15,5
65
Tota
l21
1,94
121
0,95
156
,715
57,2
5866
4,54
538
7,96
642
,910
56,4
744,
985
29,3
39
Sources: Can
adian Institu
te fo
r Hea
lth In
form
ation, All Proc
edures Perform
ed, b
y Prov
ince and
CCI cod
e, 201
4-15
and
Fiscal 2
009/
10 CCI to CCP Con
version Tables; a
nd the
201
2 an
d 20
15
ICD-10-CA and
CCI E
volutio
n Tables.
Tab
le 1
6A
, co
ntin
ued
: Acu
te in
pat
ient
pro
ced
ures
, 20
15–2
016
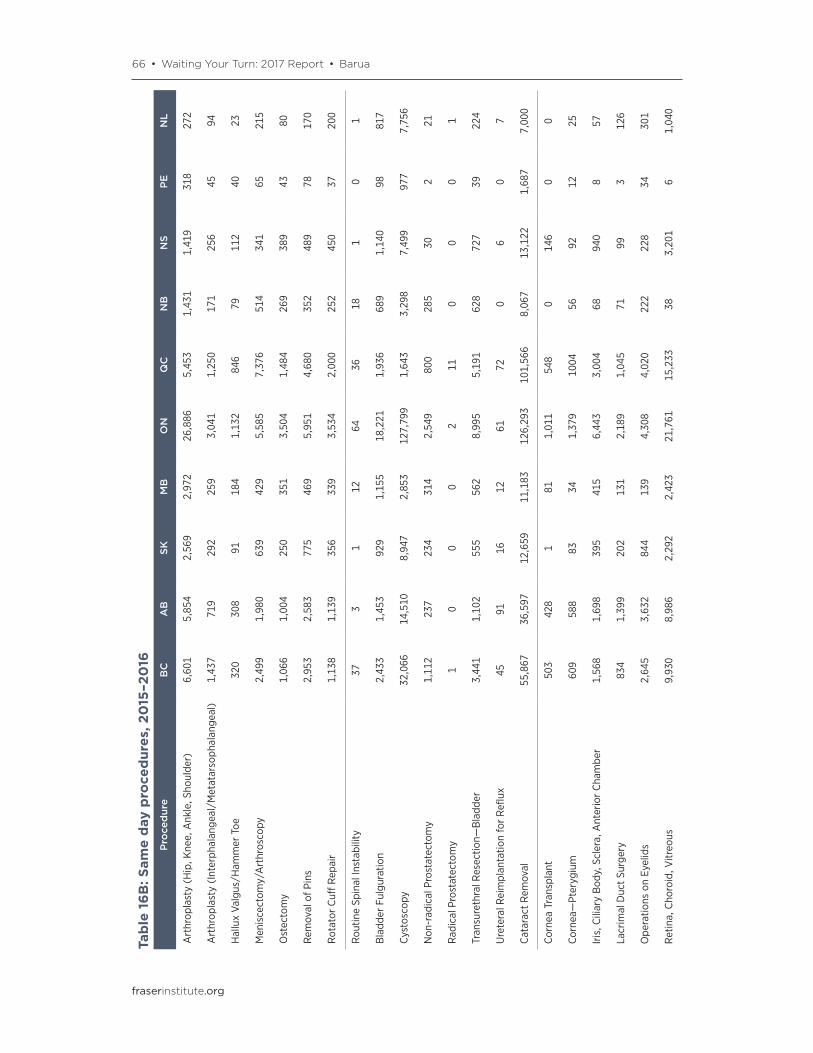
66 • Waiting Your Turn: 2017 Report • Barua
fraserinstitute.org
Tab
le 1
6B
: Sam
e d
ay p
roce
dur
es, 2
015
–20
16P
roce
dur
eB
CA
BSK
MB
ON
QC
NB
NS
PE
NL
Art
hrop
last
y (H
ip, K
nee,
Ank
le, S
houl
der)
6,60
15,
854
2,56
92,
972
26,8
865,
453
1,43
11,
419
318
272
Art
hrop
last
y (I
nter
phal
ange
al/M
etat
arso
phal
ange
al)
1,43
771
929
225
93,
041
1,25
017
125
645
94
Hal
lux
Valg
us/H
amm
er T
oe32
030
891
184
1,13
284
679
112
4023
Men
isce
ctom
y/A
rthr
osco
py2,
499
1,98
063
942
95,
585
7,37
651
434
165
215
Ost
ecto
my
1,06
61,
004
250
351
3,50
41,
484
269
389
4380
Rem
oval
of P
ins
2,95
32,
583
775
469
5,95
14,
680
352
489
7817
0
Rot
ator
Cuff
Rep
air
1,13
81,
139
356
339
3,53
42,
000
252
450
3720
0
Rou
tine
Spin
al In
stab
ility
373
112
6436
181
01
Bla
dder
Ful
gura
tion
2,43
31,
453
929
1,15
518
,221
1,93
668
91,
140
9881
7
Cys
tosc
opy
32,0
6614
,510
8,94
72,
853
127,
799
1,64
33,
298
7,49
997
77,
756
Non
-rad
ical
Pro
stat
ecto
my
1,11
223
723
431
42,
549
800
285
302
21
Rad
ical
Pro
stat
ecto
my
10
00
211
00
01
Tran
sure
thra
l Res
ectio
n—B
ladd
er3,
441
1,10
255
556
28,
995
5,19
162
872
739
224
Ure
tera
l Rei
mpl
anta
tion
for
Refl
ux45
9116
1261
720
60
7
Cat
arac
t R
emov
al55
,867
36,5
9712
,659
11,1
8312
6,29
310
1,56
68,
067
13,1
221,
687
7,00
0
Cor
nea
Tran
spla
nt50
342
81
811,
011
548
014
60
0
Cor
nea—
Pter
ygiu
m60
958
883
341,
379
1004
5692
1225
Iris
, Cili
ary
Bod
y, S
cler
a, A
nter
ior
Cha
mbe
r1,
568
1,69
839
541
56,
443
3,00
468
940
857
Lacr
imal
Duc
t Su
rger
y83
41,
399
202
131
2,18
91,
045
7199
312
6
Ope
ratio
ns o
n Ey
elid
s2,
645
3,63
284
413
94,
308
4,02
022
222
834
301
Ret
ina,
Cho
roid
, Vitr
eous
9,93
08,
986
2,29
22,
423
21,7
6115
,233
383,
201
61,
040
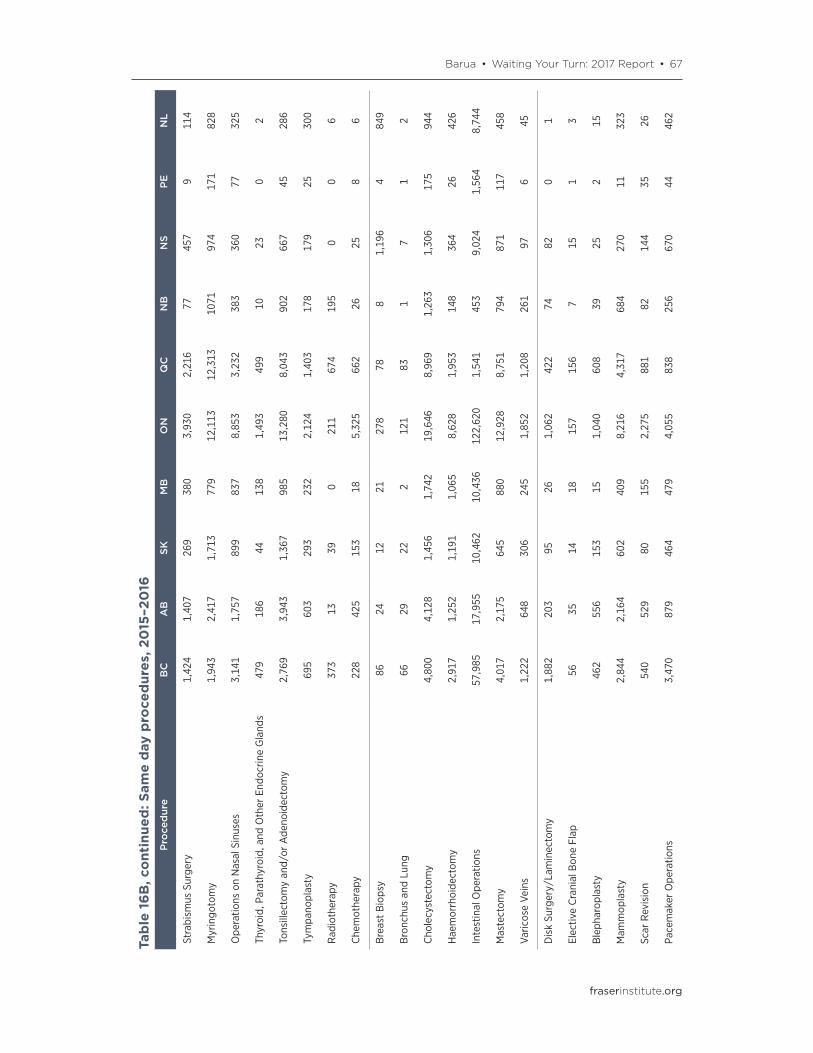
Barua • Waiting Your Turn: 2017 Report • 67
fraserinstitute.org
Tab
le 1
6B
: Sam
e d
ay p
roce
dur
es, 2
015
–20
16P
roce
dur
eB
CA
BSK
MB
ON
QC
NB
NS
PE
NL
Stra
bism
us S
urge
ry1,
424
1,40
726
938
03,
930
2,21
677
457
911
4
Myr
ingo
tom
y1,
943
2,41
71,
713
779
12,1
1312
,313
1071
974
171
828
Ope
ratio
ns o
n N
asal
Sin
uses
3,14
11,
757
899
837
8,85
33,
232
383
360
7732
5
Thyr
oid,
Par
athy
roid
, and
Oth
er E
ndoc
rine
Gla
nds
479
186
4413
81,
493
499
1023
02
Tons
illec
tom
y an
d/or
Ade
noid
ecto
my
2,76
93,
943
1,36
798
513
,280
8,04
390
266
745
286
Tym
pano
plas
ty69
560
329
323
22,
124
1,40
317
817
925
300
Rad
ioth
erap
y37
313
390
211
674
195
00
6
Che
mot
hera
py22
842
515
318
5,32
566
226
258
6
Bre
ast
Bio
psy
8624
1221
278
788
1,19
64
849
Bro
nchu
s an
d Lu
ng66
2922
212
183
17
12
Cho
lecy
stec
tom
y4,
800
4,12
81,
456
1,74
219
,646
8,96
91,
263
1,30
617
594
4
Hae
mor
rhoi
dect
omy
2,91
71,
252
1,19
11,
065
8,62
81,
953
148
364
2642
6
Inte
stin
al O
pera
tions
57,9
8517
,955
10,4
6210
,436
122,
620
1,54
145
39,
024
1,56
48,
744
Mas
tect
omy
4,01
72,
175
645
880
12,9
288,
751
794
871
117
458
Varic
ose
Vein
s1,
222
648
306
245
1,85
21,
208
261
976
45
Dis
k Su
rger
y/La
min
ecto
my
1,88
220
395
261,
062
422
7482
01
Elec
tive
Cra
nial
Bon
e Fl
ap56
3514
1815
715
67
151
3
Ble
phar
opla
sty
462
556
153
151,
040
608
3925
215
Mam
mop
last
y2,
844
2,16
460
240
98,
216
4,31
768
427
011
323
Scar
Rev
isio
n54
052
980
155
2,27
588
182
144
3526
Pace
mak
er O
pera
tions
3,47
087
946
447
94,
055
838
256
670
4446
2
Tab
le 1
6B
, co
ntin
ued
: Sam
e d
ay p
roce
dur
es, 2
015
–20
16

68 • Waiting Your Turn: 2017 Report • Barua
fraserinstitute.org
Tab
le 1
6B
: Sam
e d
ay p
roce
dur
es, 2
015
–20
16P
roce
dur
eB
CA
BSK
MB
ON
QC
NB
NS
PE
NL
Valv
es &
Sep
ta o
f the
Hea
rt4
20
00
00
00
0
Ang
iogr
aphy
/Ang
iopl
asty
8,65
586
886
53,
182
1,02
910
356
819
021
1472
Bro
ncho
scop
y79
02,
113
139
194
4,54
119
410
826
418
363
Gas
tros
copy
1,06
956
224
836
33,
305
7069
457
4221
4
Dila
tion
and
Cur
etta
ge5,
987
6,56
21,
293
1,75
617
,594
4,65
698
299
527
02,
204
Hys
tere
ctom
y16
942
276
5398
825
93
21
2
Hys
tero
scop
ic P
roce
dure
s4,
975
5,98
01,
422
1,20
610
,514
4,68
91,
198
1,00
224
52,
304
Lapa
rosc
opic
Pro
cedu
res
489
374
220
189
1,82
273
058
8624
64
Tuba
l Lig
atio
n53
11,
803
785
464
5,08
32,
542
498
493
8338
3
Tubo
plas
ty11
123
153
6118
32
27
Vagi
nal R
epai
r31
821
289
5583
143
336
447
33
Rhi
nopl
asty
and
/or
Sept
al S
urge
ry1,
948
1,17
541
735
26,
009
2,54
025
530
426
116
Her
nia/
Hyd
roce
le11
,110
9,13
12,
551
2,85
329
,682
21,7
602,
083
2,17
930
112
,18
Han
d Su
rger
y/D
igit
Neu
rom
a3,
669
1,94
11,
160
1,07
29,
300
7,36
183
71,
240
136
607
Neu
roly
sis/
Perip
hera
l Ner
ve1,
317
698
314
240
4,46
01,
677
317
174
1633
6
Col
onos
copy
85,1
5741
,535
17,7
5820
,936
137,
991
2,40
11,
271
15,9
593,
154
13,8
89
Ane
urys
m S
urge
ry2
10
02
10
00
0
Res
idua
l17
1,60
510
2,08
450
,832
47,3
1661
7,58
513
8,84
919
,216
44,1
294,
728
47,7
11
Tota
l 5
16,4
10
300
,745
1
30,7
93
123
,413
1
,451
,712
4
06,3
28
50,
922
114
,963
1
4,88
7 1
03,5
18
Sources: Can
adian Institu
te fo
r Hea
lth In
form
ation, All Proc
edures Perform
ed, b
y Prov
ince and
CCI cod
e, 201
5-16
; Fiscal 2
009/
10 CCI to CCP Con
version Tables; a
nd the
201
2 an
d 20
15 IC
D-
10-CA and
CCI E
volutio
n Tables.
Tab
le 1
6B
, co
ntin
ued
: Sam
e d
ay p
roce
dur
es, 2
015
–20
16
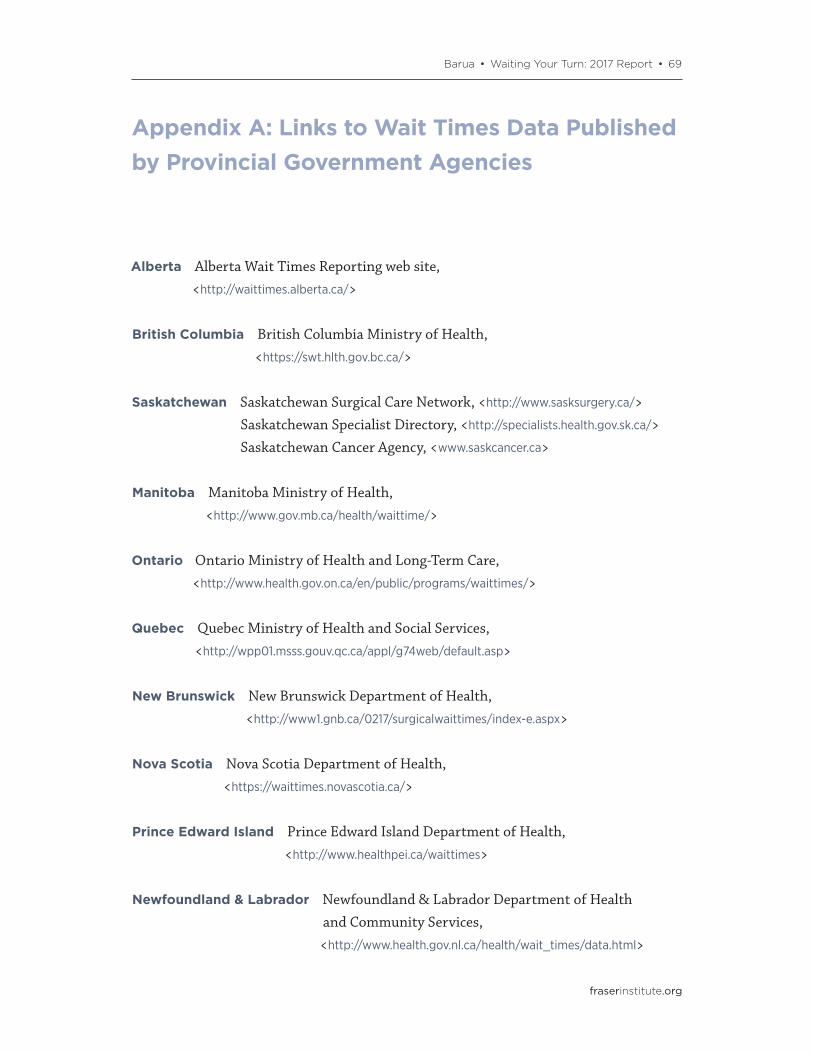
Barua • Waiting Your Turn: 2017 Report • 69
fraserinstitute.org
Appendix A: Links to Wait Times Data Published by Provincial Government Agencies
Alberta Alberta Wait Times Reporting web site, <http://waittimes.alberta.ca/>
British Columbia British Columbia Ministry of Health, <https://swt.hlth.gov.bc.ca/>
Saskatchewan Saskatchewan Surgical Care Network, <http://www.sasksurgery.ca/> Saskatchewan Specialist Directory, <http://specialists.health.gov.sk.ca/> Saskatchewan Cancer Agency, <www.saskcancer.ca>
Manitoba Manitoba Ministry of Health, <http://www.gov.mb.ca/health/waittime/>
Ontario Ontario Ministry of Health and Long-Term Care, <http://www.health.gov.on.ca/en/public/programs/waittimes/>
Quebec Quebec Ministry of Health and Social Services, <http://wpp01.msss.gouv.qc.ca/appl/g74web/default.asp>
New Brunswick New Brunswick Department of Health, <http://www1.gnb.ca/0217/surgicalwaittimes/index-e.aspx>
Nova Scotia Nova Scotia Department of Health, <https://waittimes.novascotia.ca/>
Prince Edward Island Prince Edward Island Department of Health, <http://www.healthpei.ca/waittimes>
Newfoundland & Labrador Newfoundland & Labrador Department of Health and Community Services, <http://www.health.gov.nl.ca/health/wait_times/data.html>
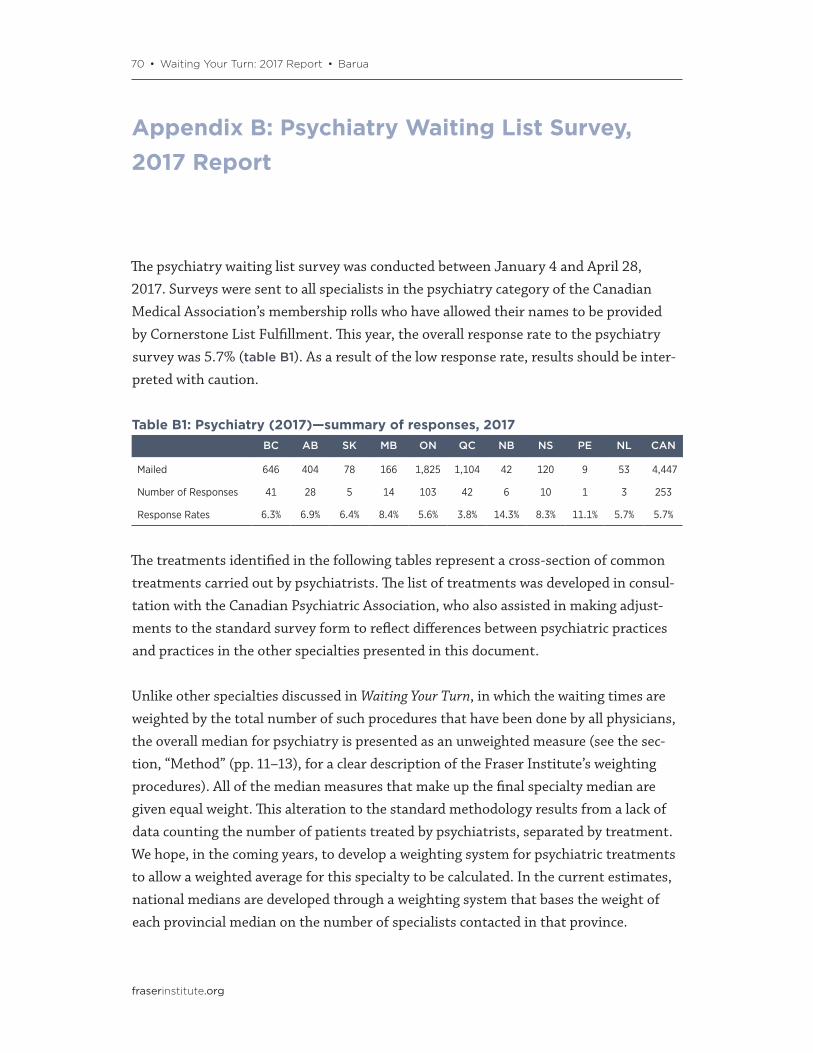
70 • Waiting Your Turn: 2017 Report • Barua
fraserinstitute.org
Appendix B: Psychiatry Waiting List Survey, 2017 Report
The psychiatry waiting list survey was conducted between January 4 and April 28, 2017. Surveys were sent to all specialists in the psychiatry category of the Canadian Medical Association’s membership rolls who have allowed their names to be provided by Cornerstone List Fulfillment. This year, the overall response rate to the psychiatry survey was 5.7% (table B1). As a result of the low response rate, results should be inter-preted with caution.
The treatments identified in the following tables represent a cross-section of common treatments carried out by psychiatrists. The list of treatments was developed in consul-tation with the Canadian Psychiatric Association, who also assisted in making adjust-ments to the standard survey form to reflect differences between psychiatric practices and practices in the other specialties presented in this document.
Unlike other specialties discussed in Waiting Your Turn, in which the waiting times are weighted by the total number of such procedures that have been done by all physicians, the overall median for psychiatry is presented as an unweighted measure (see the sec-tion, “Method” (pp. 11–13), for a clear description of the Fraser Institute’s weighting procedures). All of the median measures that make up the final specialty median are given equal weight. This alteration to the standard methodology results from a lack of data counting the number of patients treated by psychiatrists, separated by treatment. We hope, in the coming years, to develop a weighting system for psychiatric treatments to allow a weighted average for this specialty to be calculated. In the current estimates, national medians are developed through a weighting system that bases the weight of each provincial median on the number of specialists contacted in that province.
Table B1: Psychiatry (2017)—summary of responses, 2017BC AB SK MB ON QC NB NS PE NL CAN
Mailed 646 404 78 166 1,825 1,104 42 120 9 53 4,447
Number of Responses 41 28 5 14 103 42 6 10 1 3 253
Response Rates 6.3% 6.9% 6.4% 8.4% 5.6% 3.8% 14.3% 8.3% 11.1% 5.7% 5.7%

Barua • Waiting Your Turn: 2017 Report • 71
fraserinstitute.org
FindingsTotal wait times
Across the provinces, the total wait time (between referral by a general practitioner and the time that the required elective treatment begins) for psychiatry has fallen from 20.8 weeks in 2016 to 19.4 weeks in 2017 (graph B1). The shortest waiting times are in Quebec (14.4 weeks), Manitoba (16.1 weeks), and British Columbia (17.9 weeks). The longest total waits are in Newfoundland & Labrador (93.5 weeks), New Brunswick (37.5 weeks), and Prince Edward Island (33.0 weeks).
0 20 40 60 80 100
Canada
Newfoundland & Labrador
Prince Edward Island
Nova Scotia
New Brunswick
Quebec
Ontario
Manitoba
Saskatchewan
Alberta
British Columbia
Wait from specialist to treatmentWait from GP to specialist (elective)
7.0 10.9 17.9
8.0 13.4 21.4
12.0 7.2 19.2
6.0 10.1 16.1
9.5 9.9 19.4
5.5 8.9 14.4
24.0 13.5 37.5
33.0
5.0
5.0
25.4
28.0
30.4
72.0 21.5 93.5
8.7 10.7 19.4
Weeks waited
Note: Totals may not equal the sum of subtotals as a result of rounding.Source: The Fraser Institute’s national waiting list survey, 2017.
Graph B1: Psychiatry—weeks waited from referral by GP to
treatment, by province, 2017
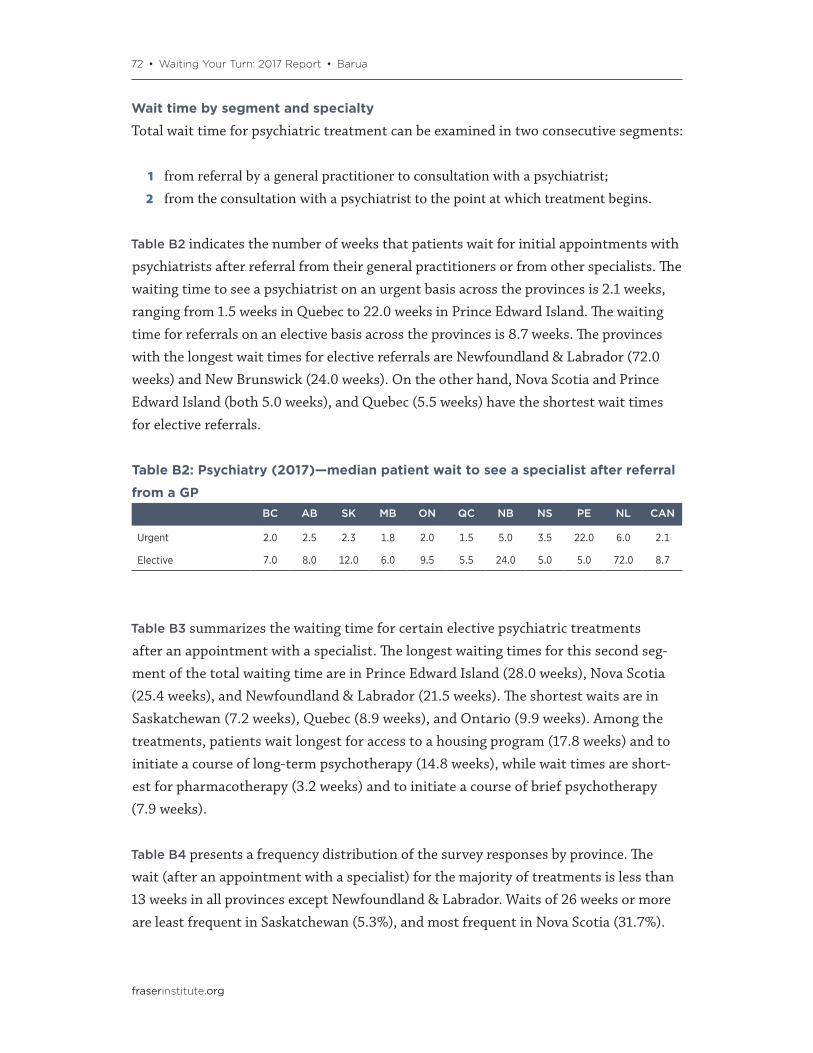
72 • Waiting Your Turn: 2017 Report • Barua
fraserinstitute.org
Wait time by segment and specialty
Total wait time for psychiatric treatment can be examined in two consecutive segments:
1 from referral by a general practitioner to consultation with a psychiatrist; 2 from the consultation with a psychiatrist to the point at which treatment begins.
Table B2 indicates the number of weeks that patients wait for initial appointments with psychiatrists after referral from their general practitioners or from other specialists. The waiting time to see a psychiatrist on an urgent basis across the provinces is 2.1 weeks, ranging from 1.5 weeks in Quebec to 22.0 weeks in Prince Edward Island. The waiting time for referrals on an elective basis across the provinces is 8.7 weeks. The provinces with the longest wait times for elective referrals are Newfoundland & Labrador (72.0 weeks) and New Brunswick (24.0 weeks). On the other hand, Nova Scotia and Prince Edward Island (both 5.0 weeks), and Quebec (5.5 weeks) have the shortest wait times for elective referrals.
Table B3 summarizes the waiting time for certain elective psychiatric treatments after an appointment with a specialist. The longest waiting times for this second seg-ment of the total waiting time are in Prince Edward Island (28.0 weeks), Nova Scotia (25.4 weeks), and Newfoundland & Labrador (21.5 weeks). The shortest waits are in Saskatchewan (7.2 weeks), Quebec (8.9 weeks), and Ontario (9.9 weeks). Among the treatments, patients wait longest for access to a housing program (17.8 weeks) and to initiate a course of long-term psychotherapy (14.8 weeks), while wait times are short-est for pharmacotherapy (3.2 weeks) and to initiate a course of brief psychotherapy (7.9 weeks).
Table B4 presents a frequency distribution of the survey responses by province. The wait (after an appointment with a specialist) for the majority of treatments is less than 13 weeks in all provinces except Newfoundland & Labrador. Waits of 26 weeks or more are least frequent in Saskatchewan (5.3%), and most frequent in Nova Scotia (31.7%).
Table B2: Psychiatry (2017)—median patient wait to see a specialist after referral
from a GPBC AB SK MB ON QC NB NS PE NL CAN
Urgent 2.0 2.5 2.3 1.8 2.0 1.5 5.0 3.5 22.0 6.0 2.1
Elective 7.0 8.0 12.0 6.0 9.5 5.5 24.0 5.0 5.0 72.0 8.7
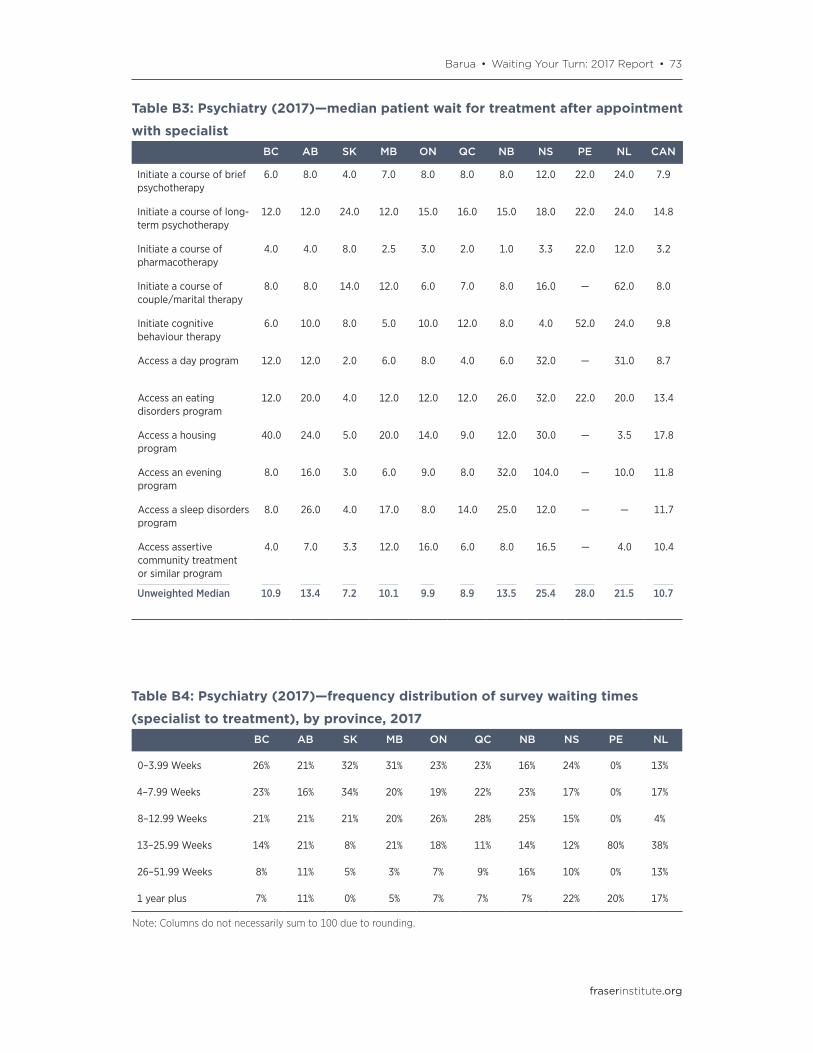
Barua • Waiting Your Turn: 2017 Report • 73
fraserinstitute.org
Table B4: Psychiatry (2017)—frequency distribution of survey waiting times
(specialist to treatment), by province, 2017BC AB SK MB ON QC NB NS PE NL
0–3.99 Weeks 26% 21% 32% 31% 23% 23% 16% 24% 0% 13%
4–7.99 Weeks 23% 16% 34% 20% 19% 22% 23% 17% 0% 17%
8–12.99 Weeks 21% 21% 21% 20% 26% 28% 25% 15% 0% 4%
13–25.99 Weeks 14% 21% 8% 21% 18% 11% 14% 12% 80% 38%
26–51.99 Weeks 8% 11% 5% 3% 7% 9% 16% 10% 0% 13%
1 year plus 7% 11% 0% 5% 7% 7% 7% 22% 20% 17%
Note: Columns do not necessarily sum to 100 due to rounding.
Table B3: Psychiatry (2017)—median patient wait for treatment after appointment
with specialistBC AB SK MB ON QC NB NS PE NL CAN
Initiate a course of brief psychotherapy
6.0 8.0 4.0 7.0 8.0 8.0 8.0 12.0 22.0 24.0 7.9
Initiate a course of long-term psychotherapy
12.0 12.0 24.0 12.0 15.0 16.0 15.0 18.0 22.0 24.0 14.8
Initiate a course of pharmacotherapy
4.0 4.0 8.0 2.5 3.0 2.0 1.0 3.3 22.0 12.0 3.2
Initiate a course of couple/marital therapy
8.0 8.0 14.0 12.0 6.0 7.0 8.0 16.0 — 62.0 8.0
Initiate cognitive behaviour therapy
6.0 10.0 8.0 5.0 10.0 12.0 8.0 4.0 52.0 24.0 9.8
Access a day program 12.0 12.0 2.0 6.0 8.0 4.0 6.0 32.0 — 31.0 8.7
Access an eating disorders program
12.0 20.0 4.0 12.0 12.0 12.0 26.0 32.0 22.0 20.0 13.4
Access a housing program
40.0 24.0 5.0 20.0 14.0 9.0 12.0 30.0 — 3.5 17.8
Access an evening program
8.0 16.0 3.0 6.0 9.0 8.0 32.0 104.0 — 10.0 11.8
Access a sleep disorders program
8.0 26.0 4.0 17.0 8.0 14.0 25.0 12.0 — — 11.7
Access assertive community treatment or similar program
4.0 7.0 3.3 12.0 16.0 6.0 8.0 16.5 — 4.0 10.4
Unweighted Median 10.9 13.4 7.2 10.1 9.9 8.9 13.5 25.4 28.0 21.5 10.7
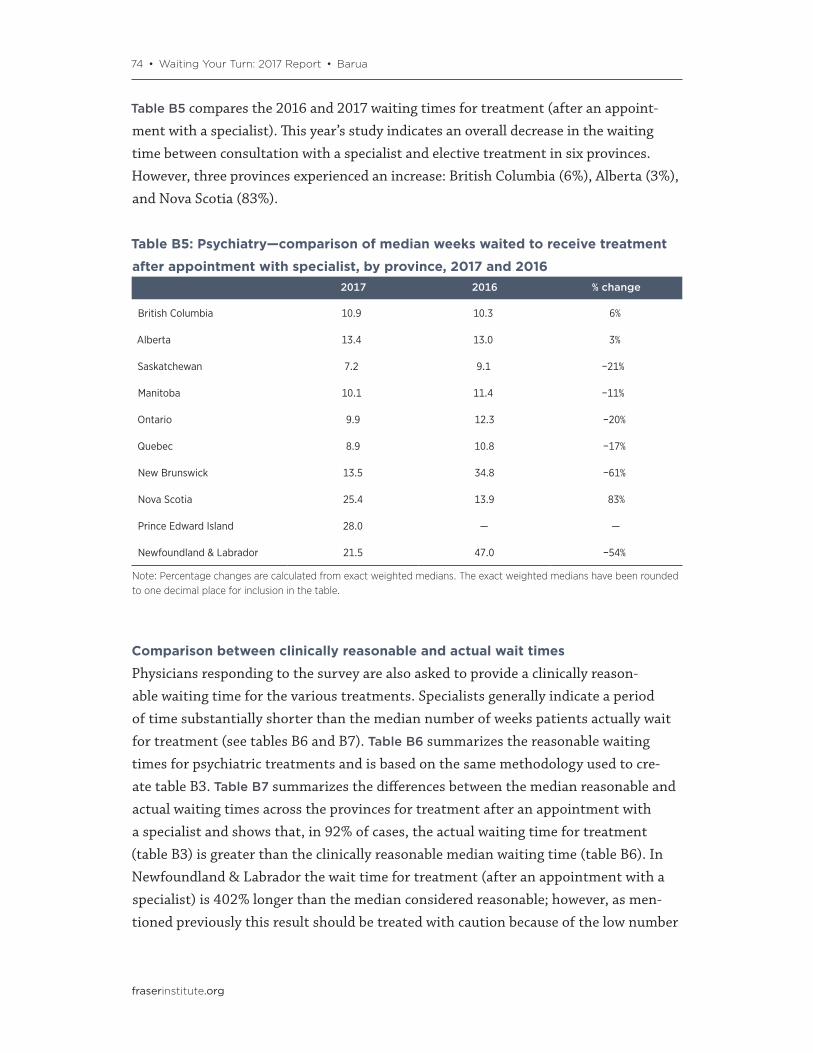
74 • Waiting Your Turn: 2017 Report • Barua
fraserinstitute.org
Table B5 compares the 2016 and 2017 waiting times for treatment (after an appoint-ment with a specialist). This year’s study indicates an overall decrease in the waiting time between consultation with a specialist and elective treatment in six provinces. However, three provinces experienced an increase: British Columbia (6%), Alberta (3%), and Nova Scotia (83%).
Comparison between clinically reasonable and actual wait times
Physicians responding to the survey are also asked to provide a clinically reason-able waiting time for the various treatments. Specialists generally indicate a period of time substantially shorter than the median number of weeks patients actually wait for treatment (see tables B6 and B7). Table B6 summarizes the reasonable waiting times for psychiatric treatments and is based on the same methodology used to cre-ate table B3. Table B7 summarizes the differences between the median reasonable and actual waiting times across the provinces for treatment after an appointment with a specialist and shows that, in 92% of cases, the actual waiting time for treatment (table B3) is greater than the clinically reasonable median waiting time (table B6). In Newfoundland & Labrador the wait time for treatment (after an appointment with a specialist) is 402% longer than the median considered reasonable; however, as men-tioned previously this result should be treated with caution because of the low number
Table B5: Psychiatry—comparison of median weeks waited to receive treatment
after appointment with specialist, by province, 2017 and 20162017 2016 % change
British Columbia 10.9 10.3 6%
Alberta 13.4 13.0 3%
Saskatchewan 7.2 9.1 −21%
Manitoba 10.1 11.4 −11%
Ontario 9.9 12.3 −20%
Quebec 8.9 10.8 −17%
New Brunswick 13.5 34.8 −61%
Nova Scotia 25.4 13.9 83%
Prince Edward Island 28.0 — —
Newfoundland & Labrador 21.5 47.0 −54%
Note: Percentage changes are calculated from exact weighted medians. The exact weighted medians have been rounded to one decimal place for inclusion in the table.
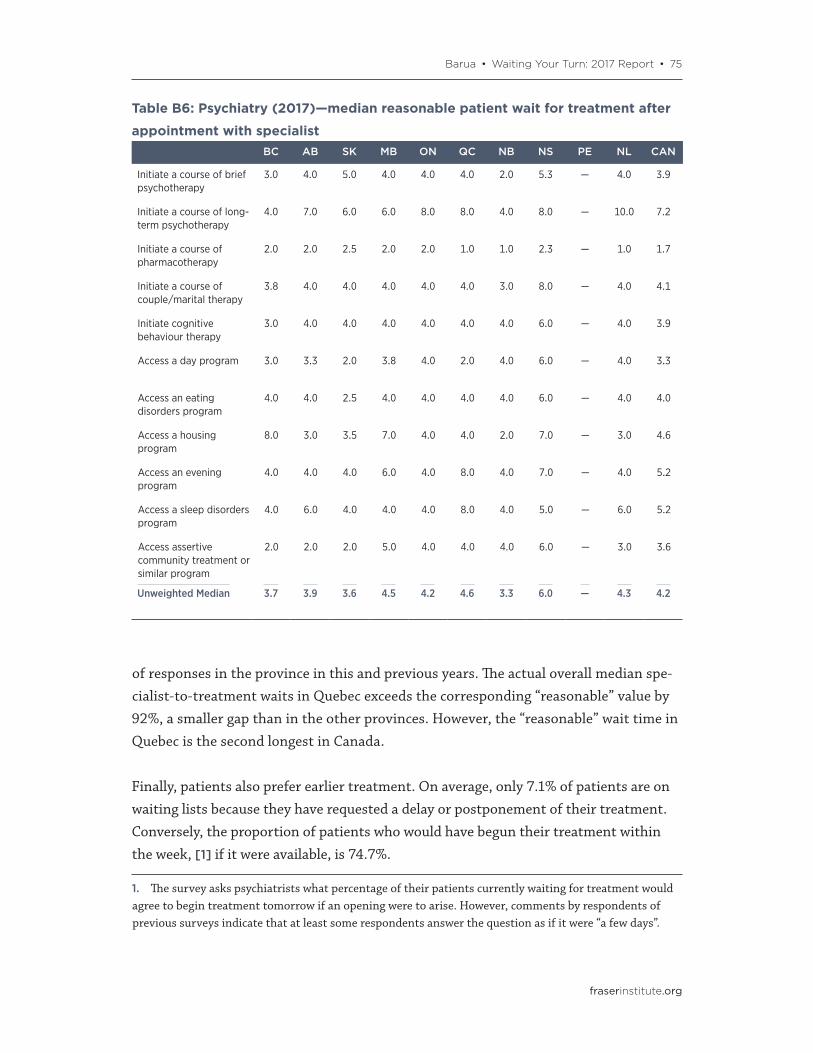
Barua • Waiting Your Turn: 2017 Report • 75
fraserinstitute.org
of responses in the province in this and previous years. The actual overall median spe-cialist-to-treatment waits in Quebec exceeds the corresponding “reasonable” value by 92%, a smaller gap than in the other provinces. However, the “reasonable” wait time in Quebec is the second longest in Canada.
Finally, patients also prefer earlier treatment. On average, only 7.1% of patients are on waiting lists because they have requested a delay or postponement of their treatment. Conversely, the proportion of patients who would have begun their treatment within the week, [1] if it were available, is 74.7%.
1. The survey asks psychiatrists what percentage of their patients currently waiting for treatment would agree to begin treatment tomorrow if an opening were to arise. However, comments by respondents of previous surveys indicate that at least some respondents answer the question as if it were “a few days”.
Table B6: Psychiatry (2017)—median reasonable patient wait for treatment after
appointment with specialistBC AB SK MB ON QC NB NS PE NL CAN
Initiate a course of brief psychotherapy
3.0 4.0 5.0 4.0 4.0 4.0 2.0 5.3 — 4.0 3.9
Initiate a course of long-term psychotherapy
4.0 7.0 6.0 6.0 8.0 8.0 4.0 8.0 — 10.0 7.2
Initiate a course of pharmacotherapy
2.0 2.0 2.5 2.0 2.0 1.0 1.0 2.3 — 1.0 1.7
Initiate a course of couple/marital therapy
3.8 4.0 4.0 4.0 4.0 4.0 3.0 8.0 — 4.0 4.1
Initiate cognitive behaviour therapy
3.0 4.0 4.0 4.0 4.0 4.0 4.0 6.0 — 4.0 3.9
Access a day program 3.0 3.3 2.0 3.8 4.0 2.0 4.0 6.0 — 4.0 3.3
Access an eating disorders program
4.0 4.0 2.5 4.0 4.0 4.0 4.0 6.0 — 4.0 4.0
Access a housing program
8.0 3.0 3.5 7.0 4.0 4.0 2.0 7.0 — 3.0 4.6
Access an evening program
4.0 4.0 4.0 6.0 4.0 8.0 4.0 7.0 — 4.0 5.2
Access a sleep disorders program
4.0 6.0 4.0 4.0 4.0 8.0 4.0 5.0 — 6.0 5.2
Access assertive community treatment or similar program
2.0 2.0 2.0 5.0 4.0 4.0 4.0 6.0 — 3.0 3.6
Unweighted Median 3.7 3.9 3.6 4.5 4.2 4.6 3.3 6.0 — 4.3 4.2
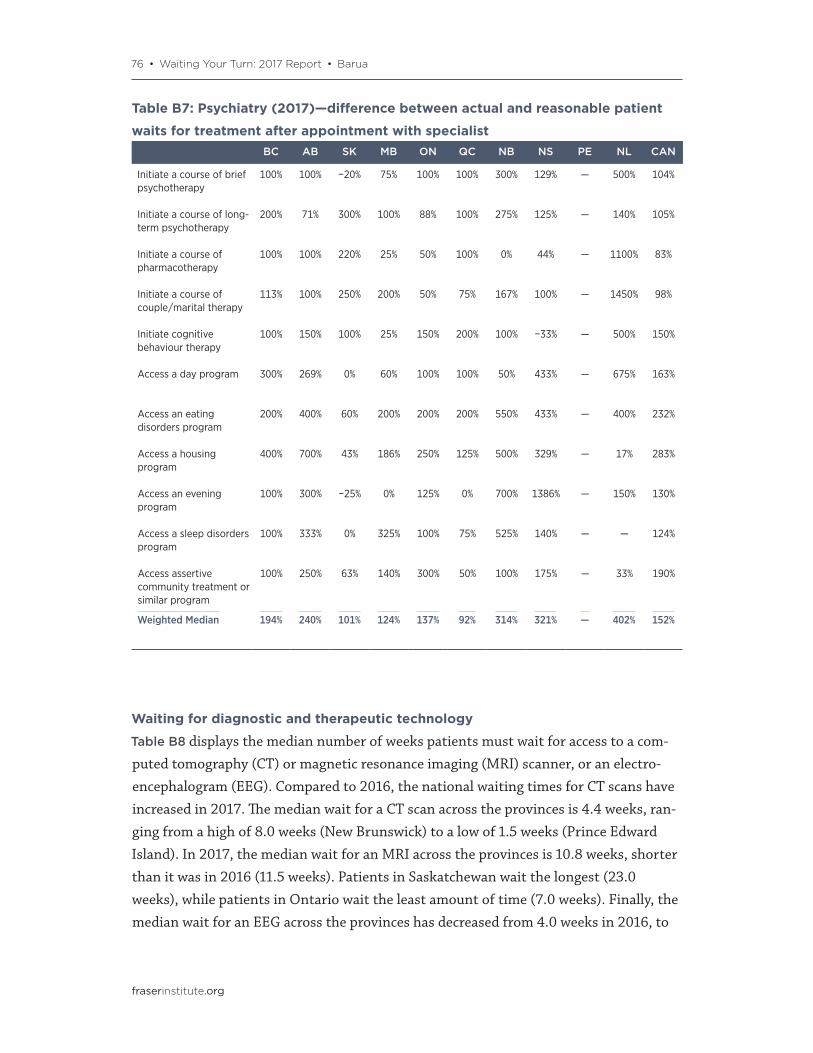
76 • Waiting Your Turn: 2017 Report • Barua
fraserinstitute.org
Waiting for diagnostic and therapeutic technology
Table B8 displays the median number of weeks patients must wait for access to a com-puted tomography (CT) or magnetic resonance imaging (MRI) scanner, or an electro-encephalogram (EEG). Compared to 2016, the national waiting times for CT scans have increased in 2017. The median wait for a CT scan across the provinces is 4.4 weeks, ran-ging from a high of 8.0 weeks (New Brunswick) to a low of 1.5 weeks (Prince Edward Island). In 2017, the median wait for an MRI across the provinces is 10.8 weeks, shorter than it was in 2016 (11.5 weeks). Patients in Saskatchewan wait the longest (23.0 weeks), while patients in Ontario wait the least amount of time (7.0 weeks). Finally, the median wait for an EEG across the provinces has decreased from 4.0 weeks in 2016, to
Table B7: Psychiatry (2017)—difference between actual and reasonable patient
waits for treatment after appointment with specialistBC AB SK MB ON QC NB NS PE NL CAN
Initiate a course of brief psychotherapy
100% 100% −20% 75% 100% 100% 300% 129% — 500% 104%
Initiate a course of long-term psychotherapy
200% 71% 300% 100% 88% 100% 275% 125% — 140% 105%
Initiate a course of pharmacotherapy
100% 100% 220% 25% 50% 100% 0% 44% — 1100% 83%
Initiate a course of couple/marital therapy
113% 100% 250% 200% 50% 75% 167% 100% — 1450% 98%
Initiate cognitive behaviour therapy
100% 150% 100% 25% 150% 200% 100% −33% — 500% 150%
Access a day program 300% 269% 0% 60% 100% 100% 50% 433% — 675% 163%
Access an eating disorders program
200% 400% 60% 200% 200% 200% 550% 433% — 400% 232%
Access a housing program
400% 700% 43% 186% 250% 125% 500% 329% — 17% 283%
Access an evening program
100% 300% −25% 0% 125% 0% 700% 1386% — 150% 130%
Access a sleep disorders program
100% 333% 0% 325% 100% 75% 525% 140% — — 124%
Access assertive community treatment or similar program
100% 250% 63% 140% 300% 50% 100% 175% — 33% 190%
Weighted Median 194% 240% 101% 124% 137% 92% 314% 321% — 402% 152%
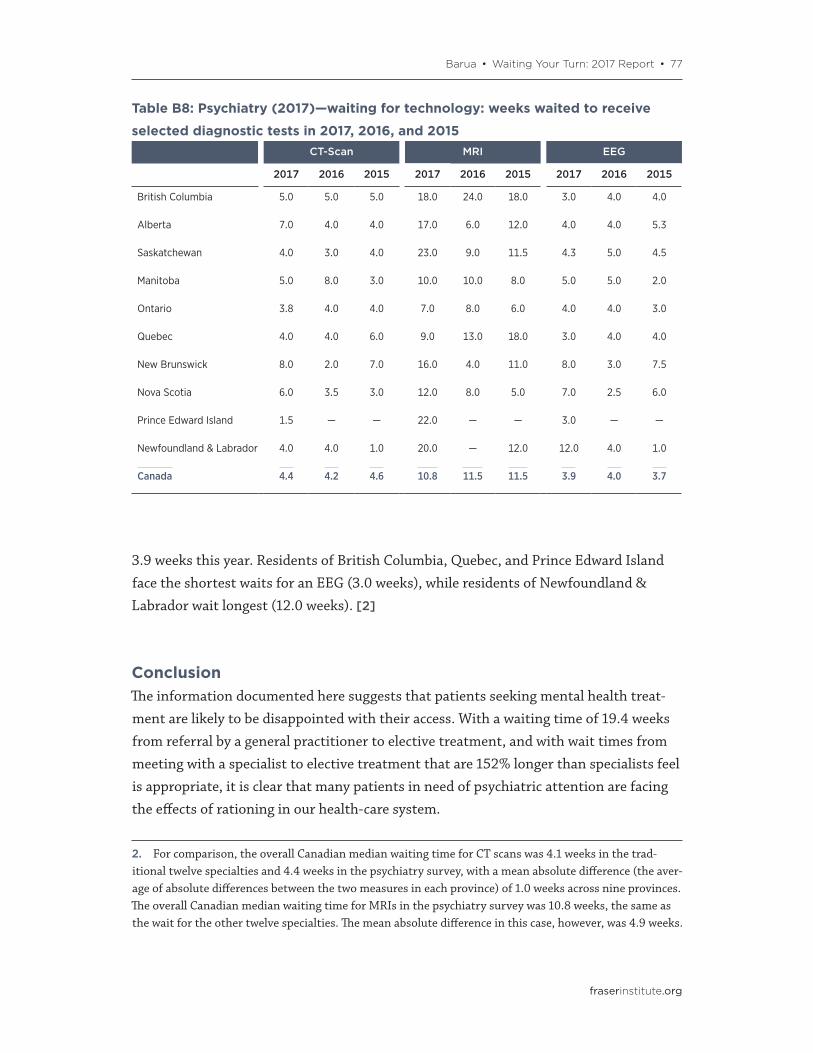
Barua • Waiting Your Turn: 2017 Report • 77
fraserinstitute.org
3.9 weeks this year. Residents of British Columbia, Quebec, and Prince Edward Island face the shortest waits for an EEG (3.0 weeks), while residents of Newfoundland & Labrador wait longest (12.0 weeks). [2]
ConclusionThe information documented here suggests that patients seeking mental health treat-ment are likely to be disappointed with their access. With a waiting time of 19.4 weeks from referral by a general practitioner to elective treatment, and with wait times from meeting with a specialist to elective treatment that are 152% longer than specialists feel is appropriate, it is clear that many patients in need of psychiatric attention are facing the effects of rationing in our health-care system.
2. For comparison, the overall Canadian median waiting time for CT scans was 4.1 weeks in the trad-itional twelve specialties and 4.4 weeks in the psychiatry survey, with a mean absolute difference (the aver-age of absolute differences between the two measures in each province) of 1.0 weeks across nine provinces. The overall Canadian median waiting time for MRIs in the psychiatry survey was 10.8 weeks, the same as the wait for the other twelve specialties. The mean absolute difference in this case, however, was 4.9 weeks.
Table B8: Psychiatry (2017)—waiting for technology: weeks waited to receive
selected diagnostic tests in 2017, 2016, and 2015CT-Scan MRI EEG
2017 2016 2015 2017 2016 2015 2017 2016 2015
British Columbia 5.0 5.0 5.0 18.0 24.0 18.0 3.0 4.0 4.0
Alberta 7.0 4.0 4.0 17.0 6.0 12.0 4.0 4.0 5.3
Saskatchewan 4.0 3.0 4.0 23.0 9.0 11.5 4.3 5.0 4.5
Manitoba 5.0 8.0 3.0 10.0 10.0 8.0 5.0 5.0 2.0
Ontario 3.8 4.0 4.0 7.0 8.0 6.0 4.0 4.0 3.0
Quebec 4.0 4.0 6.0 9.0 13.0 18.0 3.0 4.0 4.0
New Brunswick 8.0 2.0 7.0 16.0 4.0 11.0 8.0 3.0 7.5
Nova Scotia 6.0 3.5 3.0 12.0 8.0 5.0 7.0 2.5 6.0
Prince Edward Island 1.5 — — 22.0 — — 3.0 — —
Newfoundland & Labrador 4.0 4.0 1.0 20.0 — 12.0 12.0 4.0 1.0
Canada 4.4 4.2 4.6 10.8 11.5 11.5 3.9 4.0 3.7
78 • Waiting Your Turn: 2017 Report • Barua
fraserinstitute.org
Appendix C: The Fraser Institute National Waiting List Survey questionnaire (2014)
General SurgeryPlease circle the province in which your office is located:AB BC MB NB NL NS NT NU ON PE QC SK YT
1. From today, how long (in weeks) would a new patient have to wait for a routine office consultation with you? ____________ week(s)
2. Do you restrict the number of patients waiting to see you in any manner? (i.e. Do you accept referrals only at certain times of the year?)q Yes q No
3. Over the past 12 months, what percentage of the surgical procedures you performed were done on a day surgery basis? ____________ %
4. From today, how long (in weeks) would a new patient have to wait for the follow-ing types of elective surgery or diagnostic procedures? What would you consider to be a clinically reasonable waiting time for these types of surgery and procedures?
Surgery or procedure
Number of weeks to wait
Reasonable number of weeks to wait
Hernia repair (all types) / hydrocele
Cholecystectomy
Colonoscopy (diagnosis)
Incision, excision, anastomosis of intestine and other operations on intestine
Hemorrhoidectomy / other anal surgery
Breast biopsy
Mastectomy / segmental resection
Operations on bronchus and lung
Incidentally discovered and unruptured aneurysms
Varicose vein surgery
5. Has the length of your waiting lists changed since last year at this time?q Increased q Decreased q Remained the Same
Barua • Waiting Your Turn: 2017 Report • 79
fraserinstitute.org
6. If the length of your waiting lists has changed, what are the major reasons for the change? (Check all which may be applicable.)
_____ Availability of O/R nurses_____ Availability of other technical staff_____ Availability of beds_____ Availability of O/R time_____ Change in patient load_____ Availability of ancillary investigations or consultations (i.e. MRI, CT scans)_____ Other
7. What percentage of your patients currently waiting for surgery are on a waiting list primarily because they requested a delay or postponement? ____________ %
8. What percentage of your patients currently waiting for surgery do you think would agree to having their procedure performed tomorrow if an opening arose?
____________ %
9. To the best of your knowledge, what percentage of your patients that are listed on hospital waiting lists might also be listed by other physicians for the same procedure?
____________ %
10. Do you use the following types of diagnostic tests? If so, how long (in weeks) would a new patient have to wait for these tests?
Do you use the diagnostic test? Yes No Infrequently Number of weeks patients wait
CT Scan
MRI
Ultrasound
11. Approximately what percentage of your patients inquired in the past 12 months about the availability of medical services:In another province? ______ % Outside of Canada? ______ %
12. Approximately what percentage of your patients received non-emergency medical treatment in the past 12 months: In another province? ______ % Outside of Canada? ______ %
Thank you very much for your assistance.

80 • Waiting Your Turn: 2017 Report • Barua
fraserinstitute.org
Appendix D: The Fraser Institute Annual Study of Wait Times for Health Care in Canada (2017)
General Surgery In which province is your office is located? ____________
1. From today, how long (in weeks) would a new patient have to wait for a routine office consultation with you? ____________ week(s)
2. From today, how long (in weeks) would a new patient have to wait for the follow-ing types of elective surgery or diagnostic procedures? What would you consider to be a clinically reasonable waiting time for these types of surgery and procedures?
Surgery or procedure
Number of weeks to wait
Reasonable number of weeks to wait
Hernia repair (all types) / hydrocele
Cholecystectomy
Colonoscopy (diagnosis)
Incision, excision, anastomosis of intestine and other operations on intestine
Hemorrhoidectomy / other anal surgery
Breast biopsy
Mastectomy / segmental resection
Operations on bronchus and lung
Incidentally discovered and unruptured aneurysms
Varicose vein surgery
3. What percentage of your patients currently waiting for surgery are on a waiting list primarily because they requested a delay or postponement? ____________ %
4. What percentage of your patients currently waiting for surgery do you think would agree to having their procedure performed tomorrow if an opening arose? ____________ %
5. How long (in weeks) would a new patient have to wait for these tests?CT scan ________ weeks MRI ________ weeks Ultrasound ________ weeks
6. Approximately what percentage of your patients received non-emergency medical treatment in the past 12 months: In another province? ___ % Outside Canada? ___ %
Thank you very much for your assistance.
Barua • Waiting Your Turn: 2017 Report • 81
fraserinstitute.org
References
Barua, Bacchus, and Feixue Ren (2017). The Private Cost of Public Queues for Medically Necessary Care, 2016 edition. Fraser Research Bulletin. Fraser Institute. <https://www.
fraserinstitute.org/sites/default/files/private-cost-of-public-queues-for-medically-necessary-
care-2017.pdf>, as of October 27, 2017.
Canadian Cancer Society’s Steering Committee on Cancer Statistics (2017). Canadian Cancer Statistics 2016. <http://www.cancer.ca/~/media/cancer.ca/CW/cancer information/cancer
101/Canadian cancer statistics/Canadian-Cancer-Statistics-2017-EN.pdf>, as of October 27, 2017.
Canadian Institute for Health Information [CIHI] (2010). 2009/2010 Conversion Tables: ICD-10-CA/CCI to ICD-9/CCP. Canadian Institute for Health Information.
Canadian Institute for Health Information [CIHI] (2014). The 2015 ICD-10-CA and CCI Evolution Tables. Canadian Institute for Health Information.
Canadian Institute for Health Information [CIHI] (2017a). Discharge Abstract Database, 2015–2017. Canadian Institute for Health Information.
Canadian Institute for Health Information [CIHI] (2017b). National Ambulatory Care Reporting System, 2015–2016. Canadian Institute for Health Information.
Canadian Institute for Health Information [CIHI] (2017c). Hospital Morbidity Database 2015–2016. Canadian Institute for Health Information.
Day, Brian (2013). The Consequences of Waiting. In Steven Globerman, ed., Reducing Wait Times for Health Care: What Canada Can Learn from Theory and International Experience (Fraser Institute): 43–75.
Ontario Ministry of Health and Long Term Care (2005). First Ever Common Benchmarks Will Allow Canadians to Measure Progress in Reducing Wait Times. News release (December 12). <http://news.ontario.ca/archive/en/2005/12/12/First-ever-common-benchmarks-will-allow-
Canadians-to-measure-progress-in-reducin.html>, as of October 27, 2017.
82 • Waiting Your Turn: 2017 Report • Barua
fraserinstitute.org
Ramsay, Cynthia (1998). How to Ruin a Good Idea—Lessons from the British Columbia Ministry of Health. Fraser Forum (February): 7–11.
Statistics Canada (2017). Estimates of Population, by Age Group and Sex for July 1, Canada, Provinces and Territories Annual (Persons unless Otherwise Noted). CANSIM table 051-0001. <http://www5.statcan.gc.ca/cansim/a05?lang=eng&id=0510001>, as of October 27, 2017.
Stokes, Ernie, and Robin Somerville (2008). The Economic Costs of Wait Times in Canada. A study commissioned by the British Columbia Medical Association (BCMA) and the Canadian Median Association. Centre for Spatial Economics.
Waiting Your Turn: Hospital Waiting Lists in Canada (1993–2016, various authors; various editions). Fraser Institute.

Barua • Waiting Your Turn: 2017 Report • 83
fraserinstitute.org
About the Author
Bacchus BaruaBacchus Barua is the Associate Director of the Fraser Institute’s Centre for Health Policy Studies. He completed his B.A. (Honours) in Economics at the University of Delhi (Ramjas College) and received an M.A. in Economics from Simon Fraser University. Mr Barua has conducted research on a range of key health-care topics including hospital performance, access to new pharmaceuticals, the sustainability of health-care spending, and international comparisons of health-care systems. He also designed the Provincial Healthcare Index (2013) and is the lead author of The Effect of Wait Times on Mortality in Canada, and Waiting Your Turn: Wait Times for Health Care in Canada (2010–2016). Mr. Barua is a frequent commentator on radio and television, and his articles have appeared in well-known news outlets including the National Post, Financial Post, Vancouver Sun, Toronto Sun, Ottawa Citizen, and forbes.com.

84 • Waiting Your Turn: 2017 Report • Barua
fraserinstitute.org
Acknowledgments
This edition of Waiting Your Turn: Wait Times for Health Care in Canada draws extensively on previous editions. For this reason, the author would like to pay special tribute and thanks to Steven Globerman, the primary author of the first Waiting Your Turn report; Michael Walker, who is responsible for helping navigate the beginnings of wait time measurement in Canada, and who was the author or a co-author of the report for almost two decades; and Nadeem Esmail, who contributed significantly to the refinement and accuracy of the report, and who authored or co-authored the report for over a decade.
I am also pleased to acknowledge the important contributions of Maureen Hazel, Lorna Hoye, Joanna Miyake, Cynthia Ramsay, Mark Rovere, Brett J. Skinner, Greg Wilson, and Martin Zelder in completing earlier versions of the survey and in building the base of knowledge that is incorporated into this publication.
Finally, I would like to thank Feixue Ren for her assistance with co-ordinating this year’s Waiting Your Turn survey. Data collection for this edition of Waiting Your Turn was completed with the assistance of Laurence Dutil-Ricard and Jill Blake, for which I am immensely grateful.
Any remaining errors or oversights are the sole responsibility of the author. As the researcher has worked independently, the views and conclusions expressed in this paper do not necessarily reflect those of the Board of Directors of the Fraser Institute, the staff, or supporters.
DisclaimerParts of this material are based on data and information provided by the Canadian Institute of Health Information. However, the analyses, conclusions, opinions, and statements expressed herein are those of the authors and not necessarily those of the Canadian Institute of Health Information
Barua • Waiting Your Turn: 2017 Report • 85
fraserinstitute.org
Publishing Information
DistributionThese publications are available from <http://www.fraserinstitute.org> in Portable Document Format (PDF) and can be read with Adobe Acrobat Pro® or Adobe Acrobat Reader®, versions 8/9 or later. Adobe Acrobat Reader DC®, the most recent version, is available free of charge from Adobe Systems Inc. at <http://get.adobe.com/reader/>. Readers having trouble viewing or printing our PDF files using applications from other manufacturers (e.g., Apple’s Preview) should use Adobe Acrobat Reader or Adobe Acrobat Pro.
Ordering publicationsTo order printed publications from the Fraser Institute, please contact us via e-mail: [email protected]; telephone: 604.688.0221, ext. 580 or, toll free, 1.800.665.3558, ext. 580; or fax: 604.688.8539.
MediaFor media enquiries, please contact our communications department via e-mail: [email protected]; telephone: 604.714.4582.
CopyrightCopyright © 2017 by the Fraser Institute. All rights reserved. No part of this publication may be reproduced in any manner whatsoever without written permission except in the case of brief passages quoted in critical articles and reviews.
ISBN978-0-88975-475-1
CitationBacchus Barua (2017). Waiting Your Turn: Wait Times for Health Care in Canada, 2017 Report. Fraser Institute. <http://www.fraserinstitute.org>.
Cover designTony Kempen
Cover images©kupicoo, iStock® (medical exam, hospital, discussion, talking, medicine)
86 • Waiting Your Turn: 2017 Report • Barua
fraserinstitute.org
Supporting the Fraser Institute
To learn how to support the Fraser Institute, please contact us via post: Development Department, Fraser Institute, Fourth Floor, 1770 Burrard Street, Vancouver, British Columbia, V6J 3G7, Canada; telephone: toll-free to 1.800.665.3558, ext. 548; e-mail: [email protected]; or visit our webpage: <http://www.fraserinstitute.org/
support-us/overview.aspx>.
Purpose, Funding, and Independence
The Fraser Institute provides a useful public service. We report objective information about the economic and social effects of current public policies, and we offer evidence-based research and education about policy options that can improve the quality of life.
The Institute is a non-profit organization. Our activities are funded by charitable donations, unrestricted grants, ticket sales, and sponsorships from events, the licensing of products for public distribution, and the sale of publications.
All research is subject to rigorous review by external experts, and is conducted and published separately from the Institute’s Board of Trustees and its donors.
The opinions expressed by authors are their own, and do not necessarily reflect those of the Institute, its Board of Directors, its donors and supporters, or its staff. This publication in no way implies that the Fraser Institute, its directors, or staff are in favour of, or oppose the passage of, any bill; or that they support or oppose any particular political party or candidate.
As a healthy part of public discussion among fellow citizens who desire to improve the lives of people through better public policy, the Institute welcomes evidence-focused scrutiny of the research we publish, including verification of data sources, replication of analytical methods, and intelligent debate about the practical effects of policy recommendations.

Barua • Waiting Your Turn: 2017 Report • 87
fraserinstitute.org
About the Fraser Institute
Our mission is to improve the quality of life for Canadians, their families and future generations by studying, measuring and broadly communicating the effects of government policies, entrepreneurship and choice on their well-being.
Notre mission consiste à améliorer la qualité de vie des Canadiens et des générations à venir en étudiant, en mesurant et en diffusant les effets des politiques gouvernementales, de l’entrepreneuriat et des choix sur leur bien-être.
Peer review —validating the accuracy of our researchThe Fraser Institute maintains a rigorous peer review process for its research. New research, major research projects, and substantively modified research conducted by the Fraser Institute are reviewed by experts with a recognized expertise in the topic area being addressed. Whenever possible, external review is a blind process. Updates to previously reviewed research or new editions of previously reviewed research are not reviewed unless the update includes substantive or material changes in the methodology.
The review process is overseen by the directors of the Institute’s research departments who are responsible for ensuring all research published by the Institute passes through the appropriate peer review. If a dispute about the recommendations of the reviewers should arise during the Institute’s peer review process, the Institute has an Editorial Advisory Board, a panel of scholars from Canada, the United States, and Europe to whom it can turn for help in resolving the dispute.
88 • Waiting Your Turn: 2017 Report • Barua
fraserinstitute.org
Editorial Advisory Board
Members
Past members
* deceased; † Nobel Laureate
Prof. Armen Alchian*
Prof. Michael Bliss*
Prof. James M. Buchanan* †
Prof. Friedrich A. Hayek* †
Prof. H.G. Johnson*
Prof. F.G. Pennance*
Prof. George Stigler* †
Sir Alan Walters*
Prof. Edwin G. West*
Prof. Terry L. Anderson
Prof. Robert Barro
Prof. Jean-Pierre Centi
Prof. John Chant
Prof. Bev Dahlby
Prof. Erwin Diewert
Prof. Stephen Easton
Prof. J.C. Herbert Emery
Prof. Jack L. Granatstein
Prof. Herbert G. Grubel
Prof. James Gwartney
Prof. Ronald W. Jones
Dr. Jerry Jordan
Prof. Ross McKitrick
Prof. Michael Parkin
Prof. Friedrich Schneider
Prof. Lawrence B. Smith
Dr. Vito Tanzi