Embed Size (px)
Citation preview

A STUDY ON THE MAIN FACTORS AFFECTING THE COMPETITIVE
GROWTH OF THEMEDA TRIANDRA {KANGAROO GRASS) AND THE INTRODUCED WEED, NASSELLA
TRICHOTOMA (SERRATED TUSSOCK)
BY ANDREA THORPE
SUPERVISED BY DR COLIN HOCKING
VICTORIA UNIVERSITY OF TECHNOLOGY
NOVEMBER 1994
"VICTORIA UNIVERSITY OF TECHNOLOGY
3 0001 00166580 3
FTS THESIS 584.904 5247099 45 THO

WER THESIS 584.904524709945 THO 30001001665803 Thorpe, Andrea A study on the main factors affecting the competitive growth of Themeda triandra
V —
CONTENTS
ACKNOWLEDGEMENTS
ABSTRACT
1. BACKGROUND TO THE STUDY
1.1 HISTORY OF NATIVE GRASSLANDS IN VICTORIA
1.2 THEMEDA DOMINATED GRASSLANDS
1.3 FIRE AS A COMPONENT OF GRASSLAND
ECOSYSTEMS
1.4 COMPETITION FROM WEEDS
1.5 NUTRIENT DYNAMICS OF GRASSLANDS
1.6 NUTRIENT HYPOTHESIS FOR DISTURBANCE
BOUNDARY
1.7 SOIL MOISTURE
2. FOCUS OF STUDY
3. METHODS
3.1 STUDY SITE
3.2 ANALYTICAL METHODS FOR NUTRIENT ANALYSIS
3.3 METHOD FOR THE DETERMINATION OF SOIL
MOISTURE
4. RESULTS & DISCUSSION
4.1 NUTRIENTS
4 .2 SOIL MOISTURE
5. CONCLUSION
6. REFERENCES
APPENDICES

ACKNOWLEDGEMENTS
I would sincerely like to acknowledge the encouragement and assistance of Dr Colin
Hocking who supervised me throughout the year. His help and support were greatly
appreciated.
i would also like to thank the lab staff for theif patience and assistance this year,
particularly Minh Thai for her contributions to the analytical work.
I also wish to thank the people who supported me this year, my family, friends and
fel low Honours students who helped me throughout the yearand made it entertaining.

ABSTRACT:
Li t t le publ ished in format ion is available on the levels of soil nutr ients and soi l
nnoisture on rennnants of native (Basalt Plains) grasslands.
This study investigated the associat ion of soil nutr ients and nnoisture w i t h stands
of the nat ive grass Themeda triandra (Kangaroo Grass) and the noxious weed
Nasse/la trichotoma (Serrated Tussock) . Both mature and immature (i.e. recently
burnt) stands of T. triandra and N. trichotoma were invest igated, on disturbed and
undis turbed soil.
No s igni f icant d i f ferences for the nutr ients (Total Kjeldahl Nitrogen and Total
Phosphorus) be tween soil under T. triandra and N. trichotoma on either the
d is turbed or undisturbed sites was found.
Soil moisture was found to be signif icant ly di f ferent between mature stands of T.
triandra and N. trichotoma, w i th the N. trichotoma stand having signif icant ly lower
soil moisture. The results suggest that one of the factors that a l lows N. trichotoma
t o invade native remnant grasslands and disturbed sites, and to resist the re-
establ ishment of T. tr iandra on invaded sites might be the need of T. triandra for
moist soil for seed germinat ion.

The general aim of this study was to undertake an initial investigation of the
environnnental factors that might advantage Nassella trichotoma in invading
remnant grassland sites at the expense of Themeda triandra.
1 • BACKGROUND TO THE STUDY
1.1 HISTORY OF NATIVE GRASSLANDS IN VICTORIA
Prior to pastoral settlement of the Victorian native grasslands beginning in the
1830's, native grasslands and grassy woodlands" covered 34% of Victoria
(Cons. & Env. 1992; Cons. & Nat. Res. 1993a & 1993b) (see figure la) . A
major component of these grasslands was the Victorian (Basalt Plains) grassland
which covered 10% of Victoria (see figure lb ) . This ecosystem was dominated
by Themeda triandra or Kangaroo Grass (formerly known as Themeda austra/is -
see figure 2) (Stuwe & Parsons 1977; Groves 1965).
The agricultural practices of the settlers lead to the degradation and loss of
many areas of native grasslands through their conversion to exotic pastures,
crops or urban development (Groves 1965; Lunt 1991).
Grasslands and grassy woodlands have been shown to have a close association. With the understory species of grassy woodlands comprising of the same floral composit ion as adjacent grasslands. In this report the term grasslands is used to refer to both open grasslands and the understory of grassy woodlands (Frood & Calder 1987). J

5 pgure l a : Pre - sett lement distr ibution of native grasslands and grassy woodlands in V ic tor ia (Anon 1992).
/
''yiiH-.jVis'-' '' • exndigo
KEY
Basalt Plains CommLmides (B)
Riveiina Communides (R)
Omeo Plains Community (O)
— Gippsland Community (G)
1
Wimmera Communides (W)
Hsnllton
Figure l b : Former distr ibut ion of Victorian Basalt Plains Grassland (McDougall & Kirkpatr ic 1994). \
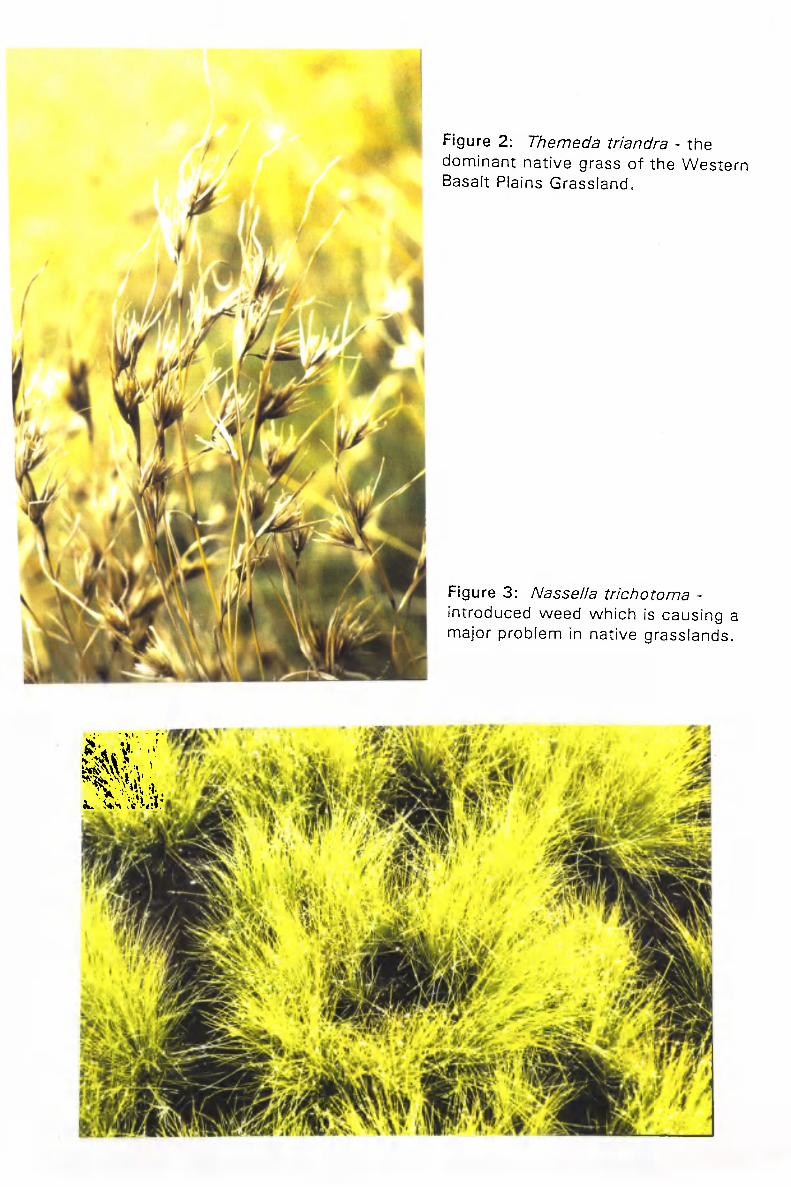
Figure 2: Themeda triandra - the dominant native grass of the Western Basalt Plains Grassland.
Figure 3: Nassella trichotoma -introduced weed which is causing a major problem in native grasslands.
m

Over much of this period of sett lement (at least the last 100 years)
agricul tural ists have predicted the degradation and loss of the Victor ian native c^
grasslands due to the lack of care taken in the way that they have been used C ' ^ ^
and managed (Turner 1891; Sut ton 1916).
The Basalt Plains grasslands wh ich once stretched f rom the northern and
wes te rn areas of Melbourne to almost the South Australian border n o w
const i tu te perhaps the most threatened ecotype in Australia w i th less than ,,
0 . 5 % remaining (Lunt 1991; Anon 1993a & 1993b). These remnants are • •
located in small, isolated pockets along the roadside and railway lines, in
cemeter ies and in uncul t ivated lightly grazed paddocks (Groves 1965; Lunt
1991 ; Craigie & S tuwe 1992).
W i t h the loss of native grasslands has come the national, regional and local
ex t inc t ion of many species of invertebrates, mammals and plants (Craigie &
S tuwe 1992; Anon 1993a & 1993b). Genetic diversity has always been a vital
component of any natural communit ies ability to weather environmental
changeSj(^ The drastic reduct ion and degradation of native grasslands has
reduced the biodiversity of the grasslands and the gene pool available. This has
resulted in the entire Western Basalt Plains Grassland communi ty being listed in
the Flora and Fauna Guarantee Act (1988) as a threatened communi ty .
Qii; U
1.2 DOMINATED GRASSLANDS
Themeda triandra is a member of the grass family Poaceae. It is a dense
tussocky warm-seasonal perennial which normally f lowers between November
and January (Groves 1975; Scarlett 1992) and has a C4 photosynthesis
pa thway (Stuwe & Parsons 1977; Groves 1975; Culvenor 1981).
^ I t is found in all the mainland states of Austral ia as well as Tasmania and Papua
New Guinea.
UiVvo^

/A7e/77ecya-dominateci g rass lands /cha rac te r i s t i c ^ cmitain-a-wide range of other
grasses and forb species.groMng-arrwr^s^l^^e-Tv'tm^efifa Many of these minor
grasses and forbs are greatly reduced in number w i th even minimal disturbance
of grasslands, such as grazing or fertiliser application^. In their place grow
introduced species w j i i ch are better adapted to hard hoofed animals. It has
been suggested that native grass replacement by weeds is due to 3 factors:
selective grazing, physical disturbance associated wi th hoofed animals (Muir
1992), and higher nutr ient concentrat ion of improved pastures (Groves 1975).
1.3 FIRE AS A COMPONENT OF GRASSLAND ECOSYSTEMS V ^Vs^ on
- •
Prior to Eu ropea i ^e t t l emen t and the associated grazing of soft footed animals
(eg. l<angaroos) ,^as used for millenia to manage native grasslands and maintain
species diversity. Fire was initially used by Aboriginal groups to clear unwanted
vegetat ion, promote regrowth and trigger the release of seeds for food^ Forty
thousand years of Aboriginal burning regimes led to many native grassland
plants becoming highly adapted to frequent fires. ^ ^
Af ter European sett lement there were fewer fires due to acute fire suppression
and because the fuel was grazed by domestic, indigenous and feral herbivores
(Groves 1981). In recent t imes controlled fires have been increasingly used to
limit the risk of an uncontrol led fire by reducing the accumulation of fuel.
In native grasslands fire acts to promote many of the smaller herb species that
would otherwise be out competed by the Themeda (Craigie & Stuwe 1992).
Burning has generally been considered a good management tool for grasslands ^^
that are relatively free of exotic species (Kirkpatric 1986; Lunt 1990; Anon ^ VVA\S _.
1992), as it is not as discriminating as grazing and it supplies bare ground for
the g rowth of seedlings. However there is some uncertainty about the use of
fire as a management tool. Lunt (1990) observed that ^ f te i ; fires in some
grassland areas that had been degenerated by grazing and the invasion of exotic
species, more of the exot ic species o f ten regenerated or became establ ished
t h a n the nat ive species.
There is an urgent need for more research into methods of f lora management in
nat ive grasslands w h i c h wi l l promote g r o w t h of native species ahead of the
exot ic species.
1.4 COMPETITION FROM WEEDS
The invasion of native grasslands by introduced weeds is a widespread problem
t h r o u g h o u t the wor ld . Weeds inf luence native grasslands by compet ing w i t h
nat ive species for available space, nutr ients and moisture (Cons. & Env. 1992) .
In the Vic tor ian Basalt Plains Grassland the native vegetat ion is resistant to
invasion w h e n left und is turbec^O^owever native grassland vegetat ion is easily
replaced by exot ic plants when it is exposed to soil d isturbances, intensive
grazing or increased nutr ients (Craigie & S tuwe 1992). Of ten a combinat ion of
these fac tors has disastrous ef fects on remnant grassland stands.
Nassella trichotoma (Serrated Tussock - see f igure 3) ranks amongst the most
problemat ic weeds in these grasslands (Craigie and Stuwe 1992) , as wel l as on
pasture land (see be low) . It originated in South America and was spread via the
impor t of w o o l and hay f rom there to South Afr ica, New Zealand and Austral ia.
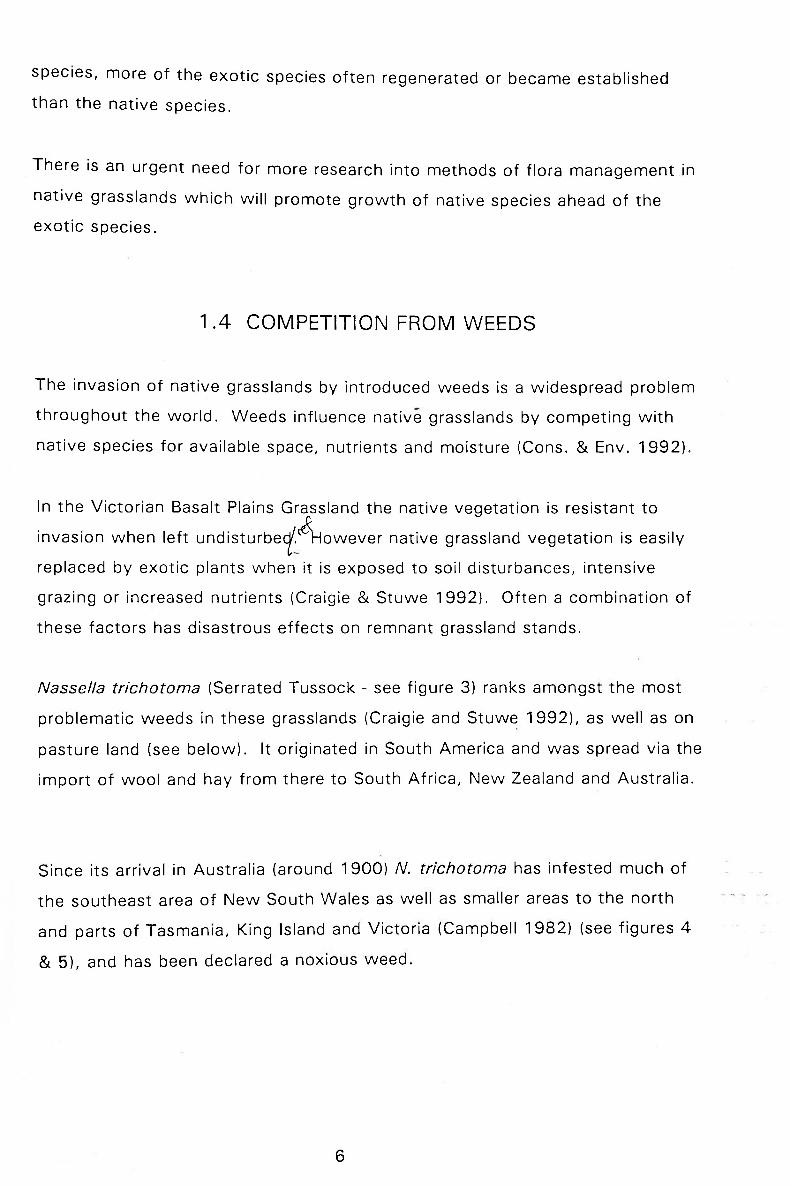
Since its arrival in Austral ia (around 1900) N. trichotoma has infested much of
the southeast area of N e w South Wales as wel l as smaller areas to the nor th
and parts of Tasmania, King Island and Victor ia (Campbell 1982) (see f igures 4
& 5), and has been declared a noxious weed.
6
Figure 4 : The d is t r ibu t ion of Nassella trichotoma in Aust ra l ia (Campbel l 1982) ,
Figure 5: The extent of the invasion by Nassella trichotoma in the Western Basalt
Plains Grassland (Dainton 1994).
By producing large numbers of seeds, N. trichotoma is able to distr ibute itself
w i d e l y ^ ^ A i k ^ f t ^ r o w s in native grasslands or pastoral grassland^.Serrated
w^tss^Gk becomes the dominant g rass /a«^ tock graze selectively and\wi l l not eat
N. trichotoma unless all other fodder has been r e m o v e d ^ ^ ^ ^ a r l d L e o n ^ ^
(1959) found that sheep on a diet of N. trichotoma lost we ight and started to c^yo^
_ d i ^ f t e r 7 weeks of grazing {Campbell 1982). This is a result of the relative ^ ^
indigest ibi l i ty of /V. trichotoma and its low nutri t ional value (Campbell 1982;
Wi lson & Hodgkinson 1990; Dainton 1994). The reduction in the carrying
capaci ty of the land due to Serrated Tussocl<{^is causin-§ serious l ^ ^ i n farm
product iv i ty in areas where it has become a major weed (figures 4 & 5).
N. trichotoma is not only a problem in the native grasslands but on local
farms as wel l where it outcompetes the pastoral grasses but is unpalatable to
s tock . V
Locally various conservat ion groups and agricultural interests are concerned w i t h
the extensive problem that N. trichotoma represents. In 1994 the Victor ian
Serrated Tussock Task Force, based in Melton, was formed to organise action
against the weed.
It has been suggested that periodic fires wh ich are of ten used to preserve native
grassland diversi ty could also assist the establishment and/or the spread of /V.
trichotoma as wel l (Lunt 1991; Craigie & Stuwe 1992).
1.5 NUTRIENT DYNAMICS OF GRASSLANDS
In grassland ecosystems the availability of nutr ients and soil moisture have been
found to be the t w o consistent ly major factors that limit the g rowth of plants.
T w o nutr ients of high signif icance as l imiting factors in many ecosystems,
including grassland ecosystems, are nitrogen and phosphorus (McLendon &
Redente 1991) . There have been f e w rigorous investigations of the ^ ^
env i ronmenta l fac tors l imiting the g row th of plants in Basalt Plains grasslands^
/ I f
8

W ^ W e r /he cracking clay soil of these areas indicates that soil moisture is one
of the nnajor factors, while the low fertil ity of Australian soils indicates that
nutrient levels may be another major factor^
Few detailed studies have been published of nutrient dynamics in grassland
ecosystems in Australia. Studies that have b e ^ u n d e r t a k e n here and overseas
give a variety of opinions. For example Culvenor (1981) states that phosphorus
IS the limiting factor in Australia, while Groves in Australia (1981) and Tilmanjin
the United States (1994) say that it is nitrogen, L p p ^ V c
The nutrient levels of Australian soils are generally low when compared to those
of other countries. This has been attributed to the geological age of the land
(Culvenor 1981), The low nutrient level of Australian soils has resulted in the
suggestion that many of the indigenous grasses are adapted to low levels of
nutrients in the soil (Culvenor 1981; Lunt 1991).
Many of the exotic species that have invaded native Themeda and Danthonia
dominated grasslands show a greater response to the addition of nutrients than
the native species (Groves et al 1973; Fisher 1974; Culvenor 1981). In one of
the few controlled experiments in Australia that looked at competition between
indigenous and invading species for nutrients. Groves, Keraitis and Moore
(1972) examined the relative growth of Themeda triandra & Poa labillardieri in
pots in response to varying phosphorus and nitrogen levels. Although P. ^ ^.eit^^Sr^
labillardieri is not an exotic plant it is considered an environmental weed as it
invades degraded land. These studies found that when T. triandra & P.
labillardieri were grown together the Poa utilised the nutrients much more
effectively and dominated the T. triandra.
Extensive anecdotal observations and the few rigorous studies available suggest
that the non - indigenous grasses often have a competitive edge over the native
grasses when nutrients are applied through the direct application of fertilisers,
herbicides and chemical fire retardants (Lunt 1991; Craigie & Stuwe 1992) or
via the wastes and carcasses of stock. Addition of nutrients can result in a

d ^ s e g r o w t h of exot ics w h i c h may smother or o therwise ou t -compete the
nat ive species. The g r o w t h of exot ic species may increase even more if the
nut r ien ts are applied to soil tha t is already disturbed. This response wou ld
explain the degradat ion of nat ive grasslands or farmland, caused by the addi t ion
bf phosphorus and n i t rogen based fert i l isers n o w a common place agr icul tural
pract ice (Lunt 1991) .
1.6 NUTRIENT HYPOTHESIS FOR DISTURBANCE BOUNDARY
A t the grassland being invest igated in this s tudy (Victoria Universi ty of
Techno logy - St Albans campus see sect ion 371) there is a d is t inct ive boundary
b e t w e e n the Themeda triandra and the Nassella trichotoma. The side of the
boundary on w h i c h the N.trichotoma is found was ploughed once, many years
ago. W W ^ ^
This in ter face b e t w e e n the native grass and the weeds has remained stable for
many years and was the star t ing point for these invest igat ions. n n n
One proposed explanat ion for the influx of weeds onto a site af ter a soil
d is turbance ( T. McLendon, Dep. Range Science, University of Colorado,
pe rs .comm. to C. Hocking) is that extensive disturbat ice such as ploughing kills
nat ive grassland plants, including their be low-ground biomass. This results in
the release of nut r ients into the soil via microbial degradat ion. The sudden
increase in nutr ient levels advantages the g r o w t h of weeds, such as N.
trichotoma w h i c h are able to out compete T. triandra. Weeds that establ ish on
d is turbed sites are those wh ich o u t g r o w natives on nutr ient enriched soil and are
u l t imate ly able to exclude native plants via a var iety of compet i t i ve mechanisms
(i.e. compe t i t i on for l ight, nutr ients, moisture, physical c rowd ing) .
10

1.7 SOIL MOISTURE
Soil moisture is one other major factor that limits the growth of plants in native
grasslands (Hagon 1977).
Native grasses are generally considered to be better adapted to lower moisture
levels than many of the introduced species of grass (Lodder, Groves & Wi t tmark
1986) . Few studies seem to have been conducted to look specifically at the
moisture content of soils support ing native grasses as opposed to introduced
species. In one of the f ew local studies published, Groves (1965) observed the
seasonal variat ion in the soil moisture of a remnant grassland in another area of
St. Albans. The soil moisture varied between'c. 10 % in summer to c. 30 % in
Au tumn. In this study he looked only at the growth of Themeda triandra.
J qe^Jor
^ U I
11

2. FOCUS OF THF .qTUny
The general a im of th is s tudy was to invest igate w h a t env i ronmenta l fac to rs are
impor tan t to grassland eco logy and might advantage Nassella trichotoma in
invading si tes w i t h d is turbed and undisturbed soil at the expense of Themeda
triandra) speci f ica l ly :
1/ To invest igate the soil moisture and nutr ient content of soil in d is turbed and
und is turbed sites under N. trichotoma and T. triandra.
2/ To gather in fo rmat ion as to potential e^cpal ina^ns for w h y T. triandra is not
easily re-establ ished af ter soil d isturbance.
3/ To establ ish a general range for the soil nutr ient levels (ni trogen and
phosphorus) of Basalt Plains Grassland remnants.
12

3. METHODS
3.1 STUDY SITE
The area of Wes te rn Basalt Plains native grassland that was used as the sample
site in th is s tudy is s i tuated in the south - east corner of the St. Albans campus of
the V ic tor ian Univers i ty of Technology (see f igure 6).
The site consis ts of an area of remnant Themeda triandra (Kangaroo Grass)
domina ted nat ive grasslands. Adjoining this is a heavily degraded sect ion of land
tha t is dominated by Nassella trichotoma (Serrated Tussock). This persistant
d is turbance boundary be tween Themeda triandra and Nassella trichotoma was the
s tar t ing point for these invest igat ions.
A fire w e n t t h rough part of the site in January of 1993. The fire crossed both the
remnant and degraded areas of grassland and left mature stands of each remaining.
This prov ided us w i t h the sites that were used for the soil moisture and nutr ient
s tudies. V
- W
Atraz ine was included in the s tudy to compare w i t h a site f rom wh ich all vegetat ion
had been removed. This site was sprayed t w o years previously w i t h the herbicide
At raz ine.
13

Figure 6: Map showing the location of the study site in relation to other native grassland resei-ves in the western suburbs of Melbourne (McDougall & Kirkpatric

3 .2 ANALYTICAL MFTHQDS FOR NUTRIENT
ANALYSIS OF SOIL AND PLANT MATFRIAf
The methods used to determine the amounts of phosphorus and nitrogen present
in the soil and plant samples are outlined below.
3 .2 .1 ANALYSIS OF TOTAL PHOSPHORUS
T w o methods were employed in this study. The first was the Injection Flow
Analysis method. When it was clear that this-was unsuitable for phosphorus (P)
analysis in Basaltic clay soils the Spectrophotometr ic method was used.
The analysis of phosphorus in plants and soil samples using both methods
involves the ashing of the substance being sampled. The steps shown below are
based on Piper (1944). The ashing procedure was also used to estimate the
residual root content of the dried soil samples (see section 4.2.2) .
1/ A dry crucible is oven dried at a temperature of 105°C for at
least half an hour to remove any moisture.
2/ The crucible is placed in a desicator until cool and weighed to
j f 0 . 0 0 0 1 g
3/ The sample is weighed, then left to dry overnight at 105°C
4/ This is then placed in a desiccator and weighed when cool.
5/ The sample is placed in a muff le furnace overnight at 420°C.
The temperature of the muff le furnace should be raised
s lowely to 4 2 0 j f 5°C. The resulting soil should be red or
orange in colour.
15

6/ The crucible and the contents are placed in a des iccator and
when cool are weighed to obtain the weight of the crude ash,
7/ The crucible is covered with a watch glass and the ash is
moistened with 4 - 5 drops of distilled water. Then 3 ml of 5 M
hydrochlor ic acid is carefully pipetted under the lip of the watch
glass. The crucible is covered with a watch glass so as to prevent
loss by effervesence.
8/ The crucible is placed on a boiling water bath and digested
for 2 hours.
9/ The cover of the crucible is removed and rinsed and 0.2ml
of 1 5M nitric acid added. Evaporate the solution until dry.
10/ The crucible is placed on a hot plate for at least Ihr or until
total ly dehydrated.
11/ The dry salts should be moistened with 2ml of 5 M hydrochloric
acid. 10ml of distilled water is added and warmed on a water
bath for approximately 30 minutes.
12/ The solut ion is placed in a 250ml volumetric flask and diluted
to vo lume with distilled water.
13/ Using a centrifuge, spin the samples to separate the solids
f rom the solution.
14/ Transfer to a 250ml polyethylene bottle and add a crystal of
thymol to preserve the solution.
16

ESTIMATE OF TOTAL PHOSPHORUS USING INJECTION FLOW ANALYSIS:
To determine the total phosphorus content of this solution the original method
used was by injection f low analysis using the Tector Aquatec. This involves the
reaction of orthophosphate in the sample with ammonium molybdate to form
heteropoly molybdophosphoric acid. This is then reduced by stannous chloride
in a sulphuric acid medium, to form phosphomolybdenum blue which is
measured spectrophotometrically (Tecator 1990). , V
1/ 15.0 ml of solution is placed in a autoclave proof glass
bottle. ^
2/ 0.15 ml of 4M sulphuric acid and 3.0 ml of the potassium
persulphate (appendix 1) is added.
3/ This is heated for 30 minutes in an autoclave, and analysed
when cool.
This method produced a yellow/orange suspension in the solutions which would
not redisolve. These particulates caused problems by clogging tubes in the f low
analysis system and could therefore not be analysed. Filtering the solutions was
not an option at this point as samples analysed before clogging showed that the
phosphorus was actually bound in the precipitate, with only small amounts in the
solution.
THE SPECTROPHTOMETRIC METHOD TO ESTIMATE TOTAL PHOSPHORUS:
Following the failure of the above method a second was used. This involved
determining the concentration of phosphorus in an aliquot of the solution
prepared by the above ashing method using a spectrophotometer and standard
curve.
17

The spec t ropho tomet r i c m e t h ^ o r the preparation of al iquots s h o w n be low is
based upon Murphy and Riley, 1962. This involves the reduct ion of a
phosphonnolybdate complex by ascorbic acid using an ant imony caty l is t .
1/ For preparat ion of reagents, refer to appendix 1.
2/ Standard curves were prepared in the concentrat ion range
expected for phosphorus in the samples.
3/ The acidi ty of the samples was checked and adjusted to an
approx imate pH of 3 by the addit ion of sulfuric acid or
sod ium hydroxide.
4/ Disti l led wate r is then added to adjust the volume to 45 mL,
and the solut ion is mixed.
5/ Five mL of reagent B (see appendix 1 ) is added and the
solut ion made to volume.
6/ The solut ion was then heated in a constant temperature
wate r bath at 70°C for 10 minutes.
7/ When cool , the absorbanpe-^ f the solut ion can be determined
by a spect rophotometer at SSOmu. Samples should be read
against a reagent blank prepared w i t h distilled water . The
solut ion must be analysed as soon as possible since it is
only stable for 8 hours.
18

3.2.2 ANALYS IS OF TOTAL NITROfiFN Tk'M
The method for the analysis of Kjeldahl nitrogen in the soil samples is based on Rump & Krist (1988). The process is as follows:
1/ Approximately 1 - 2g of dry soil is placed in a Kjeldahl tube.
2/ 1g of reaction mixture ( see appendix 2 ) is added to the soil sample as well as 10ml of ethanol.
3/ After shaking, 10ml of concentrated sulfuric acid is carefully added. The solution is heated slowly and boiled for 30 minutes.
4/ After cooling, the digest is placed in a one litre distillation
flask and made up to 300mL with distilled water, rinsing the Kjeldahl tube.
5/ Add a few drops of phenolphthalein solution with sufficient
sodium hydroxide to colour it pink (approximately 40 mL).
6/ The flask is attached to distillation apparatus an^-distilled
to a known volume (approximately 200ml) di^^tiis^er. During
this time the end of the condenser should dip into the
absorber.
Initially a titrimetric method was used for the analysis of Kjeldahl Nitrogen but this method proved too insensitve to determine the concentrations encountered,
19

ESTIMATION OF TOTAL KJELDAHL NITROGEN USING INJECTION FLOW
ANALYSIS
The determination of the Total Kjeldahl Nitrogen (TKN) involves the use of the
Tecator Aquatec by injection f low analysis (Tecator 1991). This involves the
distillate being injected into the Aquatec where it combines wi th aqueous sodium
hydroxide. Ammonia is formed which diffuses through a gas permeable
membrane into an indicator stream which consists of a mixture of acid-base
indicators that will react wi th the Ammonia. This results in a colour change
which is measured photometrically. The reagents and standards used are shown
in Appendix 2.
Problems wi th this method were encounted because of the rapid volatization of
ammonia which meant that sample solutions needed to have their pH lowered to
stabilize the solutions. This caused the f low analysis system to give inaccurate
values regarding the TKN concentrations of the solutions, as the method relies
on changing the pH just prior to photometric determination by the addition of
sodium hydroxide into the analysis stream. It was found after some
investigation that using the Tecator Aquatic that each sample had to have its pH
readjusted before analysis. The need for pH readjustment of acid stabilised
samples was only discovered in the course of analysis. This procedure was not
clear in the instructions for the Aquatec. As a result, the reliability of some early
TKN data was rendered questionable.
Another problem wi th this method was the instability of the base line on the
f low analysis system, and the sensitivity of the indicator which needed continual
readjustments.
The third problem wi th the f low analysis system using the Tecator Aquatec was
the unreliability of the machine, it continually developed leaks and other related
problems.
20
5 . 3 . U V I E I H Q D J 0 R THE DETERMINATION
QF_S0IL MOISTURF
When taking soil samples fronn the grasslands to look specifically at gravimetric
analysis of soil moisture, t w o methodological problems presented themselves.
1/ The potential loss of moisture during transfer of samples between
the grasslands and the laboratory.
2/ The error introduced with
a. the presence of rocks, which take up space and weight but hold
little or no water. Their presence would therefore affect the %
moisture calculations.
b. or large amounts of living root material which would hold
moisture which was not part of the soil moisture, but would
contribute to gravemetric estimation of soil moisture.
In order to minimise any potential loss of moisture and to take into account the
presence of confusing factors (rocks and roots) the procedure below was
developed:
1/ Labels were placed on empty samples vials which were oven dried
wi th their lids at approximately 60°C.
- The combined weight of each vial and its lid is recorded on
the vial.
2/ Core samples were collected from depths of 1-4, 5-8 and 15-18 cm
to obtain a depth profile of soil moisture. The lids were affixed
t ight ly.
21

3/ Immediately upon return to the laboratory the vials were weighed to
obtain the combined weight of the vial and the core sample
- From this the fresh mass of the soil was determined. The
fresh mass included the soil, rocks, roots and moisture. The
samples were stored in the cold room until they were
processed.
4/ Cores were removed from vials and the rocks and roots carefully
separated f rom the soil. The fresh weight of the roots is determined
immediately.
5/ The rocks were returned to the vial and a small amount deionised
water is added to wash off any soil or rocks still in the vial. This
water (minus the rocks) is added to the soil sample.
6/ For each sample the soil, roots and rocks dried separately and the
weights recorded.
7/ To calculate the moisture content of each core sample ;
a/ The fresh weight of roots and the dried weight of rocks is
subtracted from fresh core weight. This will give the fresh
weight of the soil.
b/ The loss of moisture due to drying is determined by
subtracting the weight of the dry soil from the weight of the
wet soil (determined above).
c/ The loss of moisture is expressed as a percentage of the
dry weight of the soil.
22

4, RESULTS AND DISCUSSION
4.1. NUTRIENT DETERMINATION
INITIAL ANALYSIS OF TOTAL KJELDAHL NITROGEN
Initial studies conducted f o r t h e determination of the nitrogen and phosphorus content
of the soil of a Themeda site and a Nassella site are shown in figures 7 & 8. Figure
7 shows the results of the analysis for Total Kjeldahl Nitrogen (TKN). This figure does
not give any immediate indication of a significant difference in TKN values of either
site. Stat ist ics conducted using the two-way analysis of variance showed that there
was no statist ical ly significant difference between the TKN concentrations of the
Themeda and the Nassella sites.
INITIAL ANALYSIS OF TOTAL PHOSPHORUS
The data obtained for the initial analysis of the total phosphorus concentrations of the
t w o sites is shown in figure 8. This data was not determined to be statistically
signif icant using a t w o - w a y analysis of variance test. ( f ^ ^ j H
FOLLOW UP STUDY
A second round of sampling was done to reexamine the nutrient values obtained
between the di f ferent sites. These are shown in figures 9, 10 & 11). Neither the
Total Kjeldahl Nitrogen or the Total Phosphorus concentrations were found to have a
statist ically signif icant difference in values. c ^
Neither of these studies showed any significant difference in the Total Kjeldahl
Nitrogen or the Total Phosphorus concentrations between any of the sites.
23

The lack of a s tat i s t i ca l ly s ign i f i cant d i f ference in the nutr ients concent ra t ions be tween
the s i tes does not necessar i l y mean that nutrients levels do not play a role in the
es tab l i shment of in t roduced spec ies. These nutrient levels cou ld be a short term
e f fec t of other f ac to r s . There is an a lmost complete lack of data on the role that
n i t rogen and phosphorus play in the Basalt plains grass lands.
There is s ome doubt regarding the accuracy of the values that were obta ined for the
nutr ients in th is s tudy . Th is is due to the methods used for the determinat ion of the
nutr ients and the prob lems assoc iated wi th them. Any nutrient results wou ld need
further ver i f i ca t ion before being cons idered reliable.
Whi le these samp les were being analysed for the'ir nutrient content , the soil moisture
wa s a lso determined by the simple method of oven drying overnight. The results of
this initial soi l mois ture determinat ion showed a d i f ference in the soil moisture
be tween the burnt and the unburnt Themeda sites wh i ch formed the basis of the
second fac to r being looked at - soil moisture. These results were fo l lowed up in later
s tud ies .
24

FIGURE 7: Average Total Kjeldahl Nitrogen determined during initial sampling (ppm),
Error bars represent standard deviation, here and on all other graphs.
0.400
0.300-
0 . 2 0 0 -
0.100-
T K N mg/g
0 .000 '
< Q W
u
T " < J J w C/2 < 2
T " < Q a
c J -J CJ 00 < Z
T < Q a S tu
< J J tu C/2 c z
SITES
1 - 4 c m 5 - 8 c m 1 5-1 8cm
25
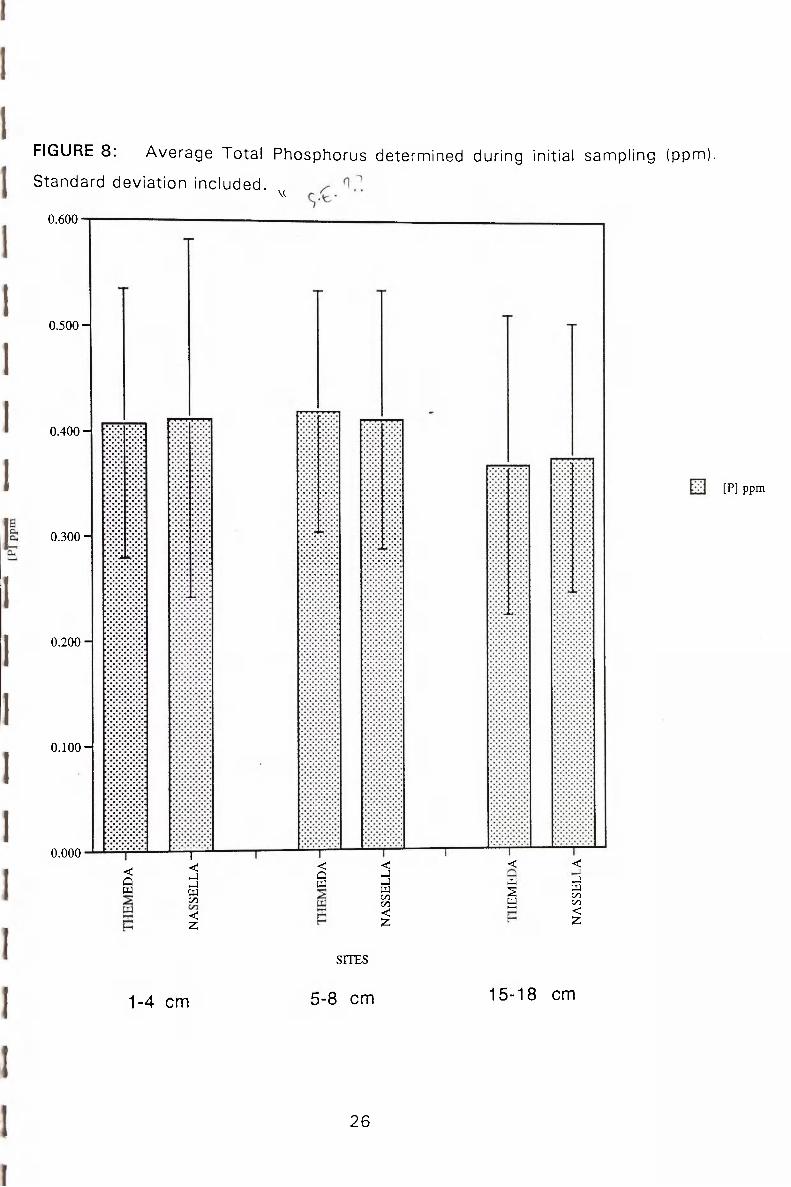
FIGURE 8: Average Tota l Phosphorus determined during initial sannpling (ppm),
Standard dev ia t ion inc luded. M.
0.600 •
0.500-
0.400-
0.300-
0 . 2 0 0 -
0 .100-
0.000 < a w
T " < J J w on < 2
C Q tu < J J a CO on < 2
[P] ppm
< <: 1 klj
s s 00 s C/) < 2
1-4 cm
SITES
5-8 cm 15-18 cm
26

FIGURE 9: Average Total Kjeldahl Nitrogen determined in follow up nutrient sampling. Standard deviation included.
0.400
0.300
60 "So B 0 . 2 0 0 -
0 . 1 0 0 -
0.000
[ 3 TKN mg/g
1—4 * Q Q U a
g e CO s a
P ca z 3 ca
SITES
27

FIGURE 10: Average Total Phosphorus determined in fo l low up nutrient sampling,
Standard deviat ion included.
0.800
0 . 6 0 0 -
e a. CL, 0.400-
0.200 -
0.000
[P] ppm
SITES
28

F IGURE 11 : Average soil moisture content determined during nutrient invest igations.
40.000
3 0 . 0 0 0 -
i C/5
2 0 . 0 0 0 -
10 .000-
0.000
%SOIL MOISTURE
SITES
29

4.2. SOIL MOISTURE
4 .2 .1 . RANGF FINDING STUDY
PRELIMINARY FINDINGS
The initial range f inding test conducted during a dry period of winter showed a
substant ia l d i f ference in soil moisture between the unburnt Themeda site and the
unburnt Nassella site ( f igure l 2 ) , w i th the unburnt Themeda obviously having a much
higher soil moisture content than the unburnt Nassella. This was also the case for the
burnt Themeda site. This was observed at all 3 levels that samples were taken at.
Also observed was the fact that the moisture content for the Nassella dominated sites
was generally closer to that of the bare ground (Atrazine treated) site, f rom wh ich
most vegetat ion had been removed years ago.
This suggested tha t perhaps the mature stands of Nassella had the e f fec t of
s igni f icant ly lower ing the soil moisture content of the soils f rom their previous values.
STATISTICAL ANALYSIS OF DATA
Initial stat ist ics conducted on these result are shown in tables 1, 2, & 3. These were
obtained using Mini tab to conduct a two -way analysis of variance, as a three-way test
was not available. All data underwent an Arcsine t ransformat ion to normalise i t ^ „
Stat ist ical signif icance was taken at the 0.05 level. When stat ist ical signif icance has
been determined it was always showing that the soil moisture under the Nassella was
lower than that of the Themeda sites, and that the burrvt sites had lower values than . ^ ...
the unburnt . Addi t ional stat ist ics were conducted for all d i f ferent studies using the
Mann-Whi tney (non-parametric) test, but none of the data collected in the initial s tudy
was found to be signi f icant by this method as too few replicates were taken (3 only). j
30

The t w o - w a y analysis of var iance (table ^ s h o w s that the only stat ical ly s igni f icant
d i f fe rence in soil nnoisture values in this l imited s tudy were obta ined in the 1 - 4 cm TV
- layer, and occured due to the d i f ferent species of grass growing on the soil. W i t h the 1 ' Q^f^ yivA ^
3 sites hav ing s ign i f icant ly lower values than the r/7e/77ec/a. A t the 5-8 c m level
^ ^ there w a s no s tat is t ica l ly s igni f icant d i f ferences in values. The species of grass
^ g r o w i n g w a s also found to be stat ist ical ly s igni f icant at in 1 5-1 8 c m layer, and here,
^ ^ the in te rac t ion b e t w e e n the t w o factors was found to be s ign i f icant .
reVo-Vc- \ o Coi SrC. V U.
5 ^ h is tory was not determined to be s igni f icant for this initial s tudy even t h o u g h the
O ' i the species was. This could be due to the small number of
i k repl icates taken (tables 1, 2, & 3).
^ UJW-V o ^ ^ ^ V deSi^vN
A f t e r the init ial s tudy , problems w i t h the method for the determinat ion of soil mois ture
were addressed - sect ion 3 .3 .
4 . 2 . 2 . DETAILED FOLLOW UP OF MOISTURE UNDER THEMEDA AND NASSELLA
Detai led sampl ing of soil moisture was undertaken to fo l low up the initial s tudy.
This occured after a day of fairly heavy rain wh ich might account for the raise in
soil moisture levels at the surface, above those initially determined.
The data fo l l owed the same general pattern of the range-f inding tes t , w i t h the unburnt
Themeda site being substant ia l ly higher in soil moisture than the unburn t Nassella, or
in fac t any of the other sites (1-4cm). Soil at 1 - 4 cm under the burnt Themeda also
had a substant ia l ly higher value than the unburn t Nassella. The burnt Nassella had an -
average soil mois ture value of between the burnt and unburnt Themeda.
9
Sta t i s t i c^conduc ted on this s tudy by a t w o - w a y analysis of var iance (tables 4, 5, &
s h o w e d tha t there w a s a stat ist ical ly s igni f icant d i f ference in the soil moisture in me -
1 - 4 c m layer, w i t h the sites recently burnt being lower in soil moisture.
31

Stat ist ical analysis conducted using the Mann-Whi tney test showed a stat ist ical ly
s igni f icant d i f ference between the t w o Themeda sites w i th di f ferent fire histories, but
no d i f ference be tween the Nassel/a sites f o ^ c ^
T w o - w a y analysis of variance also showed a highly signif icant ef fect at this level to
t h e t w o d i f f e r e n t g rasses [Themeda triandra and Nassella trichotoma) g r o w i n g o n t h e
site.
For the soil moisture of the t w o dif ferent grasses growing on the unburnt site, the
Mann-Whi tney test determined that there was a highly signif icant di f ference. This
was not the case for the recently burnt site.
The interact ion of these t w o factors, given by the t w o - w a y analysis of variance was
also higly signif icant and showed that these factors contr ibute to the dif ference in soil
moistures between sites. ^
At the 5-8 cm and the 15-18 cm levels the fire history was not determined to be
stat ist ical ly signif icant using the t w o - w a y analysis of variance, and the only
stat ist ical ly signif icant di f ference determined by the Mann-Whitney test was in the 5-8
cm level.
These samples did show statist ical significance regarding diiferences in the soil
moisture between the t w o di f ferent species. At both levels the combined ef fect of fire
history and species present produced a statistically signif icant result using both the
t w o - w a y analysis of variance and the Mann-Whitney test .
EFFECTS OF ROOTS ON SOIL MOISTURE
As part of this s tudy the ef fects of roots in the soil samples on the soil moisture
determinat ion using the gravimetric method were investigated. These are discussed
below.
32

ROOT REMOVAL EFFICENCY
Ashing was used to estimate the carbon content of the samples, this would consist
of the roots and other plant material and microbial biomass. Ashing would therefore
give us the upper limit est imation of the residual root content in the soil samples for
wh ich root removal has been undertaken.
FigurelSshows the average weight lost f rom the soil samples after ashing, as a
percer i tage^f the dry soil weight before. This information was used to help determine
the ^ i c e n c y of the root removal f rom the soil samples. The actual removal of roots
was as complete a job as reasonably possible.
The lowest values obtained throughout the entire study are p o ^ r t ^ d on the left side
of the graph. These were compared to the average of the five highest values f rom
each dif ferent site. In general the root rem,oval was no greater than 1% above the
minimum values, indicating that a high proportion of roots had been removed. The
Atrazine site lost a much higher proportion of its weight during ashing than any of the
other sites. The high carbon content of this site (as determined by ashing) is unlikely
to be due to psidus>Toot material, little root was found in soil samples from this site.
It is possible tf iat the high carbon content is due to a high microflora in the soil,
present because of degraded root matter
ROOT MOISTURE AS A PROPORTION OF SOIL MOISTURE.
Figure! S hows the average values obtained for the root moisture as a proportion of
the soil moisture. Root moisture was determined gravimetrically by taking before
and after drying weights of root material removed from soil samples. From this
graph we can see that the roots in a sample generally contribute less than 1 % to
the moisture content of a sample. With this in mind the necessity of removing the
roots f rom each sample was generally considered not to be nesessary.
33

H<5vXvec :^ere was one except ion, some of the samples found in the unburnt
Themeda sites, had large enough amounts of roots present to interfer w i th accurate
soil moisture calculat ions. Therefore when determining soil moisture gravimetrcal ly
for soil samples taken f rom mature stands of Themeda, the removal of roots prior
to grav imetr ic est imat ion is advisable.
ROOT MASS AS A PROPORTION OF SOIL MASS
Figurel 7 jhows the proport ion of wet soil mass that can be at t r ibuted to the roots.
From this graph we can see that the greatest roo i biomass was found in the 1 -4cm
layer of samples, as wou ld be expected, and the lowest root biomass in the 15-
18cm level, also as expected.
The Atrazine sight had the lowest root biomass throughout all the layers. This
wou ld also be expected as there has been litt le or no vegetat ion on the site since it
was sprayed in approximately January 1993.
The unburnt Nassella seems to fo l low Atrazine wi th the low presence of roots,
whi le the Themeda, on both the burnt and unburnt sites, has the greatest biomass,
especially the unburnt l - 4 c m samples.
4 .2 .3 . SUBSEQUENT SAMPLING
The second round of fo l l ow up samples were taken after a couple of hot ("30°C) days
and consequent ia l ly , the surface soil moisture is substatially lower than either of the
other t w o sample dates.
34

The trends in soil moisture in these samples fol lowed the other t w o wi th the unburnt
Themeda being signif icantly higer than any of the other sites, especially the unburnt
Nassella. ^
Statistical analysis (table ) showed that these samples also had statistically
signif icant differences in the soil moisture of the 1-4 cm layer, caused by the fire
history, w i th the recently burnt sites being lower, but no difference in the 5-8 cm
and the 15-18 cm levels. The Mann-Whitney t es t did determine a difference
between the burnt and unburnt Nassella sites at the 15-18 cm level.
The species present did have a statistically significant affect on the soil moisture in"
the 1-4 cm layer, but ther was no determined difference in the soil moisture
between the species at either the 5-8 cm or the 15-18 cm level for these samples.
The combined effect of "^ l^ is tory and species present did have a statistically
significant ef fect on the soil moisture.
4 .2 .4 . SUMMARY OF SOIL MOISTURE FINDINGS
For both of the detailed studies looking at the soil moisture between the burnt and ^
unburnt sites of Nassella and Themeda, the difference ^f^xtrfi^ between the lower
values of the burnt sites and the higher values of the unburnt sites was found to be:
statistically signif icant in the 1-4 cm level. Neither the 5-8 cm or the 15-18 cm
levels had a signif icant difference in soil moisture regarding the fire history for the
di f fernt species for either for either of the fo l low up studies. This indicates that
although the fire might have had a potential effect on the soil moisture of the sites;
any significant ef fect it did have was limited to the first layer i.e. 1-4 cm.
35

The ef fec t of the grass species growing on the di f ferent sites had a statist ical ly
s igni f icant d i f ference on the soil moisture in the 1-4 cm level of all three sets of
studies. The e f fec t on the soil moisture of the 5-8 cm and the 15-18 cm layers
was not found to be signif icant in the initial study or in the last set of samples,
though stat ist ical s ignif icance was found in the first fo l low up study at these levels.
The interact ion of the t v j ^ f ^ t o r s , fire history and species growing was found to be
stat ist ical ly s igni f icant a W l l levels in the t w o fo l low up studies, but only in the last
^^ level of the initial s tudy. These factors had the ef fect of lowering the soil moisture
f in soils f rom the unburnt Nassella stands and raising moisture in the unburnt
Themeda stands.
4 .2 .5 . IMPLICATIONS FOR THE MANAGEMENT OF REMNANT GRASSLANDS yV-/ n
The results obtained here suggest that mature stands of Nasse/la are actively
lowering the soil moisture of the grassland soils. This is evidenced by the fact that
the stands of mature Nassella have signif icantly lower soil moisture than the
recently burnt stands and that the soil moisture in these stands is generally closer
to that of the bare ground (Atrazine) site than any of the others.^ ^
The soil moisture has previously been indicated to be one of the major factors
ef fect ing plant g row th in native grasslands. If the Nassella does infact have a
signif icant e f fect in lowering the soil moisture this would ef fect Themeda's ability
to compete w i th Nassella where it has established.
Hagon (1977) showed that for Themeda seeds to germinate they need a high soi l '
moisture Lnxent. If the soil moisture is actively being lowered by the mature
stands oJ Nassella then the Themeda has less chance of establishing.
36

Methods need to be considered that would raise the soil moisture levels in Nassella
donninated soils and allow the establishment and growth of Themeda. Thatching is
one method which might be considered as it would retain soil moisture by
developing conditions similar to mature stands of Themeda were there is a dense
ground covering which helps retain soil moisture.
Though soil moisture is one of many factors that need to be considered when
looking at the re-establishment of Themeda on Nassella dominated sites it is one
that is significant and needs to be taken into account.
37

FIGURE 1 2 : A v e r a g e soi l m o i s t u r e s taken at 3 levels, for the init ial range f i n d i n g
s a m p l e s . S t a n d a r d d e v i a t i o n inc luded.
50-
40-
i 30-
P
• 4 • •
AVERAC %SO]L MGISHT
C
20-1
10-1
X idji
I
z
s
<: <
c — ^ CO CO <
I
C3 < < —
CO CO <
1 -4 cm
I
<
I
Z
z <
<
s = i I — _ ^ : CO
CO : <
z SITES
5-8 cm
i I z <
I "z
< z <
CO <
a <
15-18 cm
Z
= <
'y. CO
<

FIGURE 13 : A v e r a g e soi l mo is tu res taken at each level for the de ta i led f o l l o w up of
soi l m o i s t u r e . S t a n d a r d dev ia t i ons inc luded .
50'
40-
X
30- 1S3 %SOIL MOISTUR
I n
•-Ti
20-
1 0 -
<
<
a a <
S d ^ ^ - <
•z.
<
Z
S z <
z — <
z 2 <
I
z
I I p ^ ::: <
E ^ • ^ - z
z <
SITES
I z
5 ^ < z <
i r . <
i Z
§ - ^ — c/i - <
Z
•S' <
1 -4 cm 5-8 cm 15-18 cm
39

F I G U R E 14: A v e r a g e soil moisture obtained at each level for the final soil moisture
s tudy . S tandard dev ia t ions mcludea .
50.000 •
40.000-
30.000-
s p CO g s c 00
20.000-
T
10.000-
0.000
w
I
z cd « ^
<
a z <
CO CO <
N < <
CO CO <
z:
I
z
<
I z
= ^ ^ < = -CO CO <
z
Si <
< <
CO CO < Z
SITES
I z
z <
CO <
Z
< i
Z f:
a <
•CO CO <
Z
<
%SOIL
MOISTl
1-4 cm 5-8 cm 15-18 cm
10
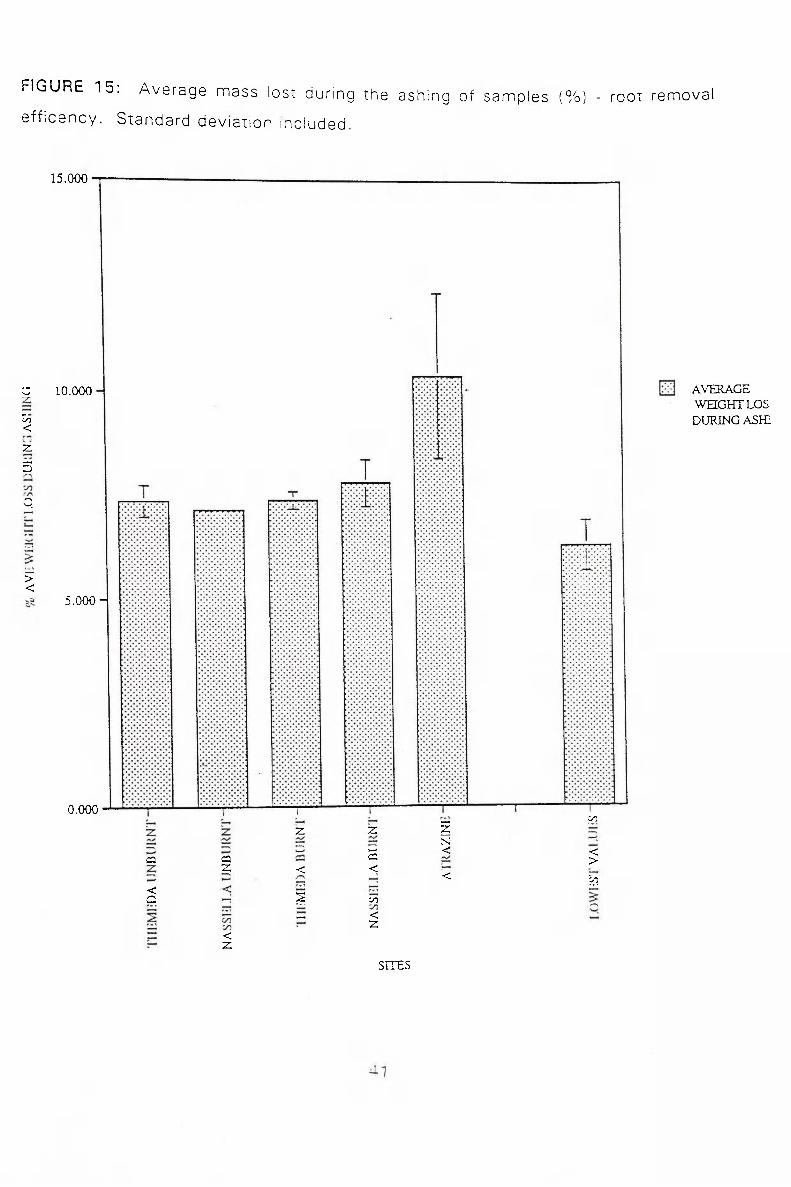
F I G U R E 1 5 : A v e r a g e m a s s l o s t d u r i n g t h e a s h i n g o f s a m p l e s ( % ) - r o o t r e m o v a l
e f f i c e n c y . S t a n d a r d d e v i a t i o n i n c l u d e d .
15.000
O 10.000
So <
z
3
Q
> < 5.000-
0.000
AVEEIAGE W H G H T L O S DURING ASH:
£2 <
a
a 2
< Z
M C/3 z z: z
N >—' < < a >
< < < to — .
s CO M <
Z
SITES

FIGURE 16: A v e r a g e r o o t m o i s t u r e as a p r o p o r t i o n of t h e so i l mo i s t u r e .
.000 •
6.000-J
VI 2 s
o (/I
^ 4.000-
X
2 . 0 0 0 -
0.000 •
% AVERAGE ROOT MOIST /SOIL MOIST
I s
z
'j^j C/5 < 2
a <
z £
<
•-n <
Z
z <
a <
z z N <
<
I z
z <
z <
c: <
<
z N <
5
s i : ^
I ^ I < = ^ • ^
SITES
i i i ^ : <
z <
1-4 cm 5-8 cm 15-18 cm

FIGURE 17 : A v e r a g e root nnass as a p ropo r t i on of the soi l mass .
5.000 •
4.000-
2 3.000-
CO <
9
' J < 2 . 0 0 0 -
1 . 0 0 0 -
0.000 •
AVERAGE ROOT MAS; / SOIL MAS
<
CO CO < 2
a < 1 3 <
<
CO CO <
Z
Z
a 2 <
1
2
2 < ^ - <
CO CO <
2
1 I
2 2 S N r; <
i I CO CO <
a 2 < 3 <
CO CO <
2
2 2 S N < < - ; <
CO CO <
2
SITES
1 - 4 c m 5 - 8 c m 1 5 - 1 8 c m
43

TABLE 1: Determination of statistical significance for the range finding test in the
1-4cnn level.
SOURCE OF VARIATION
STATISTICAL SIGNIFICANCE
FIRE HISTORY 0.25 < P SPECIES 0.025 < P < 0.05 INTERACTION 0.10 < P < 0.25
TABLE 2: Determination of statistical signif icance'for the range finding test at the
5-8 cm level.
SOURCE OF VARIATION
STATISTICAL SIGNIFICANCE
FIRE HISTORY 0.05 < P < 0.10 SPECIES 0.05 < P < 0.10 INTERACTION 0.25 < P
TABLE 3: Determination of statistical significance for the range finding samples at
1 5-1 8 cm level.
SOURCE OF-VARIATION
STATISTICAL SIGNIFICANCE
FIRE HISTORY 0.05 < P < 0.10 SPECIES 0.05 < P < 0.10 INTERA.CTION 0.0025 < P < 0.001
5.10.94 15 - IB cm
44

TABLE 4: Determination of statistical significance for the follow 1-4cnn level.
up sampling at the
SOURCE OF VARIATION STATISTICAL
SIGNIFICANCE FIRE HISTORY 0.0025 < P < 0.005 SPECIES P < 0.0005 INTERACTION
'1 - /I TT, — P < 0.0005
TABLE 5: Determination of statistical significance'for the follow up sampling at the
5-8cm level.
SOURCE OF VARIATION
STATISTICAL SIGNIFICANCE
FIRE HISTORY 0.10 < P < 0.25 SPECIES 0.025 < P < 0.05 INTERACTION 0.01 < P < 0.025
TABLE 6: Determination of statistical significance for the follow up sampling at the
1 5-18cm level.
SOURCE OF VARIATION
STATISTICAL SIGNIFICANCE
FIRE HISTORY 0.25 < P SPECIES 0.001 < P < 0.05 INTERACTION 0.01 < P <,0.025
45

TABLE 7: Determination of statistical significance for the final sampling at the 1
4cm level. —
SOURCE OF VARIATION STATISTICAL
SIGNIFICANCE FIRE HISTORY 0.0025 < P < 0.017 SPECIES P < 0.0005 INTERACTION P < 0.01105
TABLE 8: Determination of statistical significance for the final sampling at the 5-
8cm level.
SOURCE OF VARIATION
STATISTICAL SIGNIFICANCE
FIRE HISTORY 0.25 < P SPECIES 0.05 < P INTERACTION 0.005 < P < 0.01
TABLE 9: Determination of statistical significance for the final sampling at the 15-
18cm level.
SOURCE OF STATISTICAL VARIATION SIGNIFICANCE ' '
FIRE HISTORY 0.25 < P SPECIES 0.10 < P < 0.25 INTERACTION 0.025 < P < 0.05
16.10.94 lb - ly cm
46

TABLE 9:
SITE SIGNIFICANCE DEPTH 1 - 4 cm
1 6 . 1 0 . 9 4
9 . 1 0 . 9 4
5 . 1 0 . 9 4
0 . 0 0 2 5 < P < 0 . 0 0 5 0 . 0 0 5 <P< 0 . 0 1 P > 0 . 1 0
SIGNIFICANT SIGNIFICANT NOT SIGNIFICA.NT
DEPTH 5 - 8 cm 1 6 . 1 0 . 9 4
9 . 1 0 . 9 4
5 . 1 0 . 9 4
0 . 0 5 < P < 0 . 1 0
P > 0 . 1 0
P > 0 . 1 0
NOT SIGNIFICANT NOT SIGNIFICANT NOT SIGNIFICANT
DEPTH 15-18 cm 1 6 . 1 0 . 9 4
9 . 1 0 . 9 4
5 . 1 0 . 9 4
P > 0 . 1 0
P > 0 . 1 0 . •
P > 0 . 1 0
NOT SIGNIFICANT NOT SIGNIFICANT NOT SIGNIFICAJ>JT
iiiGWih'ICANCE BETWEEN THEMEDA uNBURNT AND THEMEDA BURNT
SITE SIGNIFICANCE DEPTH 1 - 4 cm
1 6 . 1 0 . 9 4
9 . 1 0 . 9 4
5 . 1 0 . 9 4
P > 0 . 1 0
P > 0 . 1 0
P > 0.10, ,
NOT SIGNIFICANT NOT SIGNIFICANT NOT SIGNIFICAJ^T
DEPTH 5 - 8 cm 1 6 . 1 0 . 9 4
9 . 1 0 . 9 4
5 . 1 0 . 9 4
0 . 0 5 < P < 0 . 1 0 0 . 0 1 < P< 0 . 0 2 5 0 . 0 5 < P < 0 . 1 0
NOT SIGNIFICANT SIGNIFICANT NOT SIGNIFICANT
DEPTH 15-18 cm 1 6 . 1 0 . 9 4
9 . 1 0 . 9 4
5 . 1 0 . 9 4
0 . 0 1 < P< 0 . 0 2 5
P > 0 . 1 0
P > 0 . 1 0
SIGNIFICANT NOT SIGNIFICANT NOT SIGNIFICANT
SIGNIFICANCE BETWEE N NASSELLA BURNT AND NASSELLA UNBURNT
47

TABLE 11
TABLE 12:
SITE SIGNIFICANCE DEPTH 1 - 4 cm
16.10.94 9.10.94 5.10.94
P > 0.10 0.05 <P< 0.10 P > 0.10
NOT SIGNIFICANT NOT SIGNIFICANT NOT SIGNIFICANT
DEPTH 5 - 8 cm 16.10.94 9.10.94 5.10.94
P > 0.10 P > 0.10 P > 0.10
NOT SIGNIFICANT ^ NOT SIGNIFICANT NOT SIGNIFICANT ;
DEPTH 15-18 cm 16.10.94 9.10-.94 5.10.94
P > 0 .10 -0.005 <P< 0.10 P > 0.01
NOT SIGNIFICANT SIGNIFICANT NOT SIGNIFICANT !
biGMiJr'iCANCE BETWEEN NASSELLA BURNT AND THEMEDA BURNT
SITE SIGNIFICANCE DEPTH. 1 - 4 cm
: -16.10.94 -• 9.10.94 5.10.94
0.005 < P < 0.01 0.005 < P < 0.01 0.05 < P < 0.10
SIGNIFICANT SIGNIFICANT NOT SIGNIFICANT
DEPTH 5 - 8 cm 16.10.94 9-10.94 5.10.94
0.005 < P < 0.01 0.005 < P < 0.01 0.05 < P < 0.10
SIGNIFICANT SIGNIFICi^JMT NOT SIGNIFICANT
DEPTH 15-18 cm 16.10.94 9.10.94 5.10.94
0.025 < P < 0.05 0.025 < P < 0.05
P > 0.10 SIGNIFICANT SIGNIFICANT NOT "SIGNIFICANT
48

TABLE 13:
SITE SIGNIFICANCE DEPTH 1 - 4 cm
16.10.94 9.10.94 5.10.94
0.0025 <P<0.005 0.01 <P< 0.025
SIGNIFICANT SIGNIFICANT NOT SIGNIFICANT
DEPTH 5 - 8 cm 16.10.94 9.10.94 5.10.94
0.01 < P < 0.025 P > 0.10
SIGNIFICANT NOT SIGNIFICANT NOT SIGNIFICANT
DEPTH 15-18 cm 16.10.94 9.10.94 5.10.94
P > 0.10 NOT SIGNIFICANT NOT SIGNIFICANT NOT SIGNIFICANT
SIGNIFICANCE BETWEEN THEMEDA UNBURNT AND ATRAZINE
TABLE 14:
SITE SIGNIFICANCE DEPTH 1 - 4 cm
16.10.94 9.10.94 5.10.9 4
0.005 <P<0.01 P> 0.10
SIGNIFICANT NOT SIGNIFICANT NOT SIGNIFICANT
DEPTH 5 - 8 cm 16.10.94 9.10.94 5.10.94
0.025 < P < 0.05 P > 0.10
SIGNIFICANT NOT SIGNIFICANT NOT SIGNIFICANT
DEPTH 15-18 cm 16.10.94 9.10.94 5.10.94
P > 0.10
T-»-»T->>T TT"VTr ->T TT- i X I
NOT SIGNIFICANT NOT SIGNIFICANT NOT SIGNIFICANT
49

SITE SIGNIFICANCE DEPTH 1 - 4 cm
16.10.94 9.10.94 5.10.94
0.0025 <P<0.005 0.005 <P< 0.01 0.05 <P < 0.10
SIGNIFICANT SIGNIFICANT NOT SIGNIFICANT
DEPTH 5 - 8 cm 16.10.94 9.10.94 5.10.94
p > 0.io P > 0.10 P > 0.10
NOT SIGNIFICANT NOT SIGNIFICANT NOT SIGNIFICANT
DEPTH 15-18 cm 16.10.94 9.10.94 5.10.94
P > 0.10 P > 0.10 P > 0.10
NOT SIGNIFICANT NOT SIGNIFICANT NOT SIGNIFICANT
T A B L E 15 : SIGNIFICANCE BETWEEN THEMEDA UNBURNT AND NASSELLA BURN':
50

5. CQNCLUSinNS
The results obtained here for the nutrient studies show no statistically significant
difference in the soil nutrient (Total Kjeldahl Nitrogen and Total Phosphorus)
concentrations of these t w o different grasses in these grasslands soils.
The results of the soil moisture analysis study indicated that mature stands of Nasse/fa
trichotoma ef fect the grassland soils by lowering the soil moisture content and out-
competing the establishment of Themeda triandra from seed.
51
6 J E F E R E N C E S
' Campbel l , M .H . (1982) "The biology of Austmlmn Weeds. 9. N^f^s^Rll^
trichotoma." The Journal of the Australian Institute of Agricultural Science. 76-
83
Cof f in , D.P. & Lauenroth, W.K . (1989) "Disturbances and gap dynamics in a
semiarid grassland." Landscape Ecology 2-A-AQ-21
^ Cons. & Env. (1992) "Management of Native Grasslands in the Melbourne W V
Area. " Cons & Env. & Vic. Nat. Parks Assoc. Melbourne.
, Cons. & Nat. Res. (1993a) "Nat ive Grasslands and Grassy Woodlands. " Cons.
& Nat. Res. Melbourne.
. Cons. & Nat. Res. (1993b) "Western Basalt Plains Grasslands." Cons & Nat. (Vov. I'^^Sb.
Res. Melbourne.
V Craigie, V. & S tuwe , J . (1992) "Derr imut Grasslands Reserve Draft
Management Plan." Dep. Cons. & Enviro. Melbourne.
' Culvenor , R.A. (1981) "Aspects of the Phosphorus nutr i t ion of some Austral ian ^
nat ive grass species." M.Agr .Sc i . Thesis. La Trobe University. ..
Dainton, L. (1994) "Rev iew of Serrated Tussock. " Unpublished Report. -
Depar tment of Agr icu l ture. Colac.
52

Fisher, H.J . (1974 ) " M e c t ^ ni t rogen fBrt i l i .Pr on . ^anoaroo o r . . .
{Themeda australLs) qrassland." Australian Journal of Experimental Agriculture
& Animal Husbandry. 1 4 : 5 2 6 - 5 3 2
Frood, D. & Calder, M . (1987) "Nature Cnn.sPrvation in V intnr i^ " V ic tor ian
Nat ional Parks Assoc ia t i on . Melbourne.
Groves, R.H. (1965 ) " G r o w t h of Themeda tussock grasslands at St. Albans.
V ic to r ia . " Australian Journal of Botany. 1 3 : 2 9 1 - 3 0 2
^ Groves, R.H., Kerai t is, K. & Moore, C.W.E. (1973) "Relative g r o w t h of
Themeda australis & Poa labillardieri \n pots in ' response to ohosohorus and
n i t rogen. " Australian Journal of Botany. 21 :1 -11
I Groves, R.H. (1975) " G r o w t h and developement of Five Populat ions of
Themeda australis in Response to Temperature" Australian Journal of Botany.
2 3 : 9 5 1 - 6 3
. Groves, R.H. (1981 ) "Aust ra l ian Vegeta t ion . " Cambridge Univers i ty Press.
Hong Kong.
Hagon, M . W . & Chan, C .W. (1977) "The e f fec ts of moisture stress on the
germinat ion of some Austra l ian native grass seeds." Journal of Experimental
Agriculture and Animal Husbandry. 17 :86-9
' K i rkpatr ic , J .B. (1986 ) "Viabi l i ty of bush in Cities - Ten vears if change in an
Urban Grassy W o o d l a n d . " Australian Journal of Botany. 3 4 : 6 9 1 - 7 0 8
N Lunt , I .D. (1990) " Impac t of a autumn fire on a long - grazed Themeda triandra
(Kangaroo grass) grassland. " Victorian Naturalist. 1 0 7 : 2 : 4 5 - 5 0
52

• Lunt, l .D. (1991) ' m n a a e m e n r of rP,^nant lowlanrl nr^^^.l^nds and nr^.ssv
a revj^- Victorian Naturalists.
1 0 8 : 3 : 5 6 - 6 6
' McLendon, T. & Redente, E.F. (1991) "Nitrogen and nhosphoni.s Rffanrs on
secondary succession dynamics on semi-arid sanebrush si te." Ecology.
7 2 : 6 : 2 0 1 6 - 2 0 2 4
Muir, A. (1992) "Recovery Plan for Western Plains Grassland (Victor ia)."
Dept. Cons. & Env. Victor ia.
. Piper, C.S. (1944) "Soil and Plant Analysis."-
- Rump, H.H. & Krist, H. (1988) "Laboratory manual for the examination of
water , was te wa te r and soil." V.C.H. Germany.
Scarlet t , N.H. (1992) Field Guide to Victoria's Native Grasslands." Victoria
Press. Melbourne.
S tuwe, J. & Craigie, V. (1992) "Derrimut Grasslands Reserve Draft
Manaoement Plan." Dep. Cons. & Enviro. Melbourne.
• S tuwe, J. & Parsons, R.F. (1977) "Themeda australis grasslands on the Basalt
Plains, Victor ia: f lor ist ics and management ef fects . " Australian Journal of
Ecology. 2 : 4 6 7 - 4 7 6
- Sut ton , C.S. (1916) "A sketch of the Keilor Plains f lora" Victorian Naturalist.
33 :1 12-43
Ti lman, D. & Downing, J .A . (1994) "Biodiversity and stabil i ty in grasslands."
Nature. 367
53

, Turner , F. (1891) "Forage Plants of AusTralia." Departnnent of Agr icu l ture .
N e w Sou th Wales.
' Wi l son , A . D . , & Hodgk inson, K.C. (1990) "The Response of Grasses to Grazing
and i t ' s impl ica t ions fo r the Management of Native Grasslands." Proceedings of
Native Grass Wor/<sfiop. Austra l ian Woo l Corporat ion. 4 7 - 5 7
54

APPENDIX 1
PREPARATION OF REAGENTS
- ANALYSIS OF PHOSPHORUS
POTASSIUM PERSULPHATE SOLUTION : Dissolve 50g Potassium Persulphate in
lOOOmL of distilled water.
If stored at room temperature in an amber bottle, the solution is stable for at least two
weeks.
REAGENT A : 76.8g ammonium molvbdate (A.R.) is dissolved in approx. 200 mL
distilled water. 1.7554g antimony potassium tartrate is dissolved in approx. 100 m l
distilled water. 896 m l 18 M sulfuric acid is dissolved in 500 mL of water. The first
two reagents are added to the dillute sulfuric acid and the solution dilluted to 2 litres
wi th distilled water. This solution is stored in a refrigerator.
REAGENT B : 1.7006g ascorbic acid is dissolved in 100 mL distilled water, 50 mL
reagent A are added to 200 mL ith distilled water. This reagent must be prepared fresh
daily.
STANDARD PHOSPHORUS SOLUTION : (50 ppm and 5 ppm) 0.21 94g KH2PO4 is
dissolved in approximately 100 mL distilled water, 5 mL 18M sulfuric acid added and
the solution dilluted to 1 litre wi th distilled water. This stock solution contains 50 ppm
P. 50 mL of this solution are dilluted to 500 mL to give a working standard of 5 ppm
P.
55

APPENDIX 2
PREPARATION OF REAGENTS
- ANALYSIS OF NITROGEN
REACTION MIXTURE : 5g selenium, 5g copper sulphate (CusoJ, 250g sodium
sulphate (anhydrous) re mixed in a mortar and stored under dry condit ions.
SODIUM HYDROXIDE : Dissolve 28g Sodium Hydroxide in 200 mL distilled water .
INDICATOR SOLUTION : Dissolve one vial of indicator mixture (O.lg) in 1000 mL
of disti l led water . Add 0 .10 mL of 0.1 M NaOH.
The absorbance of this solut ion must be checked before use. The indicator solut ion
must be prepared one day prior to use.
56