Embed Size (px)
Citation preview
1
WOOD DECAY IN LIVING TREES IN EASTERN AMAZONIA, BRAZIL
By
ANA ALICE ELEUTÉRIO
A DISSERTATION PRESENTED TO THE GRADUATE SCHOOL OF THE UNIVERSITY OF FLORIDA IN PARTIAL FULFILLMENT
OF THE REQUIREMENTS FOR THE DEGREE OF DOCTOR OF PHILOSOPHY
UNIVERSITY OF FLORIDA
2011

2
© 2011 Ana Alice Eleutério

3
To those who shared this road with me

4
ACKNOWLEDGMENTS
First and foremost, I thank my academic advisor, Francis E. Putz for his support of
my pursuit for doctorate degree at the University of Florida (UF). His willingness to
share his knowledge about ecology, eagerness to learn about my research progress,
and the innumerable discussions we held throughout these last five years have been
essential to my development as a researcher. I am also extremely grateful to the other
members of my doctoral committee, Wendell Cropper, Jason Smith and Kaoru Kitajima
for all their suggestions and guidance through this process. I thank James Kimbrough,
also at UF, for all his patience in teaching me the basics of fungi identification.
This research would not have been possible without the support of my Brazilian
collaborators at the Instituto Floresta Tropical (IFT). I especially thank Johan Zweede
and Marco Lentini for believing in my research and for providing incredible logistic
support during my field work. I also thank Iran Pires, Paulo Bittencourt, Marlei Nogueira,
and Cesar Pinheiro for sharing their amazing field experiences and for facilitating my
research in all possible ways. I thank Suelene Couto, Greice Ferreira, and Sonia
Machado for their help me dealing with financial issues. I am grateful to the IFT crew,
especially my field assistants Arivaldo Souza, Sebastião Santos, Joel Ferreira, Valderez
Vieira, Marina Cardoso, and Lorena Cardoso, for turning the sometimes exhausting field
work into a joyful experience.
Laboratory experiments were made possible by the logistic support and expertise
provided by researchers and staff from the Coordenação de Pesquisa em Produtos
Florestais (CPPF) at the Instituto Nacional de Pesquisas da Amazônia (INPA). I thank
Maria Aparecida de Jesus and Rogério Hanada for introducing me to the complex world
of fungi and for facilitating my work in many ways, and Jorge Freitas for helping me

5
understand the basics of wood anatomy research. Laboratory analysis would not have
been completed without the help of Francislene Telles. I owe her my deepest gratitude
and friendship. I thank Jose Odair Pereira for providing laboratory infrastructure at the
Universidade Federal do Amazonas (UFAM). I also thank Gabriela Zanette, who is both
a collaborator and a friend, for helping me deal with the difficulties that cropped up while
carrying out my molecular biology studies.
I thank my friends Marcos Bento, Carla Bantel, Yara Camargo, Pedro Teixeira,
Luciana Zago, and Satya Cadenholf in Brazil for all the philosophical discussions about
life in general and particularly about life in the Amazon, and for all the happiness they
bring to my life. I am grateful to Leonardo Pacheco, Flavio Bocarde and Carlos Anselmo
for offering me shelter in Manaus. I also thank Antonio de la Peña, Cynnamon Dobbs,
Marco Lentini, Andres Susaeta, Marina Londres, Belen Ragablino, Camila Pizano,
Geraldo Silva, Skya Murphy, Christine Lucas, Marlene Soriano, Paula Pinheiro, Daniel
Carrillo, Yuan Zhou, and Jordan Mayor at UF for making graduate life fun and
unforgettable.
Experiences shared with my office mates Joe Veldman, Paulo Brando, Vincent
Medjibe, Allie Shenkin, Claudia Romero, Drew Silver, Xavier Haro, and Yuan Zhou at
UF have been essential for improving my critical thinking skills. I thank them for making
the office such a friendly environment. Also at UF, I thank the Department of Biology
staff, particularly Karen Patterson and Tangelyn Mitchell, for guiding me through UF’s
bureaucracy, and Ann Wagner for all the help she provided and good laughs we shared
when preparing experiments and organizing the laboratory for Introductory Botany and
Plant Ecology.

6
My parents Kathia and Sérgio Eleutério and my brother Sergio consistently
provided me with a safe harbor during these ten years that I have been living abroad.
Their words of encouragement and their unconditional love have accompanied me
everywhere, and supported me through my most difficult moments. I appreciate their
trust in me and in my work, even when my study subjects were incomprehensible and
required me to walk alone and away from home. I feel extremely lucky to be part of my
family and thank them for being always nearby, even when really far away.
My doctorate studies were financed by the Coordenação de Aperfeiçoamento de
Pessoal de Nível Superior (CAPES), the Tropical Conservation and Development
Program, and the Department of Biology at the University of Florida. Additional financial
support for my research was provided by the International Foundation for Science (IFS)
and Ideawild.

7
TABLE OF CONTENTS page
ACKNOWLEDGMENTS .................................................................................................. 4
LIST OF TABLES ............................................................................................................ 9
LIST OF FIGURES ........................................................................................................ 11
ABSTRACT ................................................................................................................... 13
CHAPTER
1 DISTRIBUTION OF HEART-ROTTED AND HOLLOW TREES IN A NATURALLY REGENERATED FOREST MANAGED FOR TIMBER IN EASTERN AMAZONIA ........................................................................................... 15
Introduction ............................................................................................................. 15
Methods .................................................................................................................. 17
Study Site ......................................................................................................... 17
Cavity Trees Detected in Forest Inventories (CAVs) ........................................ 19
Trees with Rotten Cores or Hollows Detected During Exploratory Activities (ROTs) .......................................................................................................... 21
Results .................................................................................................................... 22
Descriptive Analysis ......................................................................................... 22
Spatial Autocorrelation Among CAVs ............................................................... 23
Predictive Model for CAV Occurrence .............................................................. 23
ROT Occurrence Predictive Model ................................................................... 24
Discussion .............................................................................................................. 25
2 SHORT-TERM IMPACTS OF SELECTIVE LOGGING ON THE DIVERSITY OF DECAY FUNGI IN EASTERN AMAZONIA ............................................................. 41
Methods .................................................................................................................. 44
Study Site ......................................................................................................... 44
Data Collection ................................................................................................. 45
Data Analysis ................................................................................................... 46
Results .................................................................................................................... 48
Discussion .............................................................................................................. 50
3 HEARTWOOD DECAY IN LIVING TREES IN EASTERN AMAZON ...................... 61
Methods .................................................................................................................. 64
The Study Site .................................................................................................. 64
Heartwood Hollow Dimensions ......................................................................... 65
Heartwood Anatomy ......................................................................................... 66
Fungal Diversity ................................................................................................ 67

8
Termite Assemblages ....................................................................................... 70
Results .................................................................................................................... 70
Heartwood Hollow Dimensions ......................................................................... 70
Heartwood Anatomy ......................................................................................... 71
Fungal Diversity ................................................................................................ 72
Termite Assemblages ....................................................................................... 73
Discussion .............................................................................................................. 73
Conclusion .............................................................................................................. 77
LIST OF REFERENCES ............................................................................................... 88
BIOGRAPHICAL SKETCH .......................................................................................... 102

9
LIST OF TABLES
Table page 1-1 Tree species with ≥ 200 individuals ≥ 45 cm DBH in the sampled area of
approximately 2113 ha in Fazenda Cauaxi. ....................................................... 35
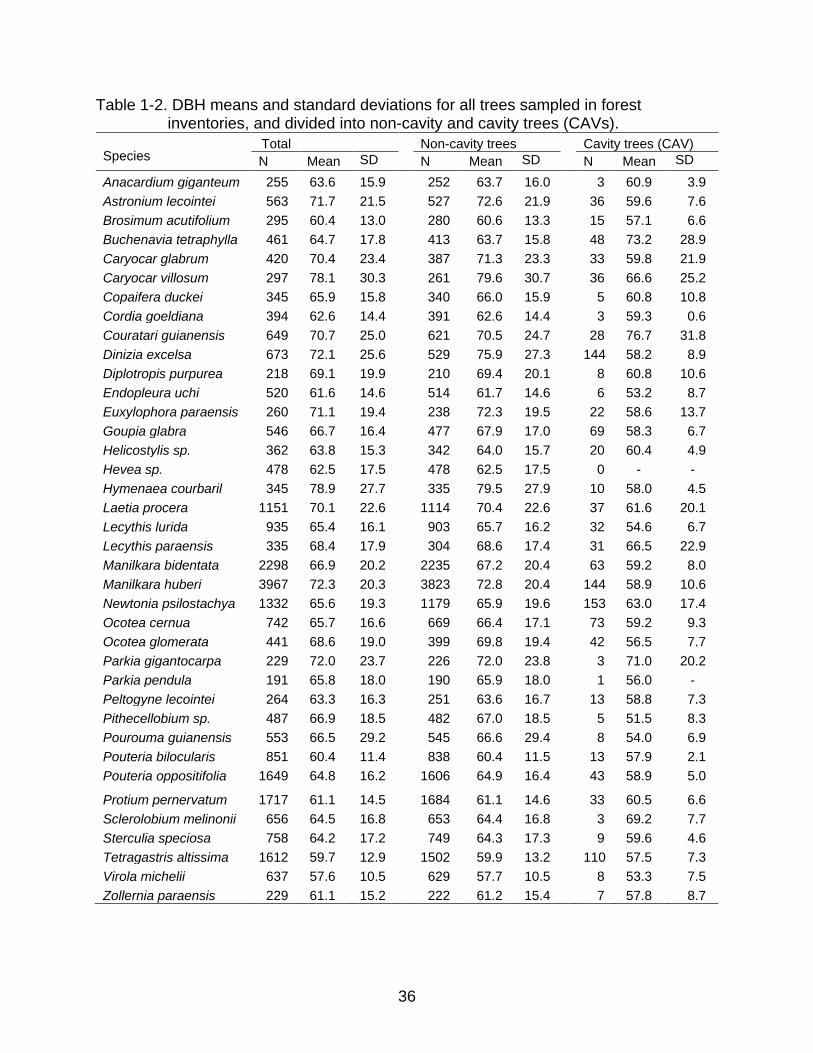
1-2 DBH means and standard deviations for all trees sampled in forest inventories, and divided into non-cavity and cavity trees (CAVs) ....................... 36
1-3 Percent frequencies of tree densities (≥ 45 cm DBH) within 10 m radius around cavity (CAV) and non-cavity trees by forest management unit (UT) ....... 37
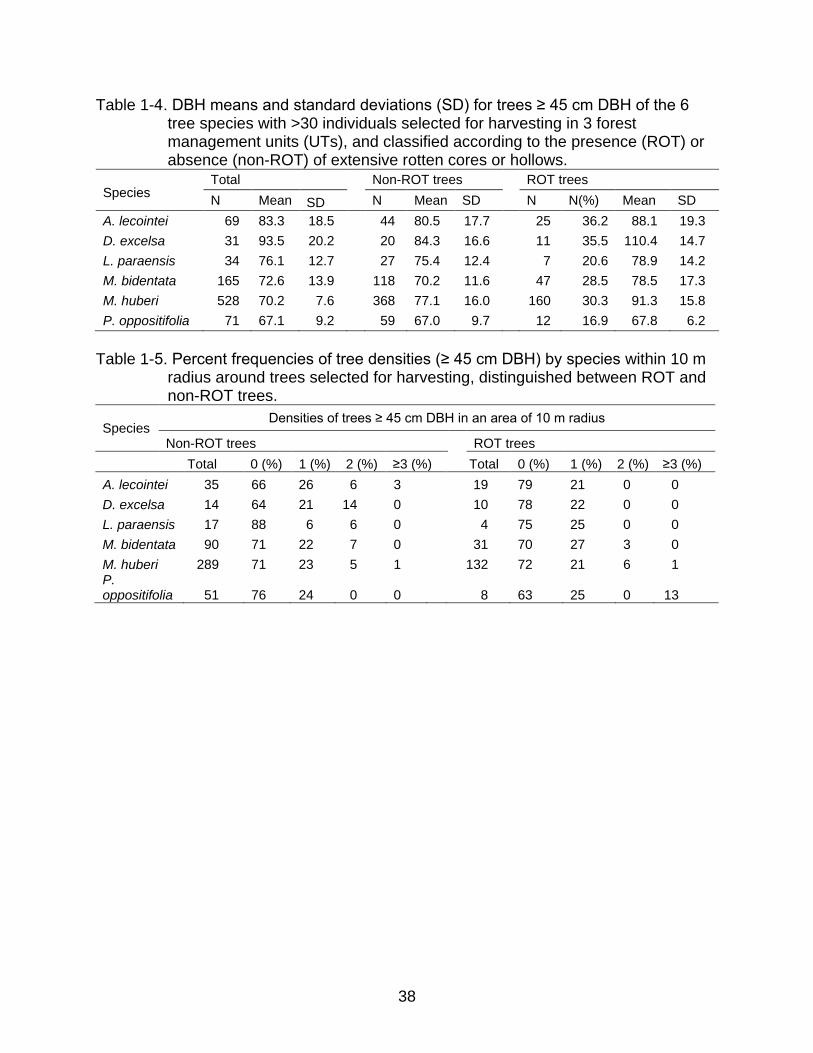
1-4 DBH means and standard deviations (SD) for trees ≥ 45 cm DBH of the 6 tree species with >30 individuals selected for harvesting in 3 forest management units (UTs) .................................................................................... 38
1-5 Percent frequencies of tree densities (≥ 45 cm DBH) by species within 10 m radius around trees selected for harvesting, distinguished between ROT and non-ROT trees .................................................................................................... 38
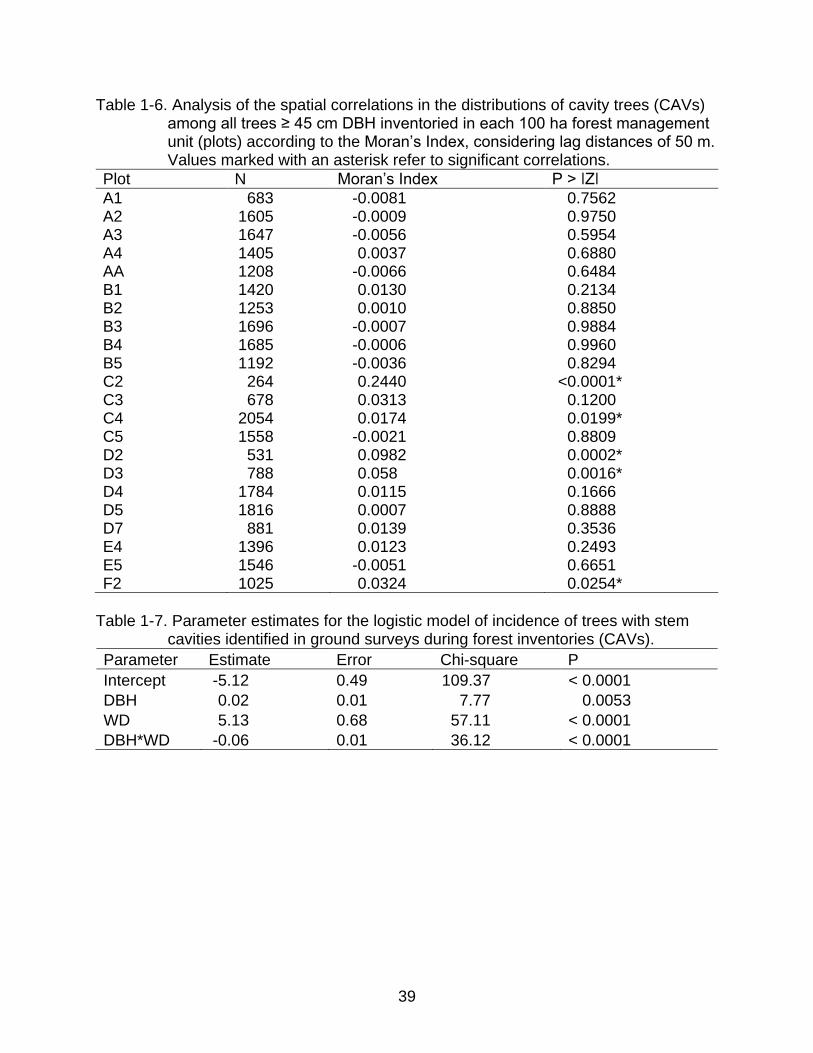
1-6 Analysis of the spatial correlations in the distributions of cavity trees (CAVs) among all trees ≥ 45 cm DBH inventoried in each 100 ha forest management unit (plots) according to the Moran’s Index ......................................................... 39
1-7 Parameter estimates for the logistic model of incidence of trees with stem cavities identified in ground surveys during forest inventories (CAVs) ............... 39
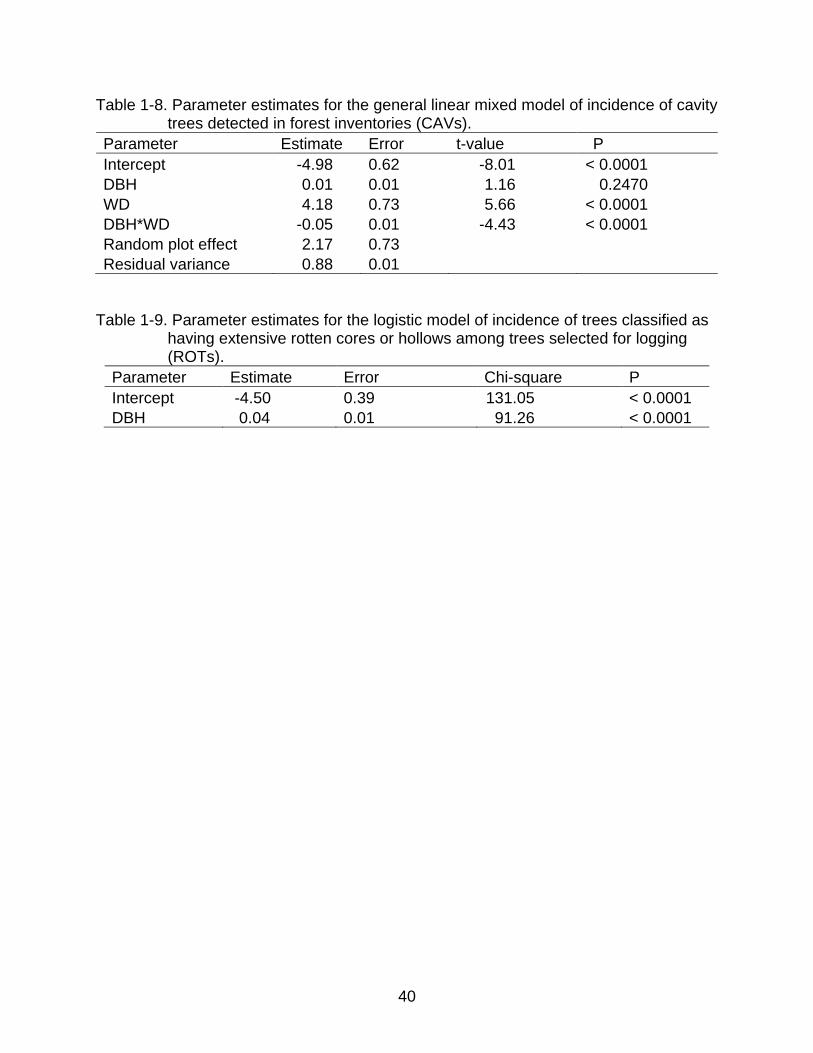
1-8 Parameter estimates for the general linear mixed model of incidence of cavity trees detected in forest inventories (CAVs) ........................................................ 40
1-9 Parameter estimates for the logistic model of incidence of trees classified as having extensive rotten cores or hollows among trees selected for logging (ROTs) ................................................................................................................ 40
2-1 Fungal species richness by sample for each site and census period ................. 58
2-2 Distribution of coarse woody debris (CWD) sampled in the control and logged sites according to the type of substrate, diameter class, and decay stage ......... 60
3-1 Heartwood anatomical traits (mean ± SD) for the five tree species studied. ...... 85
3-2 Regression with the two most important principal components (PC) for heartwood anatomical traits on hollow area ....................................................... 85
3-3 Fungal species isolated from cultures of wood samples of the five tree species studied, and corresponding species richness estimators Chao 2 and ICE, and Simpson’s diversity index (1 - D) ......................................................... 85
10
3-4 Fungal species isolated from cultures of heartwood samples of the 5 tree species studied, and identified through DNA purification and amplification of ITS sequences using primers ITS-1 and ITS-4 ................................................... 86
3-5 Termite species sampled in heartwood hollows of the five studied tree species ............................................................................................................... 87
3-6 Logistic regression estimates for the presence of Coptotermes testaceus colonies in heartwood hollows of the four tree species with N ≥ 20 individuals sampled .............................................................................................................. 87

11
LIST OF FIGURES
Figure page 1-1 Steps performed to select commercial trees for logging in Fazenda Cauaxi.
In light and dark grey are the steps for which inventory and pre-logging data were available ..................................................................................................... 29
1-2 Number of trees ≥ 45 cm DBH of the 38 most abundant timber tree species encountered in each of the 22 forest management units (approximately 100 ha each) showing the proportion of cavity trees identified by the presence of external openings during forest inventories (CAVs) in each unit ........................ 30
1-3 Number of trees of each of the 38 most abundant timber tree species with ≥200 individuals, showing the proportion of cavity trees classified as hollow in forest inventories (CAVs) .................................................................................... 30
1-4 Variation in the distribution of trees ≥ 45 cm diameter at breast height (DBH) inventoried in all forest management units, and classified as non-cavity and cavity trees by inventory crews (CAVs) according to DBH by species ............... 31
1-5 Percentage of cavity trees identified during forest inventories (CAVs, N = 1317) by species according to their wood density (g/cm3) .................................. 32
1-6 DBH variation between trees tested for hollowness immediately before logging, classified according to the presence (ROT) or absence (non-ROT) of heart-rots and hollows ........................................................................................ 33
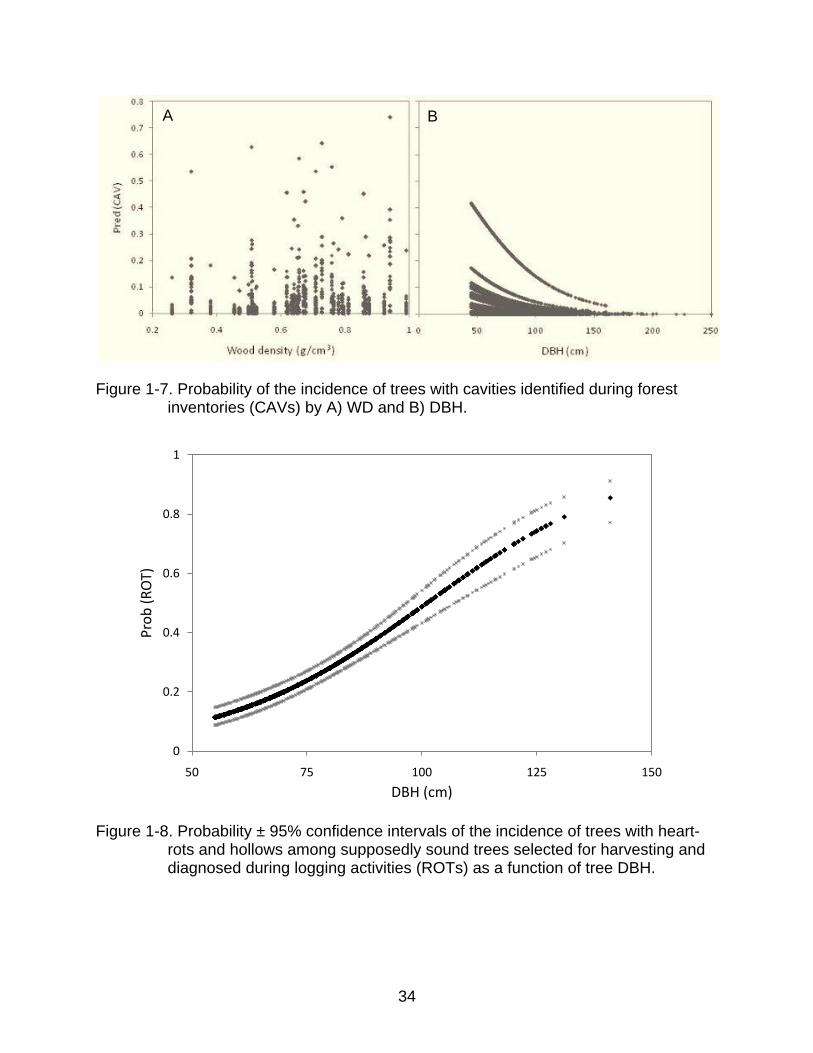
1-7 Probability of the incidence of trees with cavities identified during forest inventories (CAVs) by A) WD and B) DBH ......................................................... 34
1-8 Probability ± 95% confidence intervals of the incidence of trees with heart-rots and hollows among supposedly sound trees selected for harvesting and diagnosed during logging activities (ROTs) as a function of tree DBH ............... 34
2-1 Distribution of sampled coarse woody debris (CWD) by A) diameter range measured in cm, and B) decay categories (1 – 4 from light to intensely decayed wood) in the control (N = 225) and logged sites (N = 216) ................... 54
2-2 Mean (± SE) number of fungal species by sample of CWD in each census period and for all periods together (sample sizes: N = 225 in the control, and N = 216 in the logged site ................................................................................... 55
2-3 Coleman rarefaction curves of fungal species richness by sample in the control and logged sites for all census periods compiled (N = 216 per site) ....... 55

12
2-4 Two-dimensional solution of the nonmetric multidimensional scaling (NMS) ordination comparing species composition in each census period (numbered 1 – 3) and site (L = logged, N = 216; C = control, N = 225). Species that occurred in only one sample were not considered in this analysis ..................... 56
2-5 Model predictions of fungal species richness by sample of CWD (N = 441) for the significant variables A) decay stage, B) diameter class, and C) substrate ... 57
3-1 Tree stem basal area and area of stem hollows by tree species; both measured at 50 cm from the ground ................................................................... 78
3-2 Variation in A) stem hollow area and B) percent hollow area by tree basal area for the four tree species with N ≥ 20 individuals sampled ........................... 79
3-3 Heartwood anatomy of Manilkara huberi ............................................................ 80
3-4 Heartwood anatomy of Manilkara bidentata ....................................................... 80
3-5 Heartwood anatomy of Pseudopiptadenia psilostachya ..................................... 81
3-6 Heartwood anatomy of Dinizia excelsa ............................................................... 81
3-7 Heartwood anatomy of Astronium lecointei ........................................................ 82
3-8 Principal components analyses of wood anatomical characteristics for D. excelsa, P. psilostachya (respectively De and Pp; N = 9), M. huberi, M. bidentata (Mb), and A. lecointei (respectively Mh, Mb, and Al; N = 10) .............. 82
3-9 Coleman rarefaction curves of fungal species richness by heartwood sample for the four tree species with N ≥ 20 individuals sampled ................................... 83
3-10 Two-dimensional solution of the nonmetric multidimensional scaling (NMS) ordination comparing fungal species composition isolated from heartwood samples from the four tree species with N ≥ 20 individuals ................................ 83
3-11 Presence and absence of termite colonies in the rotten heartwood per tree species ............................................................................................................... 84
3-12 The probability of a tree hosting a Coptotermes testaceus colony as a function of wood density ..................................................................................... 84

13
Abstract of Dissertation Presented to the Graduate School of the University of Florida in Partial Fulfillment of the Requirements for the Degree of Doctor of Philosophy
WOOD DECAY IN LIVING TREES IN EASTERN AMAZONIA, BRAZIL
By
Ana Alice Eleutério
May 2011
Chair: Francis E. Putz Major: Botany
Tree stem hollows and rotten cores result from the gradual decomposition of the
central woody column (heartwood) by a diverse range of organisms, mostly fungi. From
both ecological and economic perspectives, the decision whether or not to harvest
hollow and heart-rotted trees has substantial consequences. Retaining hollow trees in
forests managed for timber, for instance, helps conserve species that use tree hollows
as nesting sites. In contrast, felled hollow trees are then abandoned in the forest, which
reduces profits to loggers, unnecessarily increases carbon emissions, and increases
forest flammability.
Using data from inventoried stands in a naturally regenerated tropical forest
managed for timber in the eastern Amazon, I investigated how the characteristics of
economically important timber tree species influenced their susceptibility to heartwood
decay. Tree species with higher wood specific gravities were more prone to have
heartwood cavities made evident by the presence of open holes on the exterior of the
trunk. Additionally, the proportion of trees with such stem cavities decreased with tree
diameter. In contrast, for trees with no external openings in which hollows and rotten
14
cores were only detected after felling there was a positive relationship between a tree’s
size and its likelihood of being hollow.
I evaluated the diversity of wood decay fungi in my study site by comparing the
communities of fungi with reproductive bodies emerging from coarse woody debris in an
intact and a logged forest stand before logging and through a 10-month period after
logging. Although no difference in fungal species richness was observed between sites,
changes in the composition of fungal communities through time indicated that rare
species were negatively affected by logging while there was no evident effect on fungal
species that are mostly tree pathogens.
Finally, I sampled heartwood tissues from recently felled trees of five timber
species to explore the diversity of fungi and termites that could actively degrade them,
and evaluate tree characteristics that influenced their susceptibility to pathogen
invasion. Large trees with smaller heartwood vessel sizes and higher ray and vessel
density tended to have larger stem hollows. Fungal specie considered saprophytes and
Coptotermes testaceus, a subterranean termite species, were frequently found in stem
hollows. The presence of termite nests in heartwood varied among species and
increased with wood density, but was not affected by fungal species richness.
15
CHAPTER 1 DISTRIBUTION OF HEART-ROTTED AND HOLLOW TREES IN A NATURALLY REGENERATED FOREST MANAGED FOR TIMBER IN EASTERN AMAZONIA
Introduction
Hollows and rotten cores in the stems of living trees typically result from gradual
colonization and decomposition of heartwood by fungi, coupled with the activity of hole-
excavating animals such as termites and woodpeckers (Rayner & Boddy 1988; Hooper
et al. 1991). Decay organisms gain access to heartwood typically only after a tree
suffers a surface wound, but then only if anatomical barriers and chemical defenses
produced by bark and sapwood tissues are trespassed (Blanchette 1992; Schwarze et
al. 2000).
Hollow and hear-trotted trees are common in most forests, including those
scheduled for timber harvesting (e.g., Shigo & Hillis 1973; Lindenmayer et al. 1997;
Grogan & Schulze 2008). Whether to retain or cut trees with unsound stems is a
question with both ecological and economic implications. Ecological issues deserving
consideration include the fact that hollow, heart-rotted, or even dead-standing trees
provide preferred nesting and roosting sites for numerous species of birds, mammals,
and invertebrates (Gibbons & Lindenmayer 1996; Ranius 2002; Apolinario & Martius
2004). The densities of such trees therefore influences the population dynamics of
numerous species and associated ecosystem processes such as pollination and seed
dispersal (Janzen 1976; Daily 1993; Amelung et al. 2002; Eltz et al. 2003). If defective
trees are felled in error or in the hopes of finding at least one sound marketable log,
they are typically abandoned in the forest or on log decks, increasing fuel loads and
enhancing forest flammability, and unnecessarily increasing carbon emissions (Uhl &
Kauffman 1990; Holdsworth & Uhl 1997; Cochrane 2001; Cochrane & Laurance 2002).

16
From an economic perspective, forests in which trees with unsound stems
frequent are less valued for their timber (Holmes et al. 2002) and contain less sound
wood than expected from their basal areas (Nogueira et al. 2006). Moreover, higher
carbon emissions, and lower values for carbon sequestration may be expected in such
forests (Keller et al. 2004; Ferry et al. 2010), because these defective trees are
susceptible to breakage (Kennard et al. 1996; Lindenmayer et al. 1997; Mattheck et al.
2006) and suffer high mortality rates (Chao et al. 2009).
Spatial concentrations of trees with hollows or rotten cores are expected due to
synergies between individual tree characteristics and environmental conditions
(Holdenrieder et al. 2004; Irianto et al. 2006). For example, clusters of tress with stem or
root damage caused by events such as fire or logging (e.g., Johns et al. 1996; Holmes
et al. 2000; McDonald et al. 2000; Holzmueller et al. 2008) may favor local pathogenic
infections and lead to aggregated distributions of hollow trees. The spread of these
infections depend on landscape features, spatial patterns of vegetation, and the
existence and abundance of susceptible hosts (Holdenrieder et al. 2004).
Trees’ anatomical properties and chemical defenses limit the growth of active
decomposers (Pearce 1996; Behrendt & Blanchette 1997; Boddy 2000; Abe et al. 2000;
Nsolomo & Venn 2000; Deflorio et al. 2008). Thick bark and high wood density confer
some protection against damage and the spread of decay fungi (Romero et al. 2009),
but all trees are susceptible to decay especially if they are senescent or subjected to
physiological stress (Holloway et al. 2007; Chao et al. 2008).
In response to their importance to forest fauna, the incidence of trees with
unsound stems, especially cavity trees, in subtropical and temperate forests has been
17
widely investigated (e.g., Fan et al. 2003; Fox et al. 2008). Static and dynamic, single or
multi-level models using GIS, nearest neighbor imputation models, logistic or negative
binomial regressions, and mixed models have been developed to estimate the number
of cavities available for fauna in forests managed primarily for timber (Ball et al.1999;
Fox et al. 2008; Eskelson et al. 2009). Explanatory variables used in these models
usually reflect tree diameters and heights, crown exposure, stem defects, wood density,
tree density, and micro-environmental characteristics (e.g., Fan 2003; Temesgen et al.
2008; Zheng et al. 2009).
Compared to temperate and subtropical forests, knowledge about the occurrence
and distribution of heart-rotted and hollow trees in high diversity tropical forests is
scarce. In this study, I evaluated the distribution of these trees in a forest managed for
timber in the eastern Brazilian Amazon. Additionally, I used individual-level models to
estimate the likelihood of a tree having an unsound stem given its dimensions and tree
density, and wood density by species. My objective was not to predict the abundance of
such trees in the studied forest, but instead to understand individual and species-level
characteristics that influence tree susceptibility. I predicted that the likelihood of a tree
stem being heart-rotted or hollow increases with its size and the density of trees in its
immediate vicinity, and decreases with wood density.
Methods
Study Site
This study was carried out in Fazenda Cauaxi (3o35’ - 3o45’ S, 48o15’ - 48o25’ W),
a selectively logged naturally regenerated forest in the eastern Brazilian Amazon
(Holmes et al. 2002; Keller et al. 2004). The area is covered by lowland tropical moist
forest and is located in the Paragominas municipality, Para, Brazil (IBGE 1988). Oxisols
18
prevail on the relative flat to slightly rolling terrain dissected by small creeks. The
climate is moist tropical with annual rainfall averaging 2200 mm and a pronounced dry
season that typically lasts from June to November (Costa & Foley 1998).
In 1995, a non-governmental institution (Instituto Floresta Tropical; IFT)
established, in collaboration with the landowner (CIKEL Brasil Verde S.A.), which is
currently recognized as the most important training center for reduced-impact logging
(RIL) techniques in the Amazon (Putz et al. 2008). During selective logging operations,
which of the 91 tree species currently recognized as potentially commercial by IFT are
harvested is determined by market demand and limited by RIL rules regarding
maximum harvestable timber volumes per area. Timber extraction is carried out in forest
management areas divided into units (UTs) that average 100 ha and are shaped to suit
the terrain. During timber stand inventories conducted 1 yr prior to logging, all
commercial or potentially commercial trees ≥ 45 cm diameter at breast height (DBH)
were identified, mapped, and classified according to crown and stem characteristics
(Fundação Floresta Tropical 2002). DBHs were estimated when stem buttresses
extended above 1.3 m. Dead standing trees were not inventoried.
Trees with stem cavities were recorded both in inventories and during logging.
During forest inventories, trees having obvious cavities were identified, mapped and
subsequently categorized as hollow and non-marketable. Trees were also classified as
hollow by harvesting crews immediately before felling if they showed signs of heartwood
decay even in the absence of external evidence of internal cavities (e.g., presence of
bee hives and/or fungal colonies on the stems). In these cases, foresters usually
verified the presence of an internal cavity by testing whether they produce a hollow

19
sound when knocked. Finally, all trees selected for extraction were tested for the
presence of hollows or heartwood decay immediately prior to logging by inserting a
chainsaw vertically into the trunk between the buttresses at about 50 cm from the
ground. Trees with hollows or rotten cores that exceed 30 cm in diameter (i.e.,
approximately half of 65 cm bar length) were considered non-marketable and were not
felled. In a sample of 3 UTs, approximately 27% of the trees listed for logging by
inventory crews were later classified as non-marketable by harvesting crews (data not
shown).
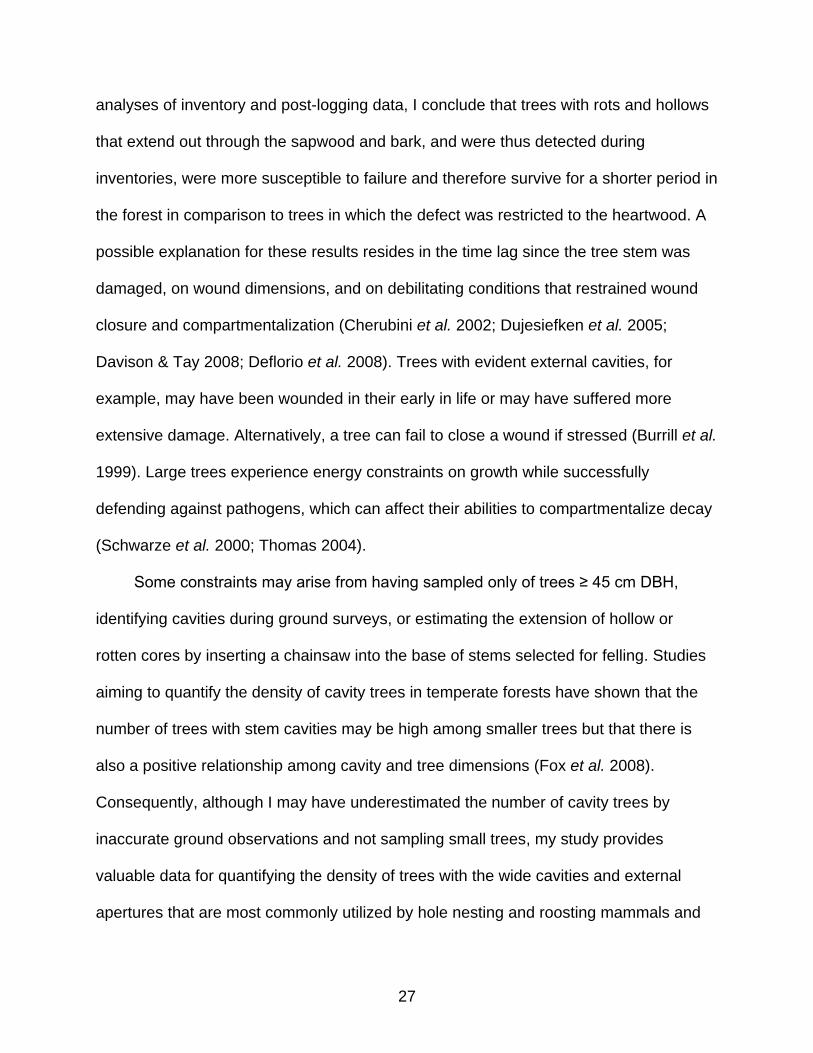
To be felled, a tree must meet the following criteria in the sequence shown in
Figure 1-1: (1) its DBH is ≥ 45 cm; (2) no obvious cavities or signs of heartwood decay
are present; (3) there is a market demand for the wood of that species; (4) the
maximum timber volume allowed to be extracted would not be exceeded; and, (5) tests
performed just before the tree is felled show no evidence of advanced heartwood decay
or hollows. As a consequence of this process, only trees with sound stems that had
been selected for harvesting were tested for heartwood decay as a pre-logging
procedure (step 5 in Figure 1-1). For this reason, I used two separate models to
investigate the probability of a tree having an unsound stem. First, trees with obvious
stem cavities detected during inventories (CAV) were evaluated. Then, I used data from
the trees with sound stems that had been further investigated for the presence of heart-
rots or hollows (ROT) using the chainsaw bar plunge test right before felling to evaluate
the probability of those trees to have internal cavities.
Cavity Trees Detected in Forest Inventories (CAVs)
Inventory data from 22 UTs covering approximately 2113 ha were used to
investigate the distribution of CAVs. Because the dimensions and shapes of the UTs
20
varied somewhat with the terrain, only the central 100 ha of each unit and trees >10 m
from the edge were considered. The density of trees ≥ 45 cm DBH occurring in an area
of 10 m radius around each focal tree was calculated using Proc Variogram (SAS 9.2
Institute Inc. 2009). These criteria resulted in a sample size of 28,115 trees of which
1317 (5%) were classified as hollow during forest inventories. Only the 38 tree species
with ≥ 200 individuals in the sampled area were included in this analysis (Table 1-1).
These species represent 19 families and 32 genera, with wood densities of 0.26 - 0.99
g/cm3 (Zanne et al. 2009).
I used Moran’s Index to investigate the spatial autocorrelations in the distributions
of CAVs in each of the twenty-two 100-ha management units. To calculate the index, I
used distance intervals up to 50 m to reflect the area of possible influence of a tree on
its environment and surrounding trees, and vice-versa. Positive values correspond to
spatial aggregation, while negative values correspond to over-dispersion on a -1 to +1
scale. Z-scores reflect autocorrelations with P<0.05. The index was calculated in SAS
Proc Variogram (SAS 9.2 Institute Inc. 2009).
Logistic tree-level models used to predict the presence or absence of cavities in
individual trees were based on its DBH, wood density (WD) by species, and density of
trees >45 cm DBH in a 10 m radius area surrounding each focal tree were built in SAS
Proc Logistic (SAS 9.2 Institute Inc. 2009). Species-specific WDs were estimated based
on the average from values reported in the Global Wood Density Database (Zanne et al.
2009; see Chave et al. 2009 for a description). Average WD by genus was used for two
species due to lack of species-specific data (Peltogyne lecointei Ducke and Protium
pernervatum Cuatrec) and when trees in the same genus were not identified to species
21
during forest inventories (Hevea sp. Aubl., Pithecellobium sp. Mart., and Helicostylis sp.
Trécul), which together corresponded to approximately 12% of the trees studied.
Logistic models with the explanatory variables and their possible interactions were
compared using the Akaike’s information criterion (AIC; Akaike 1974). Fitting
parameters and AIC values are shown for the best-fit model. To investigate the effects
of spatial dependence due to sampling trees within plots, I used a generalized linear
mixed model (GLMM) with the predictors of the logistic model, and plot as a random
factor. This analysis was performed using Proc GLIMMIX (SAS 9.2 Institute Inc. 2009).
Fitting parameters are shown for the final model.
Trees with Rotten Cores or Hollows Detected During Exploratory Activities (ROTs)
Post-logging data available for 3 UTs were used to investigate the presence of
heartwood hollows or rotten cores in trees selected for harvesting (i.e., trees ≥ 45 cm
DBH with straight stems, regular crowns, and no obvious cavities). Only the 6 species
with ≥ 30 trees (Astronium lecointei Ducke, Dinizia excelsa Ducke, Lecythis paraensis
Huber, Manilkara bidentata (A. DC.) A. Chev., Manilkara huberi (Ducke) A. Chev.,
Pouteria oppositifolia (Ducke) Baehni), representing 4 families and 898 individuals in an
area of approximately 288 ha were analyzed. Average WD by species varied from 0.32
to 0.79 g/cm3 (Table 1-1). No spatial autocorrelation analysis was performed because
data were available for only a small subset of the trees mapped.
A binary response variable was created to classify trees according to their post-
logging categories. Logistic models to predict the presence or absence of heartwood
extended hollows or decay on trees selected for harvesting based on DBH, WD, and
tree density in a 10 m radius area around each focal tree were built in SAS Proc Logistic
22
(SAS 9.2 Institute Inc. 2009). Tree densities were calculated for the 700 individuals
located ≥ 10 m from the UT borders, and compared among hollow and non-hollow trees
identified during logging to evaluate if this variable should be incorporated in the
predictive model. Fitting parameters and AIC values are shown for best-fit model.
Results
Descriptive Analysis
Each of the 22 UTs contained a mean of 1300 inventoried trees ≥ 45 cm DBH
(range 264 – 2054). Manilkara huberi was the most abundant commercial species. The
number of cavity trees detected in forest inventories (CAVs) varied considerably among
both species and UTs. The proportion of CAVs by unit averaged 5% and ranged 0.1 –
30%, while the proportion of CAVs by species varied from 0.5 to 21% (Figures 1-2 and
1-3). In general, UTs in which tree densities were above average had the highest
proportions of CAVs (Figure 1-2). In contrast, this positive relationship between tree
abundance and proportion of CAVs was not observed at the species level. Dinizia
excelsa, for example, a species with an intermediate abundance among the 38 species
considered in the analysis, was the most frequently hollow among the 38 studied
species (> 20%, Figure 1-3).
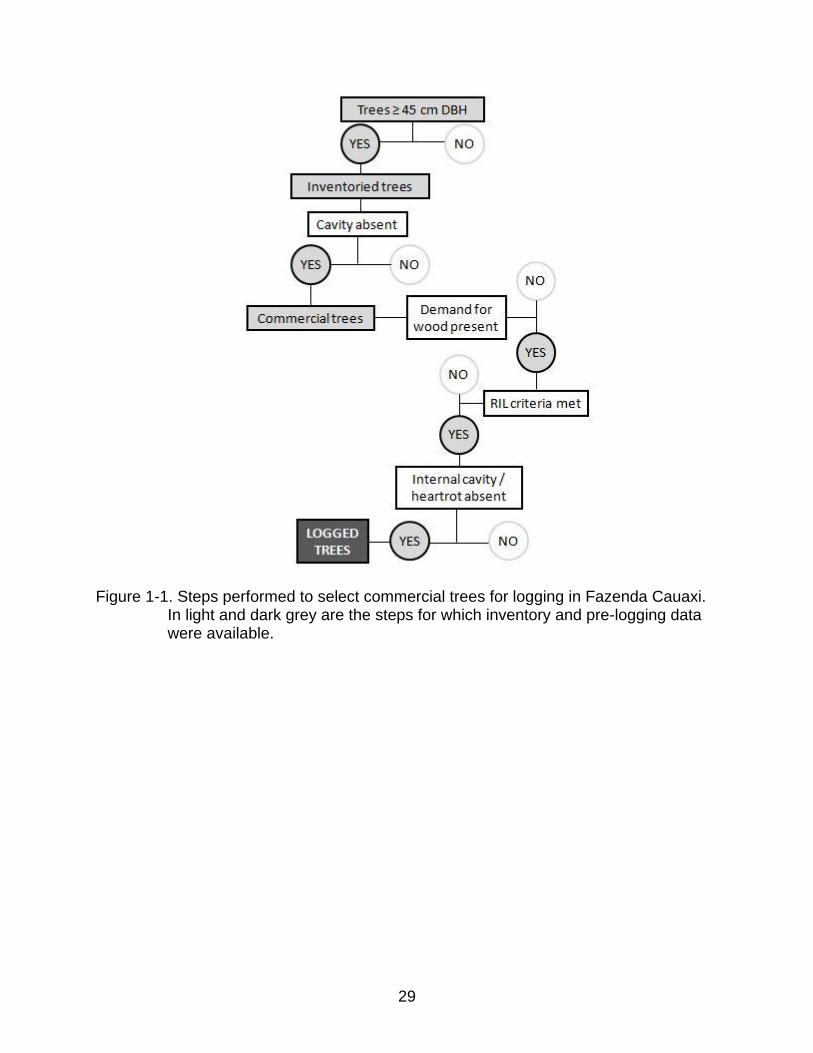
Average DBH was higher and more varied for non-CAV than for CAV trees in most
species, including those with high percentages of CAVs (e.g., Dinizia excelsa, Manilkara
huberi, Newtonia psilostachya (DC.) Brenam and Tetragastris altissima (Aublet) Swart;
Table 1-2 and Figure 1-4). Trees in this study ranged from 45 – 250 cm DBH, with an
average for most species of between 60 and 70 cm (Table 1-2).
The percentage of CAVs by species increased slightly with WD (R2 = 0.11, p =
0.03; Figure 1-5). The weakness of this relationship was in part due a few species with

23
low cavity incidence and low WD, and to Dinizia excelsa, a species with high WD but
also the highest cavity incidence. Most trees grew in areas with low densities of trees ≥
45 cm DBH (i.e., only 1-2 trees ≥ 45 cm DBH in an area of 10 m radius surrounding
each focal tree). Even in UTs with above average tree densities, most inventoried trees
were not locally crowded by other large trees (Table 1-3).
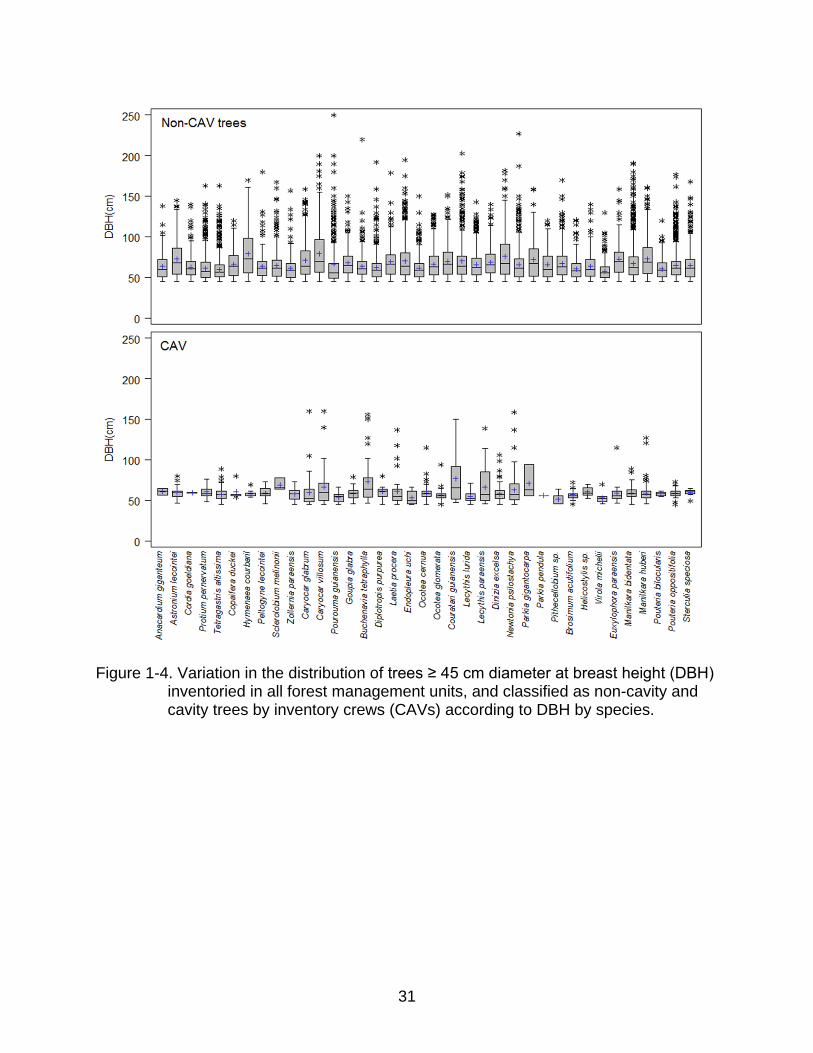
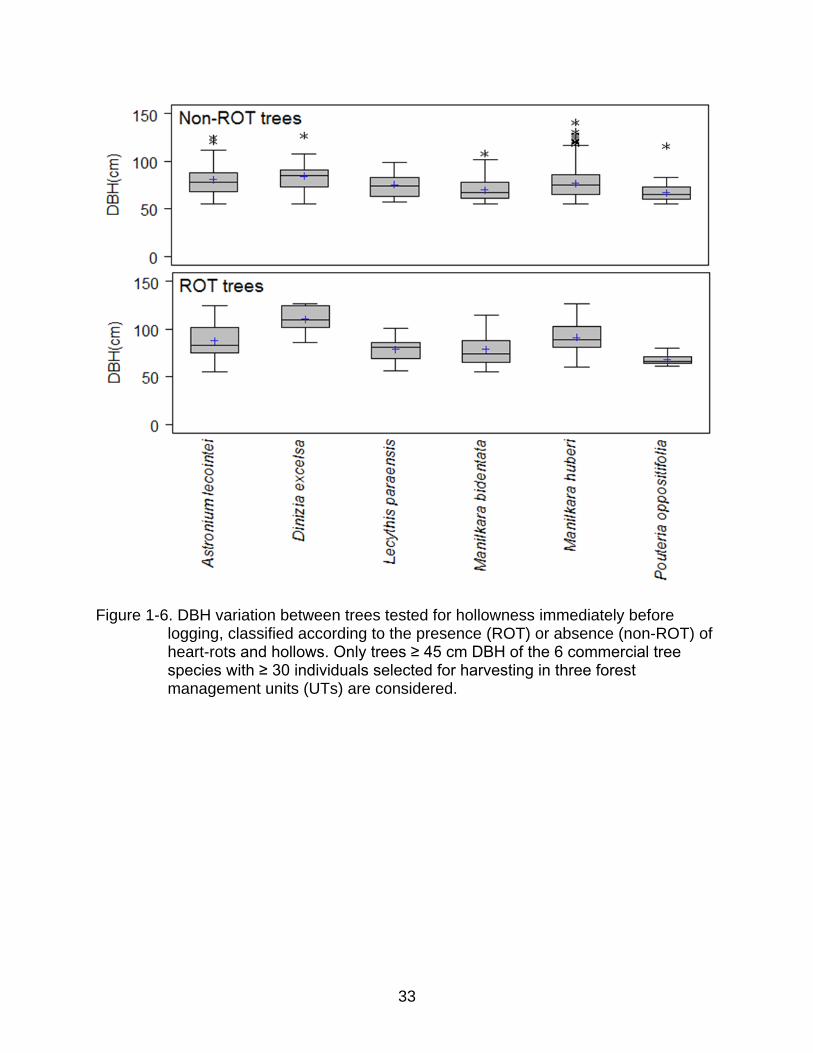
The proportion of defective trees increased substantially after trees were tested
using the chainsaw bar plunge test right before logging. In other words, the foresters
that conducted the inventories were not consistently able to predict the presence of
heart-rots and hollows in the stems of trees large enough to be harvested. The
underestimations varied from approximately 17% for Pouteria oppositifolia to 36% for
Astronium lecointei (Table 1-4). Average DBHs among ROT trees were higher than for
non-ROT trees for the 6 species analyzed (Table 1-4 and Figure 1-6).
Spatial Autocorrelation Among CAVs
Weak significant positive spatial autocorrelations in the locations of inventoried
trees with cavities were observed in only 5 of the 22 UTs studied. The UT designed C2,
which had the lowest total number of trees from all sampled units, showed the highest
spatial autocorrelation among the units studied (I = 0.24; p < 0.0001; Table 1-6).
Predictive Model for CAV Occurrence
The best-fit logistic model to predict the occurrence of CAVs in forest inventories
included the variables DBH, WD, and their interaction (1-1):
logit (CAV) log
(1-1)
Where (CAV) is the probability of an individual tree being hollow, α is the
intercept, and β1, β2, and β3 are the variable coefficients. All variables were significantly

24
different from 0 (Table 1.7). The model AIC was 10389.9, and the predicted probabilities
were 62.7% concordant with observed values. The likelihood of a tree being classified
as CAV decreased with DBH, but increased with WD (Figure 1-5).
By incorporating a random plot effect to account for variation derived from
sampling trees by UTs, the following GLMM was generated (1-2):
logit (CAV) log
(1-2)
where Xβ refers to the estimate (β) of the fixed factors (X) for the logistic model,
Z refers to the estimate ( ) of the random plot effect, and is the error. WD and the
interaction between DBH and WD were significant predictors of the incidence of CAVs
Figure 1-7). The residual variance of 0.88 showed that the model fits the observed data
reasonably well.
ROT Occurrence Predictive Model
Logistic regressions were used to test the relevance of DBH, WD, and tree density
as explanatory variables for predicting the occurrence of ROTs by species and UT.
Initial analyses were performed with the 700 trees located ≥ 10 m from the UT borders.
Because tree density did not improve the model’s capacity to explain the observed
proportions of heart-rotted and hollow trees, this variable was discarded from further
analyses and trees located close to the margins of UTs were then added to the total
sample size to assure that at least 30 individuals per species were evaluated.
In contrast to the results from the analysis, DBH was the only variable among
those tested that predicted the occurrence of heart-rotted and hollow trees among
commercial trees designated for harvesting. In this case, larger trees were more likely to

25
have hollow stems or rotten cores (Table 1-4 and Figure 1-6). The following equation
(1-3) represented the best-fit model with an AIC of 985.5:
logit (HO) log
(1-3)
where (HO) is the probability of an individual tree to being hollow, α is the
intercept, and β represent is the parameter estimate. Parameter estimates (Table 1-9)
showed a positive relationship between the likelihood of being hollow and tree DBH
(Figure 1-8). Predicted probabilities were 71% concordant with the observed responses.
No differences were observed among species or UTs.
Discussion
Tree census data have been used to evaluate the abundance and distribution of
cavity trees in temperate and subtropical forests (e.g., Ball et al. 1999; Fan 2003; Fan et
al. 2003; Zheng et al. 2009). Understanding spatial patterns of distribution based on
tree-level data becomes challenging in tropical forests where most tree species occur at
low densities (Chave 2008). In this study, I performed separate analyses using forest
inventory and pre-logging data to provide complementary information about individual-
based variables that explain the occurrence of heart-rots and hollows in the stems of
abundant commercial timber tree species in eastern Brazilian Amazon.
Wood density was the most important variable for predicting the occurrence of
cavity trees (CAVs) recorded in forest inventories. Unexpectedly, tree species with
higher WD were more likely to have externally evident stem cavities. In contrast, the
proportion of trees with stem cavities decreased with DBH. Because cavity trees may be
prone to mechanical failure (Lindenmayer et al. 1997; Mattheck et al. 2006), they may
fall over or break before becoming very large (Chao et al.2009). A similar argument can

26
be made to explain the higher incidence of stem cavities among species with higher
WDs: higher WD may confer higher resistance to biotic and abiotic forces that cause
stem breakage, thus heart-rotted and hollow trees with high density wood may survive
for long periods (Anten & Schieving 2010).
Positive spatial autocorrelations in the distribution of CAVs were only observed in
2 UTs and those relationships were weak. The aggregation of heart-rotted and hollow
trees in UT C2 is possibly an artifact of low overall tree density. Spatial aggregation
among cavity trees would be expected as a result of microenvironmental factors that
may enhance a tree being damaged by falling trees and branches or in areas with
seasonally flooded soils (Chao et al. 2009; Ferry et al. 2010). It may also result from
local concentrations of tree pathogens and stem-damaging animals such as
woodpeckers (Castello et al. 1995; McCallum & Dobson 2002; Holdenrieder et al. 2004;
Condeso & Meentemeyer 2007). In addition, areas with high densities of trees would
facilitate colonization by poorly dispersed pathogens and promote the spread of
infections through root connections (Boddy 1993; Sivasithamparam 1998; Van der
Putten et al. 2001; Freckleton & Lewis 2006). This facilitation was unlikely in the study
area where densities of trees ≥ 45 cm DBH were low. The lack of positive
autocorrelation may be indicative of a low frequency of events that promote heartwood
infections in this site in the eastern Amazon.
Using data from the exploratory efforts of harvesting crews, DBH was the only
variable that explained the incidence of hollows or heartwood decay. Other studies have
shown this positive relationship between a tree’s size and its likelihood of being hollow
(Nogueira et al. 2006; Gibbons et al. 2008). Based on the complimentary results of the
27
analyses of inventory and post-logging data, I conclude that trees with rots and hollows
that extend out through the sapwood and bark, and were thus detected during
inventories, were more susceptible to failure and therefore survive for a shorter period in
the forest in comparison to trees in which the defect was restricted to the heartwood. A
possible explanation for these results resides in the time lag since the tree stem was
damaged, on wound dimensions, and on debilitating conditions that restrained wound
closure and compartmentalization (Cherubini et al. 2002; Dujesiefken et al. 2005;
Davison & Tay 2008; Deflorio et al. 2008). Trees with evident external cavities, for
example, may have been wounded in their early in life or may have suffered more
extensive damage. Alternatively, a tree can fail to close a wound if stressed (Burrill et al.
1999). Large trees experience energy constraints on growth while successfully
defending against pathogens, which can affect their abilities to compartmentalize decay
(Schwarze et al. 2000; Thomas 2004).
Some constraints may arise from having sampled only of trees ≥ 45 cm DBH,
identifying cavities during ground surveys, or estimating the extension of hollow or
rotten cores by inserting a chainsaw into the base of stems selected for felling. Studies
aiming to quantify the density of cavity trees in temperate forests have shown that the
number of trees with stem cavities may be high among smaller trees but that there is
also a positive relationship among cavity and tree dimensions (Fox et al. 2008).
Consequently, although I may have underestimated the number of cavity trees by
inaccurate ground observations and not sampling small trees, my study provides
valuable data for quantifying the density of trees with the wide cavities and external
apertures that are most commonly utilized by hole nesting and roosting mammals and

28
birds (Boyle et al. 2008; Eltz et al. 2003; Gibbons & Lindenmayer, 1996). Paradoxically,
I may have overlooked the presence of hollows or rotten cores in the largest trees
selected for logging because the chainsaw used to test them would only reach outer
heartwood layers. Forest managers in the study site try to avoid this possibility by not
selecting the largest trees for harvesting, which means they are not tested for
hollowness, and are maintained in the forest as seed sources. Results from analyses
based on post-logging data may then be biased towards intermediate size trees, while
trees with low and extremely high DBHs are underrepresented because they,
respectively, return low timber volumes or are likely to be defective.
Identifying variables that explain a tree’s susceptibility to heart-rots is problematic
because it is the result of interactions between biotic and abiotic factors. The complexity
of interactions among these different factors can only be assessed through long-term
controlled studies in which trees are damaged and long-term responses are monitored
(Romero et al. 2009). Even in this case, responses would be subjected to random
environmental variation and catastrophic events that (Canham et al. 2010).
Few researches have tried to untangle the complexity of tropical tree susceptibility
to damage and their responses after damage (Boyle et al. 2008). This study assesses
some of this complexity by looking at the distributions and wood properties of trees in
which decay is mostly confined in dead heartwood tissues, and tree in which decay has
extend outwards reaching sapwood and bark at the base of trees, and possibly affecting
their susceptibility to failure.
29
Figure 1-1. Steps performed to select commercial trees for logging in Fazenda Cauaxi. In light and dark grey are the steps for which inventory and pre-logging data were available.

30
Figure 1-2. Number of trees ≥ 45 cm DBH of the 38 most abundant timber tree species
encountered in each of the 22 forest management units (approximately 100 ha each) showing the proportion of cavity trees identified by the presence of external openings during forest inventories (CAVs) in each unit.
Figure 1-3. Number of trees of each of the 38 most abundant timber tree species with
≥200 individuals, showing the proportion of cavity trees classified as hollow in forest inventories (CAVs).
non-CAV CAVN
um
be
r o
f tr
ee
s
0
500
1000
1500
2000
2500
Forest Management Unit
A1 A2 A3 A4 AA B1 B2 B3 B4 B5 C2 C3 C4 C5 D2 D3 D4 D5 D7 E4 E5 F2
non-CAV CAV
Nu
mb
er
of tr
ee
s
0
1000
2000
3000
4000
Species
Anacard
ium
gig
ante
um
Astr
oniu
m lecoin
tei
Bro
sim
um
acutifo
lium
Buchenavia
tetr
aphylla
Cary
ocar
gla
bru
m
Cary
ocar
vill
osum
Copaifera
duckei
Cord
ia g
oeld
iana
Coura
tari g
uia
nensis
Din
izia
excels
a
Dip
lotr
opis
purp
ure
a
Endople
ura
uchi
Euxylo
phora
para
ensis
Goupia
gla
bra
Helic
osty
lis s
p.
Hevea s
p.
Hym
enaea c
ourb
aril
Laetia p
rocera
Lecyth
is lurida
Lecyth
is p
ara
ensis
Manilk
ara
bid
enta
ta
Manilk
ara
huberi
New
tonia
psilo
sta
chya
Ocote
a c
ern
ua
Ocote
a g
lom
era
ta
Park
ia g
iganto
carp
a
Park
ia p
endula
Peltogyne lecoin
tei
Pithecello
biu
m s
p.
Pouro
um
a g
uia
nensis
Poute
ria b
ilocula
ris
Poute
ria o
ppositifolia
Pro
tium
pern
erv
atu
m
Scle
rolo
biu
m m
elin
onii
Ste
rculia
specio
sa
Tetr
agastr
is a
ltis
sim
a
Virola
mic
helii
Zolle
rnia
para
ensis
31
Figure 1-4. Variation in the distribution of trees ≥ 45 cm diameter at breast height (DBH)
inventoried in all forest management units, and classified as non-cavity and cavity trees by inventory crews (CAVs) according to DBH by species.

32
Figure 1-5. Percentage of cavity trees identified during forest inventories (CAVs, N = 1317) by species according to their wood density (g/cm3).
Perc
ent of cavity tre
es (
%)
0
5
10
15
20
25
0.2 0.3 0.4 0.5 0.6 0.7 0.8 0.9 1
Wood density (g/cm3)
R2 = 0.11 p =0.04
33
Figure 1-6. DBH variation between trees tested for hollowness immediately before logging, classified according to the presence (ROT) or absence (non-ROT) of heart-rots and hollows. Only trees ≥ 45 cm DBH of the 6 commercial tree species with ≥ 30 individuals selected for harvesting in three forest management units (UTs) are considered.
34
Figure 1-7. Probability of the incidence of trees with cavities identified during forest inventories (CAVs) by A) WD and B) DBH.
Figure 1-8. Probability ± 95% confidence intervals of the incidence of trees with heart-rots and hollows among supposedly sound trees selected for harvesting and diagnosed during logging activities (ROTs) as a function of tree DBH.
0
0.2
0.4
0.6
0.8
1
50 75 100 125 150
Pro
b (
RO
T)
DBH (cm)
A B

35
Table 1-1. Tree species with ≥ 200 individuals ≥ 45 cm DBH in the sampled area of approximately 2113 ha in Fazenda Cauaxi.
Family Genus Species Number of trees Wood density (g/cm3)*
Anacardiaceae Anacardium giganteum 255 0.45
Astronium lecointei 563 0.79
Boraginaceae Cordia goeldiana 394 0.64 Burseraceae Protium pernervatum 1717 0.62
Tetragastris altissima 1612 0.68
Caesalpinaceae Copaifera duckei 345 0.76
Hymenaea courbaril 345 0.62
Peltogybe lecointei 264 0.50
Sclerolobium melinonii 656 0.51
Zollernia paraensis 229 0.94
Caryocaraceae Caryocar glabrum 420 0.78
villosum 297 0.79
Cecropiaceae Pourouma guianensis 553 0.66 Celastraceae Goupia glabra 546 0.73 Combretaceae Buchenavia tetraphylla 461 0.65 Euphorbiaceae Hevea sp. 478 0.52 Fabaceae Diplotropis purpurea 218 0.81 Flacortiaceae Laetia procera 1151 0.63 Humiriaceae Endopleura uchi 520 0.86 Lauraceae Ocotea cernua 742 0.86
glomerata 441 0.87
Lecythidaceae Couratari guianensis 649 0.92
Lecythis lurida 935 0.67
paraensis 335 0.32
Mimosaceae Dinizia excelsa 673 0.51
Newtonia psilostachya 1332 0.26
Parkia gigantocarpa 229 0.52
pendula 191 0.76
Pithecellobium sp. 487 0.52
Moraceae Brosimum acutifolium 295 0.38
Helicostylis sp. 362 0.71
Myristidaceae Virola michelii 637 0.65 Rutaceae Euxylophora paraensis 260 0.58 Sapotaceae Manilkara bidentata 2298 0.50
huberi 3967 0.51
Pouteria bilocularis 851 0.71
oppositifolia 1649 0.47
Sterculiaceae Sterculia speciosa 758 0.99
* Data extracted from Zanne et al. (2009).
36
Table 1-2. DBH means and standard deviations for all trees sampled in forest inventories, and divided into non-cavity and cavity trees (CAVs).
Species
Total Non-cavity trees Cavity trees (CAV)
N Mean SD Dev.
N Mean SD Dev.
N Mean SD Dev.
Anacardium giganteum 255 63.6 15.9 252 63.7 16.0 3 60.9 3.9
Astronium lecointei 563 71.7 21.5 527 72.6 21.9 36 59.6 7.6
Brosimum acutifolium 295 60.4 13.0 280 60.6 13.3 15 57.1 6.6
Buchenavia tetraphylla 461 64.7 17.8 413 63.7 15.8 48 73.2 28.9
Caryocar glabrum 420 70.4 23.4 387 71.3 23.3 33 59.8 21.9
Caryocar villosum 297 78.1 30.3 261 79.6 30.7 36 66.6 25.2
Copaifera duckei 345 65.9 15.8 340 66.0 15.9 5 60.8 10.8
Cordia goeldiana 394 62.6 14.4 391 62.6 14.4 3 59.3 0.6
Couratari guianensis 649 70.7 25.0 621 70.5 24.7 28 76.7 31.8
Dinizia excelsa 673 72.1 25.6 529 75.9 27.3 144 58.2 8.9
Diplotropis purpurea 218 69.1 19.9 210 69.4 20.1 8 60.8 10.6
Endopleura uchi 520 61.6 14.6 514 61.7 14.6 6 53.2 8.7
Euxylophora paraensis 260 71.1 19.4 238 72.3 19.5 22 58.6 13.7
Goupia glabra 546 66.7 16.4 477 67.9 17.0 69 58.3 6.7
Helicostylis sp. 362 63.8 15.3 342 64.0 15.7 20 60.4 4.9
Hevea sp. 478 62.5 17.5 478 62.5 17.5 0 - -
Hymenaea courbaril 345 78.9 27.7 335 79.5 27.9 10 58.0 4.5
Laetia procera 1151 70.1 22.6 1114 70.4 22.6 37 61.6 20.1
Lecythis lurida 935 65.4 16.1 903 65.7 16.2 32 54.6 6.7
Lecythis paraensis 335 68.4 17.9 304 68.6 17.4 31 66.5 22.9
Manilkara bidentata 2298 66.9 20.2 2235 67.2 20.4 63 59.2 8.0
Manilkara huberi 3967 72.3 20.3 3823 72.8 20.4 144 58.9 10.6
Newtonia psilostachya 1332 65.6 19.3 1179 65.9 19.6 153 63.0 17.4
Ocotea cernua 742 65.7 16.6 669 66.4 17.1 73 59.2 9.3
Ocotea glomerata 441 68.6 19.0 399 69.8 19.4 42 56.5 7.7
Parkia gigantocarpa 229 72.0 23.7 226 72.0 23.8 3 71.0 20.2
Parkia pendula 191 65.8 18.0 190 65.9 18.0 1 56.0 -
Peltogyne lecointei 264 63.3 16.3 251 63.6 16.7 13 58.8 7.3
Pithecellobium sp. 487 66.9 18.5 482 67.0 18.5 5 51.5 8.3
Pourouma guianensis 553 66.5 29.2 545 66.6 29.4 8 54.0 6.9
Pouteria bilocularis 851 60.4 11.4 838 60.4 11.5 13 57.9 2.1
Pouteria oppositifolia 1649 64.8 16.2 1606 64.9 16.4 43 58.9 5.0
Protium pernervatum 1717 61.1 14.5
1684 61.1 14.6
33 60.5 6.6
Sclerolobium melinonii 656 64.5 16.8 653 64.4 16.8 3 69.2 7.7
Sterculia speciosa 758 64.2 17.2 749 64.3 17.3 9 59.6 4.6
Tetragastris altissima 1612 59.7 12.9 1502 59.9 13.2 110 57.5 7.3
Virola michelii 637 57.6 10.5 629 57.7 10.5 8 53.3 7.5
Zollernia paraensis 229 61.1 15.2 222 61.2 15.4 7 57.8 8.7

37
Table 1-3. Percent frequencies of tree densities (≥ 45 cm DBH) within 10 m radius around cavity (CAV) and non-cavity trees by forest management unit (UT). All trees identified and mapped in forest inventories are considered.
UT
Densities of trees ≥ 45 cm DBH in an area of 10 m radius
Non-cavity trees Cavity trees (CAV)
Total 0 (%) 1 (%) 2 (%) ≥ 3 (%) Total 0 (%) 1 (%) 2 (%) ≥ 3 (%)
A1 683 87 12 1 0 15 93 7 0 0
A2 2396 50 50 0 0 2 100 0 0 0
A3 1647 73 22 4 1 9 89 11 0 0
A4 1405 76 20 3 1 28 75 25 0 0
AA 1208 80 17 3 0 6 100 0 0 0
B1 1420 80 17 3 0 427 81 15 4 0
B2 1253 80 18 2 0 55 84 16 0 0
B3 1696 74 21 5 1 2 100 0 0 0
B4 1685 72 21 5 2 1 100 0 0 0
B5 1192 79 17 3 1 20 80 15 5 0
C2 264 93 6 0 0 7 100 0 0 0
C3 678 85 14 1 0 79 86 14 0 0
C4 2054 71 23 5 1 158 76 20 3 2
C5 1558 73 22 4 1 35 69 26 6 0
D2 531 89 10 1 0 29 97 3 0 0
D3 788 83 15 2 0 32 78 22 0 0
D4 1784 73 22 4 1 124 63 30 6 1
D5 1816 72 23 5 1 7 86 14 0 0
D7 881 83 15 3 0 40 90 8 3 0
E4 1396 77 18 4 1 30 83 17 0 0
E5 1546 77 19 4 0 114 82 17 2 0
F2 1025 81 16 2 0 63 89 11 0 0
38
Table 1-4. DBH means and standard deviations (SD) for trees ≥ 45 cm DBH of the 6 tree species with >30 individuals selected for harvesting in 3 forest management units (UTs), and classified according to the presence (ROT) or absence (non-ROT) of extensive rotten cores or hollows.
Species
Total Non-ROT trees ROT trees
N Mean SD N Mean SD N N(%) Mean SD
A. lecointei 69 83.3 18.5 44 80.5 17.7 25 36.2 88.1 19.3
D. excelsa 31 93.5 20.2 20 84.3 16.6 11 35.5 110.4 14.7
L. paraensis 34 76.1 12.7 27 75.4 12.4 7 20.6 78.9 14.2
M. bidentata 165 72.6 13.9 118 70.2 11.6 47 28.5 78.5 17.3
M. huberi 528 70.2 7.6 368 77.1 16.0 160 30.3 91.3 15.8
P. oppositifolia 71 67.1 9.2 59 67.0 9.7 12 16.9 67.8 6.2
Table 1-5. Percent frequencies of tree densities (≥ 45 cm DBH) by species within 10 m
radius around trees selected for harvesting, distinguished between ROT and non-ROT trees.
Species Densities of trees ≥ 45 cm DBH in an area of 10 m radius
Non-ROT trees ROT trees
Total 0 (%) 1 (%) 2 (%) ≥3 (%) Total 0 (%) 1 (%) 2 (%) ≥3 (%)
A. lecointei 35 66 26 6 3 19 79 21 0 0
D. excelsa 14 64 21 14 0 10 78 22 0 0
L. paraensis 17 88 6 6 0 4 75 25 0 0
M. bidentata 90 71 22 7 0 31 70 27 3 0
M. huberi 289 71 23 5 1 132 72 21 6 1 P. oppositifolia 51 76 24 0 0
8 63 25 0 13
39
Table 1-6. Analysis of the spatial correlations in the distributions of cavity trees (CAVs) among all trees ≥ 45 cm DBH inventoried in each 100 ha forest management unit (plots) according to the Moran’s Index, considering lag distances of 50 m. Values marked with an asterisk refer to significant correlations.
Plot N Moran’s Index P > ǀZǀ
A1 683 -0.0081 0.7562 A2 1605 -0.0009 0.9750 A3 1647 -0.0056 0.5954 A4 1405 0.0037 0.6880 AA 1208 -0.0066 0.6484 B1 1420 0.0130 0.2134 B2 1253 0.0010 0.8850 B3 1696 -0.0007 0.9884 B4 1685 -0.0006 0.9960 B5 1192 -0.0036 0.8294 C2 264 0.2440 <0.0001*
C3 678 0.0313 0.1200 C4 2054 0.0174 0.0199*
C5 1558 -0.0021 0.8809 D2 531 0.0982 0.0002* D3 788 0.058 0.0016* D4 1784 0.0115 0.1666 D5 1816 0.0007 0.8888 D7 881 0.0139 0.3536 E4 1396 0.0123 0.2493 E5 1546 -0.0051 0.6651 F2 1025 0.0324 0.0254*
Table 1-7. Parameter estimates for the logistic model of incidence of trees with stem
cavities identified in ground surveys during forest inventories (CAVs).
Parameter Estimate Error Chi-square P
Intercept -5.12 0.49 109.37 < 0.0001
DBH 0.02 0.01 7.77 0.0053
WD 5.13 0.68 57.11 < 0.0001
DBH*WD -0.06 0.01 36.12 < 0.0001
40
Table 1-8. Parameter estimates for the general linear mixed model of incidence of cavity trees detected in forest inventories (CAVs).
Parameter Estimate Error t-value P
Intercept -4.98 0.62 -8.01 < 0.0001
DBH 0.01 0.01 1.16 0.2470
WD 4.18 0.73 5.66 < 0.0001
DBH*WD -0.05 0.01 -4.43 < 0.0001
Random plot effect 2.17 0.73 Residual variance 0.88 0.01
Table 1-9. Parameter estimates for the logistic model of incidence of trees classified as
having extensive rotten cores or hollows among trees selected for logging (ROTs).
Parameter Estimate Error Chi-square P
Intercept -4.50 0.39 131.05 < 0.0001
DBH 0.04 0.01 91.26 < 0.0001

41
CHAPTER 2 SHORT-TERM IMPACTS OF SELECTIVE LOGGING ON THE DIVERSITY OF DECAY
FUNGI IN EASTERN AMAZONIA
Coarse woody debris (CWD; i.e., standing dead trees, fallen stems, and fallen
branches ≥ 10 cm diameter) are typically more abundant after than before selective
logging of naturally regenerated forests (Keller et al. 2004; Feldpausch et al. 2005;
Palace et al. 2008). Selective timber harvesting, no matter how careful, kills some trees
and damages others that subsequently suffer high mortality rates (Edman et al. 2007;
Thorpe et al. 2008). CWD resulting from timber harvesting provides abundant habitats
and resources for a diverse range of saprophytic organisms (Harmon et al. 1986).
Among saprophytes, polypore fungi (basidiomycetes) are often the major determinants
of the rates of wood degradation and nutrient turnover in forest ecosystems (Rayner &
Boddy 1988; Schwarze et al. 2000).
Wood characteristics such as size, proportions of heartwood and sapwood,
anatomical characteristics, and the presence of resins and extractives all influence
decomposition rates and define the microhabitats available for fungal colonization
(Harmon et al. 1986). Throughout the process of decomposition, changes in wood
properties, temperature, moisture, and nutrient and oxygen availability create
heterogeneous environments that affect the dynamics of communities of decay fungi
(Rayner & Boddy 1988). Among the environmentally sensitive species are fungi that
produce soft and ephemeral sporocarps and typically colonize small and fast-
decomposing woody debris (Heilmann-Clausen & Christensen 2004; Bässler et al.
2010).
The decomposition process and the decomposer community also depend on the
distribution and abundance of colonizable wood (Vasiliauskas et al. 2002; Siitonen et al.
42
2005). In a European beech forest, for example, Odor et al. (2006) showed that fungal
species richness increased with the amount of CWD. In addition, the light intensity to
which woody material is exposed alters microenvironmental characteristics and
increases mortality rates of fungal species that produce thin and fragile, and therefore
drought-susceptible, fruiting bodies (Boddy 2001).
Fungal communities establishing in woody substrates produced by logging may
also vary with species’ abundances prior to logging and with species-specific abilities to
adapt to post-logging microenvironmental conditions (Edman et al. 2004; Heilmann-
Clausen & Christensen 2005; Junninen et al. 2008). For instance, by altering
microenvironmental conditions and generating an aggregated distribution of logs in
early stages of decay, timber extraction activities may induce sexual reproduction of
fungi present as mycelia prior to logging (Heilmann-Clausen & Christensen 2003;
Stokland & Kauserud 2004; Junninen et al. 2008).
An increasing number of studies in temperate forests have examined the impacts
of forest management activities and natural disturbances on the diversity of wood decay
fungi, focusing on the conservation of rare species or on the spread of pathogens
(Burrill et al. 1999; Heilmann-Clausen & Christensen 2003; Stokland & Kauserud 2004;
Berglund et al. 2005; Jonsson et al. 2006; Josefsson et al. 2010; Olsson & Jonsson
2010). Results suggest that to preserve rare fungi that have preferences for certain host
tree species or wood qualities, forest management strategies directed to maintaining a
constant stock of CWD are required (Allen et al. 2000; Takahashi & Kagaya 2005;
Anderson et al. 2010).

43
The few studies conducted on the diversity of wood decay fungi in natural tropical
forests failed to reveal host specificity for most of the surveyed tree-fungus interactions
(Lindblad 2000; Gilbert 2002; Gilbert et al. 2002; Urcelay & Robledo 2004; Beadle et al.
2007; but see Ferrer & Gilbert 2003). A better understanding of the dynamics of wood
decay fungal communities in tropical forests managed for timber is essential to assess
the impacts of timber harvesting on the maintenance of fungal diversity. In addition,
because patterns of resource use and decay rates differ across fungal taxa, changes in
fungal diversity that result from logging may also affect nutrient cycling (McGuire et al.
2010).
This study evaluates how low-intensity, selective, reduced-impact logging (RIL)
affects the diversity of wood decay fungi in a terra-firme forest in the eastern Amazon
Basin of Brazil. Selective logging effects on critical forest communities in the tropics,
such as decay fungi, have been poorly researched. By monitoring the occurrence of
fruiting bodies, I compared the diversity of fungi in a naturally regenerated forest area
managed for timber using RIL techniques and an adjacent unlogged area. Prior to
logging, pieces of CWD in each site were marked and then sampled for fungal
basidiocarps once prior to logging and then twice at 5 month intervals for 10 months
after logging to examine how post-logging conditions affected the composition and
diversity of decay fungi. I predicted that the diversity of decay fungi is lower in logged
then unlogged sites due to differences in species responses to post-logging
microenvironmental conditions.
44
Methods
Study Site
This study was carried out in Fazenda Cauaxi (3o35’ - 3o45’ S, 48o15’ - 48o25’ W),
a selectively logged naturally regenerated forest in the eastern Brazilian Amazon
(Holmes et al. 2002; Keller et al. 2004). The area is covered by lowland tropical moist
forest and is located in the Paragominas municipality, Para, Brazil (IBGE 1988). Oxisols
prevail on the relative flat to slightly rolling terrain dissected by small creeks. The
climate is moist tropical with annual rainfall averaging 2200 mm and a pronounced dry
season that typically lasts from June to November (Costa & Foley 1998).
In 1995, a non-governmental institution named Instituto Floresta Tropical (IFT)
established, in collaboration with the landowner (CIKEL Brasil Verde S.A.), what is
currently recognized as the most important training center for reduced-impact logging
(RIL) operations in the Amazon. Timber extraction is carried out in forest management
areas divided into units (UTs) that average 100 ha. Each UT is divided into 50 x 50 m
grids delimited by transects laid perpendicular to the main access road (Fundação
Floresta Tropical 2002). Logging intensity is typically 20 – 25 m3/ha (Holmes et al.
2002).
In comparison to conventional selective logging, RIL practices have fewer negative
environmental impacts (e.g., diminish tree damage and the production of CWD) on the
residual forest (Holmes et al. 2002; Putz et al. 2008), but alteration of forest structure
nevertheless exceeds what is typically caused by treefalls. For example, in the forest in
which I worked Schulze and Zweede (2006) estimated that canopy gaps in logged
stands were larger than in unlogged adjacent forests, 277 ± 13.1 in the former versus
174 ± 17.6 m2 (mean ± SE) in the latter. Likewise, Keller et al. (2004) verified that the

45
mean volumes of CWD stands in Fazenda Cauaxi subjected to RIL practices at an
intensity of 3.3 trees harvested per ha (74.7 (0.6 SE) Mg ha-1) were higher than in
unlogged areas (55.2 (4.7 SE) Mg ha-1).
Data Collection
Using transect-based surveys I compared the diversity of polypore fungi of an area
of intact forest and a nearby forest management unit (UT) logged in August 2008. Only
species in the Polyporaceae, Hymenochaetaceae, and Ganodermaceae were sampled.
Three permanent 10 x 700 m transects (2.1 ha per area) oriented perpendicular to the
main access road, > 20 m from the UT borders, and spaced at 200 – 300 m intervals
were established in each forest area. All fallen CWD ≥ 2 m long and ≥ 10 cm thick at the
center, and standing dead trees ≥ 10 cm DBH were marked and inspected prior to
logging in August 2008 and then re-inspected twice after logging (January and June
2009) for the presence of basidiocarps. CWD that resulted from logging was not
included in the study. In the case of standing dead trees, only basidiocarps growing
within 3 m of the forest floor were sampled.
A total of 441 fallen logs and standing dead trees (225 and 216 samples in the
control and logged areas, respectively) were marked and carefully inspected for the
presence of sporocarps to assure that even hard-to-detect species were recorded
(Lõhmus 2009). Hence, fungal incidence was estimated based on the number of
samples of CWD on which the species was recorded. The number of basidiocarps per
sample unit was not quantified because multiple fruiting bodies might have been
produced by the same individual. By only recording fruiting bodies, I omitted species
present only as mycelia, and therefore underestimated fungal diversity. That limitation
notwithstanding, this survey strategy is accepted for sampling fungi over wide areas

46
(Lindblad 2001; Gilbert et al. 2002; Edman et al. 2004; Heilmann-Clausen &
Christensen 2005; Olsson & Jonsson 2010).
CWD was classified into diameter ranges measured at the center of the log or at
DBH height of standing trees: 11-20, 21-30, 31-40, 41-50, 51-60, 61-70, and >71 cm
and assigned to one of four decay classes based on Harmon et al. (1986): 1) recently
fallen trunks or branches, or standing dead trees in initial stages of decomposition with
> 80% of the bark still intact; 2) trees or logs with 50 – 80% of bark remaining and with
most of the sapwood intact or only slightly degraded; 3) trees or logs in intermediate to
late stages of decay with < 50% of bark present but only < 50% of the sapwood heavily
decomposed; and, 4) trees or logs in advanced stages of decay with > 50% of the
remaining sapwood heavily decomposed or non-recognizable, and softened or intensely
decayed heartwood tissues.
All fruiting bodies were identified to species in the field or collected for laboratory
identification based on microscopic features. Nomenclature follows Gilbertson &
Ryvarden (1986; 1987), Ryvarden & Johansen (2000), and Ryvarden (2004). Vouchers
of all specimens collected were deposited at the Herbarium of the National Institute for
Research in the Amazon (INPA), Manaus, Brazil.
Data Analysis
I performed t-tests to evaluate intrinsic differences in CWD structure (diameter
classes and decay categories) and in the number of fungal species between the control
and logged areas prior to logging (i.e., during the first survey conducted in August
2008). To investigate changes in fungal species richness by log between sites and
census periods, I used repeated-measures ANOVA. Due to the inequality of variances
revealed with a Manchy’s test, Wilks’ lambda multivariate results were reported. Data

47
were log-transformed (or log(x+1))-transformed in the case of species counts) to meet
normality assumptions.
I used sample-based (or Coleman) rarefaction curves to compare fungal species
richness between the control and logged areas, compiled from presence / absence data
collected in the three censuses (Gotelli & Colwell 2001). Rarefaction curves were
constructed in EstimateS version 8.2 based on 100 randomizations of species
accumulation curves (Colwell 2000). To correct for the between site difference in the
number of pieces of CWD sampled, 216 randomly selected samples were considered
for the control area. Non-parametric indexes Chao 2 and ICE were used to estimate
total species richness, and Simpson’s index in its reciprocal form (1/D) was used to
estimate species diversity by site (Colwell 2000; Magurran 2004; Gotelli & Colwell
2001).
To investigate differences in species composition in the control and logged areas
over time, I performed nonmetric multidimensional scaling ordination using PRIMER
version 6 (Clark & Gorley 2006). Data from the three transects per area were combined
for this analysis. To avoid unwarranted effects of extremely rare species on the
calculation of similarities among sites, only species recorded more than once were
considered to investigate species composition, which represented 42% of the species
and 24% of the specimens recorded. Count data were log transformed (log10(x + 1)) and
Sorensen’s distance measures were used to determine similarities based on
presence/absence data. To perform the ordination, 100 runs with real data were used
and the adequacy of the results was analyzed based on the stress value of the final
interaction.

48
The effects of the site (logged or control), type of substrate (CWD on the forest
floor or dead standing trees), decay stage, and tree or log diameter class on the total
fungal species richness by sampled piece of CWD were analyzed using negative
binomial regression models. The dispersion parameter was significantly different from 0,
justifying the use of a negative binomial model. Model selection was based on the
backward elimination of non-significant variables included in the full model with all
variables and possible interactions; models were compared using chi-squared tests of
log likelihood differences, and considered different when p < 0.05. All statistical
analyzes were performed with SAS Software 9.2 (2009).
Results
A total of 187 specimens of 55 species were recorded in this study, 97% of which
were identified to species. Most species (73%) were in the Polyporaceae, with 40
species in 25 genera; other taxa encountered included five species of Phellinus
(Hymenochaetaceae), and 3 species of Ganoderma (Ganodermaceae). In the control
site, 87 specimens representing 37 fungal species were collected from 167 fallen logs
and 56 standing dead trees, while 100 specimens representing 36 species were
collected in 169 fallen logs and 47 standing dead trees at the logged site. Phellinus
gilvus (Sch.) Pat., P. rhytiphloeus (Mont.)Ryv., Rigidoporus microporus (Fr.) Overeem,
and Trametes modesta (Fr.) Ryv. were the most abundant species in both sites (Table
2-1).
Average diameter and decay class of CWD samples marked prior to logging and
re-sampled twice after logging differed between the logged and control sites. Most CWD
(≥ 75%) in both sites was on the ground, with 56 (25%) and 47 (22%) standing dead
trees >10 cm DBH per hectare in the unlogged and logged sites respectively (Table 2-
49
2). Fallen CWD and standing dead trees in the logged site were larger in diameter and
less decayed than logs in the control area (Figure 2-1; Table 2-2).
Although the mean number of fungal species per sample of CWD was lower in the
control than in the logged site before logging (t439 = 0.03, p = 0.003; Figure 2-2), this
difference disappeared after logging. Considering the three census periods from August
2008 to June 2009, the number of fungal species found by sample of CWD was similar
between sites (F1,439 = 0.91, p = 0.34) and among census periods (F2,438 = 1.78, p <
0.17; Figure 2-2). The interaction between site and census period (F1,439 = 4.44, p =
0.01) indicates that fungal species richness by sample of CWD varied differently
between sites through time. While in the control area no differences over time were
detected, in the other site the number of species recorded by sample was substantially
higher before than after logging (Figure 2-2).
Rarefaction curves for the logged and control areas did not asymptote over the 2.1
ha area sampled through the 10-month sampling period, indicating that the number of
samples of CWD inspected and duration of the study were insufficient to capture each
site’s fungal species richness. Curves representing species accumulation in the two
sites overlapped until approximately half of the 216 samples of CWD analyzed by site
were recorded, denoting similar species richness between sites (Figure 2-3). Chao 2
and ICE estimates of species richness were 39.0 and 43.9 for the logged site and 38.4
and 43.3 for the control site, respectively. Species diversity expressed as the reciprocal
of Simpson’s diversity index (1/D) was high for both sites: 19.01 and 18.15 for the
control and logged areas, respectively.

50
Species composition varied substantially between the logged and the unlogged
areas and among census periods (Figure 2-4). Only 8 of the 55 sampled species were
collected more than 5 times, but 2 species (Phellinus gilvus and Trametes modesta)
were sampled in all sites and all censuses. Approximately 33% of the species were
shared between the logged and control areas, and 42% of all species were recorded
only once (Table 2-1).
The negative binomial model used to predict fungal species abundance by CWD
sample included diameter class, substrate type, and decay stage (-2 Log Likelihood =
724.68; Table 2-3). Site and all two-way interactions evaluated with the full model were
not significant, and were therefore dropped from the best-fit model by backwards
elimination. Estimates of species richness showed that the most species were found on
fallen CWD and standing dead trees in intermediate stages of decay (classes 2 and 3,
Figure 2-5A). Additionally, species richness was highest for samples of CWD > 70 cm of
diameter (Figure 2-5B). Finally, more fruiting bodies were recorded on fallen CWD than
on standing dead trees (Figure 2-5C).
Discussion
Despite the higher fungal species richness by sample prior to logging, higher
average diameter, and lower average decay stage of the sampled pieces of CWD in the
logged area than in the control area, the mean number of fungal species per fallen log
or standing dead tree was similar in the two areas when data from all censuses were
combined. These results contrast with previous studies that showed a direct relationship
between the size of pieces of CWD and fungal species richness, and an inverse
relationship between wood decay stage and the number of fungi recorded from CWD

51
(Allen et al. 2000; Heilmann-Clausen & Christensen 2004; Rolstad et al. 2004; Odor et
al. 2006).
Based on the interaction between site and time, I conclude that the number of
fungi recorded by sample of CWD varied differently through time in the control and
logged areas. The faster decline in species richness through time in the logged area
may have resulted from delayed responses of the fungi to the microenvironmental
conditions created by logging (Vasiliauskas et al. 2002). A high percentage of
occasional species with low specificity for qualities of woody substrates, as observed in
previous studies conducted in tropical forests, also contributes to this variation (Lindblad
2001; Ferrer & Gilbert 2003).
Large differences in fungal species composition between logged and unlogged
areas and substantial temporal fluxes in species composition indicate that less common
species may exhibit a seasonal fruiting pattern, being represented only as mycelia
during the rest of the year. Seasonal changes in wood moisture contents and
temperature are known to affect species survival and reproduction (Rayner & Boddy
1988; Barker 2008). Seasonal microenvironmental variation intensified by the increased
post-logging canopy opening in the logged forest may have contributed to the rapid
post-logging decrease in species richness by sample in the logged stand. In contrast to
previous studies that showed a positive relationship between CWD abundance and
fungal species richness, I did not observe this response (Norden & Paltto 2001; Keller et
al. 2004; Heilmann-Clausen & Christensen 2005; Jonsson et al. 2006).
A different sampling methodology would be required to address questions related
to effects of spatial heterogeneity of woody substrates within and between the logged

52
and control forests (e.g., Josefsson et al. 2010). A longer time sequence would have
been needed to incorporate delayed responses of late successional fungal species to
logging-induced environmental changes and to understand how logging affects the
composition of fungal communities through time (Vasiliauskas et al. 2002; Olsson &
Jonsson 2010).
CWD decay stage, diameter class, and substrate were the only variables among
the ones tested that affected total species richness. As observed in less diverse
European forests, more fruiting bodies were recorded on CWD samples in intermediate
than initial or late stages of decay (Heilmann-Clausen & Christensen 2004; Jonsson et
al. 2008; Josefsson et al. 2010). Wood in initial stages of decomposition was probably
not an appropriate substrate for colonization by polypores due to the continued
presence of high concentrations of phenolic compounds. At the other end of the wood
decay spectrum, anaerobic conditions generated by moisture saturation of heavily
decayed woody substrates and changes in the concentration of lignin and cellulose
inhibit the growth of many species of wood decay fungi (Harmon et al. 1986; Rayner &
Boddy 1988; Schwarze et al. 2000).
As reported in studies in temperate forests, species richness by sample of CWD
was affected by the dimensions of the wood: the most species were recorded in woody
materials > 70 cm diameter (Heilmann-Clausen & Christensen 2004; Heilmann-Clausen
& Christensen 2005). This pattern may be a result of a larger surface area available for
the establishment of decay fungi, a larger volume of decayable wood, and a slower
degradation of woody materials with high proportions of heartwood with high
concentrations of constitutive defense compounds (Harmon et al. 1986; Rayner &
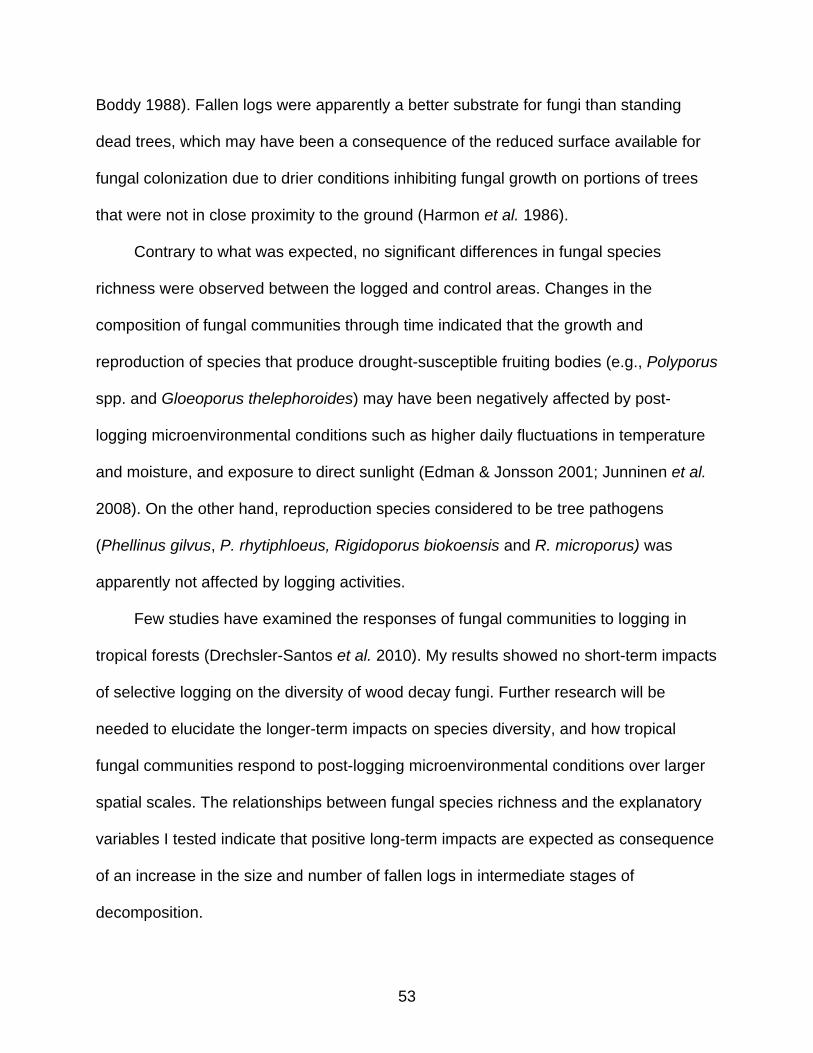
53
Boddy 1988). Fallen logs were apparently a better substrate for fungi than standing
dead trees, which may have been a consequence of the reduced surface available for
fungal colonization due to drier conditions inhibiting fungal growth on portions of trees
that were not in close proximity to the ground (Harmon et al. 1986).
Contrary to what was expected, no significant differences in fungal species
richness were observed between the logged and control areas. Changes in the
composition of fungal communities through time indicated that the growth and
reproduction of species that produce drought-susceptible fruiting bodies (e.g., Polyporus
spp. and Gloeoporus thelephoroides) may have been negatively affected by post-
logging microenvironmental conditions such as higher daily fluctuations in temperature
and moisture, and exposure to direct sunlight (Edman & Jonsson 2001; Junninen et al.
2008). On the other hand, reproduction species considered to be tree pathogens
(Phellinus gilvus, P. rhytiphloeus, Rigidoporus biokoensis and R. microporus) was
apparently not affected by logging activities.
Few studies have examined the responses of fungal communities to logging in
tropical forests (Drechsler-Santos et al. 2010). My results showed no short-term impacts
of selective logging on the diversity of wood decay fungi. Further research will be
needed to elucidate the longer-term impacts on species diversity, and how tropical
fungal communities respond to post-logging microenvironmental conditions over larger
spatial scales. The relationships between fungal species richness and the explanatory
variables I tested indicate that positive long-term impacts are expected as consequence
of an increase in the size and number of fallen logs in intermediate stages of
decomposition.

54
Figure 2-1. Distribution of sampled coarse woody debris (CWD) by A) diameter range
measured in cm, and B) decay categories (1 – 4 from light to intensely decayed wood) in the control (N = 225) and logged sites (N = 216).
A
B
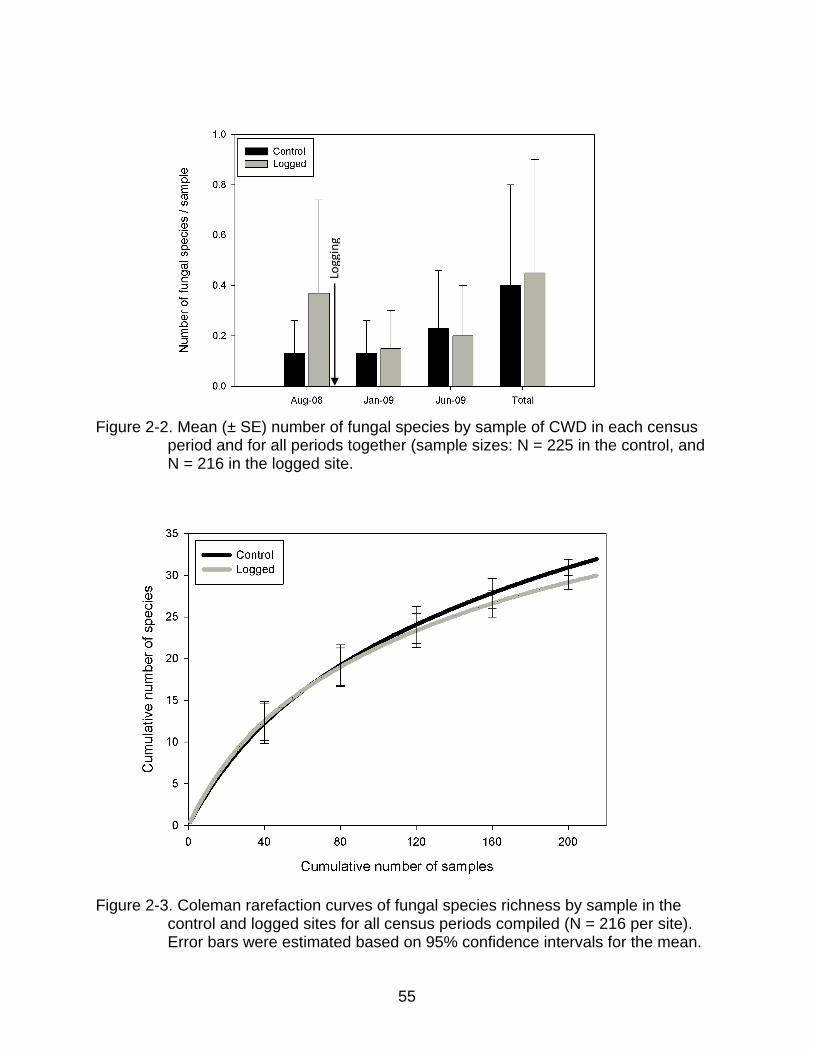
55
Figure 2-2. Mean (± SE) number of fungal species by sample of CWD in each census
period and for all periods together (sample sizes: N = 225 in the control, and N = 216 in the logged site.
Figure 2-3. Coleman rarefaction curves of fungal species richness by sample in the control and logged sites for all census periods compiled (N = 216 per site). Error bars were estimated based on 95% confidence intervals for the mean.
Logg
ing
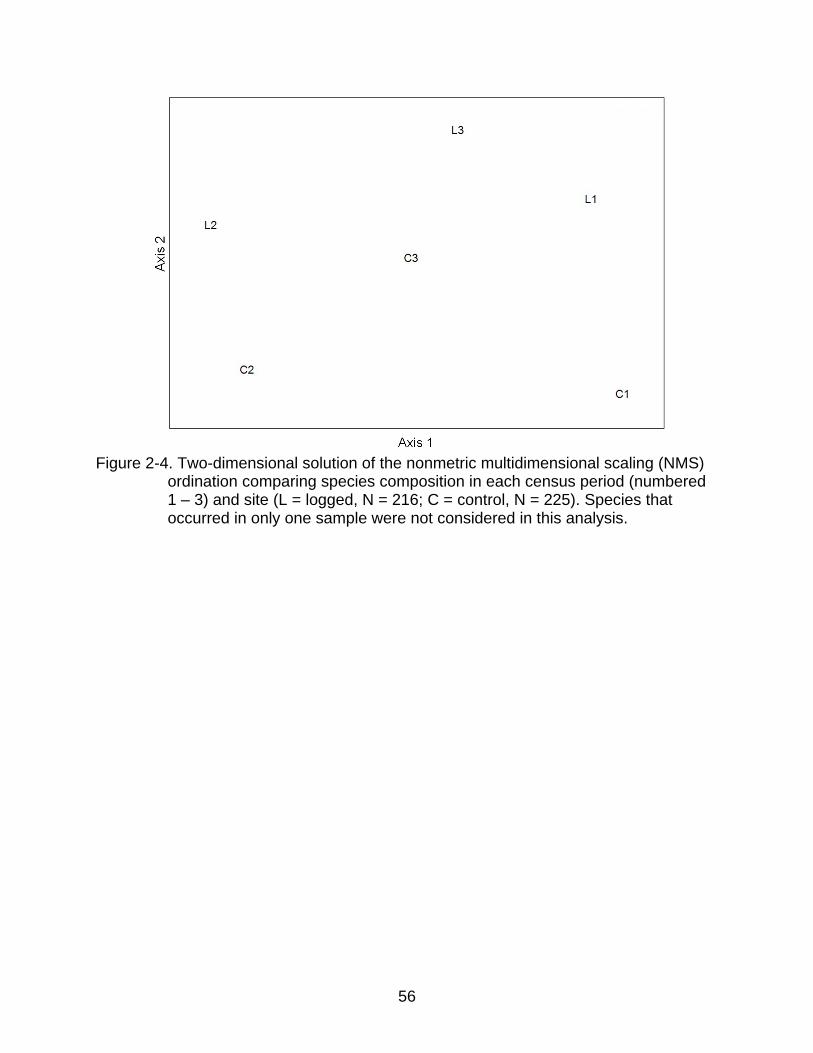
56
Figure 2-4. Two-dimensional solution of the nonmetric multidimensional scaling (NMS)
ordination comparing species composition in each census period (numbered 1 – 3) and site (L = logged, N = 216; C = control, N = 225). Species that occurred in only one sample were not considered in this analysis.

57
Figure 2-5. Model predictions of fungal species richness by sample of CWD (N = 441) for the significant variables A) decay stage, B) diameter class, and C) substrate (i.e., CWD sampled; FL = fallen logs, and SDT = standing dead trees).
A B C

58
Table 2-1. Fungal species richness by sample for each site and census period. Taxa that produce drought-susceptible fruiting bodies are marked with asterisks.
Control Logged
Species Aug-08 Jan-09 Jun-09 Total Aug-08 Jan-09 Jun-09 Total
Abundisporus subflexibilis (Berk. & W. Curtis) Parmasto - - - -
4 - 2 6
Antrodiella resurpina (Berk. & Curt.)* 2 - - 2
- - 1 1 Ceriporia ferruginicincta (Murr.) Ryv.* - - 1 1
- - 1 1
Ceriporia microspora (Lindblad & Ryvarden)* - - 1 1
- - - - Ceriporia spissa (Schw .: Fr.) Rajch.* - - - -
1 - - 1
Coriolopsis cfr floccosa (Junhgh.) Ryvarden* - - - -
1 - - 1 Dichomitus setulosus (Hrennings) Masuka & Ryvarden* - - - -
1 - - 1
Earliella scabrosa (Pers.) Gilbn. & Ryv. - - - -
1 - 2 3 Flavodon flavus (Kl.) Ryv. - - 1 1
- - 2 2
Fomes fasciatus Cooke - - - -
1 - - 1 Ganoderma amazonense Weir. - - 1 1
- - - -
Ganoderma australe (Fr.) Pat - - 1 1
2 1 2 5 Ganoderma oerstedtii (Fr.) Murrill - - 1 1
- - - -
Gloeoporus thelephoroides (Hook.) Cunn.* - - - -
2 - - 2 Hexagonia papyraceae Berk. 2 - - 2
- - - -
Megasporoporia setulosa (Henn.) Rajch. - - - -
1 - - 1 Nigrofomes melanodermus (Mont.) Murrill - - 1 1
2 - 3 5
Oxyporus obducens (Pers.) Donk - 2 - 2
- - - - Perennioporia latissima (Bres.) Ryvarden - - 1 1
- - - -
Perenniporia inflexibilis (Berk.) Ryvarden - - - -
- 1 - 1 Perenniporia medulla painis (Pers.) Donk. - - - -
1 - - 1
Phellinus calcitratus (Berk. & Curt.) Ryvarden - - 1 1
- - - - Phellinus ferrugineo-velutinus (Henn.) Ryv. 1 - 1 2
- - - -
Phellinus gilvus (Schw.) Pat. 3 3 3 9
4 1 3 8 Phellinus homrichae M.A. Souza nov. sp. - - - -
- 1 1 2
Phellinus noxius (Corner) G. Cunningh. - - 1 1
- - - - Phellinus punctatus (Fr.) Pilat 1 0 1 2
1 - 1 2
Phellinus rhytiphloeus (Mont.) Ryvarden 1 1 8 10
3 - 3 6 Phellinus spp. 1 - - 1
2 - - 2
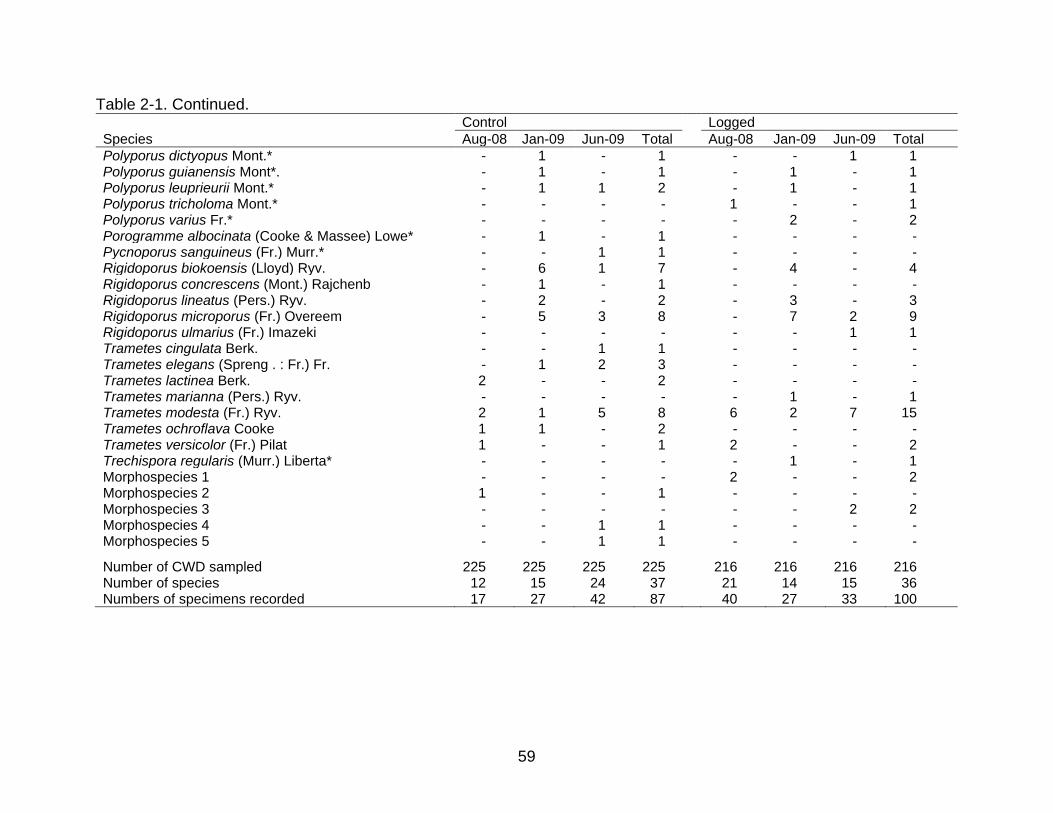
59
Table 2-1. Continued. Control Logged
Species Aug-08 Jan-09 Jun-09 Total Aug-08 Jan-09 Jun-09 Total
Polyporus dictyopus Mont.* - 1 - 1
- - 1 1 Polyporus guianensis Mont*. - 1 - 1
- 1 - 1
Polyporus leuprieurii Mont.* - 1 1 2
- 1 - 1 Polyporus tricholoma Mont.* - - - -
1 - - 1
Polyporus varius Fr.* - - - -
- 2 - 2 Porogramme albocinata (Cooke & Massee) Lowe* - 1 - 1
- - - -
Pycnoporus sanguineus (Fr.) Murr.* - - 1 1
- - - - Rigidoporus biokoensis (Lloyd) Ryv. - 6 1 7
- 4 - 4
Rigidoporus concrescens (Mont.) Rajchenb - 1 - 1
- - - - Rigidoporus lineatus (Pers.) Ryv. - 2 - 2
- 3 - 3
Rigidoporus microporus (Fr.) Overeem - 5 3 8
- 7 2 9 Rigidoporus ulmarius (Fr.) Imazeki - - - -
- - 1 1
Trametes cingulata Berk. - - 1 1
- - - - Trametes elegans (Spreng . : Fr.) Fr. - 1 2 3
- - - -
Trametes lactinea Berk. 2 - - 2
- - - - Trametes marianna (Pers.) Ryv. - - - -
- 1 - 1
Trametes modesta (Fr.) Ryv. 2 1 5 8
6 2 7 15 Trametes ochroflava Cooke 1 1 - 2
- - - -
Trametes versicolor (Fr.) Pilat 1 - - 1
2 - - 2 Trechispora regularis (Murr.) Liberta* - - - -
- 1 - 1
Morphospecies 1 - - - -
2 - - 2 Morphospecies 2 1 - - 1
- - - -
Morphospecies 3 - - - -
- - 2 2 Morphospecies 4 - - 1 1
- - - -
Morphospecies 5 - - 1 1
- - - -
Number of CWD sampled 225 225 225 225
216 216 216 216 Number of species 12 15 24 37
21 14 15 36
Numbers of specimens recorded 17 27 42 87 40 27 33 100

60
Table 2-2. Distribution of coarse woody debris (CWD) sampled in the control and logged sites according to the type of substrate, diameter class, and decay stage. Values refer to total number of samples by site and substrate, and mean diameter or decay class ± SE.
CWD Control Logged t d.f. P
N 225 216
Logs 169 169
Dead standing trees 56 47
Diameter class 2.52 ± 0.11 3.38 ± 0.12 5.11 439 0.001
Decay stage 3.19 ± 0.05 2.83 ± 0.06 4.29 439 < 0.001
Table 2-3. Variables and estimates for the best-fit negative binomial regression model to
predict fungal species richness by sample.
Parameter Estimate d.f. LEM SEM
Intercept -0.46 1
Decay stage
1 -0.41 430 0.18 0.09
2 0.34 430 0.37 0.08
3 0.66 430 0.52 0.08
4 0 0.27 0.05
Diameter class
10 – 20 -0.73 430 0.29 0.06
21 – 30 -1.07 430 0.20 0.04
31 – 40 -0.77 430 0.28 0.07
41 – 50 -0.34 430 0.42 0.10
51 – 60 -0.74 430 0.28 0.10
61 – 70 -0.89 430 0.24 0.12
> 70 0 0.59 0.14
Substrate
FL -0.41 0.25 0.06
SDT 0 0.38 0.06
Scale 0.28
Pearson χ2 / d.f. 1.08
d.f., degrees of freedom; LME, least square means; SEM, standard error of the mean; FL, fallen logs; SDT, standing dead trees.
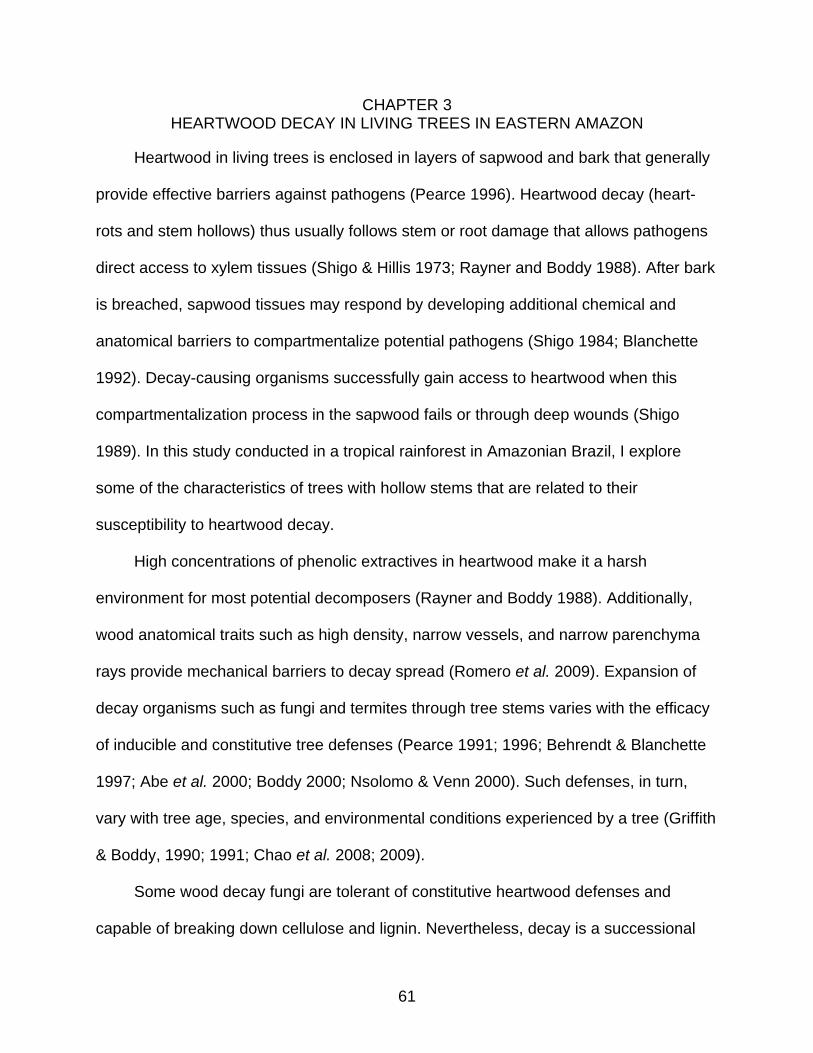
61
CHAPTER 3 HEARTWOOD DECAY IN LIVING TREES IN EASTERN AMAZON
Heartwood in living trees is enclosed in layers of sapwood and bark that generally
provide effective barriers against pathogens (Pearce 1996). Heartwood decay (heart-
rots and stem hollows) thus usually follows stem or root damage that allows pathogens
direct access to xylem tissues (Shigo & Hillis 1973; Rayner and Boddy 1988). After bark
is breached, sapwood tissues may respond by developing additional chemical and
anatomical barriers to compartmentalize potential pathogens (Shigo 1984; Blanchette
1992). Decay-causing organisms successfully gain access to heartwood when this
compartmentalization process in the sapwood fails or through deep wounds (Shigo
1989). In this study conducted in a tropical rainforest in Amazonian Brazil, I explore
some of the characteristics of trees with hollow stems that are related to their
susceptibility to heartwood decay.
High concentrations of phenolic extractives in heartwood make it a harsh
environment for most potential decomposers (Rayner and Boddy 1988). Additionally,
wood anatomical traits such as high density, narrow vessels, and narrow parenchyma
rays provide mechanical barriers to decay spread (Romero et al. 2009). Expansion of
decay organisms such as fungi and termites through tree stems varies with the efficacy
of inducible and constitutive tree defenses (Pearce 1991; 1996; Behrendt & Blanchette
1997; Abe et al. 2000; Boddy 2000; Nsolomo & Venn 2000). Such defenses, in turn,
vary with tree age, species, and environmental conditions experienced by a tree (Griffith
& Boddy, 1990; 1991; Chao et al. 2008; 2009).
Some wood decay fungi are tolerant of constitutive heartwood defenses and
capable of breaking down cellulose and lignin. Nevertheless, decay is a successional
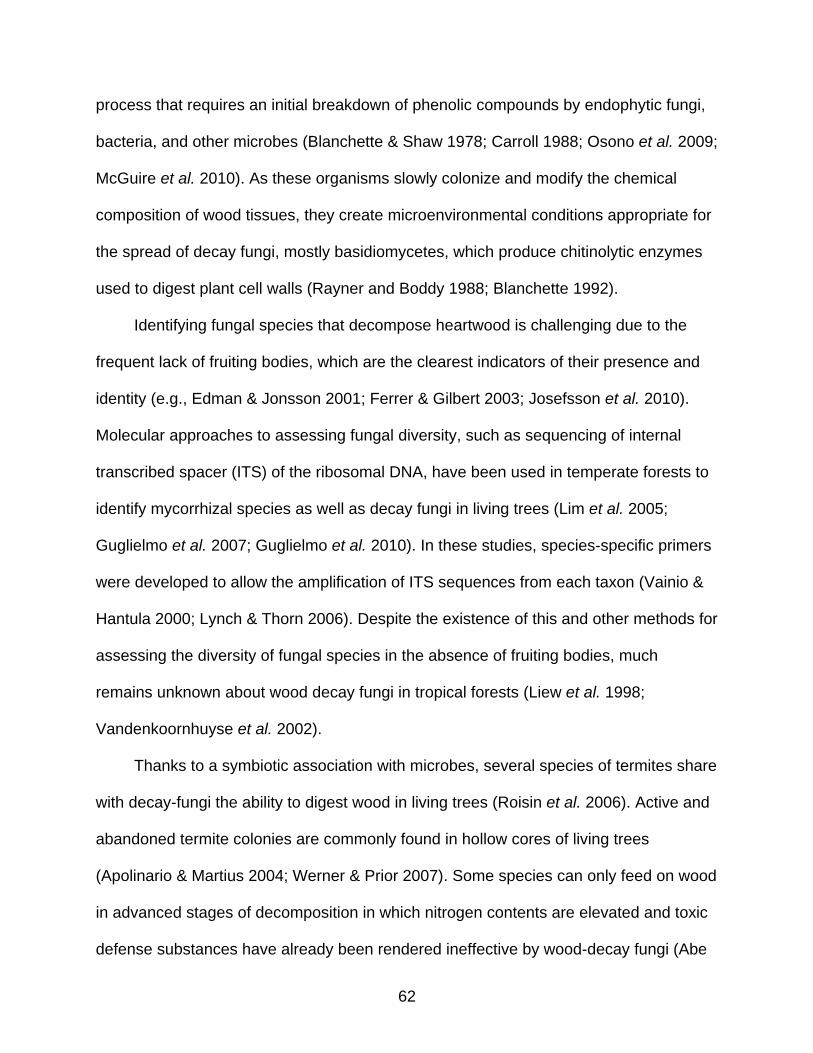
62
process that requires an initial breakdown of phenolic compounds by endophytic fungi,
bacteria, and other microbes (Blanchette & Shaw 1978; Carroll 1988; Osono et al. 2009;
McGuire et al. 2010). As these organisms slowly colonize and modify the chemical
composition of wood tissues, they create microenvironmental conditions appropriate for
the spread of decay fungi, mostly basidiomycetes, which produce chitinolytic enzymes
used to digest plant cell walls (Rayner and Boddy 1988; Blanchette 1992).
Identifying fungal species that decompose heartwood is challenging due to the
frequent lack of fruiting bodies, which are the clearest indicators of their presence and
identity (e.g., Edman & Jonsson 2001; Ferrer & Gilbert 2003; Josefsson et al. 2010).
Molecular approaches to assessing fungal diversity, such as sequencing of internal
transcribed spacer (ITS) of the ribosomal DNA, have been used in temperate forests to
identify mycorrhizal species as well as decay fungi in living trees (Lim et al. 2005;
Guglielmo et al. 2007; Guglielmo et al. 2010). In these studies, species-specific primers
were developed to allow the amplification of ITS sequences from each taxon (Vainio &
Hantula 2000; Lynch & Thorn 2006). Despite the existence of this and other methods for
assessing the diversity of fungal species in the absence of fruiting bodies, much
remains unknown about wood decay fungi in tropical forests (Liew et al. 1998;
Vandenkoornhuyse et al. 2002).
Thanks to a symbiotic association with microbes, several species of termites share
with decay-fungi the ability to digest wood in living trees (Roisin et al. 2006). Active and
abandoned termite colonies are commonly found in hollow cores of living trees
(Apolinario & Martius 2004; Werner & Prior 2007). Some species can only feed on wood
in advanced stages of decomposition in which nitrogen contents are elevated and toxic
defense substances have already been rendered ineffective by wood-decay fungi (Abe
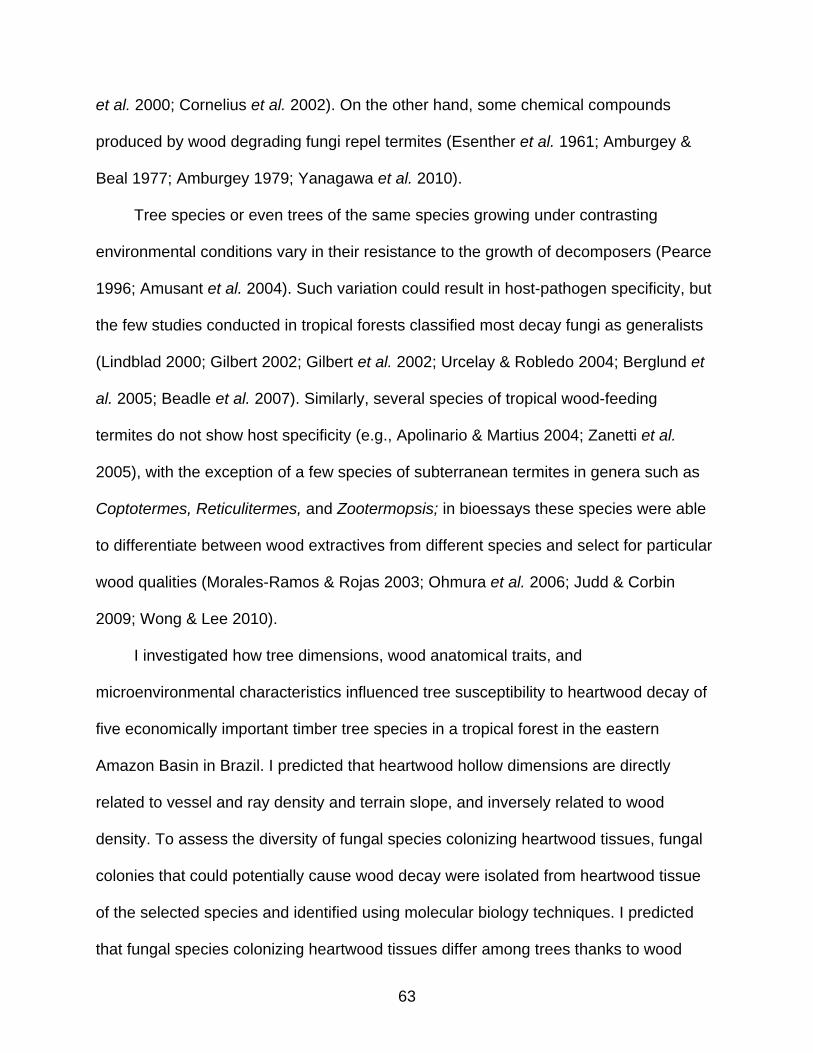
63
et al. 2000; Cornelius et al. 2002). On the other hand, some chemical compounds
produced by wood degrading fungi repel termites (Esenther et al. 1961; Amburgey &
Beal 1977; Amburgey 1979; Yanagawa et al. 2010).
Tree species or even trees of the same species growing under contrasting
environmental conditions vary in their resistance to the growth of decomposers (Pearce
1996; Amusant et al. 2004). Such variation could result in host-pathogen specificity, but
the few studies conducted in tropical forests classified most decay fungi as generalists
(Lindblad 2000; Gilbert 2002; Gilbert et al. 2002; Urcelay & Robledo 2004; Berglund et
al. 2005; Beadle et al. 2007). Similarly, several species of tropical wood-feeding
termites do not show host specificity (e.g., Apolinario & Martius 2004; Zanetti et al.
2005), with the exception of a few species of subterranean termites in genera such as
Coptotermes, Reticulitermes, and Zootermopsis; in bioessays these species were able
to differentiate between wood extractives from different species and select for particular
wood qualities (Morales-Ramos & Rojas 2003; Ohmura et al. 2006; Judd & Corbin
2009; Wong & Lee 2010).
I investigated how tree dimensions, wood anatomical traits, and
microenvironmental characteristics influenced tree susceptibility to heartwood decay of
five economically important timber tree species in a tropical forest in the eastern
Amazon Basin in Brazil. I predicted that heartwood hollow dimensions are directly
related to vessel and ray density and terrain slope, and inversely related to wood
density. To assess the diversity of fungal species colonizing heartwood tissues, fungal
colonies that could potentially cause wood decay were isolated from heartwood tissue
of the selected species and identified using molecular biology techniques. I predicted
that fungal species colonizing heartwood tissues differ among trees thanks to wood
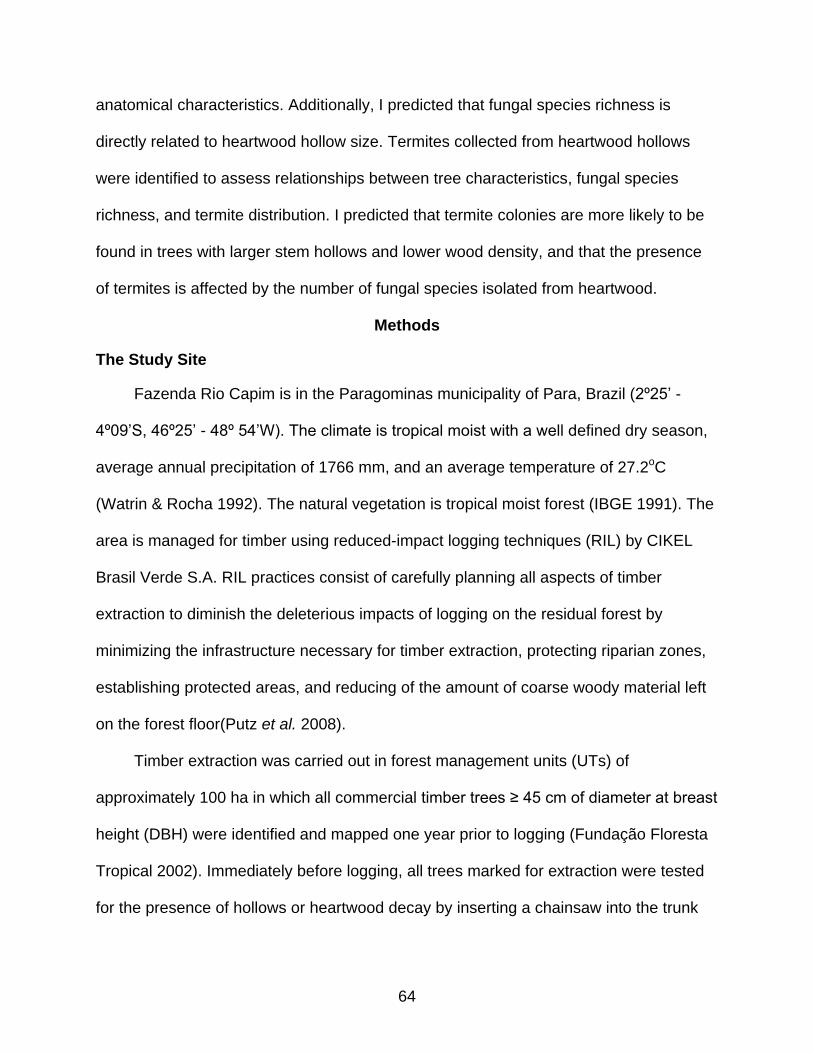
64
anatomical characteristics. Additionally, I predicted that fungal species richness is
directly related to heartwood hollow size. Termites collected from heartwood hollows
were identified to assess relationships between tree characteristics, fungal species
richness, and termite distribution. I predicted that termite colonies are more likely to be
found in trees with larger stem hollows and lower wood density, and that the presence
of termites is affected by the number of fungal species isolated from heartwood.
Methods
The Study Site
Fazenda Rio Capim is in the Paragominas municipality of Para, Brazil (2º25’ -
4º09’S, 46º25’ - 48º 54’W). The climate is tropical moist with a well defined dry season,
average annual precipitation of 1766 mm, and an average temperature of 27.2oC
(Watrin & Rocha 1992). The natural vegetation is tropical moist forest (IBGE 1991). The
area is managed for timber using reduced-impact logging techniques (RIL) by CIKEL
Brasil Verde S.A. RIL practices consist of carefully planning all aspects of timber
extraction to diminish the deleterious impacts of logging on the residual forest by
minimizing the infrastructure necessary for timber extraction, protecting riparian zones,
establishing protected areas, and reducing of the amount of coarse woody material left
on the forest floor(Putz et al. 2008).
Timber extraction was carried out in forest management units (UTs) of
approximately 100 ha in which all commercial timber trees ≥ 45 cm of diameter at breast
height (DBH) were identified and mapped one year prior to logging (Fundação Floresta
Tropical 2002). Immediately before logging, all trees marked for extraction were tested
for the presence of hollows or heartwood decay by inserting a chainsaw into the trunk
65
between the buttresses at about 50 cm from the ground. As a general rule, felling only
happened if a tree’s hollow or rotten core did not exceed 30 cm in diameter.
Heartwood Hollow Dimensions
In an area of 253 ha, I sampled 30 recently felled trees with hollow stems or rotten
cores of Manilkara huberi (Ducke) A. Chev., 30 of M. bidentata (A.DC.) A. Chev. sp.
surinamensis (Miq.) Penn. (both Sapotaceae), 30 of Pseudopiptadenia psilostachya
(DC.) G.P. Lewis & M.P. Lima, eight of Dinizia excelsa Ducke (both Mimosaceae), and
20 of Astronium lecointei Ducke (Anacardiaceae). These species were selected on the
basis of their abundance in the study site and because loggers reported that they are
prone to having hollow trunks. The selected species vary in wood anatomical traits such
as density and chemical defenses including the presence of sapwood latex (Manilkara
spp. and A. lecointei). Only trees > 10 m from their nearest conspecific were sampled.
Sampling was restricted to one area of 253 ha to minimize environmental heterogeneity
that could influence tree susceptibility to decay. Sample sizes were smaller for D.
excelsa and A. lecointei than for the other species because they occurred at lower
densities and were less frequently hollow.
In August and September 2008 soon (1-5 days) after logging, trunk diameters,
terrain slopes, and horizontal extents of heartwood hollows were measured for each
felled tree 50 cm from the ground. Hollow areas were calculated from two diameter
measures using the formula for an ellipse; heartwood area that was degraded but not
hollow was disregarded in this analysis. Two wood samples of 6000-7000 cm3
representing the length of each tree radius were taken from opposite sides of the trunk
to quantify anatomical traits and wood density.
66
Three 2 x 2 x 2 cm samples were extracted from the heartwood in these sections
at a distance < 10 cm from the sapwood. Wood density (WD) was determine by water
displacement (N = 3 samples/tree; N = 30 trees/species for M. huberi, M. bidentata, and
P. psilostachya, N = 20 trees for A. lecointei, and N = 8 trees for D. excelsa). Pearson’s
correlations were used to explore relationships among tree basal area, hollow area,
slope, and wood density. Variables fungal species richness by tree and terrain slope
were log(x + 1)-transformed, and square-root transformation was applied to hollow area
data to meet normality assumptions. For the four tree species with N ≥ 20 trees
sampled, variation in hollow and tree basal areas were explored using one-way analysis
of variance (ANOVA) followed by Tukey HSD post-hoc comparisons. All statistical
analyzes were performed with SAS Software 9.2 (2009).
Heartwood Anatomy
Histological analysis of wood anatomy was performed on wood transverse
sections (N = 5 sections/species; N = 10 trees/species for all tree species but D.
excelsa, with N = 8 trees) that were previously soaked in a 1:1 solution of glycerin and
distilled water for at least 24 h (N = 5 samples/species). Wood was sectioned using a
sliding microtome and permanent slides were prepared to measure maximum vessel
lumen diameter (N = 5–10 vessels/section), vessel density (number of vessels/mm2)
within fields of 2 mm2/section, ray width at its non-dilated extent, and distance between
adjacent rays measured along 2 mm transects/section. For this analysis, I only used
wood density values that corresponded to the trees sampled for wood anatomy.
Relationships among wood anatomical traits were explored using principal
components analysis (PCA) with varimax rotation. Only principal components (PCs)
with eigenvalues ≥ 1 and variables loading ≥ |0.35| were reported. Linear regression
67
was used to explore the relationships between PCA scores and the dimension of
heartwood hollows. Pearson’s correlations were used to explore relationships among
tree basal area and wood anatomical traits. Among species differences in traits were
investigated using one-way analysis of variance (ANOVA) followed by Tukey HSD post-
hoc comparisons. All statistical analyzes were performed with SAS Software 9.2 (2009).
Fungal Diversity
Three wood samples of approximately 1 cm3 were collected from heartwood
directly adjacent to hollows in each tree at a distance of 50 cm from the ground (N = 30
trees/species for M. huberi, M. bidentata, and P. psilostachya, N = 20 trees for A.
leointei and N = 8 trees for D. excelsa). Samples were stored in sterilized plastic vials
for approximately 5–10 days before laboratory analyses began. Wood sections < 0.5 cm
long x 0.5 cm wide were extracted from the inner portions of the wood samples,
sterilized in sodium hypochlorite for 90 s, rinsed in distilled autoclaved water, placed on
3 x 3 cm sterilized filter paper to dry, and stored in sterilized Petri dishes with no
medium. Five sections per tree were placed on malt-agar plates, and stored in a dark
chamber at 37oC until fungal colonies started to develop. Morphologically distinct
colonies were then isolated on separated malt-agar plates and kept in a dark chamber
for continued mycelial growth and subsequent extraction. Isolates were stored in the
Fungal Collection at the National Institute of Research in the Amazon (INPA), Manaus,
Brazil.
Five or more agar plugs were extracted from each isolate, transferred to 150 ml
Erlenmeyer flasks containing 50 ml of potato-dextrose broth (PDB), and kept under 90
rpm agitation at room temperature for 5–10 days. Mycelia were then dried under
sterilized conditions and ground in an autoclaved mortar using liquid nitrogen. Frozen

68
ground mycelia were transferred to 2 ml microcentrifuge tubes (approximately 750 µl of
mycelia/tube, 1–4 tubes/isolate) containing 700 µl extraction buffer (200 mM of Tris–HCl
1 M (pH 8.0), 20 mM of EDTA (pH 8.0) 0.5 M, 0.8 % of SDS 10 %, and 200 mM of NaCl
5 M), and then incubated for 50 min at 65oC. After incubation, 700 µl phenol was added
to the microcentrifuge tubes, which were then centrifuged for 10 min at 12,000 rpm.
Approximately 600 µl of the supernatant was transferred to a 1.5 ml tube followed by the
addition of 600 µl of a phenol:chloroform (1:1) solution. Tubes were again centrifuged
for 10 min at 12,000 rpm. Supernatant was collected and transferred to 1.5 ml tubes
with 600 µl of a chloroform:alcohol isoamilic 24:1 solution, which was then centrifuged at
12,000 rpm for 10 min. Finally, 600 µl of the supernatant was transferred to a new 1.5
ml microcentrifuge tube, to which was added 45 µl NaOH 3 M and 800 µl ice-cold
absolute ethanol. Samples were kept at -18oC overnight and then centrifuged at 12,000
rpm for 15 min. Supernatant was discarded, DNA dried at room temperature, and
subsequently re-suspended in 100 µl TE buffer (Tris – HCl (pH 8.0) 1 M, EDTA (pH 8.0)
0.5 M). RNAse mix (100 μg of RNAse A and 10 U of RNAse T1) was added to the final
solution after which tubes were incubated at 37oC bath for 30 min to allow RNA
digestion.
Internal transcribed spacer (ITS) sequences of ribosomal DNA of each fungal
isolate were amplified in a thermal cycler using primers ITS-1 and ITS-4. Polymerase
chain reactions (PCRs) contained 25 mM deoxynucleoside triphosphates, 0.1 mM of
ITS-1, 0.1 mM of ITS-4, 1x PCR buffer with 1.5 mM MgCl2, 1 μl of DNA, and 1 U of Taq
polymerase (Qiagen). The reaction consisted of an initial denaturation step at 96oC for 4
min, followed by 35 cycles of denaturation at 95oC for 1 min, annealing at 55-57oC for
45 s, and extension at 72oC for 35 s, and followed by a final 10 min extension period at
69
72oC. PCR products were quantified by electrophoresis in 1.3 % agarose gels.
Amplified sequences were purified using the Illutra GFXTM PCR DNA Purification Kit
(GE Healthcare) following manufacturer’s instructions. Either primer ITS-1 or ITS-4 was
used for DNA sequencing of each isolate. Fungal taxa were determined based on a
search of the GenBank database using the Basic Local Alignment Search Tool (BLAST;
http://www.ncbi.nlm.nih.gov/BLAST/). Only taxa with E-values = 0 and maximum identity
> 90% were reported.
Sample-based (or Coleman) rarefaction curves were used to compare fungal
species richness considering all morphologically distinct colonies among the four tree
species with N ≥ 20 trees sampled (Gotelli & Colwell 2001). Rarefaction curves were
constructed in EstimateS version 8.2 based on 100 randomizations of species
accumulation curves (Colwell 2000). Non-parametric indexes Chao 2 and ICE were
used to estimate total species richness, and Simpson’s index of diversity (1 – D; D =
Simpson’s index) was used to estimate fungal diversity by species (Colwell 2000;
Magurran 2004; Gotelli & Colwell 2001). Pearson’s correlations were used to explore
relationships between fungal species richness and tree basal area, hollow area, wood
density, and slope of the terrain.
A nonmetric multidimensional scaling ordination using PRIMER version 6 was
performed to explore differences in fungal species composition among tree species
(Clark & Gorley 2006). For this analysis, only fungal species recorded more than once
were considered. Count data were log transformed (log10(x + 1)) and Sorensen’s
distance measures were used to investigate similarities based on presence/absence.
Ordinations were performed with 100 runs with real data.

70
Termite Assemblages
Termites forming colonies inside heartwood hollows of the selected trees were
collected 1-5 days after logging and identified to species. Samples were stored in the
invertebrate collection at INPA. A logistic model was created to predict the occurrence
of colonies of Coptotermes testaceus (L.), the most abundant termite species sampled,
as a function of tree species, wood density, slope, fungal species abundance, and
relevant interactions. Data were transformed as needed to meet normality assumptions.
The best-fit model was selected based on log-likelihood comparisons of models
produced by backward elimination of non-significant variables. Log-likelihood
differences were tested using chi-square tests at p < 0.05. All analyses Pere performed
with SAS Software 9.2 (2009).
Results
Heartwood Hollow Dimensions
Although the basal areas of sampled trees varied among species (F3,105 = 27.51, p
< 0.0001), for the four tree species with N ≥ 20 individuals, heartwood hollow areas
were similar among species (F3,105 = 2, p = 0.12). Manilkara huberi trees were larger
than M. bidentata. Dinizia excelsa was not included in the analyses due to small sample
size, but generally had larger hollows (approximately 33% of the stem cross section)
than the other four tree species (10–23%; Figure 3-1). For the four tree species with N ≥
20 individuals, heartwood hollow size increased with stem basal area (r = 0.46, p <
0.001; Figure 3-2). No relationships were observed between heartwood hollow area and
wood density or terrain slope.

71
Heartwood Anatomy
The five tree species differed only moderately in the measured heartwood
anatomical features (Table 3-1). D. excelsa and A. lecointei had the largest vessel
lumen diameters (162.4 and 151.8 μm respectively) and, accordingly, lower vessel
densities (5.0 and 7.9 vessels/mm2 respectively; Figure 3-6; Figure 3-7). M. bidentata
had the lowest average vessel lumen diameter (111.4 μm) and the highest vessel
density (15.6 vessels/mm2; Figure 3-4). Average ray density varied from 5.86 in D.
excelsa to 10.5 rays/mm2 in M. bidentata. The average distance between rays was
20.7-23.4 μm for all species but P. psilostachya, in which rays were approximately 11.7
μm apart (Figure 3-5). Wood density varied from 0.83 g/cm3 in P. psilostachya and A.
lecointei to 0.94 g/cm3 in D. excelsa.
In the PCA of wood characteristics, Manilkara spp. (Figure 3-3; Figure 3-4) and
A. lecointei (Figure 3-7) formed a diffuse cluster due to intermediate ray and vessel
densities, and vessel lumen diameters. The first two principal components (PCs)
explained 63.8 and 25.67%, respectively, of the variation in heartwood anatomical traits
(Figure 3-8). The first principal component (PC1) was negatively associated with ray
and vessel densities, and positively associated with maximum vessel lumen diameter.
The second principal component (PC2) was positively associated with both distance
between rays and wood density (Figure 3-8). PC1 scores were negatively related to
hollow area (Table 3-2) indicating that larger heartwood hollows were more likely in
trees with higher vessel and ray densities, and smaller diameter vessels. Hollow size
was positively related to tree size (Table 3-2). Additionally, analysis of the residuals
suggested that the model results were strongly influenced by the presence of D.
excelsa, a species with large vessels, and low ray and vessel densities. Tree basal area
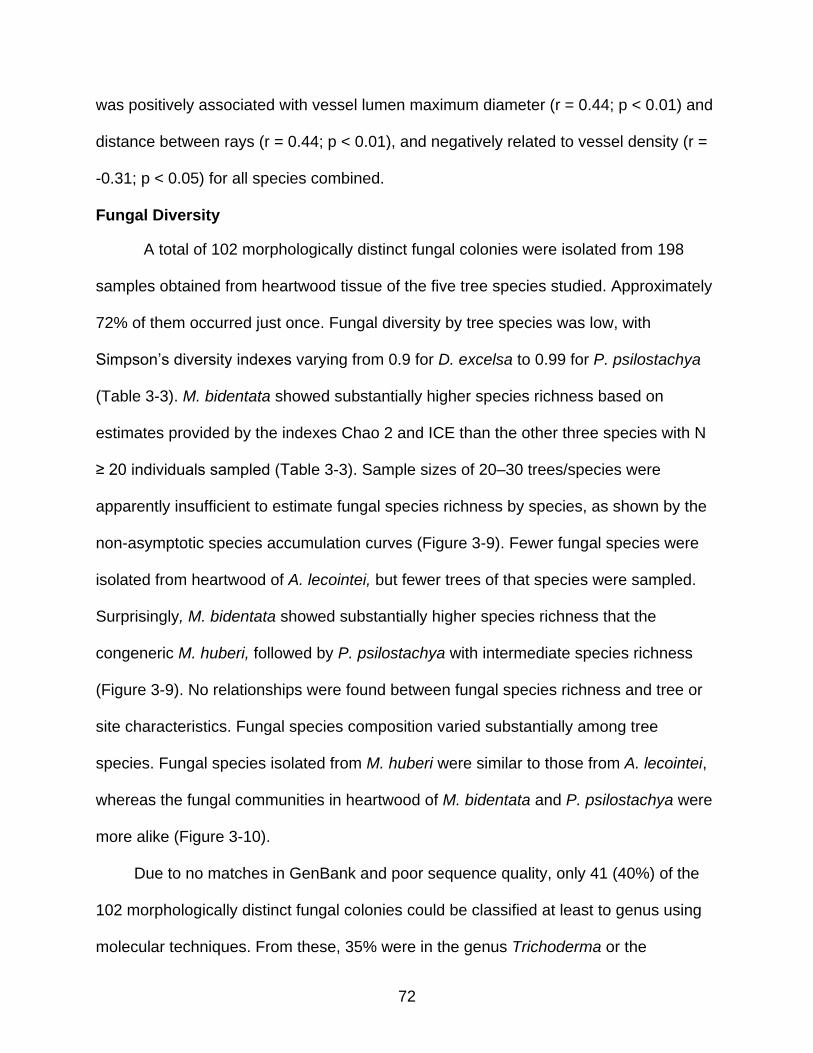
72
was positively associated with vessel lumen maximum diameter (r = 0.44; p < 0.01) and
distance between rays (r = 0.44; p < 0.01), and negatively related to vessel density (r =
-0.31; p < 0.05) for all species combined.
Fungal Diversity
A total of 102 morphologically distinct fungal colonies were isolated from 198
samples obtained from heartwood tissue of the five tree species studied. Approximately
72% of them occurred just once. Fungal diversity by tree species was low, with
Simpson’s diversity indexes varying from 0.9 for D. excelsa to 0.99 for P. psilostachya
(Table 3-3). M. bidentata showed substantially higher species richness based on
estimates provided by the indexes Chao 2 and ICE than the other three species with N
≥ 20 individuals sampled (Table 3-3). Sample sizes of 20–30 trees/species were
apparently insufficient to estimate fungal species richness by species, as shown by the
non-asymptotic species accumulation curves (Figure 3-9). Fewer fungal species were
isolated from heartwood of A. lecointei, but fewer trees of that species were sampled.
Surprisingly, M. bidentata showed substantially higher species richness that the
congeneric M. huberi, followed by P. psilostachya with intermediate species richness
(Figure 3-9). No relationships were found between fungal species richness and tree or
site characteristics. Fungal species composition varied substantially among tree
species. Fungal species isolated from M. huberi were similar to those from A. lecointei,
whereas the fungal communities in heartwood of M. bidentata and P. psilostachya were
more alike (Figure 3-10).
Due to no matches in GenBank and poor sequence quality, only 41 (40%) of the
102 morphologically distinct fungal colonies could be classified at least to genus using
molecular techniques. From these, 35% were in the genus Trichoderma or the
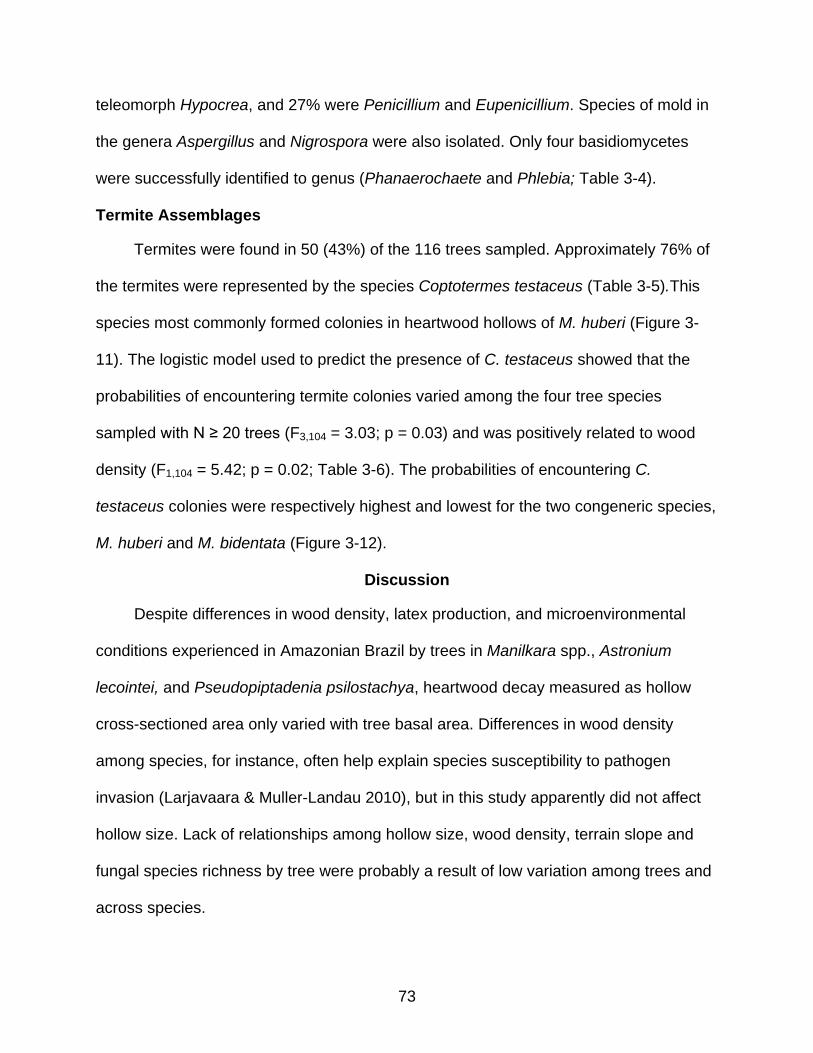
73
teleomorph Hypocrea, and 27% were Penicillium and Eupenicillium. Species of mold in
the genera Aspergillus and Nigrospora were also isolated. Only four basidiomycetes
were successfully identified to genus (Phanaerochaete and Phlebia; Table 3-4).
Termite Assemblages
Termites were found in 50 (43%) of the 116 trees sampled. Approximately 76% of
the termites were represented by the species Coptotermes testaceus (Table 3-5).This
species most commonly formed colonies in heartwood hollows of M. huberi (Figure 3-
11). The logistic model used to predict the presence of C. testaceus showed that the
probabilities of encountering termite colonies varied among the four tree species
sampled with N ≥ 20 trees (F3,104 = 3.03; p = 0.03) and was positively related to wood
density (F1,104 = 5.42; p = 0.02; Table 3-6). The probabilities of encountering C.
testaceus colonies were respectively highest and lowest for the two congeneric species,
M. huberi and M. bidentata (Figure 3-12).
Discussion
Despite differences in wood density, latex production, and microenvironmental
conditions experienced in Amazonian Brazil by trees in Manilkara spp., Astronium
lecointei, and Pseudopiptadenia psilostachya, heartwood decay measured as hollow
cross-sectioned area only varied with tree basal area. Differences in wood density
among species, for instance, often help explain species susceptibility to pathogen
invasion (Larjavaara & Muller-Landau 2010), but in this study apparently did not affect
hollow size. Lack of relationships among hollow size, wood density, terrain slope and
fungal species richness by tree were probably a result of low variation among trees and
across species.

74
During their ontogeny, trees become commonly damaged and suffer
environmental stresses that weaken their defenses and increase their vulnerability to
attacks by pathogens and herbivores (Thomas 2004). Wood decay in living trees is a
slow process in which a variety of organisms, many of which are thought to be
saprophytes, benefit from periods of weakened defense during which they can
successfully trespass induced defenses produced by living sapwood tissues to colonize
and break down constitutive phenolic compounds in heartwood tissues (Rayner &
Boddy 1988; Schwarze et al. 2000). Decay organisms more often succeed in colonizing
the heartwood of larger trees at least partially because such trees must invest
substantial energy in maintaining their biomass, thereby having fewer resources to
invest induced defense (Cherubini et al. 2002; King et al. 2006).
Heartwood anatomical traits in the five tree species analyzed possibly influenced
the rate of heartwood colonization and wood degradation by fungi and termites. Stem
hollows were smaller in trees with higher densities of vessels and rays, and larger
diameter vessels. These results partially contradict previous studies that showed that
small vessel size and low vessel and ray densities slow wood degradation by imposing
resistance to the growth of decay organisms through two of the most commonly used
routes of wood colonization, vessels and parenchymatous tissues (Kuroda 2001;
Angyalossy-Alfonso & Miller 2002; Romero & Bolker 2008). The unpredicted
relationships between anatomical traits and hollow area observed for the five tree
species analyzed can be partially explained by ontogenetic changes in wood anatomy. I
observed positive relationships between tree basal area, average vessel lumen
diameter, and ray density, and a negative relationship with vessel density. Previous
research also showed increased wood density and vessel diameter, and decreased ray

75
width and ray and vessel densities in wood samples taken from conspecific trees of
increasing basal areas (Niklas 1997; Noshiro & Suzuki 2010; Salguero-Gómez &
Casper 2011).
Fungal diversity in the heartwood samples of the four species with N ≥ 20 trees
was low but not fully accounted for due to the low sample sizes of trees and the high
proportion of rare fungal species. Nevertheless, other assessments of fungal species
richness based on the presence of fruiting bodies on coarse woody debris in tropical
forests also reported low diversity (Lodge 1997; Lindblad; 2000; 2001; Gilbert et al.
2002). The number of fungal species isolated from heartwood using culture-based
methods was also low, but varied substantially among tree species and was not related
to tree or hollow sizes. Likewise, fungal communities greatly varied among tree species,
supporting the idea that species composition changes but fungal species richness does
not increase as decay progresses (Toofanee & Dulymamode 2002; Osono et al. 2009).
As reported in other studies, few fungal species were isolated from more than one
tree species (e.g., Suryanarayanan et al. 2000). Unfortunately, due to methodological
limitations, conclusions regarding host specificity would be highly speculative at this
point. Slow growing fungi, for instance, could be underrepresented and a small
percentage of fungal species grow well in cultures, many of which only grow on specific
media (Lim et al. 2005; Hyde & Soytong 2008). Results based on DNA fingerprinting
methods and similarities between operational taxonomic units would possibly provide
more reliable conclusions (Schloss & Handelsman 2005; Seena et al. 2008; McGuire et
al. 2010).
That only 40% of the morphologically distinct fungal isolates matched known
sequences in GenBank suggests the existence of new fungal taxa (Vandenkoornhuyse

76
et al. 2002). Frequently sampled genera such as Aspergillus, Penicillium, and
Trichoderma are usually considered saprophytes that play important roles in initial
stages of wood degradation (Rayner & Boddy 1988). Trichoderma species, for example,
may act as antagonists to pathogens such as Heterobasidium annosum, and produce
anti-fungal compounds that have been investigated for biological control purposes
(Nicolotti 1996; Humphris et al. 2001). Only few species of decay fungi were isolated.
Basidiomycetes in the genera identified (Phanaerochaete and Phlebia) have been found
mostly in temperate forests but are also known from the tropics (Croan et al. 1999;
Olsson & Jonsson 2010).
Termites were present in heartwood of almost half of the trees analyzed, with
Coptotermes testaceus the most common species. Coptotermes testaceus was
previously reported to be associated with heartwood hollows in Amazonian forest trees
(Constantino 1991; 1999), but at lower frequencies (Apolinario & Martius, 2004).
Maintaining hollow trees in these forests managed for timber extraction is therefore
crucial to conserve C. testaceus, as well as the species that benefit from the cavities
they excavate (Gibbons & Lindenmayer 1996; Apolinario & Martius 2004; Werner &
Prior 2007; Fox et al. 2008; Zheng et al. 2009).
Subterranean termites in the genus Coptotermes build their nests in the soil and
infest sound wood in direct contact with the ground (Verma et al. 2009). In my study
area, C. testaceus nests were more frequent in M. huberi heartwood than in M.
bidentata, a congeneric species with which it shares anatomical features and the
production of latex by the sapwood. This finding suggests that this termite species
differentiates among tree species, presumable on the basis of wood extractives, as

77
observed in bioassays with Zootermopsis nevadensis (Ohmura et al. 2006). The other
species that also produced latex, A. lecointei, was generally not inhabited by termites.
Nutritional qualities of wood may influence tree selection by termites (Morales-
Ramos & Rojas, 2001; 2003). Higher cellulose content in heartwood was possibly
related to C. testaceus preference for trees with higher wood density (Judd & Corbin,
2009). Finally, despite previously reports of positive and negative associations between
fungi and termites (Ohkuma et al. 2001; Aanen et al. 2002; Roose-Amsaleg et al. 2004),
no association was found between the presence of termite nests and the abundance of
fungal species in heartwood tissues.
Conclusion
Heartwood decay increased with tree size for the studied commercial tree species
in eastern Amazonia. Heartwood anatomical traits such as vessel lumen diameter and
vessel and ray density explained much of the among-species variation in hollow size.
Further studies on heartwood decay and wood properties would benefit from bigger
samples sizes and from the selection of tree species that differ more in wood traits.
Most fungal species isolated from heartwood samples were represented by saprophytes
that usually participate in initial stages of decomposition. Fungal diversity estimates
would be more reliable if based on DNA-fingerprinting or similar molecular techniques,
instead of producing pure cultures to identify isolates. Termite colonies were found in a
high proportion of hollow trees. The most frequent species, Coptotermes testaceus, was
most common in trees with high density wood. Strategies to conserve this termite
species and the ecosystem processes it provides, such as provision of habitat for cavity
nesting species, should regulate the harvest of hollow trees with the characteristics
selected by the C. testaceus.

78
Figure 3-1. Tree stem basal area and area of stem hollows by tree species; both
measured at 50 cm from the ground (N = 8 for D. excelsa, N = 30 for P. psilostachya and M. huberi, N = 28 for M. bidentata, and N = 20 for A. lecointei). Letters indicate differences at p < 0.05. Statistical comparisons included all species but D. excelsa.
0
2000
4000
6000
8000
10000
D. excelsa P. psilostachya M. huberi M. bidentata A. lecointei
Esti
mat
ed a
rea
(cm
2)
Basal Area Hollow dimension
a
b
b
c
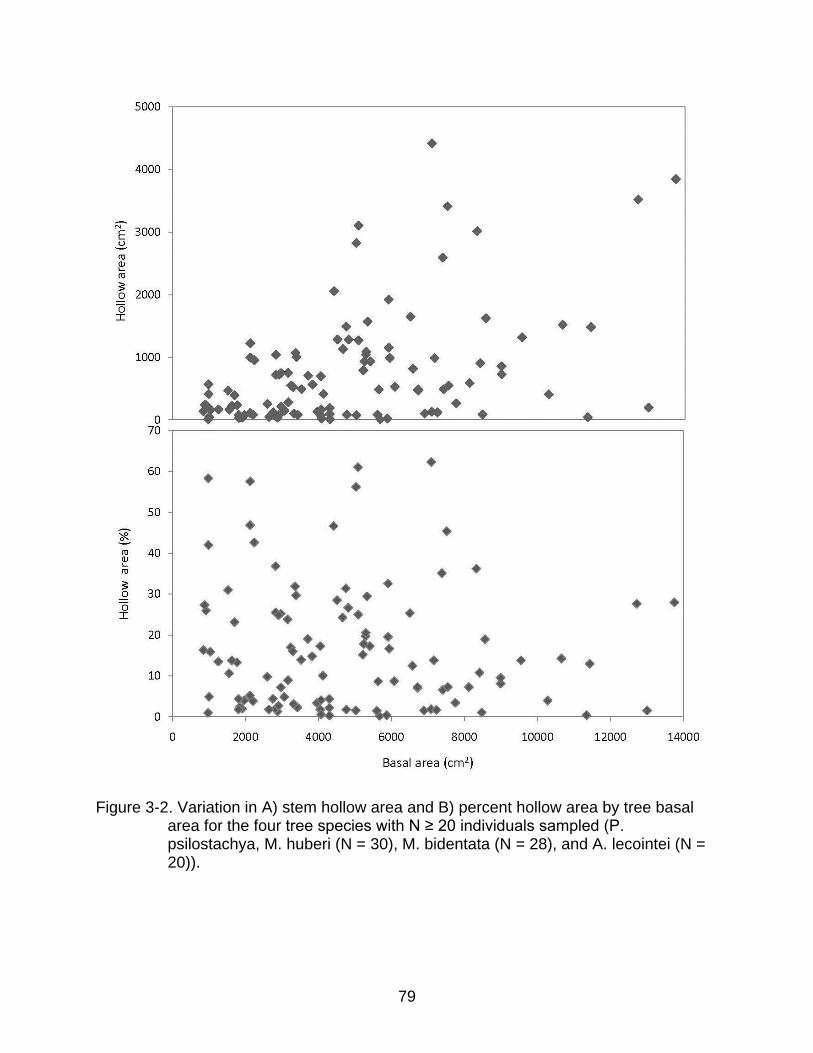
79
Figure 3-2. Variation in A) stem hollow area and B) percent hollow area by tree basal area for the four tree species with N ≥ 20 individuals sampled (P. psilostachya, M. huberi (N = 30), M. bidentata (N = 28), and A. lecointei (N = 20)).

80
Figure 3-3. Heartwood anatomy of Manilkara huberi. Scale bar 200 μm.
Figure 3-4. Heartwood anatomy of Manilkara bidentata. Scale bar 200 μm.

81
Figure 3-5. Heartwood anatomy of Pseudopiptadenia psilostachya. Scale bar 200 μm.
Figure 3-6. Heartwood anatomy of Dinizia excelsa. Scale bar 200 μm.

82
Figure 3-7. Heartwood anatomy of Astronium lecointei. Scale bar 200 μm.
Figure 3-8. Principal components analyses of wood anatomical characteristics for D.
excelsa, P. psilostachya (respectively De and Pp; N = 9), M. huberi, M. bidentata (Mb), and A. lecointei (respectively Mh, Mb, and Al; N = 10). Variables considered were number of vessels/mm2 (vessel_dens), number of rays/mm2 (ray_dens), average distance between rays (ray_dist), average vessel maximum lumen diameter (vessel_avg), and wood density (WD). Values in parenthesis correspond to the variance (%) explained by each principal component.
83
Figure 3-9. Coleman rarefaction curves of fungal species richness by heartwood sample
for the four tree species with N ≥ 20 individuals sampled (N 30 for P. psilostachya and M. huberi, N = 28 for M. bidentata, and N = 20 for A. lecointei). Error bars were estimated based on 95% confidence intervals of the mean.
Figure 3-10. Two-dimensional solution of the nonmetric multidimensional scaling (NMS)
ordination comparing fungal species composition isolated from heartwood samples from the four tree species with N ≥ 20 individuals (N 30 for P. psilostachya (Pp) and M. huberi (Mh), N = 28 for M. bidentata (Mb), and N = 20 for A. lecointei (Al)). Fungal species that occurred in only one sample were not included in this analysis.
0
5
10
15
20
25
30
35
40
0 5 10 15 20 25 30
Cu
mu
lati
ve n
um
ber
of
cult
ure
s
Number of trees
M. huberi M. bidentata P. psilostachya A. lecointei

84
Figure 3-11. Presence and absence of termite colonies in the rotten heartwood per tree
species: D. excelsa (N = 8), P. psilostachya, M. huberi (N = 30), M. bidentata (N = 28), and A. lecointei (N = 20 trees).
Figure 3-12. The probability of a tree hosting a Coptotermes testaceus colony as a function of wood density. Samples sizes were as follows: P. psilostachya and M. huberi (N = 30), M. bidentata (N = 28), and A. lecointei (N = 20).
0
5
10
15
20
25
D. excelsa P. psilostachya M. huberi M. bidentata A. lecointei
Nu
mb
er o
f tr
ees
Species
Absent Present
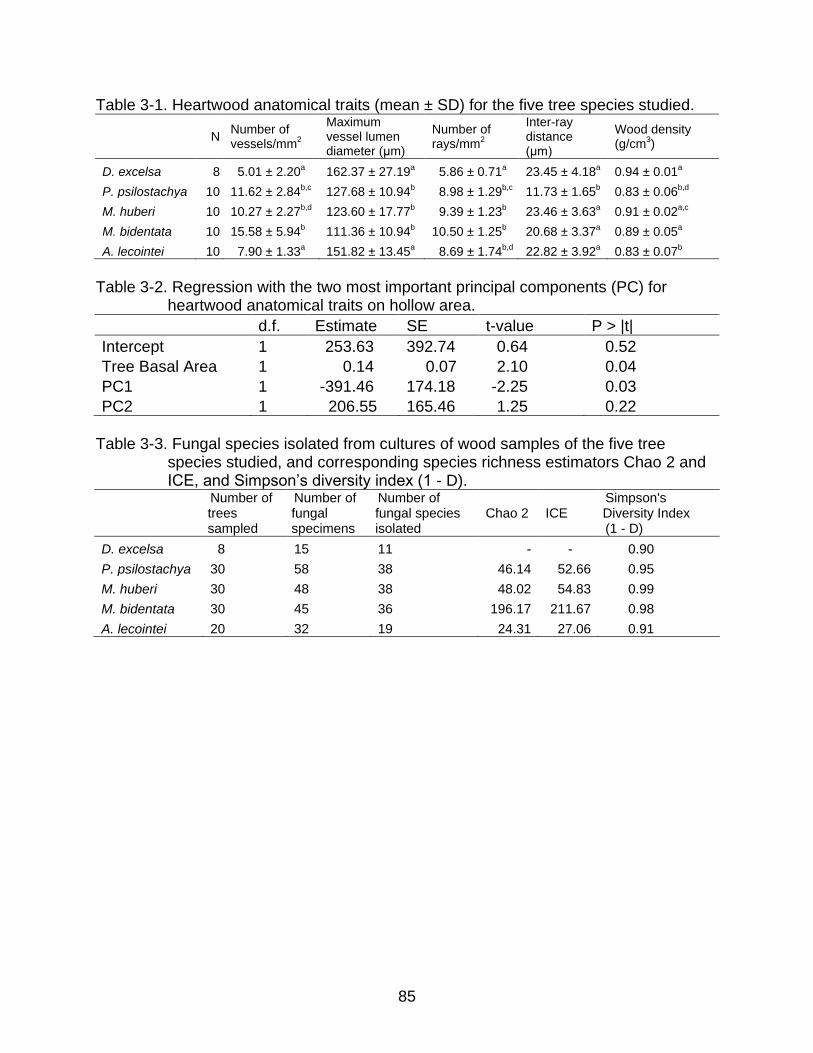
85
Table 3-1. Heartwood anatomical traits (mean ± SD) for the five tree species studied.
N
Number of vessels/mm
2
Maximum vessel lumen diameter (μm)
Number of rays/mm
2
Inter-ray distance (μm)
Wood density (g/cm
3)
D. excelsa 8 5.01 ± 2.20a
162.37 ± 27.19a
5.86 ± 0.71a
23.45 ± 4.18a 0.94 ± 0.01
a
P. psilostachya 10 11.62 ± 2.84b,c
127.68 ± 10.94b
8.98 ± 1.29b,c
11.73 ± 1.65b 0.83 ± 0.06
b,d
M. huberi 10 10.27 ± 2.27b,d
123.60 ± 17.77b
9.39 ± 1.23b
23.46 ± 3.63a
0.91 ± 0.02a,c
M. bidentata 10 15.58 ± 5.94bo
111.36 ± 10.94b
10.50 ± 1.25b
20.68 ± 3.37a
0.89 ± 0.05a
A. lecointei 10 7.90 ± 1.33a
151.82 ± 13.45a
8.69 ± 1.74b,d
22.82 ± 3.92a
0.83 ± 0.07b
Table 3-2. Regression with the two most important principal components (PC) for
heartwood anatomical traits on hollow area.
d.f. Estimate SE t-value P > |t|
Intercept 1 253.63 392.74 0.64 0.52
Tree Basal Area 1 0.14 0.07 2.10 0.04
PC1 1 -391.46 174.18 -2.25 0.03
PC2 1 206.55 165.46 1.25 0.22
Table 3-3. Fungal species isolated from cultures of wood samples of the five tree
species studied, and corresponding species richness estimators Chao 2 and ICE, and Simpson’s diversity index (1 - D).
Number of trees sampled
Number of fungal specimens
Number of fungal species isolated
Chao 2 ICE Simpson's Diversity Index (1 - D)
D. excelsa 8 15 11 - - 0.90
P. psilostachya 30 58 38 46.14 52.66 0.95
M. huberi 30 48 38 48.02 54.83 0.99
M. bidentata 30 45 36 196.17 211.67 0.98
A. lecointei 20 32 19 24.31 27.06 0.91

86
Table 3-4. Fungal species isolated from cultures of heartwood samples of the 5 tree species studied, and identified through DNA purification and amplification of ITS sequences using primers ITS-1 and ITS-4. Only taxa with E-values = 0 and maximum identity > 90% are reported.
Primer Query length
Coverage (%)
E-value
Maximum identity (%) Species match De Pp Mh Mb Al
ITS4 636 84 0 96 Aspergillus japonicus - 1 - - -
ITS1 408 100 0 98 Aspergillus nomius - 2 - - -
ITS1 386 100 0 99 Aspergillus nomius - 3 2 - 1
ITS1 400 100 0 97 Chloridium virescens - 1 - - -
ITS1 477 100 0 97 Eupenicillium shearii - - 1 2 -
ITS4 610 87 0 98 Eupenicillium shearii - 1 - - -
ITS4 773 64 0 96 Fusarium sp. - 1 - - -
ITS1 508 95 0 96 Hypocrea koningii - 2 - - -
ITS4 729 79 0 96 Hypocrea virens 1 - - - -
ITS4 575 98 0 98 Hypocrea virens - - - 1 -
ITS4 748 98 0 98 Hypocrea virens - - - 1 -
ITS1 393 99 0 99 Monascus fuliginosus - - - 1 -
ITS4 518 94 0 97 Nigrospora sphaerica - 1 - - -
ITS4 732 72 0 99 Penicilium sclerotiorum
- 1 - 1 -
ITS1 470 92 0 98 Penicillium aculeatum - - - 1 -
ITS1 423 100 0 99 Penicillium citrinum - - 1 - 3
ITS1 379 100 0 99 Penicillium citrinum - - - 1 -
ITS4 510 97 0 97 Penicillium glabrum - - - 1 -
ITS1 389 100 0 100 Penicillium meleagrinum
- 1 - - 1
ITS4 660 82 0 96 Penicillium paxilli - 1 - 2 -
ITS1 444 94 0 98 Penicillium sclerotiorum
- 2 - 1 -
ITS1 384 100 0 100 Penicillium sclerotiorum
- - - 1 -
ITS1 440 99 0 95 Penicillium sp. - 1 - - -
ITS4 742 76 0 93 Penicillium sp. - - - 1 -
ITS1 466 100 0 98 Penicillium toxicarium - - 1 - -
ITS4 1015 56 0 99 Phanerochaete australis
- - - 1 -
ITS1 401 100 0 98 Phanerochaete sordida
- - 1 - -
ITS4 641 87 0 92 Phlebia brevispora - 1 - - -
ITS1 506 99 0 93 Phlebia brevispora - 1 - - -
ITS4 518 98 0 98 Pleurostoma ootheca - - - - 1
ITS1 382 100 0 98 Trichoderma koningiopsis
- - - 1 -
ITS1 363 100 0 99 Trichoderma koningiopsis
- - 1 - -
ITS1 453 99 0 98 Trichoderma koningiopsis
- - 1 - -
ITS4 876 60 0 92 Trichoderma sp. - - - 1 -
ITS4 678 84 0 92 Trichoderma sp. - 1 1 - 1
ITS4 712 80 0 93 Trichoderma spirale - - - 1 -
ITS4 670 83 0 96 Trichoderma spirale - 1 - 1 -
ITS1 497 97 0 97 Trichoderma spirale - - - 1 -
ITS4 806 68 0 98 Trichoderma spirale 1 - - - -
ITS4 807 48 0 98 Trichoderma spirale - 1 - - -
ITS4 636 83 0 95 Trichoderma viride - 1 1 1 1
De, Dinizia excelsa; Pp, Pseudopiptadenia psilostachya; Mh, Manilkara huberi; Mb, Manilkara bidentata; Al, Astronium lecointei

87
Table 3-5. Termite species sampled in heartwood hollows of the five studied tree species.
D. excelsa P. psilostachya M. huberi M. bidentata A. lecointei Total
Anoplotermes sp. 1 1 - - - 2
Armitermes c.f. holmgreni - 1 - - - 1
Armitermes sp. - - - 1 - 1
Convexitermes manni - - - - 1 1
Coptotermes testaceus 3 8 17 6 5 39
Heterotermes sp. - 1 - - - 1
Nasutitermes guayanae - - 1 - - 1
N. surinamensis - - 1 - - 1
Ruptitermes sp. 1 - - - - 1
Termitinae - - 1 - 1 2
Number of trees sampled 8 30 30 28 20 116
Number of trees with termites
5 11 20 7 6 50
Table 3-6. Logistic regression estimates for the presence of Coptotermes testaceus
colonies in heartwood hollows of the four tree species with N ≥ 20 individuals sampled: P. psilostachya and M. huberi (N = 30), M. bidentata (N = 28), and A. lecointei (N = 20).
Estimate SE d.f. t-value P > |t|
Intercept -10.1030 3.9592 104 -2.55 0.0122
Species P. psilostachya 0 - - - -
M. huberi 0.8493 0.5918 104 -1.19 0.2365
M. bidentata -0.8247 0.6927 104 1.44 0.1542
A. lecointei -0.5888 0.7160 104 -0.82 0.4128
WD 10.8358 4.6548 104 2.33 0.0219
-2 Log Likelihood 120.97 Pearson χ2 / d.f. 0.98
88
LIST OF REFERENCES
Aanen, D.K., Eggleton, P., Rouland-Lefèbre, C., Guldberg-Fresleb, T., Rosendahl, S. & Boomsma, J. (2002) The evolution of fungus-growing termites and the mutualistic fungal symbionts. Proceedings of the National Academy of Sciences, 99, 14887-14892.
Abe, T., Bignell, D.E. & Higashi, M. (2000) Termites: Evolution, Sociality, Symbiosis, Ecology. Kluwer Academic Publishers, Dordrecht.
Akaike, H. (1974) A new look at the statistical model identification. IEEE Transactions on Automatic Control, 19, 716-723.
Allen, R.B., Buchanan, P.K., Clinton, P.W. & Cone, A.J. (2000) Composition and diversity of fungi on decaying logs in a New Zealand temperate beech (Nothofagus) forest. Canadian Journal of Forest Research, 30, 1025-1033.
Amburgey, T. L. (1979) Review and checklist of the literature on interactions between wood-inhabiting fungi and subterranean termites: 1960-1978. Sociobiology, 4, 279-296.
Amburgey, T. L. & Beal, R.H. (1977) White rot inhibits termite attack. Sociobiology, 3, 35-38.
Amelung, W., Martius, C., Bandeira, A.G., Garcia, M.V. & Zech, W. (2002) Lignin characteristics and density fractions of termite nests in an Amazonian rain forest - indicators of termite feeding guilds? Soil Biology and Biochemistry, 34, 367-372.
Amusant, N., Beauchene, J., Fournier, M., Janin, G. & Thevenon, M.F. (2004) Decay resistance in Dicorynia guianensis Amsh.: analysis of inter-tree and intra-tree variability and relations with wood colour. Annals of Forest Science, 61, 373-380.
Anderson, P., Brundrett, M., Grierson, P. & Robinson, R. (2010) Impact of severe forest dieback caused by Phytophthora cinnamomi on macrofungal diversity in the northern jarrah forest of Western Australia. Forest Ecology and Management, 259, 1033-1040.
Angyalossy-Alfonso, V. & Miller, R.B. (2002) Wood anatomy of the Brazilian species of Swartzia. IAWA Journal, 23, 359-390.
Anten, N.P. & Schieving, F. (2010) The role of wood mass density and mechanical constraints in the economy of tree architecture. The American Naturalist, 175, 250-260.
Apolinario, F. & Martius, C. (2004) Ecological role of termites (Insecta, Isoptera) in tree trunks in central Amazonian rain forests. Forest Ecology and Management, 194, 23-28.

89
Ball, I.R., Lindenmayer, D.B. & Possingham, H.P. (1999) A tree hollow dynamics simulation model. Forest Ecology and Management, 123, 179-194.
Barker, J.S. (2008) Decomposition of Douglas-fir coarse woody debris in response to differing moisture content and initial heterotrophic colonization. Forest Ecology and Management, 255, 598-604.
Beadle, C., Barry, K., Hardiyanto, E., Irianto, R., Mohammed, C. & Rimbawanto, A. (2007) Effect of prunning Acacia mangium on growth, form and heart rot. Forest Ecology and Management, 238, 261-267.
Behrendt, C.J. & Blanchette, R.A. (1997) Biological processing of pine logs for pulp and paper production with Phlebiopsis gigantea. Applied and Environmental Microbiology, 63, 1995-2000.
Berglund, H., Edman, M. & Ericson, L. (2005) Temporal variation of wood-fungi diversity in boreal old-growth forests: implications for monitoring. Ecological Applications, 15, 970-982.
Blanchette, R.A. (1992) Anatomical responses of xylem to injury and invasion by fungi. Defense Mechanisms of Woody Plants Against Fungi (eds R.A. Blanchette & A.R. Biggs), pp.76-95.Springer Verlag, Berlin.
Blanchette, R.A. & Shaw, C.G. (1978) Associations among bacteria, yeasts, and basidiomycetes during wood decay. Phytopathology, 68, 631-637.
Boddy, L. (2001) Fungal community ecology and wood decomposition processes in angiosperms: from standing tree to complete decay of coarse woody debris. Ecological Bulletins, 43-56.
Boddy, L. (2000) Interspecific combative interactions between wood-decaying basidiomycetes. Fems Microbiology Ecology, 31, 185-194.
Boddy, L. (1993) Saprotrophic cord-forming fungi - warfare strategies and other ecological aspects. Mycological Research, 97, 641-655.
Boyle, W.A., Ganong, C.N., Clark, D.B. & Hast, M.A. (2008) Density, distribution, and attributes of tree cavities in an old-growth tropical rain forest. Biotropica, 40, 241-245.
Burrill, E.A., Worrall, J.J., Wargo, P.M. & Stehman, S.V. (1999) Effects of defoliation and cutting in eastern oak forests on Armillaria spp. and a competitor, Megacollybia platyphylla. Canadian Journal of Forest Research, 29, 347-355.
Bässler, C., Müller, J., Dziock, F. & Brandl, R. (2010) Effects of resource availability and climate on the diversity of wood-decaying fungi. Journal of Ecology, 98, 822-832.

90
Canham, C.D., Thompson, J., Zimmerman, J.K. & Uriarte, M. (2010) Variation in susceptibility to hurricane damage as a function of storm intensity in Puerto Rican tree species. Biotropica, 42, 87-94.
Carroll, G. (1988) Fungal endophytes in stems and leaves - from latent pathogen to mutualistic symbiont. Ecology, 69, 2-9.
Castello, J.D., Leopold, D.J. & Smallidge, P.J. (1995) Pathogens, patterns, and processes in forest ecosystems. Bioscience, 45, 16-24.
Chao, K., Phillips, O.L., Gloor, E., Monteagudo, A., Torres-Lezama, A. & Martínez, R.V. (2008) Growth and wood density predict tree mortality in Amazon forests. Journal of Ecology. 96, 281-292.
Chao, K., Phillips, O.L., Monteagudo, A., Torres-Lezama, A. & Vásquez Martínez, R. (2009) How do trees die? Mode of death in northern Amazonia. Journal of Vegetation Science, 20, 260-268.
Chave, J. (2008) Spatial variation in tree species composition across tropical forests: patterns and process. Tropical Forest Community Ecology (eds W. Carson & S. Schnitzer), pp. 11-30. John Wiley & Sons Ltd, West Sussex.
Chave, J., Coomes, D., Jansen, S., Lewis, S.L., Swenson, N.G. & Zanne, A.E. (2009) Towards a worldwide wood economics spectrum. Ecology Letters, 12, 351-66.
Cherubini, P., Fontana, G., Rigling, D., Dobbertin, M., Brang, P. & Innes, J. (2002) Tree-life history prior to death: two fungal pathogens affect tree-ring growth differently. Journal of Ecology, 90, 839-850.
Clarke, KR, Gorley, R.N. (2006) PRIMER v6: User Manual/Tutorial. PRIMER-E, Plymouth.
Cochrane, M.A. & Laurance, W.F. (2002) Fire as a large-scale edge effect in Amazonian forests. Journal of Tropical Ecology, 18, 311-325.
Cochrane, M.A. (2001) Synergistic interactions between habitat fragmentation and fire in evergreen tropical forests. Conservation Biology, 15, 1515-1521.
Colwell, R. K. (2009) EstimateS: Statistical estimation of species richness and shared species from samples. Version 8.2. User's Guide and Application published at: http://purl.oclc.org/estimates.
Condeso, T.E. & Meentemeyer, R.K. (2007) Effects of landscape heterogeneity on the emerging forest disease sudden oak death. Journal of Ecology, 95, 364-375.
Constantino, R. (1999) Chave ilustrada para identificação dos gêneros de cupins (Insecta: Isoptera) que ocorrem no Brasil. Papéis Avulsos de Zoologia, 40, 387-448.
91
Constantino, R. (1991) Termites (Isoptera) from the lower Japura river, Amazonas state, Brazil. Boletim do Museu Paraense Emilio Goeldi, 7, 189-224.
Cornelius, M.L., Daigle, D.J., Connick, W.J., Parker, A. & Wunch, K. (2002) Responses of Coptotermes formosanus and Reticulitermes flavipes (Isoptera: Rhinotermitidae) to three types of wood rot fungi cultured on different substrates. Journal of Economic Entomology, 95, 121-128.
Costa, M.H., & Foley, J.A. (1998) Comparison of precipitation datasets for the Amazon Basin. Geophysical Research Letter 25: 155-158.
Croan, S.C., Burdsall, H.H. & Rentmeester, R.M. (1999) Preservation of tropical wood-inhabiting basidiomycetes. Mycologia, 91, 908-916.
Daily, G.C. (1993) Heartwood decay and vertical distribution of red-naped sapsucker nest cavities. Wilson Bulletin, 105, 674-679.
Davison, E.M. & Tay, F.C. (2008) Causes of incipient rot and rot in regrowth Eucalyptus diversicolor (Karri) trees. Plant Pathology, 57, 1097-1102.
Deflorio, G., Johnson, C., Fink, S. & Schwarze, F. (2008) Decay development in living sapwood of coniferous and deciduous trees inoculated with six wood decay fungi. Forest Ecology and Management, 255, 2373-2383.
Drechsler-Santos, E.R., Santos, P.J., Gibertoni, T.B. & Cavalcanti, M.A. (2010) Ecological aspects of Hymenochaetaceae in an area of caatinga (semi-arid) in northeast Brazil. Fungal Diversity, 42, 71-78.
Dujesiefken, D., Liese, W., Shortle, W. & Minocha, R. (2005) Response of beech and oaks to wounds made at different times of the year. European Journal of Forest Research, 124, 113-117.
Edman, M. & Jonsson, B.G. (2001) Spatial pattern of downed logs and wood-decaying fungi in an old-growth Picea abies forest. Journal of Vegetation Science, 12, 609-620.
Edman, M., Jonsson, M. & Jonsson, B.G. (2007) Fungi and wind strongly influence the temporal availability of logs in an old-growth spruce forest. Ecological Applications, 17, 482-490.
Edman, M., Kruys, N. & Jonsson, B.G. (2004) Local dispersal sources strongly affect colonization patterns of wood-decaying fungi on spruce logs. Ecological Applications, 14, 893-901.
Eltz, T., Bruhl, C., Imiyabir, Z. & Linsenmair, K. (2003) Nesting and nest trees of stingless bees (Apidae: Meliponini) in lowland dipterocarp forests in Sabah, Malaysia, with implications for forest management. Forest Ecology and Management, 172, 301-313.
92
Esenther, G.R., Allen, T.C., Casida, J.E. & Shenefelt, R.D. (1961) Termite attractant from fungus-infected wood. Science, 134, 50.
Eskelson, B., Temesgen, H. & Barrett, T. (2009) Estimating cavity tree and snag abundance using negative binomial regression models and nearest neighbor imputation methods. Canadian Journal of Forest Research, 39, 1749-1765.
Fan, Z., Shifley, S., Spetich, M., Thompson III, F. & Larsen, D.R. (2003) Distribution of cavity trees in midwestern old-growth and second-growth forests. Canadian Journal of Forest Research, 33, 1481-1494.
Fan, Z. (2003) Estimating cavity tree abundance by stand age and basal area, Missouri, USA. Forest Ecology and Management, 179, 231-242.
Feldpausch, T.R., Jirka, S., Passos, C., Jasper, F. & Riha, S. (2005) When big trees fall: Damage and carbon export by reduced impact logging in southern Amazonia. Forest Ecology and Management, 219, 199-215.
Ferrer, A. & Gilbert, G.S. (2003) Effect of tree host species on fungal community composition in a tropical rain forest in Panama. Diversity and Distributions, 9, 455-468.
Ferry, B., Morneau, F., Bontemps, J., Blanc, L. & Freycon, V. (2010) Higher treefall rates on slopes and waterlogged soils result in lower stand biomass and productivity in a tropical rain forest. Journal of Ecology, 98, 106-116.
Fox, J.C., Hamilton, F. & Ades, P.K. (2008) Models of tree-level hollow incidence in Victorian State forests. Forest Ecology and Management, 255, 2846-2857.
Freckleton, R.P. & Lewis, O.T. (2006) Pathogens, density dependence and the coexistence of tropical trees. Proceedings of the Royal Society B-Biological Sciences, 273, 2909-2916.
Fundação Floresta Tropical (2002) Manual de Procedimentos Técnicos para Condução de Manejo Florestal e Exploração de Impacto Reduzido. Fundação Floresta Tropical, Belem.
Gibbons, P. & Lindenmayer, D. (1996) Issues associated with the retention of hollow-bearing trees within eucalypt forests managed for wood production. Forest Ecology and Management, 83, 245-279.
Gibbons, P., Cunningham, D.B. & Lindenmayer, D.B. (2008) What factors influence the collapse of trees retained on logged sites? A case-control study. Forest Ecology and Management, 255, 62-67.
Gilbert, G.S. (2002) Evolutionary ecology of plant diseases in natural ecosystems. Annual Review of Phytopathology, 40, 13-43.

93
Gilbert, G.S., Ferrer, A. & Carranza, J. (2002) Polypore fungal diversity and host density in a moist tropical forest. Biodiversity and Conservation, 11, 947-957.
Gilbert, G.S. & Sousa, W.P. (2002) Host specialization among wood-decay polypore fungi in a Caribbean mangrove forest. Biotropica, 34, 396-404.
Gilbertson, R. L. & Ryvarden, L. (1986). North American Polypores. Volume 1. Fungiflora, Oslo.
Gilbertson, R. L. & Ryvarden, L. (1987). North American Polypores. Volume 2. Fungiflora, Oslo.
Gotelli, N.J. & Colwell, R.K. (2001) Quantifying biodiversity: procedures and pitfalls in the measurement and comparison of species richness. Ecology Letters, 4, 379-391.
Griffith, G.S. & Boddy, L. (1990) Fungal decomposition of attached angiosperm twigs .1. Decay community development in ash, beech and oak. New Phytologist, 116, 407-415.
Griffith, G.S. & Boddy, L. (1991) Fungal decomposition of attached angiosperm twigs .2. Moisture relations of twigs of ash (Fraxinus excelsior L). New Phytologist, 117, 251-257.
Grogan, J. & Schulze, M. (2008) Estimating the number of trees and forest area necessary to supply internationally traded volumes of big-leaf mahogany (Swietenia macrophylla) in Amazonia. Environmental Conservation, 35, 26-35.
Guglielmo, F., Bergemann, S.E., Gonthier, P., Nicolotti, G. & Garbelotto, M. (2007) A multiplex PCR-based method for the detection and early identification of wood rotting fungi in standing trees. Journal of Applied Microbiology, 103, 1490-1507.
Guglielmo, F., Gonthier, P., Garbelotto, M. & Nicolotti, G. (2010) Optimization of sampling procedures for DNA-based diagnosis of wood decay fungi in standing trees. Letters in Applied Microbiology, 51, 90-97.
Harmon, M.E., Franklin, J.F., Swanson, F.J., Sollins, P., Gregory, S.V., Lattin, J.D., Anderson, N.H., Cline, S.P., Aumen, N.G., Sedell, J.R., Lienkaemper, G.W., Cromack, K. & Cummins, K.W. (1986) Ecology of coarse woody debris in temperate ecosystems. Advances in Ecological Research, 15, 133-302.
Heilmann-Clausen, J. & Christensen, M. (2004) Does size matter? On the importance of various dead wood fractions for fungal diversity in Danish beech forests. Forest Ecology and Management, 201, 105-119.
94
Heilmann-Clausen, J. & Christensen, M. (2003) Fungal diversity on decaying beech logs - implications for sustainable forestry. Biodiversity and Conservation, 12, 953-973.
Heilmann-Clausen, J. & Christensen, M. (2005) Wood-inhabiting macrofungi in Danish beech-forests - conflicting diversity patterns and their implications in a conservation perspective. Biological Conservation, 122, 633-642.
Holdenrieder, O., Pautasso, M., Weisberg, P.J. & Lonsdale, D. (2004) Tree diseases and landscape processes: the challenge of landscape pathology. Trends in Ecology and Evolution, 19, 446-452.
Holdsworth, A.R. & Uhl, C. (1997) Fire in Amazonian selectively logged rain forest and the potential for fire reduction. Ecological Applications, 7, 713-725.
Holloway, G.L., Caspersen, J.P., Vanderwel, M.C. & Naylor, B.J. (2007) Cavity tree occurrence in hardwood forests of central Ontario. Forest Ecology and Management, 239, 191-199.
Holmes, T., Blate, G., Zweede, J., Pereira, R., Barreto, P., Boltz, F. & Bauch, R. (2000) Financial Costs and Benefits of Reduced-Impact Logging Relative to Conventional Logging in the Eastern Amazon. Tropical Forest Foundation, Washington.
Holmes, T., Blate, G., Zweede, J., Pereira, R., Barreto, P., Boltz, F. & Bauch, R. (2002) Financial and ecological indicators of reduced impact logging performance in the eastern Amazon. Forest Ecology and Management, 163, 93-110.
Holzmueller, E.J., Jose, S. & Jenkins, M.A. (2008) The relationship between fire history and an exotic fungal disease in a deciduous forest. Oecologia, 155, 347-356.
Hopper, R.G., Lennartz, M.R. & Muse, H.D. (1991) Heart rot and cavity tree selection by redcockaded woodpeckers. Journal of Wildlife Management, 55, 323-327.
Humphris, S.N., Wheatley, R.E. & Bruce, A. (2001) The effects of specific volatile organic compounds produced by Trichoderma spp. on the growth of wood decay basidiomycetes. Holzforschung, 55, 233-237.
Hyde, K.D. & Soytong, K. (2008) The fungal endophyte dilemma. Fungal Diversity, 33, 163-173.
IBGE (1988) Mapa de Vegetação do Brasil. Ministério da Agricultura, Brasília.
Irianto, R., Barry, K., Hidayati, N., Ito, S., Fiani, A., Rimbawanto, A. & Mohammed, C. (2006) Incidence and spatial analysis of root rot of Acacia mangium in Indonesia. Journal of Tropical Forest Science, 18, 157-165.
Janzen, D.H. (1976) Why tropical trees have rotten cores. Biotropica, 8, 110.
95
Johns, J., Barreto, P. & Uhl, C. (1996) Logging damage during planned and unplanned logging operations in the eastern Amazon. Forest Ecology and Management, 89, 59-77.
Jonsson, M.T., Edman, M. & Jonsson, B.G. (2008) Colonization and extinction patterns of wood-decaying fungi in a boreal old-growth Picea abies forest. Journal of Ecology, 96, 1065-1075.
Jonsson, M., Ranius, T., Ekvall, H., Bostedt, G., Dahlberg, A., Ehnstrom, B., Norden, B. & Stokland, J.N. (2006) Cost-effectiveness of silvicultural measures to increase substrate availability for red-listed wood-living organisms in Norway spruce forests. Biological Conservation, 127, 443-462.
Josefsson, T., Olsson, J. & Östlund, L. (2010) Linking forest history and conservation efforts: long-term impact of low-intensity timber harvest on forest structure and wood-inhabiting fungi in northern Sweden. Biological Conservation, 143, 1803-1811.
Judd, T.M. & Corbin, C.C. (2009) Effect of cellulose concentration on the feeding preferences of the termite Reticulitermes flavipes (Isoptera: Rhinotermitidae). Sociobiology, 53, 775-784.
Junninen, K., Kouki, J. & Renvall, P. (2008) Restoration of natural legacies of fire in European boreal forests: an experimental approach to the effects on wood-decaying fungi. Canadian Journal of Forest Research, 38, 202-215.
Keller, M., Palace, M., Asner, G., Pereira, R. & Natalino, J. (2004) Coarse woody debris in undisturbed and logged forests in the eastern Brazilian Amazon. Global Change Biology, 10, 784-795.
Kennard, D., Putz, F. & Niederhofer, M. (1996) The predictability of tree decay based on visual assessments. Journal of Arboriculture, 22, 249-254.
King, D.A., Davies, S.J., Tan, S. & Noor, N.S.M. (2006) The role of wood density and stem support costs in the growth and mortality of tropical trees. Journal of Ecology, 94, 670-680.
Kuroda, K. (2001) Responses of Quercus sapwood to infection with the pathogenic fungus of a new wilt disease vectored by the ambrosia beetle Platypus quercivorus. Journal of Wood Science, 47, 425-429.
Larjavaara, M. & Muller-Landau, H.C. (2010) Rethinking the value of high wood density. Functional Ecology, 24, 701-705.
Liew, E.C.Y., Guo, L.-D., Ranghoo, V.M., Goh, T.-K. & Hyde, K.D. (1998) Molecular approaches to assessing fungal diversity in the natural environment. Fungal Diversity, 1-17.
96
Lim, Y.W., Kim, J.-J., Lu, M. & Breuil, C. (2005) Determining fungal diversity on Dendroctonus ponderosae and Ips pini affecting lodgepole pine using cultural and molecular methods. Fungal Diversity, 19, 79-94.
Lindblad, I. (2000) Host specificity of some wood-inhabiting fungi in a tropical forest. Mycologia, 92, 399-405.
Lindblad, I. (2001) Diversity of poroid and some corticoid wood-inhabiting fungi along the rainfall gradient in tropical forests, Costa Rica. Journal of Tropical Ecology, 17, 353-369.
Lindenmayer, D., Cunningham, R. & Donnelly, C. (1997) Decay and collapse of trees with hollows in eastern Australian forests: impacts on arboreal marsupials. Ecological Applications, 7, 625-641.
Lodge, D.J. (1997) Factors related to diversity of decomposer fungi in tropical forests. Biodiversity and Conservation, 6, 681-688.
Lõhmus, A. (2009) Factors of species-specific delectability in conservation assessments of poorly studied taxa: the case of polypore fungi. Biodiversity and Conservation, 142, 2792-2796.
Lynch, M.D.J. & Thorn, R.G. (2006) Diversity of basidiomycetes in Michigan agricultural soils. Applied and Environmental Microbiology, 72, 7050-7056.
Magurran, A.E. (2004) Measuring Biological Diversity. Blackwell, Malden.
Mattheck, C., Bethge, K. & Tesari, I. (2006) Shear effects on failure of hollow trees. Trees - Structure and Function, 20, 329-333.
McCallum, H. & Dobson, A. (2002) Disease, habitat fragmentation and conservation. Proceedings of the Royal Society of London Series B-Biological Sciences, 269, 2041-2049.
McDonald, E., Pinard, M. & Woodward, S. (2000) Invasión Micótica de Lesiones Artificiales en Ficus glabrata. USAID - Bolivia, Santa Cruz.
McGuire, K.L., Bent, E., Borneman, J., Majumder, A., Allison, S.D. & Treseder, K.K. (2010) Functional diversity in resource use by fungi. Ecology, 91, 2324-2332.
McGuire, K.L., Zak, D.R., Edwards, I.P., Blackwood, C.B. & Upchurch, R. (2010) Slowed decomposition is biotically mediated in an ectomycorrhizal, tropical rain forest. Oecologia, 164, 785-795.
Morales-Ramos, J.A. & Rojas, G. (2001) Nutritional ecology of the Formosan subterranean termite (Isoptera: Rhinotermitidae): feeding response to commercial wood species. Journal of Economical Entomology, 94, 516-523.
97
Morales-Ramos, J.A. & Rojas, M.G. (2003) Nutritional ecology of the Formosan subterranean termite (Isoptera: Rhinotermitidae): growth and survival of incipient colonies feeding on preferred wood species. Journal of Economic Entomology, 96, 106-116.
Nicolotti, G. (1996) Screening of antagonistic fungi against air-borne infection by Heterobasidion annosum on Norway spruce. Forest Ecology and Management, 88, 249-257.
Niklas, K. (1997) Mechanical properties of black locust (Robinia pseudoacacia L.) Wood. Size- and age-dependent variations in sap- and heartwood. Annals of Botany, 79, 265-272.
Nogueira, E., Nelson, B. & Fearnside, P. (2006) Volume and biomass of trees in central Amazonia: influence of irregularly shaped and hollow trunks. Forest Ecology and Management, 227, 14-21.
Norden, B. & Paltto, H. (2001) Wood-decay fungi in hazel wood: species richness correlated to stand age and dead wood features. Biological Conservation, 101, 1-8.
Noshiro, S. & Suzuki, M. (2010) Ontogenetic wood anatomy of tree and subtree species of Nepalese Rhododendron ( Ericaceae ) and characterization of shrub species. American Journal of Botany, 88, 560-569.
Nsolomo, V. & Venn, K. (2000) Capacity of fungi to colonize wood of the East African camphor tree, Ocotea usambarensis. Mycological Research, 104, 1468-1472.
Odor, P., Heilmann-Clausen, J., Christensen, M., Aude, E., van Dort, K.W., Piltaver, A., Siller, I., Veerkamp, M.T., Walleyn, R., Standovar, T., van Hees, A.F., Kosec, J., Matocec, N., Kraigher, H. & Grebenc, T. (2006) Diversity of dead wood inhabiting fungi and bryophytes in semi-natural beech forests in Europe. Biological Conservation, 131, 58-71.
Ohkuma, M., Maeda, Y., Johjima, T. & Kudo, T. (2001) Lignin degradation and roles of white rot fungi: study on an efficient symbiotic system in fungus-growing termites and its application to bioremediation. RIKEN Review, 42, 39-42.
Ohmura, W., Ozaki, M. & Yamaoka, R. (2006) Behavioral and electrophysiological investigation on taste response of the termite Zootermopsis nevadensis to wood extractives. Journal of Wood Science, 52, 261-264.
Olsson, J. & Jonsson, B.G. (2010) Restoration fire and wood-inhabiting fungi in a Swedish Pinus sylvestris forest. Forest Ecology and Management, 259, 1971-1980.

98
Osono, T., Ishii, Y., Takeda, H., Seramethakun, T., Khamyong, S., To-Anun, C., Hirose, D., Tokumasu, S. & Kakishima, M. (2009) Fungal succession and lignin decomposition on Shorea obtusa leaves in a tropical seasonal forest in northern Thailand. Fungal Diversity, 36, 101-119.
Palace, M., Keller, M. & Silva, H. (2008) Necromass production: studies in undisturbed and logged Amazon forests. Ecological Applications, 18, 873-884.
Pearce, R.B. (1991) Reaction zone relics and the dynamics of fungal spread in the xylem of woody angiosperms. Physiological and Molecular Plant Pathology, 39, 41-55.
Pearce, R.B. (1996) Antimicrobial defenses in the wood of living trees. New Phytologist, 132, 203-233.
Putz, F., Sist, P., Fredericksen, T.S. & Dykstra, D. (2008) Reduced-impact logging: challenges and opportunities. Forest Ecology and Management, 256, 1427-1433.
Ranius, T. (2002) Influence of stand size and quality of tree hollows on saproxylic beetles in Sweden. Biological Conservation, 103, 85-91.
Rayner, A.D.M., Boddy, L. (1988) Fungal Decomposition of Wood: Its Biology and Ecology. John Wiley & Sons Rib, Chichester.
Roisin, Y., Dejean, A., Corbara, B., Orivel, J., Samaniego, M. & Leponce, M. (2006) Vertical extratification of the termite assemblage in a neotropical rainforest. Oecologia, 149, 301-311.
Rolstad, J., Saetersdal, M., Gjerde, I. & Storaunet, K.O. (2004) Wood-decaying fungi in boreal forest: are species richness and abundances influenced by small-scale spatiotemporal distribution of dead wood? Biological Conservation, 117, 539-555.
Romero, C. & Bolker, B.M. (2008) Effects of stem anatomical and structural traits on responses to stem damage: an experimental study in the Bolivian Amazon. Canadian Journal of Forest Research, 38, 611-618.
Romero, C., Bolker, B.M. & Edwards, C.E. (2009) Stem responses to damage: the evolutionary ecology of Quercus species in contrasting fire regimes. New Phytologist, 182, 261-71.
Ryvarden, L. (2004) Neotropical Polypores. Part 1. Introduction. Hymenochaetaceae and Ganodermanceae. Fungiflora, Oslo.
Ryvarden, L. & Johansen, I. (1980) A preliminary Polypore Flora of East Africa. Fungiflora, Oslo.
99
Roose-Amsaleg, C., Brygoo, Y. & Harry, M. (2004) Ascomycete diversity in soil-feeding termite nests and soils from a tropical rainforest. Environmental Microbiology, 6, 462-469.
Salguero-Gómez, R. & Casper, B.B. (2011) A hydraulic explanation for size-specific plant shrinkage: developmental hydraulic sectoriality. New Phytologist, 189, 229-40.
SAS Software Version 9.2 of the SAS System for Windows. Copyright 2009. SAS Institute Inc., Cary, NC, USA.
Schloss, P.D. & Handelsman, J. (2005) Introducing DOTUR , a computer program for defining operational taxonomic units and estimating species richness. Applied and Environmental Microbiology, 71, 1501-1506.
Schulze, M. & Zweede, J. (2006) Canopy dynamics in unlogged and logged forest stands in the eastern Amazon. Forest Ecology and Management, 236, 56-64.
Schwarze, F. W. M. R., Engels, J. & Mattheck, C. (2000) Fungal Strategies of Wood Decay in Trees. Springer-Verlag, Berlin.
Seena, S., Wynberg, N. & Bärlocher, F. (2008) Fungal diversity during leaf decomposition in a stream assessed through clone libraries. Fungal Diversity, 30, 1-14.
Shigo, A.L. (1984) Compartmentalization – a conceptual framework for understanding how trees grow and defend themselves. Annual Review of Phytopathology, 22, 189-214.
Shigo, A.L. (1989) A New Tree Biology: Facts, Photos, and Philosophies on Trees. Shigo and Trees Associates, Durham.
Shigo, A.L. & Hillis, W.E. (1973) Heartwood, discolored wood, and microorganisms in living trees. Annual Review of Phytopathology, 11, 197-222.
Siitonen, P., Lehtinen, A. & Siitonen, M. (2005) Effects of forest edges on the distribution, abundance, and regional persistence of wood-rotting fungi. Conservation Biology, 19, 250-260.
Sivasithamparam, K. (1998) Root cortex - the final frontier for the biocontrol of root-rot with fungal antagonists: a case study on a sterile red fungus. Annual Review of Phytopathology, 36, 439-452.
Stokland, J. & Kauserud, H. (2004) Phellinus nigrolimitatus - a wood-decomposing fungus highly influenced by forestry. Forest Ecology and Management, 187, 333-343.

100
Suryanarayanan, T.S., Senthilarasu, G. & Muruganandam, V. (2000) Endophytic fungi from Cuscuta reflexa and its host plants. Fungal Diversity, 4, 117-123.
Takahashi, K.H. & Kagaya, T. (2005) Guild structure of wood-rotting fungi based on volume and decay stage of coarse woody debris. Ecological Research, 20, 215-222.
Temesgen, H., Barrett, T.M. & Latta, G. (2008) Nearest neighbor imputation methods for western Oregon and Washington forests. Silva Fennica, 42, 337-354.
Thomas, P. 2004. Trees: Their Natural History. Cambridge University Press, Cambridge.
Thorpe, H.C., Thomas, S.C. & Caspersen, J.P. (2008) Tree mortality following partial harvests is determined by skidding proximity. Ecological Applications, 18, 1652-1663.
Toofanee, S.B. & Dulymamode, R. (2002) Fungal endophytes associated with Cordemoya integrifolia. Fungal Diversity, 11, 169-175.
Uhl, C. & Kauffman, J.B. (1990) Deforestation, fire susceptibility, and potential tree responses to fire in the eastern Amazon. Ecology, 71, 437-449.
Urcelay, C. & Robledo, G. (2004) Community structure of polypores (Basidiomycota) in Andean alder wood in Argentina: functional groups among wood-decay fungi? Austral Ecology, 29, 471-476.
Vainio, E. & Hantula, J. (2000) Direct analysis of wood-inhabiting fungi using denaturing gradient gel electrophoresis of amplified ribosomal DNA. Mycological Research, 104, 927-936.
Vandenkoornhuyse, P., Baldauf, S.L., Leyval, C., Straczek, J. & Young, P.W. (2002) Extensive fungal diversity in plant roots. Science, 295, 2051.
Van der Putten, W.H., Vet, L.E., Harvey, J.A. & Wackers, F.L. (2001) Linking above- and belowground multitrophic interactions of plants, herbivores, pathogens, and their antagonists. Trends in Ecology & Evolution, 16, 547-554.
Vasiliauskas, R., Juska, E., Vasiliauskas, A. & Stenlid, J. (2002) Community of Aphyllophorales and root rot in stumps of Picea abies on clear-felled forest sites in Lithuania. Scandinavian Journal of Forest Research, 17, 398-407.
Verma, M., Sharma, S. & Prasad, R. (2009) Biological alternatives for termite control: a review. International Biodeterioration & Biodegradation, 63, 959-972.
101
Watrin, O. dos S. & Rocha, A.M.A. 1992. Levantamento da Vegetação Natural e do Uso da Terra no Município de Paragominas (PA) Utilizando Imagens TM/LANDSAT. Boletim de Pesquisa, 124. Embrapa – CPATU, Belem.
Werner, P.A. & Prior, L.D. (2007) Tree-piping termites and growth and survival of host trees in savanna woodland of north Australia. Journal of Tropical Ecology, 23, 611-622.
Wong, N. & Lee, C.-Y. (2010) Influence of different substrate moistures on wood consumption and movement patterns of Microcerotermes crassus and Coptotermes gestroi (Blattodea: Termitidae, Rhinotermitidae). Journal of Economic Entomology, 103, 437-442.
Yanagawa, A., Yokohari, F. & Shimizu, S. (2010) Influence of fungal odor on grooming behavior of the termite, Coptotermes formosanus. Journal of Insect Science, 10, 1-14.
Zanetti, R., Amaral-Castro, N.L., Moraes, J.C., Zanuncio, J.C., Andrade, H.B. & Souza, A. (2005) Spatial distribution and sampling methodology of heartwood termite (Isoptera: Rhinotermitidae) attacks in Eucalyptus spp. Sociobiology, 46, 655-665.
Zanne, A., Lopez-Gonzalez, G., Coomes, D., Ilic, J., Jansen, S., Lewis, S., Miller, R., Swenson, N., Wiemann, M. & Chave, J. (2009) Global wood density database. Dryad.
Zheng, Z., Zhang, S., Yang, G., Tang, Y., Baskin, J., Baskin, C. & Yang, L. (2009) Abundance and distribution of cavity trees in an old-growth subtropical montane evergreen broad-leaved forest. Canadian Journal of Forest Research, 39, 2234-2245.

102
BIOGRAPHICAL SKETCH
Ana Eleutério grew up in Sao Paulo, Brazil. She received her bachelor’s degree in
biological sciences in 2001 from the University of Sao Paulo. Since then, she conducted
plant ecology research in many very different tropical and temperate forests. In 2004,
Ana Eleutério received her master’s degree in environmental sciences from the
Universidad Nacional Autonoma de Mexico. During the 3 years she lived in Mexico, she
had the opportunity to interact with a variety of different research teams and to develop
her own interdisciplinary study on the management of endangered species of tree ferns.
She started her doctorate studies in the Department of Biology (then the Department of
Botany) at the University of Florida in August 2005. Her current research focuses on
issues related to forest health in natural tropical forests managed for timber. For her
research, she received financial support from the Coordenação de Aperfeiçoamento de
Pessoal de Nível Superior (CAPES) – Fulbright Commission, the International
Foundation for Science (IFS), and IdeaWild. After graduating, Ana plans to return to her
home country and secure a research position at a Brazilian university that will enable
her to continue investigating the ecology of tropical plants in managed forests.