Embed Size (px)
Citation preview
Rapport BIPM-77/4
Report on the international comparison of activity measurements
of a solution of 139Ce (March 1976)
by A. Rytz
.' ;..1 ...
1977
BUREAU INTERNATIONAL DES POIDS ET MESURES
F-92310 SEVRES

CONTENTS
Abstract
1. 1 ntroduc tion
2. Description of the so lution and of the purity tests Decay scheme and nuclear data
3. Adsorption tests
4. Source preparation for measurements with proportional counters
5. Liquid scintillation counting
6. Equipment, block diagrammes, coincidence counting data
7. Experimental details of special counting methods a) X K (Nal}-y counting (lMM) b) 211 XL (PC)-y counting (lMM) c) 41TSi(Li)-y counting (NPL)
8. 4ïTy measurements with a large, calibrated scintillation detector (lRK)
9. Coincidence formulae for calculating the activity Special formulae
10. Efficiency functions, polynomial fitting
11. Final results, uncertainties
12. Siope-to-intercept ratio
13. Conc lusion
Table 1 - List of the participants
Il 2 - Summary of impurity determinations carried out by 1ER and LMRI
2 3
4
5
5
6
7 7 8 9
10
11 14
15
18
18
20
22
24
Il
Il
3 - Results of adsorption tests 25
4 - Source preparation for 41i (PC)-y and 411 (PPC)-y counting 26 Il
Il
Il
Il
Il
5 - Source preparation for 4lT (LS)-y counting 30
6 - Equipment for 4iT (LS)-y counting 31
7 - Equipment for 411 (PC)-y and 4 Tï(PPC)-y counting 32
8 - Dead times and coincidence resolving time
9 - Coincidence counting data
35
38

Table 10 - Results of X? tests for the efficiency functions
Il
Il
Figure Il
Il
Il
Il
Il
Il
11 .;. Final results and uncertainties
12 - Systematic uncertainty of the final result
- Spec imen of reporting form
2 - A selection of equipments used by the participants
3 - Efficiency extrapolation, residuals
4 - Graphical representation of the results
5 - Distribution of the resu Its of the radioactivity concentration
6 - Distribution of the values obtained for the slopeto-intercept ratio
7 - Correlation of the intercept and the slopeto-intercept ratio
References
ii
41
42
45
50
52
57
63
64
64
65

ABSTRACT
Pursuing the programme of international comparisons of radionuclides organised by the Bureau International des Poids et Mesures, 23 national and international laboratories have measured the radioactivity concentration of samples of a solution of 139Ce. The active material was prepared by the National Physical Research Laboratory (Pretoria) and purity-checked by the Institut d'Electrochimie et de Radiochimie de l'Ecole Polytechnique Fédérale (Lausanne) and the Laboratoire de Métrologie des Rayonnements Ionisants (Saclay). The solution was bottled and distributed by the Agence 1 nternationa le de l'Energie Atomique (Vienna) in March 1976.
ln most cases a 4Tr proportional gas flow counter (with f
atmospheric or higher pressure) or a liquid scintillation counter in coincidence with a Nal scintillation counter was used. The results obtained are presented and discussed.
Details on source preparation, counting equipment and data analysing are reported in tabular or graphical forme Special attention is given to the formulae used, the corrections applied and the uncertainties assessed.
iii

1. INTRODUCTION
ln 1970 it was decided [1 J to suspend the programme of
international comparisons organised under the aegis of the Bureau
International des Poids et Mesures (BIPM) for a periode As the spread
of the results obtained had not decreased as much as expected, Section Il
(Mesure des Radionucléides) of the Comité Consultatif pour les Etalons
de Mesure des Rayonnements Ionisants (CCEMRI) expressed the view that
the expenditure of effort on full scale comparisons was too large considering
their low efficiency. In the meantime several Working Parties had been
formed in order to study sorne special problems related to the measurement
of activity. The results of sorne of these studies have been p1,.lblished (see
e.g. [2,,3J); others ore still in progresSe It may be expected that these
publications will help to avoid sorne experimental pitfalls and to improve
the accuracy of future results. In addition, a special working party w6s
charged with the choice of radionuclides and the preparation of future
comparisons. Five proposais made by this group were submitted to the members
of Section Il whose answers led to the following in decreasing order of 139 134 57 241 35 .. .
preference: Ce, Cs, Co, Am, S. Prellmlnary compansons
with a reduced number of participants [4, 5, 6] were organised for the
first three of these radionuclides; they permitted to clarify certain problems
and to work out an appropriate reporting forme Previous international .... ~ '.
comparisons had already weil demonstrated how important such details
can be for the success of the whole enterprise.
The forms to be used for the present comparison were distributed
to the participal)ts in December 1975 (see specimen, Fig. 1) along with
sorne instructions and remarks. The reference date had been fixed a-s
1976-03-15, 00 h UT.
ln a preliminary report [7] the results and the most important data
submitted by twenty participants have been circulated (1976-07-15).
Three more results arrived a few weeks later. The list of the participants
is reproduced in Table 1.

2
2. DESCRIPTION OF THE SOLUTION AND OF THE PURITY TESTS
139 ] The primary Ce was produced [8 by bombardment of
a lanthanum target with 16 MeV deuterons, at the NPRL *, according to
the reaction
139La (d, 2n) 139 Ce.
139 After bombardment the active surface layer was shaven off and Ce
separated by a solvent extraction method [9J. The cerium was then reduced
to the trivalent state, back extracted into an aqueous phase and evaporated
to dryness. After destruction of the remaining organic material by evaporation
with concentrated HN03
, the cerium was taken up in diluted hydrochloric
acid (1 mol HC 1 in 1 dm3 of H20).
Much attention was paid to extensive purity tests and to the choice
of the composition of the solution to be distributed.
Samples from a test run were sent to 1ER and LMRI in May 1975.
Each sample contained about 108
Bq of 139Ce , carrier free in about 1 cm3
of di luted HC 1. These two laboratories carried out purity tests by y-ray
spectrometry (Ge{L i) and superpure Ge detectors), ~-ray spectroscopy,
half-life measurement and determination of the slopejintercept ratio
by 4rr{PC)-y counting. Similar checks were made by the same two laboratories,
eight months later, with samples from the main run. Each laboratory sent ~ ",.. '1'".
comprehensive reports on their measuremenrs to the BIPM in October 1975
and February 1976.
The results of these purity tests were slightly different from one run
to the other and fro,m one laboratory to the other. Nevertheless, these were
minor differences, and the radionuclidic purity of the 139Ce could be
considered as sufficient in each case.
* The full names of the laboratories can be found in Table 1.

3
Table 2 gives a summary of the results obtained. By far the most 141
important contamination is due to Ce, not detected by 1ER because
of too Iowa sensitivity of their particular equipment. However,
the activity ratio, at the reference date of the comparison (1976-03-15),
was A 141 lA 139 = 1 .6 x 10-4
, i.e. sti Il negl igible, at least for activity
measurements.
-1 The dilution of the main bulk to about 700 kBq·g ,the addition
of the carrier, the bottling of the solution and the dispatch of the samples
were carried out by the AlEA at Seibersdorf (near Vienna).
ln the first week of March 1976, each participant received
fwo ampoules (type NBS) containing each about 3.5 9 of solution.
The chemical composition was 20 \Lg of CeCI 3 per gramme of an aqueous
solution of 0.2 mol Hel in 1 000 cm3
• The mass of each sample had been
determined by AlEA to ~ 10 fLg in order to make possible certain
adsorption tests.
Decay scheme and nuclear data
The following data have been recommended for use to ail
the participants prior to the comparison.
1 .5 ns
T 112 = (137.65 : 0.07) d [10 ]
,.- ;«
Ml
E.C. 100% 165.8 ke V
Energies of the radiations emitted: X rays mostly 33 and 38 keV, Auger e lectrons ~ 37 keV, y rays 165.8 keV, conversion electrons ~ 127 keV,
(total conversion coefficient 0( :::::::1 0.25) •. tot

4
3. ADSORPTION TESTS
Although the chemical composition of the solution distributed
had been chosen so as to prevent adsorption at the walls of the glass
ampoules, the following three procedures have been suggested by the
Working Party in order to evaluate upper limits, using ion chamber
mea su re me nts.
1. Comparison of the radioactivity concentration in the pycnometer
before and after dispensing the sources.
2. Comparison of the solution in the original ampoule before breaking
the sea 1 to
a} that part of the original solution which was left after source
preparation and transfer to a new ampoule of the same type
(for this purpose each participant had also received two empty
ampou les),
b} the small amount not extracted from the original ampoule.
ln 2a} and b} diluant had to be added in order to get the same
volume of liquid as originally present.
Table 3 gives a summary of the results obtained. The methods 1)
and 2a} being rather similar, they are not quoted separately. Method 2b}
was not very sensitive, due to the low energy of the y rays and the small
amount of <:Jctivity left in the original ampoules. As to method 2a},
the precision seems to be quite good. However, the fact that NPL and
BIPM found II nega tive adsorption ll of nearly 0.1% suggests the presence
of systematic errors of this order of magnitude. Thus, to this order of
accuracy it seems unlikely that significant adsorption took plaçe. The result
obtained by ASMW deserves attention but does not seem to have influenced
the final result of this laboratory.

5
4. SOURCE PREPARATION
FOR MEASUREMENTS WITH PROPORTIONAL COUNTERS
Ali the information contained in the individual forms has been
condensed in Table 4 which is self-explanatory.
The column headed "Range of Nc/Ny" gives the range of efficiency
of the proportional counter to Auger electrons and X rays. It deserves
special attention, since high efficiency is always an advantage. As there is
no clear correlation between the application of certain seeding or spreading
agents and the highest efficiency obtained, the skill of the operator
. seems to be more important than the particular treatment applied.
The most frequently used backing material is metal-plated VYNS.
One laboratory (SC K) dispensed sources on non-metallized VYNS films
and compared, in a later experiment, 60Co sources on metallized films t
with sources on non-metallized ones. Although practically no difference
in radioactivity concentration was found, it is evident that the results
obtained by SC K contain a large systematic error which may be due to
charging-up of the sources. Therefore it was decided to withdraw them
from Table 11 and Figures 4, 5 and 6.
5. LlQUID SCINTI~L~T.ION COUNTING
Only three laboratories have used 4ïi (LS)-y counting in this
comparison. Source preparation and equipment are described in Tables 5
and 6. Various. procedures for varyi ng N c /Ny were appl ied and the quai ity
of the results obtained differed considerably from one laboratory to the other.
The three different gates in the y channel used by IBJ (Table 9 and
[7J) gave widely different and incompatible results. However, further
experiments carried out by this laboratory showed that the highest and
the lowest results are in error due to an excess and a loss, respectively,
of coincidences. Therefore, only the intermediate result has been maintained.

6
As the result reported first by NPRL [7J was high by 1.0 to 1.5 %,
this laboratory further investigated the performance of its equipment.
It appeared that, despite the use in coincidence of two photomultiplier
tubes in the 41i (LS) detector, spurious pulses had not been eliminated
sufficiently. Therefore, two variations of the so-called gating technique [3J were applied for determining the probability for the production of spurious
pulses. It could be shown [11] that a correction of (1.3 ~ 0.2)% has to be
applied. This brings the result of NPRL down to a value in close agreement
with others.
The special equipment used at NPL allowed a more sophisticated
extrapolation procedure, which is described in [12J, to be applied.
A single y window over the photopeak or a wide y window from 50 keV
to above the photopeak did not yield a satisfactory polynomial fit of
the effic iency function. However, the simul taneous use of two windows,
one over the photopeak, the other below and excluding the photopeak,
gave a good fit. The correlation of the data points has been accounted for
in a special fitting procedure. However, a relatively high systematic
uncertainty (1.5%) subsisted. Correlation counting was used in order
to estimate the upper limit of the spurious pulse rate {cf. [3J)0
.6. EQUIPMENT, BLOCK .o\1AGRAMMES,
COI N CID E N CE -C 0 U NT 1 N G DA TA
Details of the counting equipment as reported by the participants
are described in Tables 6 and 7. Table 8 lists ail the data concerning
dead times, resolving times and the methods used for their determination.
Many participants have supplied block diagrammes of their electronic
system (see Fig. 2). Others have quoted the corresponding references which
may be found in Tables 7 and 8.

7
As is we Il known, a re lative de lay between ~ a nd y channe Is
can change the coincidence rate (IIGandy effect ll). Such delays have
been measured, but were found to be certainly less than 0.5 ~s and
often much shorter. The corresponding corrections applied to the final
results are given in Table 9. The methods used for determining or
eliminating the delay are described in [13J and [14J.
7. EXPERIMENTAL DETAILS
OF SPECIAL COINCIDENCE-COUNTIN G METHODS
Two laboratories have, in addition, made use of three methods,
the description of which did not fit into the preceding tables. Therefore,
they are summarized separately hereafter.
a} ~ K (Na I}-y counting (1 MM)
X channel y channel
Nal(TI} crystal (mm) d = 30, h = 20
B k d (s -l) a c 9 ro un ra te
d=30, h=2
O. 16 1 • 1 (B = O) c
Dead time ( p.-s)
Resolving time (/-L-s)
2.34 + 0.05 2.34 + 0.05
o . 91 5 + O. 007
1.475+0.010
Thirteen sources were measured during 1 000 s for each data point.
The activity A was calculated as follows:
A = N o
where
N /1 . .232 8 o
(from Nucl. Data She~ts g, 2 (1974) ),
N = activity calculated by means of Campion's formula, o
PK = K capture probability,
O(K = K shell conversion coefficient.

8
Components of systematic uncertainty:
weighing dead-time correction resolving time afterpulses constants (decay scheme)
tota 1
b) 21iXL
(PC)-y counting (lMM)
0.05 % 0.005 0.02 0.05 0.7
0.7 %
- L X-ray detector: semi-cylindrical 21tproportional counter made of
aluminium, d = 180 mm, 1 = 80 mm; anode: constantan, d = 0.1 mm,
1 = 125 mm, distance from source 35 mm; 2.3 kVi Ar/CH4
at
atmospheric pressure, discrimination level 100 eV.
- y-ray detector: one Nal(T1) crystal, d = 40 mm, h = 30 mm.
-Deadtimes (lJ-s): r =1:' =2.34+0.05 x y -
- Resolving time (\-I..s): "'( = 1.475 + 0.010 r
-1 - Background rates (s ):
2.08 + 0.01 •
B = 2, x
n K • n KL + nL A = N (1 + ) = N /1.216
o PK·nK
+PL
0
where
N = calculated activity, o
B = O. c
(see Nuclo Data Sheets),
nK(nL
) = ,relative number of K(L)-she,!IyÇlcancies resulting from internaI
conversion of y quanta,
n KL = relative number of L-shell vacancies resulting from the formation
ofa K-shell vacancy,
PK(PL
) = K(L) capture probability.
Thirteen sources were measured during 1 000 s for each data point.
9
Components of systeinatic uncertainty:
weighing dead-time correction reso 1 vi ng ti me background afterpulses constants (decay scheme)
tota 1
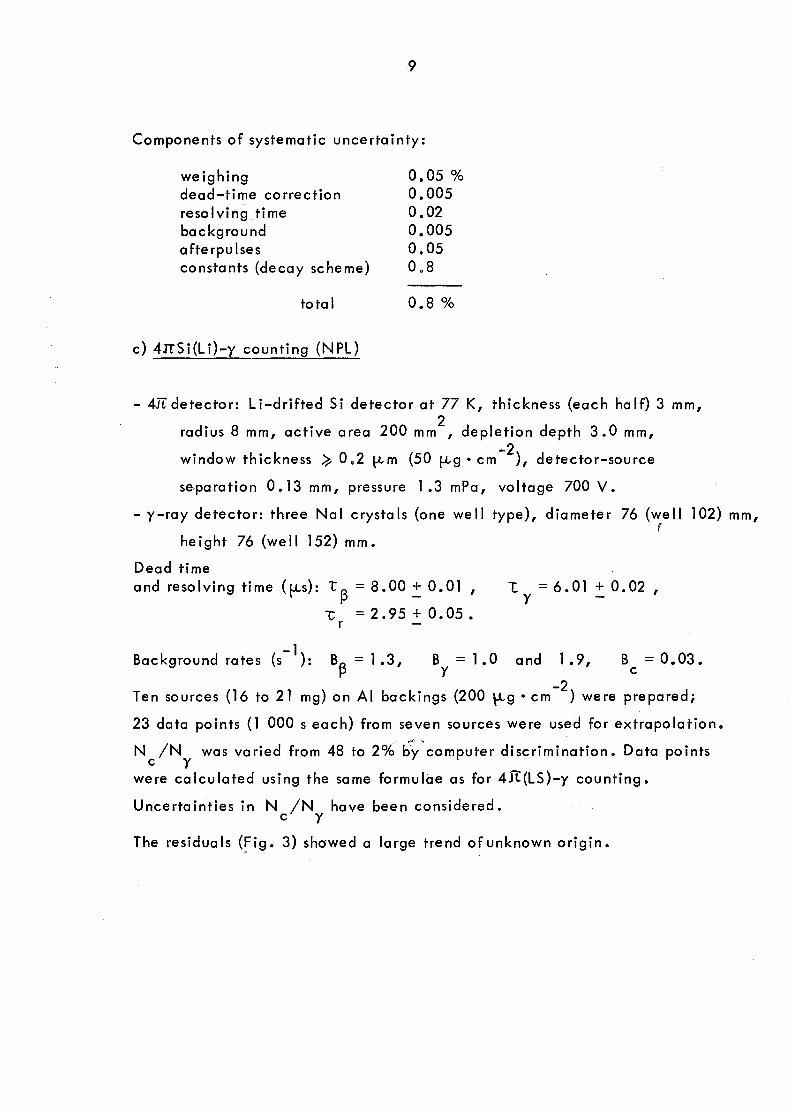
c) 4rrSi(Li)-y counting (NPL)
0.05 % 0.005 0.02 0.005 0.05 0.8
0.8 %
- 4Jï detector: Li-drifted Si detector at 77 K, thickness (each half) 3 mm,
radius 8 mm, active area 200 mm2
, depletion depth 3.0 mm,
window thickness ~ 0.2 tLm (50 fLg • cm -2), detector-source
se'paration 0.13 mm, pressure 1.3 mPa, voltage 700 V.
- y-ray detector: three Nal crystals (one weil type), diameter 76
height 76 (weil 152) mm.
Dead time
(weil 102) mm, t
and resolving time (ILs): "t~ = 8.00 ~ 0.01 , L = 6. 01 + O. 02 , Y
-Cr =2.95+0.05.
-1 Background rates (s ): BA = 1.3, B = 1.0 and 1.9, B = 0.03.
~ Y c -2
Ten sources (16 to 21 mg) on AI backings (200 \-lg • cm ) were preparedi
23 data points (1 000 s each) From seven sources were used for extrapolation.
N IN was varied From 48 to 2%' by'computer discrimination. Data points c y
were calculated using the same formulae as for 4Jt(LS}-y counting.
Uncertainties in N IN have been considered. c y
The residuals (fig. 3) showed a large trend ofunknown origine

10
8. 4:Ry MEASUREMENTS
WITH A LARGE CALIBRATED SCINTILLATION DETECTOR (lRK)
The results obtained by this laboratory are not considered to be
"absolute Il in the same way as is generally accepted for coincidence
measurements. Nevertheless, the method summarized here is about midway
between absolute and relative.
Source preparation
The total content of ampoule nO 3 was diluted with a diluent
of the same composition (dilution factor = 28.076). A new (1975) Mettler
balance type P 163 was used for determining the mass of the diluent.
Drops of 14 to 35 mg of the dilution were dispensed onto each of
seven backin'gs of diameter 18 mm and thickness 0.1 mm by means of
a pycnometer. The source mass was determined simultaneously by differential 1
weighing of the pycnometer and by the evaporation method 0 For the first
method a Mettler balance type H 16 was used which had previously been
recalibrated and checked for scale linearity. The samples were placed on
the pan of a fast electronic microbalance (Perkin Elmer AD-2) with digital
display. Several tens of readings were taken from 15 s until 8 min after
dispensing, and extrapolated to zero time. Only those four sources were
counted for which both weighings agreed within 40 (1-g.
The'detector was a Nal(TI) welrcfystal, d = h = 127 mm, weil
diameter 27 mm, depth 74 mm, mounted on a RCA 8055 photomu Itipl ie r ([15J).
Integral counting above 13 keV was carried out with a dead time of
(10.3 :!: 0.2) p.s. The measurements took place from April 26 to April 28;
each sample was counted twice a nd the tota 1 counting time wa's 8 000 s. -1
The count rates ranged from 340 to 740 s • The background rate --1
(of about 52 s ) was measured with a sample prepared from a drop of diluent,
before and after each source was counted. The calculated efficiency [16]
was 0.952 + 0.005.

11
9. COINCIDENCE FORMULAE FOR CALCULATING THE ACTIVITY
Since a rigorous method for computing the sample activity from
the observed count rates is still lac king, various approximate forms have
been employed. A recent article by Cox and Isham [23] gives the solution
which is exact under certain conditions*. The formulae used by the
participants are mostly derived from those developed by Campion [17J or
by Bryant [18] • It can be seen that the differences between the various
expressions are often due to second-order terms or to the way in which
background is corrected for. Moreover, sorne participants have taken into
account delay offset or unequal pulse lengths in the two channels. In what
. follows the decay-scheme-dependent correction will not be considered.
About one half of the participants have used a formula stemming
from thewell-known paper by Campion [17] and which may also be found
in [19] and [20]
NA N [1 - l (N 1 + NI) ] _ ~ y r ~ y
No-(N -2tNINI)11--c I NI)' c r ~ y c
1 -r < 1: • c
The symbols used here and later on have tne following meaning:
"'Cr
sample activity,
observed (uncorrected) count rates in the ~, y and coincidence
channels, respectively,
count rates correct·él for' background,
dead tirnes of the respective channels,
the shorter of -C~ or ""C y '
co inc idence reso 1 ving time.
This formula was used by AAEC, BARC, BIPM, ETL, IEA, 1ER, IMM,
OMH and SC K, while PTB added a de lay-offset term according to Gandyls
theory [21] •
* For practical implementation, see D. Smith, Improved correction
formulae for coincidence counting (Nucl. Instr. and Meth., in press).

12
Slightly different forms also used were
ASMW:
NPRL
UVVVR:
N o
N o
N o
1: ='C =T , ~ y ,
[
NI NI ] 1 + 2 1; f3 y - 1: (N 1 - NI) (1 + 1: NI)
r NI r ~ y y c c
Seven participants have reported formulae derived from equations
(4) or (6) given in [18J. As there are sorne small differences, mainly
in the way the background is corrected for, we reproduce here ail the
expressions indicated by the participants concerned. Additiona 1 symbol~
appearing are
duration of pulses from ~ and y channels, respectively,
arriving at the coincidence mixer; one has always
SA + S = 2 L , jJ y r
delay between ~ and y channels, positive when the ~ channel
is delayed, ,." '1 .~
N~, N*' N* count rates corrected for dead time and background rate jJ y' c
Q
of genuine coincidences,
observed background count rates,
ratio of coincidence to y-channel count rates, ,both rates
being corrected for dead time and resolving time,
ratio of coincidences to y-channel count rates, both rates
being corrected for dead time, resolving time and
background.

- following eq. (6) in [18J:
AlEA:
BCMN:
NPL: 4TI(PC)-y
N* = c
NI -2't NI NI c r (3 y _ BI,
[1 - -C (N 1 + NI)]' [1 - -C (N 1 - NI)] (1 _ 1: NI) c
r ~ y y y c ~ ~
N N (3 N (1 - 1: ê N ê - (., N 1 + 1: 1 NI) [1 - 1: (N ê + NI)] = y y y c r 'y
o (NI _ 2"t NI NI) (1 -L NI) (1 -1: NI) c r ~ y ~ ~ y y
N N ê N ( 1 - -c (3 N ~ - 1: N 1 +"'t 1 NI) [1 -1: (N ~ + NI)]
= Y t-' Y y c r t-' y o (N - 2 r N~ NI) (1 - LA N~) (1 - t NI)
c r t-' y t-' t-' Y Y
1 N o
NA N - t-' Y - N*
c
1 (see [22 J) .
- following eq. (4) in [18J :
AECL: '
LMRI:
NBS and
NRC: j
NI NI f3 - B Il;
N ~ = l---"C=-"~~Njï~ ~ , Y _ BI
N * = -=----=~N~ Il Y Y Ly Y
N = o
N* N* ~ Y ~
c
N* = c
N = 0
QI =
[ N 1 - (9 + 9 ) NIN 1 ] (2 -"t N 1 - 1: NI) C ~ y ~ y ~ ~ y y _ BI
[2 - T NI - L NI + 2 'CI NI - 2 (9 NI + 9 NI) + 2 S (N 1 - NI) ] (1 - -C NI) (1 - -C NI) C
~ ~ y y c y ~ ~ y ~ y ~ ~ y y
N~ N y [ n N' -2 1: (Nê + N')] with '"C = ê = 1: 1: < T 12 l + cry
1 ~ Y 1 N -2t'N ' N' 2-~(N'+N')
r c r ~ y ~ y
(NI - 2-C NI NI) [1 - ~ (NI + N'q C r ~ y 2 ~ y- T ="t =1:
NI. (1 -"C NI) [1 - ~ (N 1 + N 1 - 2 NI) - 't~ (N 1 + NI)] 1 ~ Y
y ~ 2 ~ Y c r ~ y
QI _ BliNI = [N~/(l -TN~)J - B~ _ c y N Q - 1 - BI IN 1 1 0 Q
Y Y
CI.)

Special formulae
IPA used a formula which contains also higher-order terms in T and "j; , with 17 = l:'~ = -C : r y
[ N' N' N' N' ] N' N' 1 1 +T 13 y 2 13 • y 13 • y
(N c - Be) 1 (1 -1: NI + 1 _ -C NI) - L 1 _ '( NIl _ 1; N 1 - 2 L r 1 -"C NIl -"'C NI
N* = ~ y ~ y ~ y c
, ~ N' N' ] N' NI -2 NI NI
l+(N~-B~)"Cl+~(l_·lN' +l-i'N'
) -L r (l-lN'+ y ) l.t r ~ y
-1:N' + 2 (1 -1;N ' - 1 -'eN ' ) ~ y ~ y ~ y
NI N* - ~ ,_BI, ~ - l-1:,N~ ~
N* = y
NI Y _ BI vN ' y
y
For its set-up with three phOtomultipliers (see Fig. 2),IBJ developed the following expression .~
Nkl N~ = N K1 = - BI
1 - T~l N~l - T~2 N~2 +t~min Nkl Kl
,
N* = c
NK2
= 1 -L~l N~1-'t~2 N~2
where
L~min istheshorterofl~l or T~2'
1:. is the shorterof L.(.).l' mIn t-'
L ~2 or
Nk2
-l N'+L NI + Y Y ~min. Kl
(; y
1 - (N 1 + NI) T Y K 1 r
N = y
NI "t min K2
NI Y
- 1. NI Y Y
BI, Y
--. NI NI -2t. r y Kl
- Bk2 '
2 '
~

15
With both methods, 4IT{LS)-y and 4rrSi{Li)-y, NPL used the same formula:
NA Ny
rr -1; (NI + Nk )] {1 - 't'A Nk ... 1; N = __ ---'~'____'_ __ . [. r y t-' to t t-' t-' to t y
NI +L NI ) Y Y ctot
oN -2"CNINI {l-"tA Nk )(1-17 NI) c r ~ y t-' t-' to t y Y
Here
N~ and N~ refer to the count rates above a chosen ~ energy,
N~tot and N~tot are the rates over ail ~ energies [12J • The equation refers
to one y window cind becomes more complicated where two windows
are employed.
Finally, we mention the formulae developed by NRC for the anti
coincidence method [24J
C~ - A C
N~ = - BI N = Y BI t l ~
, y t - C T y
, y y
Cê
Cy S C - A A N = Y
- Bly. = t l +8 (C~ + CV)
, y t l
Here
C~ , Cy
1 C y a re the accumu lated counts in the ~, y and Y channe Is,
respectively (see Fig. 2),
A is the number of accidentai events in the ~ or Y channels,
t = re ait i me,
t l = live time,
S = delay gap ( <;:tJ 13 ns).
.... ;"7 ".
10. EFFIC1ENCY FUNCTIONS, POLYNOMIAL FITTING
139 The simplicity of the Ce decay scheme makes this radionuclide
especially weil suited for coincidence counting with efficiency extrapolation.
This fact and the absence of particular difficulties (as e.g. impurities,
insoluble salts) have already been realized on the occasion of the preliminary
comparison organized by the BIPM [5J in 1974. Experimental and

16
theoretical justification of the extrapolation method has been discussed
in detail [25J and systematic errors are likely to be rather small.
The efficiency function has been approximated by a polynomial
y = a o + al
N N
2 x + a
2 x +.0., when expressed in the coordinates
y = ê y mN
and x = c
1 - N IN c y
N IN ' where the c y
count rates are the same as
in the preceding section and m is the source masse
The methods used for varying N IN , the efficiency of the 41ï counter, c y
are indicated in Table 4, where it may be seen that, besides counting gas
variation, self-absorption, foil absorption and threshold level variation
were applied. Self-absorption may be varied by redissolving a source
and adding inactive carrier or by using several sources of different masse
The latter procedure is simpler but less reliable, since individual efficiency
functions may differ from each other. However, no such difference has been f
reported. The coefficients ao
' al' a2
, ••• , have been least-squares fitted
to the data points (x, y) in the well-known manner.
The graphica 1 representation of the residua Is of the data points
obtained from the various participants are reproduced in Fig. 3.
As one could expect, the efficiency functions turned out to be
very nearly linear in mo'st cases. The majority of the participants have
also calculated second-order fits. However, the ratio a2/a1 seldom .... ;d .~
exceedeCl 0.002 5; in a single case (LMRI) it was as high as 0.012. Third
and higher orders could always be neglected.
The order of the "best fit" can be determined by comparing the results
of X2 tests from,adjustments of different orders. Such tests have been
reported by the participants and are listed in Table 10.
ln the graphical representation of t.he efficiency function, the variables
x and y are in general correlated and this should be accounted for in
the calculation of the variance and the statistical weights.

17
ln fact, if for 139Ce the measurement of a data point corresponding
to a fairly low efficiency, N IN , is repeated a large number of times c y
and plotted in a y{x) diagram, the corre lation becomes obvious [26 J . The estimation of the residual and its variance has been treated
by Adams and Baerg and by Baerg [27J. Recently, Merritt et al. [29J
have applied this approach to the case of a linear efficiency function
yi = Y (1 + Kx), where the intercept y and the slope K are estimated o 0
from a preliminary fit (using e .g. equal weights). A better estimate of
the weight will then be given by the inverse variance of the residual ri. 1 - N IN
One has, with m = source mass and x = N IN y : c y
ri = NA N I(m N ) - y (1 + Kx) = liN + X + Y + (X YIN ) - my - (my KY IN )l . 1"' Y c 0 m L c c 0 0 cJ
Here X = N - N and Y = N - N are the non-coincident count rates, ~ c y c
as in [28J. The variance is then
2222222 0- ri = (d ri 1'0 N c) cr- N + ((7 ri 1 ô X) o-x + Cd ri 1 d Y) () y .
c
Remembering that a-~ = N c It, 0- ~ = X/t, () ~ = y It (t = count duration) c
and putting W = NA - N -(m y K/D), where D is the decay correction 1"' c 0
to the reference time, one gets finally
(f~ ~ 0 2 ()~. ~ 1 [1 - (Y W/N~r Ne + L + (Y /Ne)Y X + [1 + (W/Ne~ 2 Y !o2/(m2
t) .
For a well-designed experiment (i.e. with a reasonable distribution
of points having comparable statistical accuracies), the computed value
of the slope and intercept wi Il not be sensitive to the cho ice of we ights.
The proper choice of weights may, however, yield significantLy better
estimates for the variances of the parameters and is essential if a meaningful
value of ~X? is required (cf. A.P. Baerg, references 6 and 7 in [27J).
A second iteration using the new values of the parameters to recalculate (j21 r
for each data point is unlikely to be worthwhile because the variance
estimates for the individual points are relatively insensitive to small changes
in the parameters.

18
11. FINAL RESULTS, UNCERTAINTIES
The extrapolation to 100% efficiency N IN leads to an intercept c y
a o with the ordinate y which represents the radioactivity concentration of
the solution considered. The fitting procedure also includes the calculation
of the standard error of the mean. The number of degrees of freedom
(in general the number of data points used minus the number of coefficients
ao' al ' ••• fitted) helps then to define the random uncertainty of the
final result. Eight participants have also taken into account the uncertainty
in x (Table 9); the effect on the final result was always smaller than
one part in 103
•
The final results, as weil as the random and total systematic
uncertainties, are listed in Table 11. A graphical representation is given
in Fig. 4 and a histogramme of the distribution in Fig. 5.
i The various contributions to the estimated systematic uncertainties
are listed in Table 12, where it is also explained how they were obtained.
The way of combining them is not of great importance in the present case,
since one of them is almost always by far the largest. Usually the linear sum
was taken.
The largest contribution to systematic uncertainty is the one which
i$ due to the extrapolation procedure. Most participants put!t equal to
the differ~nce in a o between first- and'1second-order fits. This difference
and the corresponding estimate by the participant are listed separately.
~2. SLOPE-TO-INTERCEPT RATIO
The slope a 1 of the efficiency function near to the intercept
divided by a is an important parameter, since it depends in a simple way o
on the total internaI conversion coefficient of the daughter atom and is,
at least approximate Iy, independe nt of the counting appa ratus. However,

19
the histogramme of Fig. 6 shows a considerably larger spread than that
of Fig. 5. As is evidenced by Fig. 7, the intercept and the slope are
correlated, although not in a very clear way.
The slope-to-intercept ratio a1/a
o is related to the total internai
conversion coefficient 0( according to [30] Ë - p
a 1 / a 0 = ~Y + 0( c + 1 : CI( [E e + (1 - E. e) E X] '
where
€~y is the efficiency of the II~II counter to 166 keV y rays,
E. Il Il Il '}'127 ke V e lectrons, e
E.X
Il Il Il X rays or Auger electrons,
Pc is the probability for registering a coincidence event when the electron
capture event is not registered in the II~II counter.
f It is generally assumed that te is close to unit y and Pc negligible.
Thus
The efficiency E~y is difficult to measure accurately. Merritt and
Taylor [31 J found that it is small and not strongly dependent on the size,
shape or materia 1 of the cathode. From the work of Urquhart [32J or
of Williams and Campion [33] not much information concerning 166 keV
y rars can be gathered. Plch et ~I: [30] estimate, for their Ar/CH4
-filled
pressurized (0.5 MPa) counter, a value of ER =- (0.7 + 0.2)%. On the ""y -
other hand, in the context of the preliminary comparison [5] , PTS estimated,
for CH 4 and atmospheric pressure, Ë~y ~ (5.0 .-:: 1 .5) x 10-4; Taylor [~4J ,-4 1
indicated ER ~ (4 + 1) x 10 • Therefore, ER may be neg ected ""y - ""y
in rnost of the results obtained in this comparison. From Figs. 6 and 7 it can
be seen that the results cluster around a slope-to-intercept ratio of 0.200 5,

20
corresponding to a value of the total internai conversion coefficient of
0( ~ 0.2502 with an uncertainty of not more than 0.002 5. Various
measurements* of this coefficient have been published in the past:
First author Reference 0( --Taylor [34J o . 2508 + O. 00 1 4
Aristov [35J 0.254 + 0.006 -Legrand [36J o . 244 6 + O. 00 1 2
Plch [30J 0.251 + 0.002
Hansen [37J 0.252 + 0.005 (deduced)
present o . 250 2 + O. 002 5
The result suggested by this comparison agrees with most of the previous
measurements, but does not confirm the value by Legrand et al.
13. CONCLUSION
Seventy percent of ail the national and international radionuclide
metrology laboratories which had been asked by the BIPM to participate
accepted to do so. With one exception, ail the results were obtained
by coincidence counting with efficiency extrapolation. Although many
different detector types and coincidence set-ups were used, a general
systematic deviation of the results cannot be excluded completely.
Therefore, no attempt has been mad~ rit" deriving a mean value of the
radioactivity concentration of the solution distributed. Nevertheless,
the fact that the results of twenty-two participants give a total spread
of only 1.1% (compared to 0.6% with five selected participants in 1974
[4J) is very gratifying. It may in addition be interpreted as e~pressing
the ability of the participants to dispense sources correctly.
* Note added in proof: E. Schënfeld and R. Brust report a value of
0< = 0.251 9 + 0.000 6 (lsotopenpraxis~, 311 (1977) ).

21
This intercomparison has shown that the standardization of 139Ce
by conventional coincidence techniques is relatively easYi linear
efficiency extrapolation is often sufficient, although the total systematic
uncertainty seems mostly due to the extrapo lation procedure. As the decay
scheme of 139Cehas much in common with that of 203 Hg , the difficulties
previously encountered in standardizing the latter are not likely to be
due to the measuring method but rather to sorne chemical properties
of mercury çompo.unds. Liquid scintillation counting has been applied
successfully by three participants. However, in each case sorne particular
difficulty (spurious pulses, loss or excess of coincidence events, special
fitting procedure) called for a more elaborate treatment. On the other
hand, proportional counting seems to be much less affected by these
difficulties. Moreover, gas pressure and composition had no incidence
on the quality of the results. Finally, the correlation between the extra
polated activity value and the slope-to-intercept ratio of the efficietncy
function may be due to incomplete knowledge of the various detector
efficiencies or to insufficiently precise counting corrections.
.... '1 '"

AAEC
AECL
AlEA
ASMW
BARC
BCMN
BIPM
ETL
IBJ
IEA
1ER
IMM
IPA
IRK
Table 1
List of the 23 participants
Australian Atomic Energy Commission, Lucas Heights, Australia
Atomic Ènergy of Canada Limited, Chalk River, Canada
Agence Internationale de l'Energie Atomique, Vienna, Austr1a
Amt fUr Standardisierung, Messwesen und WarenprUfung, Berlin, German Democratic Republic
Bhabha Atomic Research Centre, Trombay, India
Bureau Central de Mesures Nucléaires d'Euratom, Geel, Belgium .. ?(
Bureau International des Poids et Mesures, Sèvres, France
Electrotechnical Laboratory, Tokyo, Japan / /
Instytut Badan Jadrowych, Swierk, Poland
Instituto de Energia Atômica, Pinheiros-Sâ'o Paulo, Brazil
Institut d'Electrochimie et de Radiochimie de l'Ecole Polytechnique Fédérale, Lausanne, Switzerland
Institut de Métrologie D.I. Mendéléev, Leningrad, USSR
Institut de Physique Atomique, Bucarest, Romania
Institut fUr Radiumforschung und Kernphysik, Vie~na, Austria
Names of the persons who carried out the measurements
G.e. Lowenthal
J.S. Merritt, F.H. Gibson, J.G.V. Taylor
H. Houtermans, E. Wehrstein
E. Sch~nfeld
S. Nagpal, P.K. Srivastava
1. Goodier, E. Celen, W. Zehner "-l "-l
C. Col as, C 0 Ve y ra die r
O. Yura, Y. Kawada
Po Zelazny
CI. Renner
J • - J. Go ste 1 y
A.A 0 Konstantinov, T.E. Sazonova, S.V. Sepman
L. Grigorescu, M. Sahagia, G. Lates
H. Friedmann, F. Hernegger, G. Winkler

LMRI
NBS
NPL
NPRL
NRC
OMH
PTB
SCK
UVVVR
Table 1 (cont'd)··
Laboratoire de Métrologie des Rayonnements Ionisants, Sac lay, Fra nce
NQtional Bureau of Standards, Washington, D.C., USA
National Physical Laboratory, Teddington, United Kingdom
National Physical Res~arch Laboratory, Pretoria, South Africa
National Research Council of Canada, Ottawa, Canada
o rszagos MérésUgyi H ivata l, Budapest, Hunga ry
Physikalisch-Technische Bundesanstalt, Braunschweig, German Federal Republic
Studiecentrum voor Kernenergie, Mol, Belgiunr / v Ustav pro vyzkum, vYrob:.; a vyu'fitf radioisotopu, Prague, CSSR
Names of the persons who carried out the measurements
J. Bouchard, R 0 Vatin
R • L 0 A y re s, A. T. Hi rs h fe 1 d, D.D. Hoppes, L.M. Cavallo
M. J. Woods, Armstrong, Brown, Lucas, D. Smith, A 0 Parr
J. Steyn, S. M. Botha
G.Co Bowes, A.P. Baerg
A. Szorényi
K.F. Walz
C. Ballaux, P. Willeborts
J. Plch, J. Zderadiéka
~ w

Laboratory
AAEC
AECL
AlEA
ASMW
BIPM
ETL
IBJ
1ER
IPA
Table 3
Results of adsorption tests
Methods 1) or 2a)
agreement within (0.013 ~ 0.090)%
agreeme nt within o. 15%
adsorption ("::d 0.5%) at pycnometer walls, a fte r ;? 6 ho u rs
~ 1st amp.: - (0.22 ~ 0.14) % ~2nd Il : - (0.20 ~ 0,.14) %
agreement with i nO. 10/0
agreeme nt' with i nO. 013%
< 0.000 5% (during dispensing)
Method 2b
adsorption < 0.01 %
adsorption = (O. 00 ~ 0.02)%
+ (0.005 + 0.002) % - (O. 1 03 ~ 0.002) %
(0.33 ~ 0.39) %
~ 0.05%
LMRI check carried out (no result given)
NBS
NPL
NPRL
OMH
SCK
agreement within 0.08%
!lstam p o :+0.11% 2nd Il : - 0.07%
agreement very good
no detectable adsorption
insignificant adsorption
Further checks
Nal detector
II.)
01
ca 1 ibrated Ge (Li) detector: <. 0.000 4%
Nal detector: less than standard error

Laboratory
AAEC
AECL
AlEA
ASMW
BARC
1
Table 4
Source preparation for 4J!(PC)-y and 4 Jt (PPC)-y counting
Source mount Source backing 1. Nature 1. Nature 2. Out.diam. 2. Number of fil~s 3. Inn. Il 3. Il of met.!ayer 4. Thickness 4. Total mass
(mm) (,p-g/cm 2)
1. brass 2. 35 3. 25 4. 0.05
1. AI 2. 38 3. 25 4. 0.5
1. AI 2.31.5 3. 19.5 4. O. 1
1. st Il • ste el Z. 38 3. 16 4. 0.05
1. AI 2. 38 3. 28.5 4. 0.8
1. VYNS, Mylar 2. 1 or 2 3. 1; 2; 4 (Au-Pd) 4. 30 to 2 050
1. VYNS 2. 2 3. 2 (Au-Pd) '<~
4. ç:: 16
1. VYNS 2. 1 3. 2 4. 40
1. VYNS 2. 1 3. 1 (Au-Pd) 4. 3.0
1. VYNS 2. 1 3. 1 4. ~ 35
Wetting or seeding
agent
~ lectrosprayed ion exchange
resi n; Catanac
Catanac SN for some
Teepol + Ludox
Insulin, e x ch. re sin,
H2O, NH3 in H20
Teflon suspension
1. Numbe r of sources
2. Range of source mass
(mg)
1. 10 2. 22 to 55
1. 16 + 15 2. 16 to 53
Range of
N IN c y
(%)
16 to 59
Method used for varying
N IN c y
a) thickness of backing b) counting gas c} anode voltage
8 to 57 1 Sources prepared by prec ipitation (N H3) and with or without wetting agent
1.20 wei g hed,!23 to 41 1 0 el. pla te d 9 to 79
a) di sso 1 v. 0 f el. pl. sources in HC 1
2. 9 to 20
1. 10 2. 11 to 33
1. 30 2. lOto 00
8 to 55
7 to 29
b) add wett. agent and carrier, for some
Superposition of goldcoated VYNS films see [38J
B y ad d i n 9 so 1 id to the source
Ba lance {s} used 1. Type 2. Yearof purchase 3. Date of last
ca 1 i bra tion 4. Linearity check
1. Mettler M5, H16 2. 1963, 1962 3. Feb. 1976 4. ye s, ~ 3 l-1' 9
1. 2 Mettler M5 2. 1958, 1971 3. Apr. 1976 for one 4. yes
1. Mettler ME22 2. 1976 3. Feb. 1976 4. -
1. Sartorius 2405 2. 1975 3. Apr. 1976 4. yes
1. Mettler M5 2. 1962 3. -4. yes

Table 4 (cont'd)
labora- Source mount Source bac king Wetting 1. Number of Range Method used Balance(s) used
tory 1. Nature 1. Nature or seeding sources of for varying 1. Type
2.0ut.diam. 2. N u m be r 0 f fi 1 ms agent 2. Range of N IN N IN 2. Year of purchase
3. (nn. " 3. " of met.layers source mass c y c y 3. Date of last
4. Thickness 4. Total mass calibration
(mm) (~g/cm2) (mg) (%) 4. Li nea rit y check
BCMN 1. steel 1." VYNS Catanac 1. 8 10 to 40 a) wetting agent 1. Meuler M5
2. 34 2. 1 2. 15 b) VYNS 2. 1971
3. 16 3.2 (Au) c) AI "' 3. 1972
4. O. 1 4. 50 4. -
BIPM 1. st'I.steel 1. VYNS ludox SM 1. 20 + 15 15 to 47 Superposition of gold 1. Meuler M5
2. 40 2. 1 . ~. 10-4 2. 13 to 184 plated VYNS films 2. 1961
3. 16 3. 1 or 2 (Au) 3. Mar. 1976
4. O. 1 4. 20 to 400 4. yes t-.)
'.1
ETl 1. brass, Il. VYNS 1 ludox SM 1. 20 114 to 48 1 a) counting gas 1. Mettler M5
Au coated 2. 30 2. 1 2. 8 to 20 b) gold-coated VYNS 2. 1976
3. 16 3. 2 (Au) c) anode voltage 3. Feb. 1976
4. 0.3 4. 30 4. yes
IEA 1 1. st'I.steel . 1. VYNS ludox 1. 50 14 to 44 Superposition of 1. Meuler M5 SA
2.40 2. 1 2.30t040 absorber films 2. 1967
3. 20 3. 1 3. Feb. 1976
4. O. 1 4. :.::1 35 4. yes -1ER 1. st'I.steel 1. VYNS ludox SM 1. 62 14 to 45 Superposition of one 1. Mettler M5 SA
2.40 2. 1 10-4 2. 13 to 86 gold-coated film on 2. 1964
3. 16 or 20 3. 2 se lected sources 3. Mar. 1976
4. O. 1 4. 50 4. yes

Table 4 (cont'd)
Labora- Source mount Source backing Wetting 1. Number of Range· Method used Balance(s) used
tory 1. Nature 1. Nature or seeding sources of for varying 10 Type 2.0ut.diam. 2. N u m be r 0 f fi 1 ms agent 2. Range of N /N N IN 2. Year of purchase
3. 1 nn. Il 3. Il of met.layers source mass c y C y 3. Date of last
4. Thickness 4. Total mass ca 1 ibration (mm) (p.-g/cm2) (mg) (%) 4. L inearity check
IMM 1. AI 1 • X -ray film Agfa Insulin 1. 5 18 to 40 Discrimination 1. CMD-l000
2. 40 2. 2 + Ludox 2.40t080 2. 1971
3. 22 3. 2 (Au) 3. Oct. 1975
4. O. 1 4. 30 to 40 4. -
IPA 1. AI 1. VYNS Ludox 1. 15 5 to 29 fo il absorption 1. Mettler M5
2. 30 2. 1 2. 28 to 49 2. 1975
3. 16 3. 2 3. 1976
4. O. 1 4. 50 to 150 .?( 4. yes
N co
LMRI 1. AI 1. ceHulose Insulin 1. 25 24 to 52 anode voltage 1. Mettler ME22
2. 38 2. 1 2. 15 to 25 + se 1 f a bsorpti on 2. 1975
3. 22 3. 2 3. -4. 3 4. 100 to 160 4. yes
NBS 1. AI 1. non-flexible 4 1. 26 14 to 74 sandwich with 1 1. Mettler M5 Ludox SM 10
collodion sorne sources 2. 16 to 48 13 to 60 25 lJ;g/cm2 absorbers; 2. 38 2. 2 dded in H2 S dilution(D F%5) discrimi nation 2. 1963/4 3. 17 3. 1 atmosphere for sources used 3. 1975
4. 0.04 4. 20 to 30 in 4n (PPC)-y 4. yes
NPL 1. AI 1. VYNS Johnsons 1.10+10 14 to 37 addition of ca rrie r 1. Mettler M5
2. 38 2. 1 W.A. 0.03% 2. 28 to-49 2. 1964
3. 25 3. 2 (Au) 3. 1976 4. 0.5 4. 50 4. yes

Table 4 (cont'd)
Labora- 1 Source mount Source backing Wetting 1. Number of Range Method used Ba lance (5) used tory 1. Nature 1. Nature or seeding sources of for varying 1. Type
2. Out.diam 2. Nu m be r 0 f fi 1 ms agent 2. Range of N IN N IN 2. Year of purchase 3. Inn. Il 3. Il of met.layers source mass
c y c y 3. Date of last
4. Thickness 4. Total mass ca 1 ibration (mm) (p.-g/cm2) (mg) (%) 4. Linearity check
,
NRC Il. AI 1 •. VYNS Catanac SN 1.10+10 9 t050 pulse height 1. Mettler M5 2. 38 2. 1 2. 20 to 25 discrimination 20 1965 3. 25 3. 2 3. Feb. 1976 4. 0.8 4. ~ 40 4. yes
OMH 1 1. Al 1. VYNS-3 Teepol 1. 24 15 to 51 sandwich with gold- 1. Mettler M5 SA 2. 38 2. 1 + Ludox SM 2. lOto 46 coated absorber films 2. 1968 3. 16 3. 1 (Au)
.~ 30 1971
4. 0.3 4. 20 4. yes "-> -0
PTB Il. AI 1. VYNS Ludox 1. 15 4 to 23 addition of carrier 1. Mettler M5 2. 40 2. 1 2.17to19 and of conductive 2. 1966 3. 15 3. 2 (Au-Pd) VYNS films 3. Feb. 1976 4. O. 1 4. 45 4. yes
SCK Il. AI 1. VYNS Tween 20 1. 28 11 to 32 sources with different 1. Mettler ME22 2. 50 2. 2 for so.me 2. 4.5 to 20 16 to 36 amounts of carrier 2. 1976 3. 10 3. no metal layer sources 3. Apr. 1976 4. 0.06 4. 10 4. yes
UVVVR 1 1. AI Il. VYNS Insulin 1 • 20 12 to 48 va riation 0 f 1. Sartorius 1801 2. 30 12. 1 + Ludox 2. 19 to-25 discrimination level 2. 1972 3. 18 j3. - 3. Jan. 1976 4. 0.15 4. -;::: 40 4. no

Labora -tory
IBJ
NPL
NPRL
Composition of the 1 iquid sc intillator
3 4 g/dm PPO + 0 0 8 g/dm3 bis MSB
1 Unisolve 1 (Koch Light Ltd.) 6 cm3
+ saturated Pb(N 03)2 ~
solution 0.65 cm3
1 Xylene-based scintillator "Instagel" (Pac ka rd -Co rp.)
Table 5
Source preparation for 4J!(LS)-y counting
Intermediate solvent
Toluen + Triton
x - 100 2: 1
1. Volume of scint.vessel
(cm3) 2. Checkofadsorp.
or pre c i p ita tion
1. 22 2 -
1. 10 2. yes
~0.2%
1. 20 2. yes
Range of
source mass (mg)
19 to 28 32 to 66
15 to 30
32 to 59
Method used for va ryi ng
N IN c y
variation of hi 9 h vo 1 ta ge in ~ channel
com[uter see 12J
pu Ise he ight se lection
Balance used 1 0 Type 2. Year of purchase 3. Date of last ca 1 ibration 4. Linearity check
1. Sartorius 1801 2. 1968 3. Ja no 1976 4. no
1. Mettler M5 2. 1964
w 0
3. 1976 4. yes
1. Mettler ME22 2. 1975 3. -4. yes
correction :+ 20 fLg

Laboratory
IBJ
NPL
NPRL
N umber of phototubes for viewing
the counting ce Il
2 in coincidence [39]
one
two, in coincidence
Table 6
Equipment for 41r(LS)-y counting
1. Material of counting cell 2. Type of photomultipJie,r
1. low potassium glass 2. EMI 9634 QR
-\
1. glass 2. ReA 31000D
1 .g lass 2. E M 1 9635 Q B
1. Precautions taken against counting of spurious pu Ises
2. Upper limit of Spa pulses
1. -2. -
1. corre lation counting 2. 0.1%
1. separate determination 2. (O! 0.1) %
Gamma-ray counter 1. Number of Nal(T1)crystals 2. D iameter (mm) 3. He ight (mm)
1. one 2. 45 3. 50
1 • one (we II-type) 2. 100 3. 100
1. one 2. 76 30 76
(,.)

Laboratory Wall
material Height
of eac h ha 1 f
(mm) ,
Table 7
Equipment for 4TI(PC)-y and 4TC(PPC)-y counting
4 pi proportional
A no de 1. Nature 2. W i re dia m. (j-l-m ) 3. Il length (mm)
counter
Ga s 4. Distance from 1. Nature*
the source (mm) 2. Discr. leve 1 (e V) 5. Voltage (kV) 3. Pressure (kPa)
Gamma-ray counter
1. Number of Nal(T1) crystals
2. Diameter (mm) 3. Height (mm)
AAEC 1 AI 27 1. Pt 3. 48 5.2.750 to 2.900 Il. CH4 2.300 1 1. 1 2. 76 3. 25 2. 50 4. 25 1. 750 to 1. 925 Ar/C H4 3. atm.
AECL 1 stainless
1
21 Il. stll. steel 3. 36 5. 2.4 Il. C H4 3. atm.1 1. 2 2. 76 3. 76 stee 1 2. 15 4. 10 2. ~ 100 2 independent sets of electronics following the linear stages; circuitry to set and continuously monitor
interchannel delays; 36-sample automatic changer [41J -,
AlEA 1 stainless 12 11. W ' 3. 35 5. 1.9 to 2. 1 Il.CH4 3.atm.IL 1 2. 76 3. 76 steel 2. 25 4. 8 2. 170 or 700
ASMW 1 brass (+ AI) 20 1. Mo{Au-coated) 3. 55 5. 3.9 1 • C3 H8 3. atm.ll. 2 2. 102 3. 76 i [40J 2. 40 4. 10 2. 250
BARC 1 AI 26 1. stll. steel 3. 38 5. 1.5 1. Ar/CH4 3. atm.1 1. 1 2. 76 3. 76 2. 13 4. 13 12. 200
i 1
BCMN [ plexiglas 14 1. steel 3. 75.5 5. 2. 1 Il • Ar/C H4 3. atm.1 1. 2 2. 76 3. 51 +AI 2. 50 4. 10 2. -
i i
1 BIPM 1 brass 20 1. stll. steel 3. 47 5. 2.3 Il. Ar/CH 4 3. atm.ll. 1 2. 76 3. 51
i Au-plated 2. 50 4. 11 -- [20J 2. ~75
* Ar/CH4
stands for 90% Ar + 10% CH4

Table 7 (contld)
Labora-, 4 pi proportiona 1 counter Gamma-ray counter tory Wall He ight A nod e Gas 1. Number of Nal(Tl)
material of 1. Nature 4. Distance from 1. Nature * crystals each half 2. Wire diam. (\-Vm) the source (mm) 2. Discr. level (eV) 2. Diameter (mm)
(mm) 3. Il length (mm) 5. Voltage (kV) 3. Pressure (kPa) 3. Height (mm)
, ETL 1 brass 20 1. stll. steel 3. 80 5. 2.3 1. Ar/C H4 2. 200 1. 2 2.76 3. 76
Au-coated 2. 50 4. 10 3.6 CH4 3. atm.
IEA 1 brass 22.5 Il. stll. steel 3. 120 5. 1.6 1. Ar/CH4 3. atm. Il. 2 2. 76 3. 76 2. 20 4. 13 2. 50
1ER lAI 25 Il . Au 3. 34 5. 3.5 to 3.6 1 1. C H4 3. atm. Il. 1 2. 76 3. 76 2. 100 4. 12.5 2. ~ 1 000
IMM 1 brass 30 1 .,
3. 50 5. ~ 2 Il. Ar/CH4 3. atm. Il. 1 2. 40 3. 30 , 1 • COll s ta n ta n 2. 30 4. 15 12. 200
1
IPA 1 brass 24 1.W 3. 40 5. 3.2 1. CH 4 3. atm. Il. 2. 76 3. 76
1 perspex
2. 20 4. 11 2. 1 000
LMRI 22 1. W + Au 3. 80 5. 1.8 Il. Ar/CH 4 3. atm. Il. 1, with Be window 2. 20 4. 10 12 • ~ 1 00 1 l' 48. 5 x 0.24 mm
1 ! 2.44 3.3 1
i !
1. stll.steel 3. 38. 1 5. 2.05 1
NBS 1 stainless 27 Il. Ar/CH 4 3. atm. steel 2. 25.4 4. 18.4 /2. 750 Il. 2, 18000pposed
AI-6061 28.3 : 1. st Il. ste el 3. ~ 53 5. 8.0 2. 76 3. 76 Il. Ar/C H4 3. 1 430
2. 51 4. 14 2. 1 000 to 20 000
* Ar/CH4
stands for 90% Ar + 10% CH 4

Labora -tory
NPL
NRC
OMH
PTB
SCK
Wall material
Cu and perspex (Ag-coated)
He i ght of
each ha If {mm}
14
Table 7 (cont'd)
4 pi proportiona 1 counter
A no d e 1. Nature 4. Distance from 2. W i re dia m. ((J-' m) the source (mm) 3. Il. le ngth (mm) 5. Voltage {kV}
1. P-bronze 3. 75 5. 2. 1 2. 76 4. 8
AI 25 Il. st'I. steel 3.38 5. ;::::; 4.8 2.25 4. 12.7
2 independent coincidence counting systems used alternatively [25, 42J i live-timed anti-coincidence counting system [24J
plexiglas Au-coated
AI
Iperspex Au-coated
stainless stee 1
24 1.W 2. 11 .. ~
22.5 Il. st'I. steel 2. 50
3. 45 5. 1.55 4. 12
3. 30 5. 3.7 4. 12
17 Il. Ni, 5 wires per half-counter 2. 50 3. 50-64 4. 9 5. 2.0
50 )1. Ni 3. 50 5. 5.7 2. 50 4. 25
UVVVR Istainless 96 )1. Mo {Au-coated} 3. 140 5. 4.05 stee 1 diameter 2. 50 4. 24
* Ar/CH4
stands for 90% Ar + 10% CH4
Gamma-ray counter
Gas 1. Number of Nal(TI) 1. Nature* crysta Is 2. Discr. level (eV) 12. Diameter (mm) 3. Pressure {kPa} 3. Height {mm}
1. Ar/CH 4 3. atm. ~1. 2 2. 102 3. 76 2. 300
1. Ar/C H4 3. 1 584! 1. 2 2. 76 -3. 76 2. 600 to 6 000
1. Ar/CH 4 3. atm. [1. 2.76 3. 76 2. 180
1. C H4 3. atm. Il. 2. 76 3. 76 2. 500
Il. Ar/CH 4 3. atm. 2. ~ 40 Il. 1 2. 76 3. 76
1. Ar/CH 4 3.540 2. -
1. Ar/CH 4 3.~500 1. 2 2. 76 2. 200 [43J
3 n 51

Table 8
Dead times and coincidence resolving times (in parenthesis: uncertainty in units of last decimal)
Labora-I Dead times Method Reso Iving Method 1 Remarks and references
tory 't~ (p-s) 1 "Cy ~ ~s) of time** of measurement* 1: r ( lJ.-s) measurement*
AAEC 9.00 , (5) 20.0 (2) DP 1 • 175 (1) RC (TS, Sp)
AECL 2.049 (6) 2.043 (6) SP 0.643 0 (3) SP checked with calibrated
2.020 (6) 21. 016 (6) 0.664 5 (3) osci Iloscope
AlEA 4.087 (12 ) 4.085 ( 12) Ta 0.950 7 (42) Ta [44J
ASMW 4.008 ( 18) 4.000 ( 18) 1 DP, Ta, TS 1 1. 046 (6) RC [45J .'t ~ , T Y checked before and after each counting
.. ~
RC (137Cs) proce ss
BARC 10 (1) 10 (1) TS 1.8 (2) w tn
BCMN ~7 -x7 Ta 0.99 (1) Ta [46J
BIPM 4.43 (1) 4.48 (1 ) Ta 1.05 (1) Ta
ETL 4.35 (5) 2. Il (5) DP 0.688 7 (28) RC I~ source, y pulser
IBJ 7.500 (25) 7.800 \25) DP 0.270 (10) DP ca 1 ibrated by
7.820 (25) synchronoscope
IEA 3.01 (2) 3.01 (2) SP, Ta 1.04 (1) RC [47J
Abbreviations: DP = double-pulse generator, RC = ranaom coincidences, SP = source-pulser method ,
Ta = two-osci Ilator method, TS = two-source method
* For general information on recent measuring methods see a) fo r S P: [47, 49 J ' b) for Ta: [50,51, 52J
** 7: = 1 (e + e ) r ! ~ y'
see p. 12

Table 8 (cont'd)
labora- Dea d t i mes Method Resolving Method IRemarks and references
tory '"C~ (tt-s) 1 ~ y (p.-s) of time** of measureme nt* ""'(,r (~) measurement*
1ER 2.201 (1) 2. 196 (1) TO 0.775 (2) TO [ 48J
IMM 1.36 (2) 1.36 (2) SP 1.475 (10) TS, TO 2.080 (10)
IPA 10.0 (5) 10.0 (5) TS 1.095 (5) RC
lMRI 5.200 (25) 5.200 (25) 0.973 (2) SP variable delays
NBS 5. 12 (49) 5.24 (20) SP 0.47 (2) SP 4Jï (PC)-y set with calibr. oscilloscope
20.0 (12) 120.0 (12) SP 0.60 (5) SP 4'ii (PPC)-y
NPl 1.527 (5) 1 3 .O~ (5) 't~:DP 0.716 (5) TO 411 (PC)-y oscilloscope
24.6 (1) 1 1.96 (5) T : DP 0.25 (1) 4Jï (lS)-y
t : add to real y spectrum, at pream~lifier, pu 1 se w i d t h sin to y pulses of correct size, observe fraction lost AND gate
8.00 (1 ) 6.01 (2) 2.95 (5) 4nS i(li)-y using time interval averager
NPRl 1.25 (2) 1 3.23 (1) TS 0.502 (3) RC th re e uni ts i n pa ra Il e 1 0.510 (3) 0.510 (3)
Abbreviations: DP = double-pulse generator, TO = two-osc i lIator method,
RC = random co incidences, TS = tWQ-source method
SP = source-pulser method,
* For general information on recent measuring methods see a) for SP: [47, 49J '
** Tr =~ (e~+ ~ly), see p. 12
b) for TO: [50, 51, 52J
CI.) 0-.

labora -tory
NRC
OMH
PTB
SCK
UVVVR
Table 8 (cont'd)
Dead
"C~ (~s)
2.03 2. 12 5.4
(2) (2)
(:~ 1)
4.99 (10)
2.98
15.0
(3)
(5)
t i mes 1: (t-Ls) y
2.04 2,.10 2.07
(2) (2) (2)
4.93 (10)
3.00
2.2
(3)
(1 )
Method of
measurement*
SP SP DP
TO
TO
1161 ml
6 • 5 7 (S) 1 4. 12 . (5) t [ 43 ] stùdy of time-interval~istribution
Resol ving ti me * * -rr (p-s)
0.982 0.976
1 .032
2.87
2.0
1.980
(1) (1)
( 15)
(3)
(1)
(8)
Method of
measurement*
SP SP
TO
TO
Nc/Ny vs. delay
TS
Remarks and references
system 1 system 2 anticoincidence
4n(PC)-y,4Jt(PPC)-y
Abbreviations: DP = double-pulse generator, TO = two-osc illator method,
RC = random coincidences, TS = two-source method
SP = source-pulser method,
* For general information on recent measuring methods see -a) for SP: [47, 49J '
* * L r =} (9 ~ + 9 y)' se e p. 12
b) for TO: [50,51,52]
w '1

Labora-tory
AAEC 1
AECL
AlEA
ASMW
BARC
BCMN
BIPM
ETL
IBJ
Table 9
Coincidence counting data
y channel Background rates Number Number of Mean time Correction Time of the
(s - 1) of sources data points for one for measurements
(keV) measured used in data point Gandy with 1 without slope det. e ffect from to
from to ~ y c va riation of N IN (s) (%)
, c y
161 171 1.2 0.24 0.001 4 6 15 11000 0 Apr. 8 Apr.30 o 1.8 see [53J
~125 200 0.3 2.0 0.006 16 - 210 1 000 o to 0.080 Apr. 5 Apr. 9 120 200 0.3 2.0 0.006 15 - 180 860 o to 0.005 Apr.26 Apr.29
60 240 1 9 0.05 10 20 62 2 000 0 Mar.20 May 15
, ., 100 200 1.9 7.6 0.008 9 - 24 2 000 0 Apr.19 Apr.23
- - 10.5 1.7 0.002 4 29 58 4 000 - Mar. 5 May 26 see [54J
- - 0.4 4 0.01 8 - 64 1 000 - Mar. Mar.
140 190 0.5 1.4 0.007 6 4 27 3 000 0 Mar.24 Mar.30
130 200 0.8 3.6 0.001 2 lU 10 39 1 500 0 Mar.14 Mar.23
* 65 00 3.7 9.7 0.35 10 - 12 600 0 Mar.15 Mar.16 95 235 3.8 4.8 0.07 6 - 9 300 0 Jun.30 Jul. 2
*l?t:i ?1t:i 1_A 1_R O_OA 9 - , 9 - 300 0 ,Jun .29 Jun.30
* The results obtained with these y-channel settings were found to be low and high, respectively, by about 2%, due to incorrect coincidence count rates. They were therefore discarded.
U nce rta i nt y in 1 - N IN c y
N IN c y accounted for? % change ina
0
yes 0.003 3
no no
no
yes 0.045
no
-no
-no no no
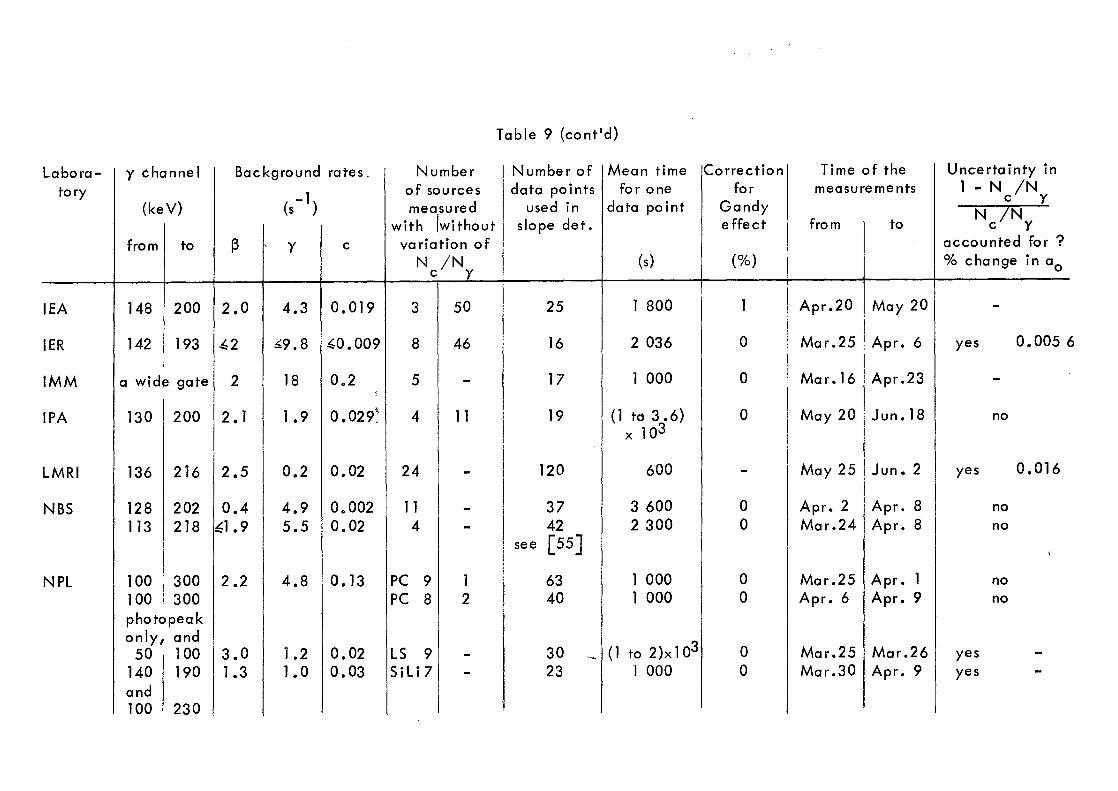
Table 9 (cont'd)
Labora - y èhannel Background rates. Number Number of Mean time Correction lime of the Uncertainty in
tory (s - 1 )
of sources data points for one for measurements 1 - N IN (keV) measured used in data point Gandy
c y N IN
with Iwi thout slope det. e ffect from to c y from to ~ >, y c va riation of accounted for?
N IN (s) (%) % change in a o c y
IEA 148 200 2.0 4.3 0.019 3 50 25 1 800 1 Apr.20 May 20 -1ER 142 193 ~2 ~9.8 ~0.009 8 46 16 2 036 0 Mar.25 Apr. 6 yes 0.005 6
1
J
IMM a wide gate 2 18 0.2 5 - 17 1 000 0 Mar.16 Apr.23 -IPA 130 200 2. 1 1.9 o .029~ 4 1 1 19 (1 td 3.6) 0 May 20 Jun.18 no
x 103
LMRI 136 216 2.5 0.2 0.02 24 - 120 600 - May 25 . Jun. 2 yes 0.016
NBS 128 202 0.4 4.9 0.002 1 1 - 37 3 600 0 Apr. 2 Apr. 8 no 113 218 ~1.9 5.5 0.02 4 - 42 2 300 0 Mar.24 Apr. 8 no
see [55J ;
NPL 100 300 2.2 4.8 O. 13 PC 9 1 63 1 000 0 Mar.25 Apr. 1 no 100 300 PC 8 2 40 1 000 0 Apr. 6 Apr. 9 no photopeak only 1 and
50 100 3.0 1.2 0.02 LS 9 - (1 to 2)x 103 30 - 0 Mar.25 Mar.26 yes -140 190 1.3 1.0 0.03 SiLi 7 - 23 1 000 0 Mar.30 Apr. 9 yes -and 100 230

Labora- y channe 1 Background rates Number tory
(s - 1 ) of sources
(keV) measured with 1 without
from to ~ y c va riation 0 f N IN c y
NPRL photopea k f8 3.4 - 16 -NRC 130 200 0.8 1.7 0.004 10 -
10 -130 200 0.5 1.6 0.005 10 -130 200 0.5 1.6 1.6 AC10 -
OMH 140 193 2. 1 5. 1 0.01 3 24
PTB 130 CX) 0.5 16 0.2 .. ~ 8 7 ,
SCK 140 210 36 1.4 0.05 PC - 25 12 11 0.056 PPC- 20
UVVVR 90 230 19 7. 1 0.09 2 19 1
Table 9 (cont'd)
Number of Mean time Correction data points for one for
used in data point Gandy slope det. effect
(s) (%)
15 800 0
15 500 0 15 500 0 15 500 0 15 ~530 0
9 2 000 0
53 4000 + 0.01
25 400 0 18 800 0
20 1 000 0
Time 0 f the measureme nts
from to
Mar.18 Mar.23
Mar.15 Mar.20 Mar.22 Mar.27 Mar.15 Mar.20 Mar.20 Mar.27
May 25 May 28
May 3 May 15
Apr.16 Apr .30 Apr.17 Apr .22
Apr. 4 Apr.15
Uncertainty in 1 - N IN c y
N IN c y accounted for? % change in a
yes 0.01
yes <0.1
no
no
no no
no
0
.f:>.. o

41
Table 10
Results of the X2 tests for the efficiency functions
(» is the number of degrees of freedom)
Laboratory
AECL
B'PM
1ER
IMM
IPA
LMRI
NPL
NPRL
NRC
Counting method
41T(PC)-y
"
Il
Il
Il
Il
4TT (PC)-y
~ 4n (LS)-y ~ 417 $ i (Li) -y
4 'tT (LS )-y
14Tr(PPC)-y coinc.
Il anticoinc.
~. ".
x2 Iv ~ 1.8 ~ 1. 8
~ 0.71 ~ 1.02
0.95
1.2
0.6
~ 1.27 ~ o. 19
1.2 -- 2.9 1.5 -- 5.0
0.85
0.97 1. 13

Table 11
Final results and uncertainties
Labora- Method used* Ampoule S lope -to-intercept Radioactive Sta nda rd e rror tory numbers ratio concentration of the mean
. (and uncertainty) 1976-03-15 o h UT .
(Bq' mg- 1) (Bq·mg- 1) (%)
,
AAEC 47T(PC)-y 2 42 O. 199 18 (18) 710.24 0.82 O. 12
AECL 4lT(PC)-y 11 0.200 32 (4) 710.55 1 0.09 0.013 49 1 0.200 39 (7) 710.46 1 0.12 0.017
1
72 1 O. 198 72
1
AlEA 41r(PC)-y 33 (25) 711.59 0.33 0.05
1
ASMW 4ïT(PC )-y 13 51 9.201 64 (7) 711. 1 0.7 0.1
.~
BARC 4 Tf (PC)-y 18 56 O. 197 0 (4) 712.2 1.1 O. 15
BCMN 4ï1(PC)-y 7 46 0.201 4 (6) 709.98 0.21 0.03
BIPM 4ïï(PC)-y 15 0.203 3 (6) 710.48 1.35 0.19 1 53 0.202 9 (2) 711 .08 0.52 0.07
1
ETL 4Tr(PC)-y 19 57 1 0.201 4 (6) 710.37 0.96 O. 14 1
IBJ 4 Tr(LS)-y 22 60 0.1918 (24) 712.6 2.5 0.35
IEA 47\ (PC)-y 8 47 0.206 7 (7) 708.5 0.3 0.04
1ER 4ïT (PC)-y 27 6510.20036 (16) 70-9.86 0.08 0.012 1
Number Total of degrees un of freedom (see a
(Bq· m~
13 1.7
208 0.3 178 0.6
- 0.7
9 1.9
56 3.8
>10
1
4.6
25 8.3 1
31 ! 4.0 1
37 ,
3.4 i 1 ,
5 i 5.0 1
!
44 i 1.5 1 1
1
45 1 2. 1
systematic ce rta inty so Table 12)
-1 )
8
4 1
2
5
8
3
(%)
0025
0·0048 0.086
0.1
0.262
0053
0.65
1.17 0.57
0.49
0.70
0.21
0.3
.Jlo.. ~

Table 11 (cont1d)
Labora- Method used* Ampoule S lope -to -intercept Radioactive tory numbe rs . ratio conce ntration
(and uncertainty) 1976-03-15 o h UT
(Bq.mg- 1)
IMM 4ïi (PC)-y 30 67 O. 189 4 (6) 710.47
X K(Nal)-y - 709.01 2ITXL(PC)-y - 708.05
IPA 4 Ti (PC)-y 23 61 0.198 72 (53) 714.47
IRK 4ïï(Nal)y 3 43 . - 715.0 .~
LMRI 4 iï (PC)-y 14 52 (').204 5 (40) 708.4
NBS 4 Tf (PPC)-y 28 0.202 8 (1) 713.73 4Ti (PC)-y 66 O. 198 0 (2) 712.86
NPL 4 n(PC)-y 16 0.200 4 (7) 710. 1 4 iï(PC)-y 54 0.200 2 (3) 711.6 4ïi (LS)-y 16 - 711.45 4 ilS i (Li)':'y 16 - 709.58
NPRL 4 iï (LS)-y 24 62 (0.248 3) (5) (719.8) 0.245 1 710.4
NRC 4 jT (PPC )-y 1 48 0.203 0 (4) 71T .... 9 4'iï (PPC )-y 1 9 0.202 9 (4) 711 .7 4 iï (PPC )-y 2 48 0.203 9 (3) 711.4 4lî (PPC )-y AC 48 0.202 9 (3) 711.5
Standard error Number of the mean of degrees
of freedom
(Bq·mg- 1) (%)
0.71 O. 1 3
0.35 0.05 12 0.35 0.05 12
0.27 0.038 17
0.4 0.06 7
0.9 O. 13 117
O. 16 0.02 41 0.26 0.04
1
36
0.9 0.13 1
62 0.4 0.06 38 0.65 O. 1 18 2.31 0.32 6
0.4 0.06 15
i 0.2 0.03
1 9
0.2 0.03 1
9 0.2 ,0.03 9 0.2 0.03
1 9
Tota 1 systematic uncertainty
(see a Iso Table 12)
(Bq·mg- 1) (%)
\+ 0.78 + 0.11 (- 1. 07 - 0.15
4.96 0.7 5.67 0.8
2.63 0.368
4.0 0.56
0.7 0.092
3.07 0.43 3.42 0.48
3. 1 0.43 3.5 0.49
11.4 1.6 9.3 1.3
(1.1) ! (O. 15) 1 , 3.5 1 0.5
i ~ 1 .3 1 (0.18 ( 1.3 1 .(0.18 <1.3 1 <0.18 < 1.0 <0.14
~ w

labora-tory
OMH
PTB
UVVVR
Table 11 (cont1d)
Method used* Ampoule S lope -to-inte rcept numbers ratio
(and uncertainty)
4Ti (PC)-y 17 55 O. 199 7
4ÎÎ (PC)-y 4 44 0.200 04
4TT (PPC )-y 1
12 50 10.200
* PC : proportiona 1 counter PPC : pressurized proportiqna 1 counter lS : liquid scintillator AC : anti-coincidence
(45)
(3)
(2)
Radioacti ve conce ntration 1976-03-15
o h UT (Bq.mg- l )
710.7
710.42
1 715.85
the hyphen indicates the use of a coincidence technique
Standard error Number of the mean of degrees
of freedom
(Bq·mg- l ) (%)
1
1
0.4 0.05 17
1 0.24 0.05 51
1
1 0.24 0. 04 1 18
1
Total systematic uncerta inty
(see a Iso Table 12)
(Bq.mg- l )
5.2
1.1
5.37 1
(%)
0.73
0 0 15
0~75
.jla..
.jla..
Laboratory
AAEC
AECL
AlEA
ASMW
BARC
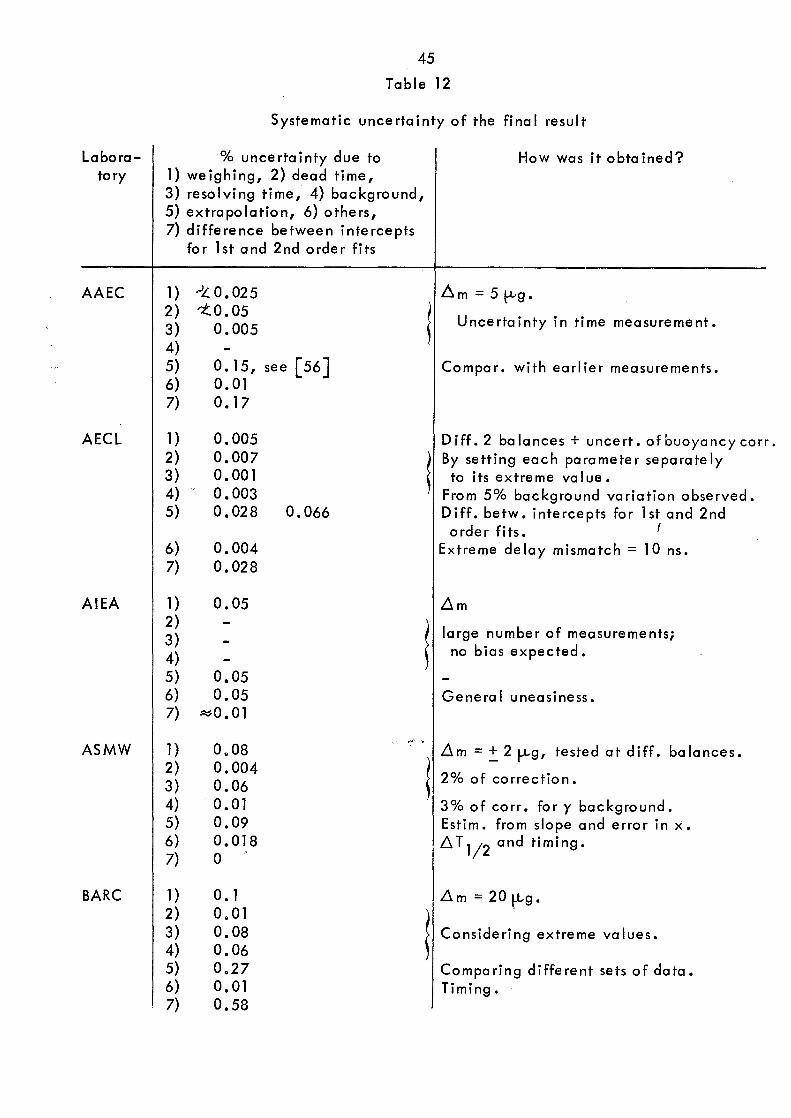
45
Table 12
Systematic uncertainty of the final result
% uncertainty due to 1) weighing, 2) dead time, 3) resolving time, 4) background, 5) extrapolation, 6) others, 7) difference between intercepts
for lst and 2nd order fits
1) rlLO.025 2) -:t0.05 3) 0.005 4) 5) 6) 7)
0.15, see [56J 0.01
1 ) 2) 3) 4) 5)
6) 7)
O. 17
0.005 0.007 0.001 0.003 0.028
0.004 0.028
1) 0.05 2) 3) 4) 5) 0.05 6) 0.05 7) ~O. 01
1) 0.08 2) 0.004 3) 0.06 4) 0.01 5) 0.09 6) 0.018 7) 0'
1) O. 1 2) 0.01 3) 0.08 4) 0.06 5) 0.27 6) 0.01 7) 0.58
0.066
kf" -.
How was it obtained?
~ m = 5 p.-g.
1 Uncertainty in lime measurement.
Compar. with earlier measurements.
D i ff. 2 ba 1 a n ces + un c e rt. 0 f bu 0 yan c y cor r • l By setting each parameter separately ~ to its extreme va 1 ue.
From 5% background variation observed. Diff. betw. intercepts for lst and 2nd o rde r fi ts. f
Extreme delay mismatch = 10 ns.
Llm
~ large number of measurementsi ~ no bias expected.
1
Genera 1 uneasiness.
~m =::. 2 ...,..,g, tested at diff. balances.
2% of correction.
3% of corr. for y background. Estim. from slope and error in x. 6 T 1/2 and timing.
Llm=20\-Lg. l Cansidering extreme values.
Comparing different sets of data. Timing.

46
Table 12 (cont Id)
labora - % uncerta inty due to tory 1) we ighing, 2) dead ti me,
BCMN
BIPM
ETl
IBJ
IEA
3) resolving time, 4) background, 5) extrapolation, 6) others, 7) di ffe re nce be twee n i nte rce pts
for 1 st and 2nd order fits
1) 0.05 2) O. 1 3) O. 1 4) 5) 0.4 6)
l 7) 0.55 for 4 sources out of 8.
1) 0.02 2) 0.006 3) O. 15 4) 0.001 5) 0.69 6) 7) 0.69
1 ) 0.05 2) 0.04 3) 0.015 4) 0.003 5) 0.3 6) 0.05 7) 0.3
1) L 0.088 2) <0.002 3) L 0.087 4) <0.,01 5) 6) ,(0.000 1 7) 0.69
1 ) 0.04 2) 0.001 3) 0.01 4) 0.015 5) 6) 7) 0.59
How was it obtained?
see [46 J.
see [57] .
~m=10~. 611' • N c 1 (1 - 1:' N c) • ( Ar /T r) • (N a c c IN 7) . (fy·N o)-1.(By/t)12. Diff. 1 st and 2nd order fits.
.6.m=lOf.L9. 2.6T~·N~max· 3 ~-cr· N~ Ny/N c . ÂBy/Ny .
Diff. lst and 2nd order fits. De lay va riation.
..6. m/m
.6.t:' N' It. (Âcr/t) (N~ + N~ - (2 N~ N~/Nc». ~~IN'.
Timing.
(States a total syst. uncertainty of 0.21%.)
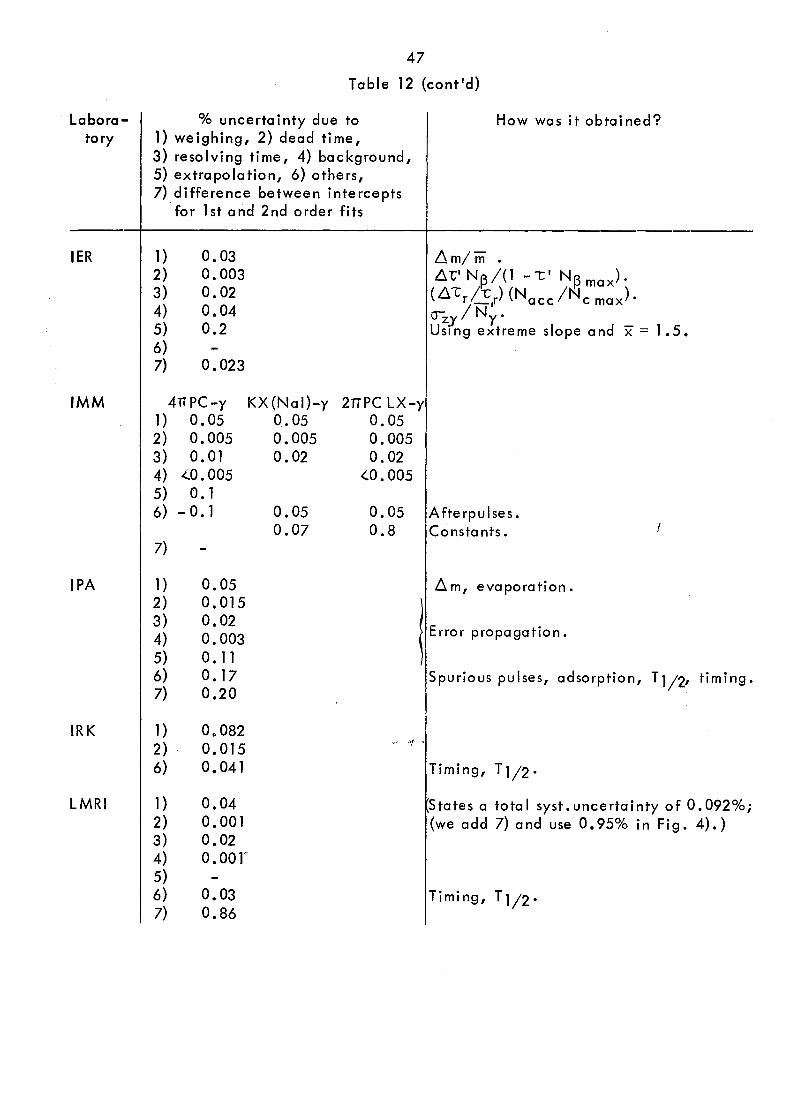
47
Table 12 (cont'd)
Labora- % uncertainty due to tory 1) weighing, 2) dead time,
1ER
IMM
IPA
IRK
LMRI
3) resolving time, 4) background, 5) extrapolation, 6) others, 7) difference between intercepts
for lst and 2nd order fits
1) 2) 3) 4) 5) 6) 7)
0.03 0.003 0.02 0.04 0.2
0.023
4npc-y 1) 0.05 2) 0.005 3) 0.01 4) {'O. 005 5) O. 1 6) - O. 1
7)
1) 0.05 2) 0.015 3) 0.02 4) 0.003 5) O. 11 6) 0.17 7) 0.20
1) 0.082 2) . 0.015 6) 0.041
1) 0.04 2) 0.001 3) 0.02 4) 0.001' 5) 6) 0.03 7) 0.86
KX{Nal)-y 0.05 0.005 0.02
0.05 0.07
2rrpc LX-y 0.05 0.005 0.02
<.0.005
0.05 0.8
How was it obtained?
A fte rp u 1 se s. Consta nts.
b. m, evaporation.
E rror propagation.
Spurious pulses, adsorption, Tl/2, timing.
Timing, Tl/2'
States a total syst.uncertainty of 0.092%; (we add 7) and use 0.95% in Fig. 4).)
Timing, T1/2'

48
Table 12 (contld)
Labora- % uncertainty due to tory 1) weighing, 2) dead time,
NBS
NPL
NPRL
NRC
OMH
3) resolving time, 4) background, 5) extrapolation, 6) others, 7) difference between intercepts
for lst and 2nd order fits
1 ) 2) 3) 4) 5) 6) 7)
1 ) 2) 3) 4) 5) 6) 7)
1) 2) 3) 4) 5) 6) 7)
1 ) 2) 3) 4) 5) 6) 7)
1) 2) 3) 4) 5) 6) 7)
4iï PPC-y 4 ilPC-y 0.01 0.05 0.10 0.02 0.10 O. 15 0.019
4iT PC-y 0.02 0.006 0.02 0.0'1
4 iïLS-y 0.02 0.04 0.02
0.42(0.35) 1.5 0.02 0.42(0.35)
0.01 0.002 0.03 0.003 O. 1 0.3 0.05
4 iï PPC-y "< 0.03 < 0.01 <0.03 < 0.01 <O. 1
0.04 0.01 0.05 0.01 0.60 0.02 0.47
0.01 0.06 0.04 0.02 0.20 O. 15 0.003
4 ïTS i (Li) -y 0.02 0.002 0.05 0.01 1.2 0.02
AC <.0.03
~0.01
<O. 1 <0.005
f
How was it obtained?
Estimated from past results. From measured uncertainty at 99% confidence leve 1.
From variations observed. Max. ra nge 1 st through 3rd order fits. Gandy effect, T1/2' dilution.
From uncert. of total mass of 10 sources. 6 -rI. .6. rra .6 B. Diff. between lst and 2nd order fits. Contamination by 141Ce.
Manufacturerls estimate.
Estimated from inaccuracy in the measurements of these parameters.
By using different channel settings. Count rate dependence (+ spurious pulses).
4" PPC -y AC 'l.ni/m Ba lance ca 1 ibration. m.6 "V(a o - (a 1 N~)/(Nê NX))' -a1m (2 - Nc/Ny - N~!N~)·.6Tr'-mal Nc.6By/(N~N?) ma1(Ny-Y)6By/(N~~) Max. standard error on No.
1 ive-time.
By calculating the maximum values.

49
Table 12 (contld)
Labora- % uncertainty due to to ry 1) wei 9 h i n g, 2) de a d t i me,
PTB
SCK
UVVVR
3) resolving time, 4) background, 5) extrapolation, 6) others, 7) di He re nce be twee n i nte rce pts
for lst and 2nd order fits
1) 0.02 2) (0.01 3) 0.03 4) 0.02 5) 0.05 6) 0.04 7) 0.058
4fiPC-y 4iïPPC-y 4 ii (Csl)y 1) ~0.2 ~0.2 ~0.2
2) 0.001 0.003 <O. 1 3) 0.04 0.06 4) 5) ··0.5 0.5 0.5
6) 0.6
7) 0.73 0.57
1) 0.07 2) 0.04 3) 0.02 4) O. 1 5) 0.5 6) 0.02 7) 0.6
Symbols used in this table
ao ' al, a2 B B~, By m
No N~,Ny,Nc
N~, N~ N Nacc
See reporting Form, Fig. Sta nds for B~ or By Bac kground rates Source mass Di sintagration rate Count rates, corrected
for background Count rates, uncorrected
d l NI S ta n s fo r N Bor y Rate of accidentai coinc.
How was it obta i ned?
2.6. m/m, .6. m = 2 ~g.
(3 ~ Tr/tr) • Nacc /N c • 3~By/Ny • Spread of individual slopes. ~T1/2=0.07d.
See [58J •
See [25J •
Âm = 15 ~g. Max. 150 ns. Max. 25 ns. Mainly y channel.
4 i1(Csl)y Experimental.
Expe ri menta 1. l Statistics, geometry, ~. decay./.scheme corr.
Max. al = 0.002; a2 = 0.000 1 Max. + 5 h.
Measuri ng ti rye Ha 1 f-Life of 39Ce See reporting Form Uncertainty of, .. EHiciency of y detector Standard deviation of
21 measurements of By The shorter of ra or Ly Dead time in ~(y) channel Coincidence resolving time

BUREAU INTERNATIONAL DES POIDS ET MESURES
International c~arison of a solution of 139Ce
Parti c i pating La bora to ry:
Source preparation
i.o~j!fJ~CJ=L~~U~!!!!.~
w .... Nature ~ ; Outer diameter 6 ~ Inner diameter
V') Thickness
m c
Nature
mm mm mm
T1/ 2 = (137.65 + 0.07) cl
i.o ~ j ]..TJ'=-S l-y _ ~o ~ !!. ti ~g_ Range of source mass: ( ••••• to .•••• ) m~ Volume of scintillation vessel cm 3 Intermediate solvent •••••••• Composition of liquid scintillator
...::L .u o
co
Number of films per source Number of metal layersper source Total mass per cm2 •••••••• : :~; ~~':2
Wefting or seeding agent Range of source mass ( ••••• to .••.• ) mg
Number of sources prepared
Was possible adsorption or precipitation of active material in the counting cells checked? .......•.. 0 •••••••••
Were checks made to see that the actual liquid used in the source dispensing was representative of the solution, e .g. by preparing ampoules for ion-chamber measurement from the solution in the pycnometer before and after dispensing the sources? •••.• 0 •••••••••••••
If so, how good Was the agreement? Result of an eventual adsorption test
Ba lance used - Type ......•.••. t
Has the optica 1 sca le Year of purchase been checked for Date of last weight calibration 1 inearity? •••• , .••
If so, of how much ? Was a buoyancy correçtion applied ?
Counti ng equ ipme nt
i~E~ E~!!~ ~ J. 5~ ~n..!.~ Wall material Height of each half
Nature w Wire diametér
-0 o Wire le ngth c
<{ Distance from source Voltage
<J) 1 Na tu re ••. o Pressure .•• ' ••
() Discrimination leve 1
mm
p..-m mm mm kV
eV
~~~~~~~!!~~~~~~~~~~ Material and volume of counting cell
Number of photomultipliers used for viewing ," the ce Il ................. 0 • • • • •
Type of photomultiplier •••...••••.••• If two phototubes were used, were they used
in coincidence •• " summation ..• , or both? For one tube only, or two in summation, were
precautions taken against counting of spurious pulses? ..••• Describe how •••• ", •••••
Upper limit of percentage of sp. pulses. , , •••
Ga mma ray counte r - Number and nature of crysta Is ., Diameter He i ght
Dead times and their uncertainties (standard errors)
Explain how they were determined
mm mm
+
+
• ) ~s
.) !-L s
Please provide a block diagram of your counting set and eventual references as to published papers, internai reports, etc. (on a separate sheet). .../ ...
Figure 1 - Specimen of the reporting form

( . . . . . . + ......) t-L s
. . . . . . . -
"Gandy effect": Mean interval between arrivai times of y and ~ pulses at coincidence mixer •••••••• f-ls (positive, if Y pulse arrives first). By how much did you correct the final result? ••••• %
Counti ng data
Fina 1 resu 1 t
y channel setting k d B
- - 1 B - - -.: 1- • B- -.:.... 0 - • • • • • .: 1-Ba c 9 ro u n ra te s : ~ - . • . • • • s , y - . • • • • • s , c - . • • • • • s
Number of sources il with variation of Nc/N y (for slope determination) measured ~ without variation of NclNy
Number of data points used in slope determination Mean measurement time for one data point Range of Nc/Ny Procedure used to vary N c /N y .• 0 ••••••••••••
. . - . . . . - . . . . . . . . . . - . - . . . . . . Siope/intercept ratio (wit~ standard error)
, a h 00 UT)
to
+ .••. - -
B -1
s
Intercept for Nc/NX ~1 a t re fe re n ce d a te t l 9 76 -
Standard error of the mean '---___ • • ._. _.--="_q.&...-m-,g"'---r--I
Bqmg- I , ••••• % N umber of degrees of freedom
lime of the measurements (year, month, day)
Let the fitted polynomial be of the form y = a o
to ••• f '. •• _ N~ Ny
+al x + a 2 x2 + ••• ,w,thy- N' 1 - N /N m c
= c y x N IN
c y m = source mass. If the order exceeds one, indicate the values
of the coefficients normalized to unit intercept: a 1/a
o = .•• ••• , a 2 /a
o=········, a 3 /a
o = ......•.
Has the uncertainty in the values of the abscissa x been accounted for? If so, by how much does this affect a o ? .••••••••••••
Goodness of fit: Give a graph of the residuals of the fitted efficiency function similar to the one enclosed. State result of X 2 test (if carried out):
Formula used for calculating the data points "f
Systematic uncertainty of final result - Explain how it was determined
due to we ighi ng %
dead time
resolving time
background
extra po lation
others (indicate)
tota 1
La bora tory:
%
%
%
%
%
... _ • • • •• 010
Name(s} of person(s) who carried out the measure me nts

52
Figure 2 - A selection of equipments used by the participants
CF IASMWI
li- O,.tet: units

Nal sc
Nal sc 7.5cm~ x7.5cm
-i
~ ~
(Orl«433)
NaI
c
PW
53
Figure 2 (cont1d)
LineQr Am
(0'1«410)
.' ;.ri .•
2 3
l - triple scintillation head, 2 - amplifiers, 3 4 - sum unit, 5 - first stage coincidence unit, coincidence unit, 7 - outputs to the scalers
to x.y
Scalers
disc ri m i nators, 6 - second stage
K2
c 7
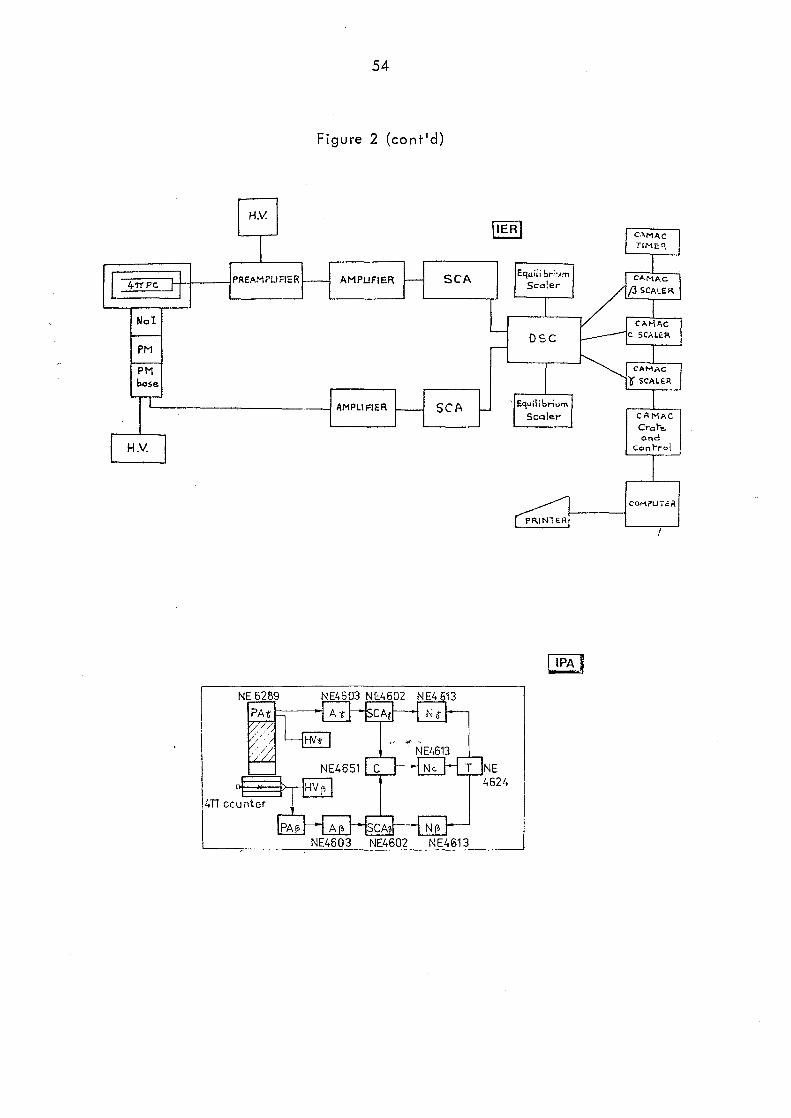
Nol
PM
PM base
54
Figure 2 (cont'd)
AMPUFIER
A NE4603
CAMAC Cr",r~
a"d co"rrol
COM?UHR 1-----1

PREAIoOP.
ANO ?HOTOTU9'!
55
Figure 2 (cont'd)
C C N T R 0 L
NO. 0 1 S P L A Y
Sp S,e Sy Sc ST
10 Hz
PC ASR 33
1 Hz

[NRCI
56
Figure 2 (cont'd)
1-----------17 MONITOR
Schematic of live-timed anti-coincidence circuitry
1 1
S

57
Figure 3 - Efficiency extrapolation, residuals. The bars of the data points represent one time the random uncertainty
as estimated from - the efficiencies E~ and ty in a single count (SIPM, ETL, LMRI, NPRL, OMH),
see [28J ' - the standard error of the mean of m counts, where m is 5 to 6 (AlEA),
+3
+2 -
+1
-1
-2
-3 1 1 ,. o
(%0) +4
+2
0
-2
-4 !
0
(%0) +4
+2
0
-2
-4 !
: 0
1 2 3 4 5
d •
• • • • •• • • • ,.
•
2 3 4 5
d
3 4
...
• • •
(%o) d +4
+2
o t -2
4 (lEA), 20 (1ER), 6 to 20 (lPA), 5 (NPL), 4 to 6 (PTS).
Other participants have used more e labo rate procedures:
A E C L (se e p. l 7) SARC (by combining uncertainties
of slope and intersection with the standard deviation according to r28])
NRC tsee [27J). Additiona 1 information may be found
in the last column of Table 9.
• , ., :" •
6 7
5
---
8 9
IAIEAI
• . ,. 1 :
•
10
x
-4 NF-N,
t_~1 __ ~'L-_-~' __ -.L' __ ----lI'---__ ..L1_N..::..,c - 5 6 7 8 9 10

58
, X '--' ----'--'.----1.'_-'--__, . t , ,
o 234567 1 , , 1 )t
8 9 10 11
(%0) d 1 1 +8 .BARC.
:i ----------~f4tJLL-f 1~~A t+H ----------=i IH I! f t 1 1 j ~
: ~ 1 1 1 1 1 1 1 1 1 1 1 1 1 ').
o 1 2 3 4 5 6 7 S 9 10 11 12 13
o 1 2 3 A"f> 5 6

(%0) d +8
+4
--------' .. ·tI-~'
59 IIPA 1
~ f 1-~~p -4
-8 1 1 1 1
o
(%0) d
+1
o -1
~
~
, 1
o
5
Tort-1
(%0)
+2
+1
0
-1
-2
,
+2
+1
o -1
-2
-3
-4
d
L __
d ----
-f-
i-
1-
o
1
2
0
• 1
3
1
0 .
1
3
0 0 • • 0 • 0
4
.... kf" ... ·
~
• ~ ~ ~
.~
.' ~ ~
2 3
Ne/NI'
10 15
,.. "
4. ·41l
0 j
"0 " .. 0
"
X L 1 1 ... ,
4 5 6
• • 0
0 o 0
1-~ • g X - NI? - .&.
Np ~
5 6 7
• linear regression
o pat'abolic regression
IIEAI
. ~~ ,. '. . ~. ••
" 1 • ; . 1
4 5 6 7
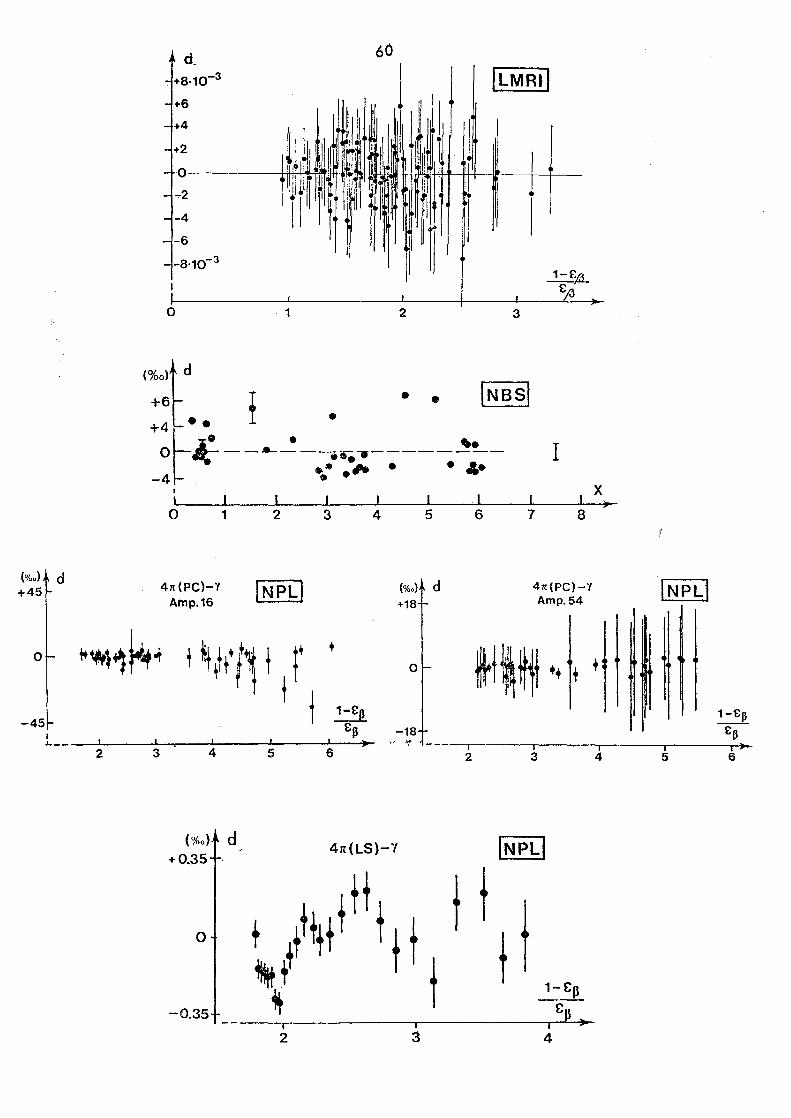
(%0) d +45
0
-45 1 .... _-
d. . +8.10-3 ILMRt]
+6
+4
+2
0
..,.2
-4
-6
-8.10-3
1-E,bL 1 Efo 1 f
0 1 2 3
(%o)t d ::t.. t • •• [NBSI
0r~----~-.iië""-----~~- l .. - #le. • A· -4 . • • 1
, 1 1 1 1 Il 1 1 X ~ o 1 2 3 4 5 6 7 8
41t (pe)-y INPL! (%0) d 41t(PC)-Y Amp.16 +18 Amp.54
.1 it';ttf~~~ t \\It+f,! r +
Jt*~t +. \ 0
l 1 1
2 3 1 4
(%o) d +0.35 .
o
-0.35
! j 1-Ep
El} -18 1 1 ,.. ,.,' ~" ---5 6
1 1 1 2 3 4
4rr(LS)-Y INPLI
tt t
\t t Hp ~ Cp
1 1 1 ~ 234
\NPLl 1
1-Ep
Ep 1 1)-5 6

+2
+1
o
-1
-2
(%0) +3
+2
+1
0
-1
-2
-3 1 1 0
d
l t
,
d
---flfJ 4
I 1 1 1 2
[NRCI
1 3
1 N N
c y
1- ____ ---.., __ '-' __ .... , __ ;-, ---",----;)'~
0.5 0.4 0.3 0.2 0.1
(%0) d +5
61
INPRLI
- - --
1-Nc!Ny Nc/Ny
1 1 1 I~ 4 5 6 7
d INRCI
f f-
I f-+1
o
f- 'j f-
r--
-1
-2
-3 l 0.5 0.6 0.7 0.8 0.9
IOMHI
o t \ ----~1-- -----~------
-5
1 1-Nc /Ny Nc/Ny 1
1 1 1 1 1 1 1 1 .)-
0 1 2 3 4 5 6 7
y Ny
)0

{%o d +5
-5
62
1-€ €
1 i 1 1 i i i i 1 i .j i 1 Iii ....
o 5 10 15 20
(%0) d lUVVVRI
3 4 5 6 7
Dried source linear regression
(%0) d +3
+2
+1
o -1
-2
-3
o 1 2 3 4 5 6
Electrodeposited source quadratic regresslon
x ')0
8
7 8
x )0

63
Radioactivity concentration (1976-03-15) 1 il . ...
700 710 720 kBq-g-1
c::.IIIIICJ AAEC lm
CEl 1% AECL
~ AlEA
- 1 ASMW
BARC
• BCMN
- BIPM
ETL
IBJ
C=-=:J IEA
1ER I:-.J
IMM -- • IPA
- IRK
LMRI
• NBS • - NPL -- NPRL
c:::.:::J c::::JI::::I NRC c::::JI::::I DCl
- OMH
C-=:J PTB
• UVVVR , , , • 700 710 720 kBq_g-1
Figure 4 - Graphical representation of the results. The black (or white) rectangles correspond to the random (or systematic) uncerta inties.
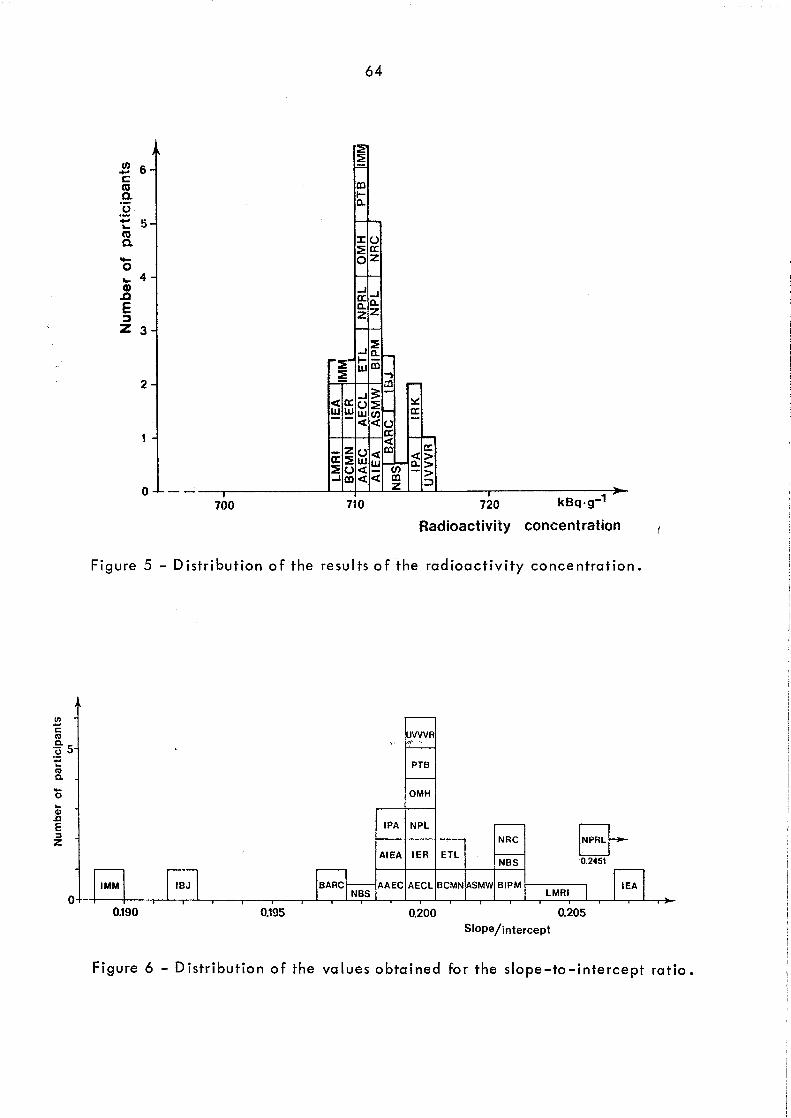
fil
'E co
~5 "-10 Cl. -o
~ E :::J Z
64
en 6 -'~ =
c:: co 0-0
m 1-(l. -5 "-i- ...
co 0--0
:t: U ~ 0:: 0 Z
.... 4 i- l Q)
.Q E ~
...1...1 O::(l. ~z
Z 3 r-I-
..J~ 1-r"':i!- 1--
~ w m
1.., a:l r-
...13: 1-<0:: U~ ~ ww wC/) r- 0::
« U -
2
0:: f-~ < _z u< m 0:: f;!::i! <> Ww 1-(;;" (l.> :i!o <- -> ...lm « m :::1 z , o ---
700 710 720 kBq.g-1
Radioactivity concentration
Figure 5 - Distribution of the results of the radioactivity concentration.
UVVVR ".q- ".
PTB
OMH
NBS Er 0.2451
IPA NPL
NRC
AlEA 1ER ETL
AAEC AECL BCMNASMW BIPM t---L-
M-R-I---,
0.190 0.195 0.200 0.205 Siope/intercept
Figure 6 - Distribution of the values obtained for the slope-to-intercept ratio.

715 c: .2 -f! -c: Q) (,) c: o (,)
>-:~ -(,) cu o :0 cu
kBq.g-1 (1976-03 -15)
BCMN À
BARC o
NBS o
IPA o
NRC
o UVVVR
65
AIEAœ NPL o
NBS o
Il: -O~H AECL
o PTBrj.o
AAEC 0 1ER
ASMW o
710
ETL o o
BCMN o comparison 1976
À comparison 1974 NPL À
LMRI o IEA o
1 __ 1 J 1 1 1 J, .. 0.~19~5~~-----L----~--~----0~.2Lo-o---L--S-lo-p~e-_t-o-_-in-reLr-çe-p-t-r~at-io---OJ.2-0-5---L----~-
Figure 7 - Corre lation of the intercept and the slope-to-intercept ratio. The normalized resuits'1o'f the preliminary comparison [5J are included for comparison.
[lJ
[4J
[5J
[10J [l1J
[12J
[13J
[14]
66
REFERENC ES
Comité Consultatif pour les Etalons de Mesure des Rayonnements Ionisants (CCEMRI), Section Il, Mesure des Radionucléides, 1 re ré uni 0 n , 1970, p. R 1 3
ProcedUres for accurately diluting and dispensing radioactive solutions, Monographie BIPM-l (1975), Recueil de Travaux du B 1 PM, vo 1. 5, 1 975 - 1 976
The detection and estimation of spurious pulses, Monographie BIPM-2 (1976), Recueil de Travaux du BIPM, vol. 5, 1975-1976
A. RYfzl Rapport sur la comparaison préliminaire d'une solution de 34Cs (juillet-septembre 1974), CCEMRI, Section Il, Mesure des Radionucléides, 3e réunion, 1975, Annexe ROI) 3 (1976)
- Rapport sur la comparaison préliminaire d'une solution de 139Ce (octobre 1974), ibid., Annexe R(II) 4 (1976)
A. Williams and M.J. Woods, Report on 57Co 'mini-intercomparisbn', organized by NPL on behalf of BIPM (Reference date 1976-03-04)
A. Rytz, International comparison of a solution of 139Ce (March 1976), preliminary report, Rapport BIPM-76/8 (1976)
J. Steyn, private communication, December 1976
R.D. Neirinckx, The purification of cyclotron-produced carrier-free 139Ce, Int. J. Appl. Radiat. and Isotopes~, 681-682 (1970)
J. G .• V • Taylor, private communic~tion, 1975
J. Steyn and S. M. Botha, 1 nte rnationa 1 comparison 0 f the radioactivity of a 139Ce solution (March 1976): The effect of spurious pulses on the accuracy of the final result, NPRL Research Report FIS 102, 21 p. (1976)
D. Smith, -An improved method of data collection for 4TI ~-y coincidence measurements, Metrologia .!.!., 73-77 (1975)
A. Wi Il iams and P. J. Campion, 0 n the re lative time distribution of pulses in the 41T~-y coincidence technique, Int. J. Appl. Radiat. and Isotopes~, 555-560 (1965)
K. Munzenmayer and A.P. Baerg, Delay matching of beta-gamma coincident pulses, Nucl. Instr. and Meth. 70,157-163 (1969)

[15J
[16J
[17J
[18J
[19J
[20J
[21J
67
W. Mannhart and H. Vonach, Absolute calibration ofa weil-type Nal-detector to an accuracy of 0.3-0.1%, Nucl. Instr. and Met h. 136, 1 09 - 11 7 (1 976)
W. Mannhart, Préizisions-Aktivitéitsbestimmung mittels eines BohrlochGamma-Spektrometers, Thesis, Munich 1975 (57 p.)
P.J. Campion, The standardization of radio isotopes by the beta-gamma coincidence method using high efficiency detectors, Int. J. Appl. Radiat. and Isotopes .i.l 232-248 (1959)
J. Bryant, Coincidence counting corrections for dead-time loss and accidentai coincidences, Int. J. Appl. Radiat. and Isotopes 14, 143-151 (1963) -
A. Rytz, Rapport sur la comparaison internationale de la méthode 4fT~(CP)-y au moyen du cobalt-60, CCEMRI, 5e session, 1964
P. Bréonce, A. Rytz et C. Veyradier, Description de l'ensemble No. 3 de comptage par coïncidences 4Tr~(CP)-y utilisé au BIPM, Rapport BIPM-75/2 (43 p.) 1975, Recueil de Travaux du BIPM, vol. 5,1975-1976
A. Gandy, Mesure absolue de l'activité des radionuclides par la méthode des coïncidences béta-gamma à l'aide de détecteurs de grande efficacité. Etude des coïncidences instrumentales, Int. J. Appl. RadiaL and Isotopes.!..!., 75-91 (1961)
[22J 1. W. Goodier, 4iï~-y coincidence equations, BCMN Internai Report, CBNM/RN/20/76, 4 p. (1976)
[23J
[24J
[25J
[26J
[27J
D.R. Cox and V. Isham, A bivariate point proceé,s connected with e lectronic counters, Proc. R. Soc. Lond. A356, 149-160 (1977)
.... '1". --
A. P. Baerg, K. Munzenmayer and G oC. Bowes, L ive-timed anti-coincidence counting with extending dead-time circuitry, Metro logia J!, 77-80 (1976)
A.P. Baerg, The efficiency extrapolation method in coincidence counting., Nuc!. Instr. and Meth. 112,143-150 (1973)
J.S. Merritt, Private communication to J.W. MUller, February 1977
R.J. Adams and A.P. Baerg, Least squares polynomial fitting of coincidence counting data for the evaluation of absolute di si nteg ration ra te s, S ta nda rd i za tio n 0 f rad io nuc 1 ide s, IAEA, Vienna, SM-79/25, p. 123-127 (1967)
A. P. Baerg, Dead time, decay and background effects in counting, Int. J. Appl. Radiat. and Isotopes 24,401-405 (1973)
[28]
[31]
[33]
[34J
68
P.J. Campion and J. G. V. Taylor, Statistical errors in disintegration rate measurements by the coincidence technique, Int. J. Appl. Radiat. and Isotopes.!.Q, 131-133 (1961)
J.S. Merritt, F.H. Gibson and J.G.V. Taylor, Report to the BIPM on this comparison (1976)
'01 J. Plch, J. Zderadicka and O. Dragoun, Measurementsofthe total interna 1 conversion coefficient and PK W K. probabil ity in the decay of 139Ce, Intern. J. Appt. Radiat. and "lsotopes 26,579-587 (1975)
J oS. Merritt and J. G. v. Taylor, The response of 4Tï proportional counters to y-rays, Standardization of radionuclides, IAEA, Vienna, S M-79/ 66, p. 147-152 (1967)
D. F. Urquhart, A new method for the measurement of the gamma counting efficiency of 41T beta gas counters, Standardization of radionuclides, IAEA, Vienna, SM-79/27, p. 167-181 (1967)
A. Williams and P.J. Campion, The measurementofthe gamma sensitivity of a 41T~ counter, Intern. J. Appl. Radiat. and Isotopes ~, 533-540 (1963)
J. G. V. Taylor, Private communication (1974) and comments on IIlnternal conversion of the 166-keV transition in 139La ll by J.G.V. Taylor and J.S. Merritt, Bull. Am. Phys. Soc.?..' 352 (1962)
E.A. Aristov and V.A. Bazhenov, Determination of the ~ota 1 coefficient of internai gamma-radiation conversion of ~~La, Izmer. Tekhn. No. 12,61-62 (1971); Meas. Tech. (USSR) 14, 1883-1885 (1971) -
J. Legrand, M. Blonde 1 and P. Magnier, H igh-pressure 4lT I,roportiona 1 18unter for internaI conversion :Iectron measurements (13 Ce,
9Cd, 99Tc m), Nucl. Instr.and Meth. ~, 101-102 (1973)
[37J H. H. Hansen and D. Mouchel, Internai conversion coefficient for the 165.8 keV transition in 39La, Z. Physik A 276,303-307 (1976)
[38J
[39J
E. Schonfeld, R. Brust, H. Greupner, Zur Anwendung der Efficiency Tracer Tedhnique bei der absoluten Aktivitatsbestimmung im ASMW, Isotopenpraxis.!.l, 347-352 (1975)
A. Chyli~ski and T 0 Radoszewski, The 4Tï~-y and 4Tï(x,e)-y coincidence method with liquid scintillation counter for counting ~-particles, Auger-electrons or x-rays, Nukleonika 20, 469-482 (1975)

[40J
[41J
[42J
[ 43J
. [44J
[45J
[46J
[47J
[48]
69
E. Sch~nfeld, Measurement of disintegration rates of radioactive nuclides by the 4n~-y-coincidence method in the DAMW, Isotopenpraxis?..' 262-267 (1971)
J.G.V. Taylor and A.P. Baerg, Radioactivity standardization in Canada, Radioactivity calibration standards, ed. W.B. Mann and S.B. Garfinkel, NBS Special Publication 331,69-77 (1970)
A. P. Baerg, Pressurized proportiona 1 counters for co inc ide nce measurement, Nucl. Instr. and Meth. 112,95-99 (1973)
J. Plch, J. Zderadicka, V. Zfdek and L. Kokta, A versatile system 1
for absolute activity measurement, UVVVR-Report No. 3, 67 p. (1975)
E. Kerë, Random coincidence simulator, IAEA Laboratory Activities, Fourth Report, Technical Reports Series No. 77, Vienna (1967)
E. Schonfeld, Ein Vergleich der Methoden zur Bestimmung der Koinzidenzauflosungszeit an Koinzidenzmesseinrichtungen fUr die Messung der Zerfallsrate radioaktiver Nuklide, Intern. J. Appl. Radiat. and Isotopes.!i, 747-751 (1968)
E. Celen and E. De Roost, A simple test generator for measurement of dead times and resolving times, BCMN Internai report No. RN/4/74, 10 p. (1974)
A. P. Baerg, Variation on the paired source method of measuring dead time, Metrologia l, 131-133 (1965)
J.-J. Gostely and O. Noverraz, Digital selector of coincidences for the absolute measurement of radioactivity, Nucl. Instr. and Meth. ~, 69-79 (1975)
." '1.".
[49J 'J. W. Mu 11er, The source -pu Iser method revisi ted, Rapport BI PM-76/5, 16 p. (1976), and Recueil de Travaux du BIPM, vol. 5, 1975-1976
[50J
[51J
- Une méthode simple pour mesures précises de temps morts, Rapport BIPM-69/3, 3 p. (1969)
- Une nouvelle méthode pour la mesure des temps morts, Rapport BIPM-69/11, 3 p. (1969)
[52 J - Dead-time problems, N uc 1. 1 nstr. and Meth. 112, 47-57 (1973), and Recueil de Travaux du BIPM, vol. 4,1973-1974
[53J D.R. Powell and J.R. Macdonald, A Fortran program for general ized nonlinear least squares, Computer J.~, 148-155 (1972), revised 1975

[54J
[55J
[56J
[57J
[58J
70
V.V. Shaha and P.K. Srivastava, Digital data recording system for the 4TI~-y coincidence apparatus, Bhabha Atomic Research Centre, Bombay, BARC/I-329, 20 p. (1975)
S.B. Garfinkel, W.B. Mann and J.L. Pararas, The National Bureau of Standards 4TI ~-y coincidence-counting and y-ray intercomparator automatic sample changers, Nucl. Instr. and Meth. 112, 213-217 (1973) -
IAEA laboratory Activities, Technical Reports Series No. 98, p. 15 (1969)
1. W. Goodier, E. Celen and W. Zehner, Further studies on the measurement of cerium-139, BCMNlnternal Report No. RN/12/75, 20 p. (1975)
M. lainé, J.-P. Pérolat, J. Bouchard et Y. le Gallic, les coïncidences 4n~-y au laboratoire de métrologie de la radioactivité, Rapport C EA-R-4131, 74 p. (1971)