Embed Size (px)
Citation preview

BWX | FY19 Results Presentation
BWX FY2019 RESULTSFriday 23 August 2019
Dave Fenlon, Group CEO & Managing DirectorVinod Somani, CFO
For
per
sona
l use
onl
y

BWX | FY19 Results Presentation
DISCLAIMERThis presentation has been prepared by BWX Limited ACN 163 488 631 (BWX) The information contained in this presentation is for information purposes only and has been prepared for use in conjunction with a verbal presentation and should be read in that context. This presentation is provided to you on the basis that you are a "sophisticated investor" (in accordance with subsection 708(8) or (10) of the Corporations Act 2001 (Cth) (Corporations Act)) or a “professional investor” (in accordance with subsection 708(11) of the Corporations Act), to whom his presentation has been prepared by BWX Limited ACN 163 488 631 (BWX). The information contained in this presentation is for information purposes only and has been a disclosure document is not required to be given under the Corporations Act.
The information contained in this presentation is not investment or financial product advice and is not intended to be used as the basis for making an investment decision. Please note that, in providing this presentation, BWX has not considered the objectives, financial position or needs of any particular recipient. BWX strongly suggests that investors consult a financial advisor prior to making an investment decision. This presentation is strictly confidential and is intended for the exclusive benefit of the institution to which it is presented. It may not be reproduced, disseminated, quoted or referred to, in whole or in part, without the express consent of BWX. No representation or warranty, express or implied, is made as to the fairness, accuracy, completeness or correctness of the information, opinions and conclusions contained in this presentation. To the maximum extent permitted by law, none of BWX, its related bodies corporate, shareholders or respective directors, officers, employees, agents or advisors, nor any other person accepts any liability, including, without limitation, any liability arising out of fault or negligence for any loss arising from the use of information contained in this presentation.
This presentation may include “forward looking statements”. Forward looking statements can generally be identified by the use of the words “anticipate”, “believe”, “expect”, “project”, “forecast”, “estimate”, “likely”, “intend”, “should”, “could”, “may”, “target”, “plan” “guidance” and other similar expressions. Indications of, and guidance on, future earning or dividends and financial position and performance are also forward looking statements. These forward looking statements are not guarantees of future performance and involve known and unknown risks, uncertainties and other factors, many of which are beyond the control of BWX and its officers, employees, agents or associates, that may cause actual results to differ materially from those expressed or implied in those statements. Actual results, performance or achievements may vary materially from any projections and forward looking statements and the assumptions on which those statements are based. Readers are cautioned not to place undue reliance on forward looking statements and BWX assumes no obligation to update that information.
This presentation is not, and does not constitute, an offer to sell or the solicitation, invitation or recommendation to purchase any securities and neither this presentation nor anything contained in it forms the basis of any contract or commitment.
This presentation does not constitute an offer to sell, or a solicitation of an offer to buy, any securities in the United States. The securities of BWX have not been, and will not be, registered under the U.S. Securities Act of 1933, as amended (Securities Act) or the securities laws of any state or other jurisdiction of the United States, and may not be offered or sold in the United States except in compliance with the registration requirements of the Securities Act and any other applicable securities laws or pursuant to an exemption from, or in a transaction requirements of the Securities Act and any other applicable securities laws or pursuant to an exemption from, or in a transaction not subject to, the registration requirements of the Securities Act and any other applicable securities laws.
For
per
sona
l use
onl
y

BWX | FY19 Results Presentation
AGENDA
1. Highlights & Business Review2. Financial Review3. Strategy & Outlook4. QuestionsF
or p
erso
nal u
se o
nly

BWX | FY19 Results Presentation
HIGHLIGHTS &BUSINESS REVIEW Dave Fenlon, Group CEO & Managing Director
For
per
sona
l use
onl
y
BWX | FY19 Results Presentation
FY19 HIGHLIGHTS
5
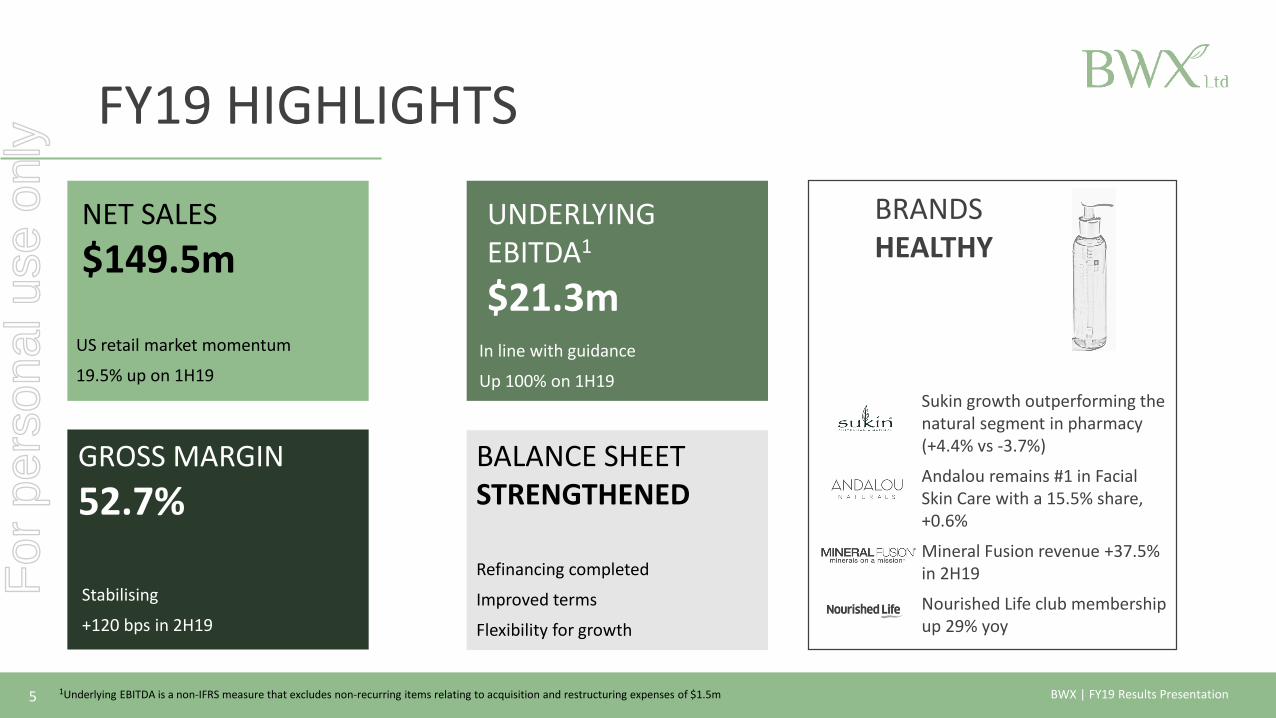
NET SALES$149.5m
UNDERLYING EBITDA1
$21.3m
GROSS MARGIN52.7%
US retail market momentum
19.5% up on 1H19In line with guidance
Up 100% on 1H19
Stabilising
+120 bps in 2H19
BALANCE SHEET STRENGTHENED
Refinancing completed
Improved terms
Flexibility for growth
BRANDSHEALTHY
Sukin growth outperforming the natural segment in pharmacy (+4.4% vs -3.7%)
Andalou remains #1 in Facial Skin Care with a 15.5% share, +0.6%
Mineral Fusion revenue +37.5% in 2H19
Nourished Life club membership up 29% yoy
1Underlying EBITDA is a non-IFRS measure that excludes non-recurring items relating to acquisition and restructuring expenses of $1.5m
For
per
sona
l use
onl
y

BWX | FY19 Results Presentation
OPERATIONAL HIGHLIGHTS
6
USA SALES MOMENTUMMarket share growth; multi-brand selling model.
Mineral Fusion relaunch well received; launching in mass channel February 2020.
Sukin (14 SKUs) and Andalou (37 SKUs) now available in Albertson’s, #2 USA grocery chain.
BRAND EXPANSIONSukin selling in 448 new USA doors; 318 new domestic doors; strong double digit growth recorded in UK, Canada, New Zealand, Malaysia, Singapore and China.
Mineral Fusion successfully rebranded.
Andalou Naturals completed successful trial in Priceline.
Nourished Life ready to sell internationally after systems upgrade; 29% increase in members during FY19.
For
per
sona
l use
onl
y

BWX | FY19 Results Presentation
OPERATIONAL HIGHLIGHTS
7
WAREHOUSE & PLATFORM UPDATESCapacity to process up to 3,300 eCommerce orders in a single shift.
Integration and systems upgrade provides upside for multi-brand selling model.
USA facility consolidation delivers cost and leverage benefits.
ERP DELIVERING BENEFITSOperational in Australia; implementation underway in USA.
Improved efficiency, data and forecast accuracy.
Increased margin visibility.
INCREASED CAPABILITYUS President appointment being finalised.
Hires in governance, sales, marketing.
For
per
sona
l use
onl
y

BWX | FY19 Results Presentation
SUKIN
81 IRI Market Edge Data – Coles – Dollars growth – MAT to 07/07/2019 2 IRI Market Edge Data – AU Pharmacy (Natural) Skin Care – Dollars Share –MAT to 07/07/2019
35.3% of Group Revenue
Gross margin of 65-67%
Resilient to the impact of domestic export sales (changing Daigou tax impacts)
Almost no pharmacy sales cannibalisation
Popular products - 2 Sukin products in Top 10 Skincare at Coles1
Margin accretive new products – Blemish Control ($1.4m, 3.4% sales)2
Strong pipeline of new products (rollout 2020)
27%
Natural Swisse
10%
Healthy Care8%Blackmores, 7%
Trilogy Reg7%
Other 41%
AU Pharmacy Natural Skincare Market (%)2
19.531 36.4
23.2
20.8
3129.4
29.6
FY16 FY17 FY18 FY19
Net Revenue ($m)1H 2H
#1 Natural Skincare – outstripping growth of natural pharmacy (+4.4% vs -3.7%)
#2 Total Skincare brand in Pharmacy – Sukin continues to perform strongly 2
#4 Total Skincare brand in Coles1 – compelling sales growth (+38%)
3 IRI Market Edge Data – AU Pharmacy – MAT to 07/07/2019 – No Hair Care included4 Based on all SKUs in IRI Market Edge Scan Data - Pharmacy – MAT to 07/07/2019
Skincare 33%
Body Care 25%
Oil 27%
Other 15%
Scan revenue per product type3
143 SKUs4
For
per
sona
l use
onl
y

BWX | FY19 Results Presentation
ANDALOU NATURALS
9
Popular products – 4 Andalou products in Top 10 Facial Skin Care (US Naturals)
CannaCell collection – launched in June 2018 –represents 21% of Total Andalou sales in Facial Skin Care
#1 Facial Skincare Brand – Strong performance in US Naturals (15.5%, +0.6%)
#4 Hair Care Brand – growing share in US Naturals (7.6%, +14%)
#5 Facial Skincare Brand – US conventional
32.5% of Group Revenue
Gross margin of 43-45%
Total Andalou Sales +19% in 2019 in Whole Foods Market (#1 Natural retailer)
Skincare62%
Hair Care 19%
Bath & Body 13%
Men 4%Other , 2%
Revenue by product type (FY19)
148 SKUs4
1 Pre-acquisition figures are unaudited and have not been restated using BWX accounting policies2 Based on SPINS 12 week data for period ending 07/07/19 and Nielsen Whole Foods data for period ending 07/07/19
Andalou 15.5%
Other 85%
US Naturals Skincare Market (%)3
24.1 30.7 36.2
16.8
8.2
22.85
22.4 25.75
FY15 FY16 FY17 FY18 FY19
Net Revenue ($AUDm)1
Andalou BWX owned, 1H BWX owned, 2H
For
per
sona
l use
onl
y

BWX | FY19 Results Presentation
MINERAL FUSION
10
16.4% of Group Revenue
Gross margin of 52-54%
AU channel expansion – early momentum from Priceline store test signals potential upside
1Pre-acquisition figures are unaudited and have not been restated using BWX accounting policies2 Based on SPINS 12 week data for period ending 01/07/19 and Nielsen Whole Foods data for period ending 01/07/19
#1 Cosmetics Brand – dominant market share in US Naturals
#3 Natural Cosmetics Brand in US conventional market
Regaining market share – positive early signs from packaging re-launch (01-2019)
Popular products – 16 Mineral Fusion products in Top 20 Cosmetics (US Naturals)
Outperforms – MF sales -1.6% vs. -6.2% Cosmetics (US conventional market)
Body Care , 2%
Cosmetics 65%
Facial Skincare , 11%
Hair Care , 6%
Nails , 14%
Other , 2%
Revenue by product type (FY19)
231 SKUs4
Mineral Fusion
43%
Others 57%
US Naturals Care Market (%)2
26.8 30.5
13.5 10.34
16.814.22
FY16 FY17 FY18 FY19
Net Revenue ($AUDm)1
Mineral Fusion BWX ownership, 1H BWX ownership, 2H
For
per
sona
l use
onl
y
BWX | FY19 Results Presentation
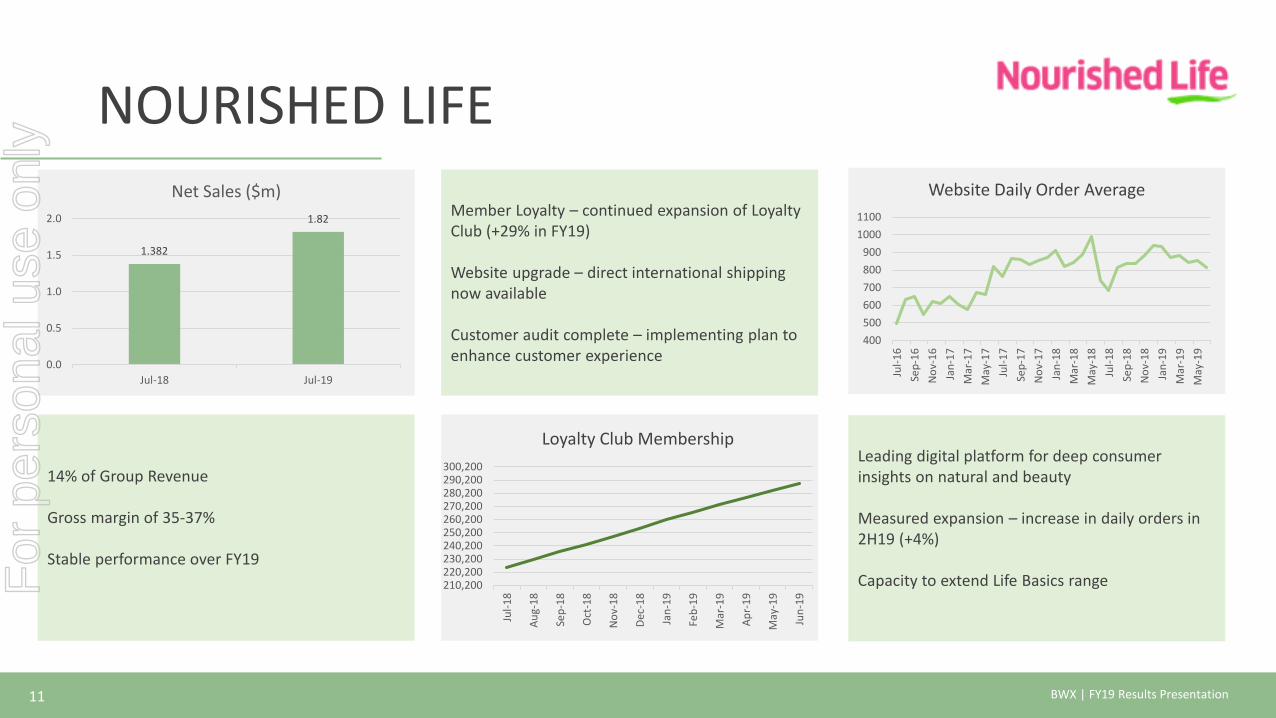
NOURISHED LIFE
11
400500600700800900
10001100
Jul-1
6Se
p-16
Nov
-16
Jan-
17M
ar-1
7M
ay-1
7Ju
l-17
Sep-
17N
ov-1
7Ja
n-18
Mar
-18
May
-18
Jul-1
8Se
p-18
Nov
-18
Jan-
19M
ar-1
9M
ay-1
9
Website Daily Order Average
210,200220,200230,200240,200250,200260,200270,200280,200290,200300,200
Jul-1
8
Aug-
18
Sep-
18
Oct
-18
Nov
-18
Dec-
18
Jan-
19
Feb-
19
Mar
-19
Apr-
19
May
-19
Jun-
19
Loyalty Club Membership
1.382
1.82
0.0
0.5
1.0
1.5
2.0
Jul-18 Jul-19
Net Sales ($m)
Leading digital platform for deep consumer insights on natural and beauty
Measured expansion – increase in daily orders in 2H19 (+4%)
Capacity to extend Life Basics range
Member Loyalty – continued expansion of Loyalty Club (+29% in FY19)
Website upgrade – direct international shipping now available
Customer audit complete – implementing plan to enhance customer experience
14% of Group Revenue
Gross margin of 35-37%
Stable performance over FY19
For
per
sona
l use
onl
y

BWX | FY19 Results Presentation
Asia Pacific & International• Focus on key customer relationships• Continued roll-out of Andalou• Roll-out of Nourished Life platform and
other BWX e-commerce sites• Potential upside once Mineral Fusion
roll-out underway
North America
• Multi-brand selling model supported by channel expansion
• Mineral Fusion rebrand success• ERP roll-out conducive to smarter
working capital
12
PERFORMANCE BY GEOGRAPHY
China• Net sales of $2.4m; China influence
sales are less than 10% of group revenues
• Opportunity to unlock this market further – not materially impacted by Daigou regulatory changes
Net sales revenue by region
AUD millionFY18 FY19
Australia 77.0 62.8
USA 48.0 60.2
Other 23.6 26.5Total 148.7 149.5
42%
40%
18%
FY19 GEOGRAPHICAL SPLIT
Australia USA Other
Sukin only
Andalou only
Three-brand
Two-Brand
For
per
sona
l use
onl
y

BWX | FY19 Results Presentation
FINANCIAL SUMMARYVinod Somani, Chief Financial Officer
For
per
sona
l use
onl
y

BWX | FY19 Results Presentation
PROFIT AND LOSS
14
Net revenue: • 2H19 increase of 19.5% compared to 1H19Gross Profit: • Gross profit margin impacted by increased proportion
of net revenue from acquired businesses, which operate at lower margins
• 120 basis points margin improvement in 2H19Operating expenses: • Increase primarily attributable to acquired businesses
12-month contribution during FY19Depreciation & Amortisation:• Higher D&A due to recognition of intangibles stemming
from finalisation of Nourished Life acquisition and amortisation of the ERP
Lower tax expense:• Lower tax expense impacted by Andalou Naturals
deferred paymentDividend:• A final fully franked dividend of 2.7 cents per share
determined for FY19 within dividend payout guidance of 35-50%
AUD million FY18 1H19 2H19 FY19 Change
Revenue 148.7 68.1 81.5 149.5 0.5%
Gross Profit 88.3 35.1 42.9 78.0 -11.7%
Gross Profit Margin 59.4% 51.5% 52.7% 52.2% -7.2%
EBITDA – Reported 35.3 7.2 12.6 19.8 -43.9%
EBITDA - Underlying1 40.3 7.1 14.2 21.3 -47.2%
EBITDA margin – Underlying 27.1% 10.4% 17.4% 14.2% -12.9%
Depreciation & Amortisation -1.9 -1.4 -1.7 -3.1 66.5%
Interest Expense -4.4 -2.8 -1.4 -4.2 -4.5%
Tax -9.8 -0.4 -2.5 -2.9 -70.2%
NPAT – Reported 19.2 2.6 6.9 9.5 -70.0%
NPAT - Underlying1 24.2 2.5 8.5 11.0 -54.5%
EPS - Reported 14.3 2.1 5.6 7.7 -46.2%
EPS - Underlying 18.7 2.1 6.8 8.9 -52.4%Dividends per share 7.45 - 2.7 2.7 -63.8%
1Underlying EBITDA is a non-IFRS measure that excludes non-recurring items relating to acquisition and restructuring expenses of $1.5m
For
per
sona
l use
onl
y

BWX | FY19 Results Presentation
BALANCE SHEET
15
As at 30 June 2019, the Group re-financed its debt facilities via extension until July 2022, at improved margins. The Group is compliant with all banking covenants.
Lower financial liabilities due to a $9.2m reduction in deferred consideration/payments on acquisitions, offset by movement in working capital facility.
FY19
Bank debt 54.8
Deferred consideration 12.8
Total debt 67.6
AUD million June 2018 Dec 2018 June 2019 Change
Assets
Cash 19.9 5.7 12.0 -39.7%Trade and other receivables 31.2 30.4 30.9 -1.0%Inventories 27.9 34.9 28.8 3.2%Prepayments 1.8 6.1 3.7 105.6%Current tax asset 0 0 1.0Plant and equipment 3.5 3.9 4.3 22.9%
Intangible assets and goodwill 274.3 284.5 285.2 4.0%Deferred tax assets 3.2 6.1 4.6 43.8%Total assets 361.8 371.7 370.5 2.4%Liabilities
Trade and other payables 16.2 22.9 15.5 -4.3%Financial liabilities 72.8 69.7 67.6 -7.1%Current tax liabilities 1.4 0.4 0 -100.0%Employee benefits 1.4 1.2 1.6 14.3%Total liabilities 91.8 94.2 84.7 -7.7%Net assets 270.0 277.5 285.8 5.8%
For
per
sona
l use
onl
y

BWX | FY19 Results Presentation
WORKING CAPITAL
16
• Improved position in second half• Successful execution of inventory reduction plan in during 2H19• The group reduced payables by $7.0m in 2H19, whilst maintaining healthy cash position
For
per
sona
l use
onl
y

BWX | FY19 Results Presentation
INVENTORIES
17
• Inventory reduction projects across Australia and US delivered for both raw materials and finished goods in 2H19• Benefits from the ERP intelligence and S&OP processes introduced during the year• Inventory holding decreased by 17% in the second half
For
per
sona
l use
onl
y

BWX | FY19 Results Presentation
CASH FLOW RECONCILIATION
18
AUD million 1H19 2H19 FY19
EBITDA (underlying) 7.1 14.2 21.3
Working Capital movements -4.0 1.0 -3.0
Non-Recurring Costs -2.1 -4.5 -6.6
Interest expense -1.9 -1.5 -3.4
Tax -2.5 -3.5 -6.0
Other -3.9 5.3 1.4
Operating Cash Flow -7.3 11.0 3.7
Capital Expenditure -2.6 -2.0 -4.6
Acquisitions -5.1 - -5.1
Significant improvement in Operating Cash-flow in 2H19 ($11.0m) compared to 1H19 (-$7.3m)
Non-Recurring Costs relate to $4.9m MBO and other restructure and acquisition costs of $1.7m
For
per
sona
l use
onl
y

BWX | FY19 Results Presentation
STRATEGY & OUTLOOK Dave Fenlon, Group CEO & Managing Director
For
per
sona
l use
onl
y

BWX | FY19 Results Presentation
MARKET OPPORTUNITY
20
• By 2022 – the global beauty and personal care market is expected to reach the value of US$616 billion, growing at 5.8% (CAGR 2017-2022)
• The skincare segment is expected to dominate with a 26.6% share (5.7% CAGR)
• Australasia is the second largest region in terms of per capita spend on beauty and personal care, accounting for a third of the industry value in 2018
• The natural and organic personal care market is outperforming the broader market with 8.6% growth (CAGR 2016-2020 in US)
$388 $406
$424 $443
$465 $491
$519 $549
$582 $616
2013 2014 2015 2016 2017 2018 2019P 2020P 2021P 2022P
Global Beauty & Personal Care Industry Growth1
4.9% 4.7%
4.5%
4.4%
5.0% 5.6%
5.7%
5.8% 5.8% 5.9%
$14.4 $15.9
$17.4 $19.1
$20.8
$22.6
$24.4
$26.3
2013 2014 2015 2016 2017P 2018P 2019P 2020P
Natural Personal Care Market Growth (USA)
10% 9.9% 9.7% 9.5% 9.1% 8.6% 8.1% 7.6%
Global megatrends driving growth of Natural and Organic: Heightened consumer consciousness, particularly among millennials Willingness to pay more for natural ingredients Pressure on retailers to supply environmentally friendly and ethically
sourced products Discerning consumers demanding transparency around ingredients eCommerce channel educating consumers directly
1 Euromonitor
For
per
sona
l use
onl
y

BWX | FY19 Results Presentation
STRATEGIC PRIORITIES
21
GET CLEAN & GET HEALTHYFocus on operational efficiency. Invest in scalable systems and processes to support growth. Ensure best practice governance.
INVEST IN OURSELVESBuild capability. Lift Net Promoter score to 67%+. Be an employer of choice.
CONNECT TO CONSUMERSInvest more in marketing – speak directly to the consumer.
Reinforce our brand values.
Invest more in NPD to serve the consumer.
Go direct to the consumer. Leverage Nourished Life platform.
Build a meaningful direct-to-consumer model by brand.
GO GLOBAL, GO MAINSTREAMGrow natural segment. Compete with mainstream skincare.
Build customer and influencer base in China around key brands: Sukin, Andalou and Mineral Fusion.
Launch Nourished Life into new markets. Launch Sukin in Germany.
Invest in supermarket and mass channel relationships in key geographies.
Objective to have a $50m supermarket skincare business in Australia and a $75m conventional and mass skincare business in the US.
For
per
sona
l use
onl
y

BWX | FY19 Results Presentation
GET CLEAN &
GET HEALTHYCONNECT TO
CONSUMERS
OUR STATUS
22
GO GLOBAL,
GO MAINSTREAM
WIN
NIN
GM
UST
IMPR
OVE
GROWTHGROWTH OPERATIONAL IMPROVEMENT
✘ Rationalise SKUs
✘ Define brands clearer and differentiate products better
✘ Improve data quality and forecasting accuracy
✘ Modify channel and pricing process
✘ Invest in developing talent
✘ Align global executive team better
✓ Leading product formulators –highly qualified and experienced
✓ Significant capability added
✓ Consumer-led, data driven approach to innovation
✓ Best-in-class on speed to market
✓ All SKUs profitable
✓ ERP maturing in Australia; rollout underway in USA
✓ Fully integrated manufacturing model
✓ Number 1 in AUS and USA in natural category
✓ Strong partners in all our markets
✘ Address pricing anomalies in international markets
✘ Prioritise markets and channels better
✘ Unlock China platform business
INVEST IN
OURSELVES
For
per
sona
l use
onl
y

BWX | FY19 Results Presentation
GROWTH INITIATIVES
23
HORIZON ONE
HORIZON TWO
HORIZON THREE
- Invest in global enterprise approach to marketing
- Appoint Chief Marketing & Revenue Officer
- Launch Sukin in Germany- Invest in CBEC capability
- Reduce SKU count by 10%- Exit sub brands of NE and third
party representation- Improve working capital- Phase rollout ERP project kick-off
- Target 15% of net revenue from NPDs
- Joint business plans with key retailer customers
- Launch Chinese-influenced SKUs- Launch Nourished Life in next two
markets
- GROW, MAINTAIN & EXIT market prioritisation strategy implemented
- Implement ERP in USA business- Manufacture 60% of group
revenue- Lift employee engagement (Net
Promotor Score 67%)
- Invest in partnerships with leading natural platforms
- Transform cost-base to fund growth - Accelerate growth of a direct-to-consumer
model per brand
- Become THE brand for talent + employer of choice
- Champion globally recognised natural benchmark
- Improve gross margin by 1.5-2.0%
GROWTH
OPERATIONAL IMPROVEMENTF
or p
erso
nal u
se o
nly

BWX | FY19 Results Presentation
OUTLOOK
24
BWX is well positioned with CATEGORY LEADING BRANDS that are INCREASING MARKET SHARE.
The BWX brand portfolio has non-discretionary attributes and is exposed to favourable megatrends which are accelerating growth of the natural and organic category and outpacing the growth of the global personal care and beauty industry.
Through TARGETED INVESTMENT in brand building, process improvement, capability and innovation, BWX is confident of driving DEEPER CONSUMER PENETRATION and BASKET SIZE, to support 20-25% REVENUE GROWTH and 25-35% EBITDA GROWTH in FY2020.F
or p
erso
nal u
se o
nly

BWX | FY19 Results Presentation
Thank you
For
per
sona
l use
onl
y