Embed Size (px)
Citation preview
Buyer Power in the Clothing and
Footwear Sector in the Netherlands
Legitimate fear or Calimero effect?
Ernst-Jan Sillem BSc.
ANR: 523872
Master Thesis
International Economics and Finance
Exam Committee:
Prof. Dr. E.E.C. van Damme
Dr. H.P. van der Wiel
January 21st, 2011
Tilburg University
Buyer Power in the Clothing and Footwear Sector
2 Executive Summary | Ernst-Jan Sillem
Buyer Power in the Clothing and Footwear Sector
Tilburg University | Executive Summary 3
EXECUTIVE SUMMARY
In recent years politicians from many countries have expressed their concerns about increased
buyer power from large retailers. Manufacturers and wholesalers have to deal with delayed
payments, promotional cost charges and entry fees, among many other practices that are
considered unfair. These practices have been investigated by EIM in their report for the ministry of
Economic Affairs (2009). It is found that 58% of the manufacturers and wholesalers in the footwear
and clothing industry are confronted with unfair demands by retailers. This was the highest of the
four sectors investigated and the reason for the subject of this paper, namely how the distribution
of market power between the links in the footwear and clothing industry has developed over the
years.
An in-depth analysis of the clothing and footwear industry shows that it has been subject to many
changes in the recent decades. Production levels have been on a steady decline, while wholesale
turnover has increased strongly over the past fifteen years and the consumer prices for clothing
have decreased in real terms. Import and export levels have both increased, which is possibly
caused by a new firm structure called head-tail-firms. International retailers, such as Zara, C&A and
H&M have grown strongly in the past fifteen years, having a presence in almost every city in the
Netherlands.
The literature on buyer power shows that to determine the effects of buyer power on welfare, it is
very important to also consider the seller power, since that enables a firm to retain the discount it
receives from a supplier. A theoretical effect that is potentially detrimental is the waterbed effect,
where a manufacturer increases the price for small buyers when a large buyer has demanded a
discount. Innovation and product diversity decrease after the exercise of buyer power in most
models, but due to the complicated nature of collecting data on this issue it will not be investigated
further.
Based on firm-level data of Statistics Netherlands the distribution of market power between 1993
and 2007 has been investigated. This analysis is done by using the Price Cost Margin and the
Herfindahl-Hirschman Index (HHI) to indicate seller power and the Buyer Power Index and
Purchasing Cost Indicator as well as an HHI index based on purchases to indicate buyer power. It
shows that both seller and buyer power from large retail firms has increased, but only to equal the
levels that small retailers already had. Interestingly, wholesale firms, in particular large ones, have
also seen their buyer and seller power increase. Possible detrimental effects on welfare are
Buyer Power in the Clothing and Footwear Sector
4 Executive Summary | Ernst-Jan Sillem
therefore more likely to take place in this link than in the retail trade link. Manufacturers also saw
their seller power increase, indicating that they have not fallen victim to the use of buyer power by
the other two links in the industry. These results are surprising in light of the outcomes of the EIM
report (2009), where both the wholesalers and the manufacturers claimed they were suffering
from buyer power exercised by retailers.
Buyer Power in the Clothing and Footwear Sector
Tilburg University |
Table of Contents 5
TABLE OF CONTENTS
Contents Executive Summary ......................................................................................................................................................................... 3
Table of Contents .............................................................................................................................................................................. 5
1. Introduction .............................................................................................................................................................................. 7
Background ..................................................................................................................................................................................... 7
Research Question ...................................................................................................................................................................... 8
Structure........................................................................................................................................................................................... 9
2. The clothing and footwear sector ..................................................................................................................................... 10
Introduction ................................................................................................................................................................................. 10
Structure of the Clothing and Footwear sector .......................................................................................................... 10
Introduction ............................................................................................................................................................................ 10
Clothing and footwear industry and buyer power ................................................................................................... 17
Conclusion ..................................................................................................................................................................................... 19
3. Theory on Buyer Power ......................................................................................................................................................... 20
Introduction ................................................................................................................................................................................. 20
Buyer Power ................................................................................................................................................................................. 21
Causes and Effects ................................................................................................................................................................ 21
General Model ........................................................................................................................................................................ 23
Literature review ....................................................................................................................................................................... 24
Theoretical Literature ........................................................................................................................................................ 24
Empirical Literature ............................................................................................................................................................ 29
Concluding remarks on literature ..................................................................................................................................... 30
4. Analytical Framework ........................................................................................................................................................ 33
Measuring seller power .......................................................................................................................................................... 33
Three Indicators .................................................................................................................................................................... 33
Measuring Buyer Power ......................................................................................................................................................... 37
Measuring buyer power, the indicators .................................................................................................................... 37
5. Data ................................................................................................................................................................................................... 41
Data Used ....................................................................................................................................................................................... 41
Buyer Power in the Clothing and Footwear Sector
6
Table of Contents | Ernst-Jan Sillem
Other data sources ............................................................................................................................................................... 43
Summary Statistics ................................................................................................................................................................... 43
Retail Trade ............................................................................................................................................................................. 44
Wholesale ................................................................................................................................................................................. 45
Manufacturing ........................................................................................................................................................................ 46
6. Assessment of static efficiency 1993-2007 .................................................................................................................. 47
Seller power.................................................................................................................................................................................. 47
Price Cost Margin ....................................................................................................................................................................... 53
Buyer power ................................................................................................................................................................................. 56
Conclusion ..................................................................................................................................................................................... 61
7. Conclusion ..................................................................................................................................................................................... 63
8. References ..................................................................................................................................................................................... 65
Buyer Power in the Clothing and Footwear Sector
Tilburg University | 1. Introduction 7
1. INTRODUCTION
BACKGROUND
When walking through a typical mid-size town in the Netherlands nowadays, you can easily be
tricked into thinking you are in any other city, than the one you are actually in. Every town seems to
have a Hema, H&M, Manfield, C&A, Hunkemoller and Sting, among many others. These chain stores
purchase their products from wholesalers or in some cases from manufacturers directly, acting as
the intermediary between the manufacturers and the final consumer. The company behind the
shops purchases the goods in large quantities to receive quantity discounts, facilitate univocal
commercials and promotions and receive other advantages from their economies of scale.
Because the retailers’ scale is so large, and there are only a limited number of these chains present
in a country, consumers often have only a few options to purchase their preferred clothing for the
right price. If a manufacturer wants to supply these consumers, it does not have much choice but to
work with these particular large retailers. Also, a small retailer will more easily accept demands for
even lower prices, since losing the account is relative heavy burden. According to Porter (2008)
these negotiations are a normal occurrence in a healthy market: buyers want to develop bargaining
power to lower purchasing cost. This effect is opposed by the developed seller power from
suppliers to increase their price.
In recent years supplying firms have started to find fault in the increasingly larger retailers and
their use of bargaining power or, more specifically, buyer power. With the distinction between
bargaining power and buyer power made, buyer power is often defined as the possibility for
retailers to demand unfair conditions from their suppliers. In an EIM report (2009), delayed
payments, promotional cost charges, and entry fees are mentioned as examples of the abuse of
buyer power.
Even though detrimental effects on consumer welfare have not been proven empirically
(reference), the governments of France, Germany, Hungary and Spain have a competition law that
prohibits the abuse of economic dependence. No precedents have however been observed so far.
The UK has imposed a supermarket Code of Conduct, while Hungary has a general Code of Conduct
to protect supplying firms. The Netherlands closely monitors the effects of such a Code of Conduct,
Buyer Power in the Clothing and Footwear Sector
8 1. Introduction | Ernst-Jan Sillem
since a number of members of parliament have inquired about the negative effects of buyer power
and demand measures.1
RESEARCH QUESTION
This paper will investigate if buyer power is present in the clothing and footwear industry and how
it has developed over time. This sector is chosen because of the research by EIM (2009) in which
the perception of buyer power of suppliers is determined by a questionnaire. The report defines
buyer power as ‘the ability of a buyer to reduce price profitability below a supplier’s normal selling
price, or more generally the ability to obtain terms of supply more favorable than a supplier’s normal
terms. The normal selling price in turn is defined as the supplier’s profit-maximizing price in the
absence of buyer power’ following Chen (2008). It turns out that 58% of suppliers in the clothing
sector are confronted with ‘un-fair’ practices, which is highest of the four sectors analyzed in the
survey.
The suppliers in the industry argue that the use of buyer power has negative effects because
imperfections in the structure of the market, such as excessive use of market power, lead to lower
welfare in general and higher prices for consumers through deadweight losses. Among the most
significant supposed effects are a reduction in product diversity and foregone innovations by the
supplier, due to lower profits. As a solution the smaller suppliers suggest they should be protected
in a similar fashion as consumers are protected by a competition authority. This paper will
determine if the bargaining power has increased for the retailers.
The question that will be answered in this paper will be:
What is the distribution of market power between clothing and footwear retailers, wholesalers and
manufacturers, and how has it developed over time?
This question will be answered in two parts. First, a theoretical analysis will be done, based on a
review of the clothing and footwear industry and the academic literature on the issue. Buyer power,
and especially its cause and consequence for the industry, will be addressed. Also the structures
present in the clothing sector will be analyzed to see if there is a relation with buyer power. With
1 Motion Aptroot en Vos, Parliament-document II 2007-2008, nr 62 (31200-XIII), Motion Rouwe, Parliament-
documents II 2008-2009, 31531, nr. 13, Motion Van der Ham, Parliament-documents II 2008-2009, 31531, nr
14.
Buyer Power in the Clothing and Footwear Sector
Tilburg University | 1. Introduction 9
the theoretical background covered, the knowledge will be used to determine the most appropriate
indicators.
Second, an empirical analysis will be done by using the firm level data of Statistics Netherlands,
which covers a period between 1993 and 2007. Although the firm level data is the basis of the
National Accounts of Statistics Netherlands, these numbers will also be used to compare results.
Firm level data is especially suitable because it has data on single firms in well-defined branches.
Using aggregate data is not possible since most competition indicators require these firm specific
data. By using the Statistics Netherlands data it is also guaranteed that the data is comparable
between years and between firms.
To be able to appreciate the results and the implications it is important to note that the clothing and
footwear industry chain consists of three links: the retailers, wholesalers and manufacturers. Next
to that, the market of clothing and footwear is one of the most globalized markets. China is swiftly
increasing its production capacity and increasing its exports, while in Europe markets are becoming
very specialized. Even if lower prices for consumers have occurred it is important to see where
these price reduction originate and which link is paying for the reduction.
Effects of changes in market power will not be estimated in this paper, since measuring them is not
possible with the available data.
STRUCTURE
This paper is further structured as follows. As mentioned above the analysis of the clothing and
footwear market will be done in chapter two. The market structure in the Netherlands, important
import and export markets and market developments over time are some of the topics addressed in
this chapter. In the third chapter the academic literature on buyer power will be reviewed. Where
appropriate the link with the clothing and footwear industry will be made. The indicators to
measure the distribution of buyer power and the changes thereof over time will be discussed in
chapter 4. Chapter 5 will subsequently give the data sources that are suitable for the indicators.
Chapter 6 will present the empirical analysis of the firm level data on the sector, combined with
data from the National Accounts and the Eurostat. Chapter 7 will conclude.
Buyer Power in the Clothing and Footwear Sector
10 2. The clothing and footwear sector | Ernst-Jan Sillem
2. THE CLOTHING AND FOOTWEAR SECTOR
INTRODUCTION
Clothing is one of the fastest changing businesses in the world nowadays. With many different
collections per year, specific requirements by consumers in terms of size and materials, expensive
retail locations in downtown areas, and a globalizing production process, entrepreneurs need to be
on the top of their game at all times. The combination of all these effects leads to a continuously
changing market structure. To get a better understanding of the Dutch clothing and footwear
sector, first the relevant markets will be defined. Second, some basic information on the sector will
be given. Third and finally, there will be an analysis of the trends in the industry. Here I will look at
consumption patterns, prices, technological innovations, and import and export developments.
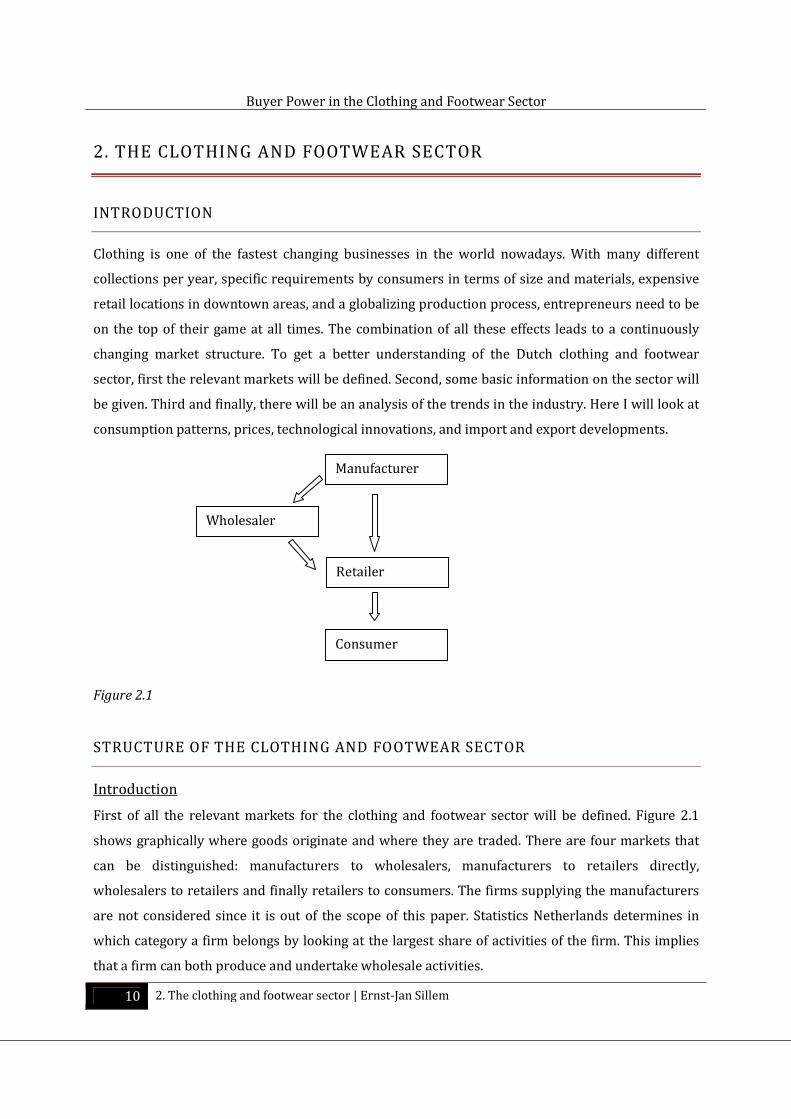
Figure 2.1
STRUCTURE OF THE CLOTHING AND FOOTWEAR SECTOR
Introduction
First of all the relevant markets for the clothing and footwear sector will be defined. Figure 2.1
shows graphically where goods originate and where they are traded. There are four markets that
can be distinguished: manufacturers to wholesalers, manufacturers to retailers directly,
wholesalers to retailers and finally retailers to consumers. The firms supplying the manufacturers
are not considered since it is out of the scope of this paper. Statistics Netherlands determines in
which category a firm belongs by looking at the largest share of activities of the firm. This implies
that a firm can both produce and undertake wholesale activities.
Manufacturer
Wholesaler
Retailer
Consumer
Buyer Power in the Clothing and Footwear Sector
Tilburg University | 2. The clothing and footwear sector 11
The clothing and footwear stores that will be analyzed in this paper are all from the Netherlands.
The national statistics offices classify them under the SIC2 codes. Detail on them can be found in
chapter five. In none of the sectors the production or trade in workers clothes is considered, since
that is also not done in the paper by EIM. The textile producing industry is also not taken into
account for the same reason. Firms from outside the Netherlands are excluded, although they can
have a strong influence on the competitive pressure on Dutch firms. This is not done since the data
is not readily available. By analyzing import and export quantities I will incorporate this in the
analysis.
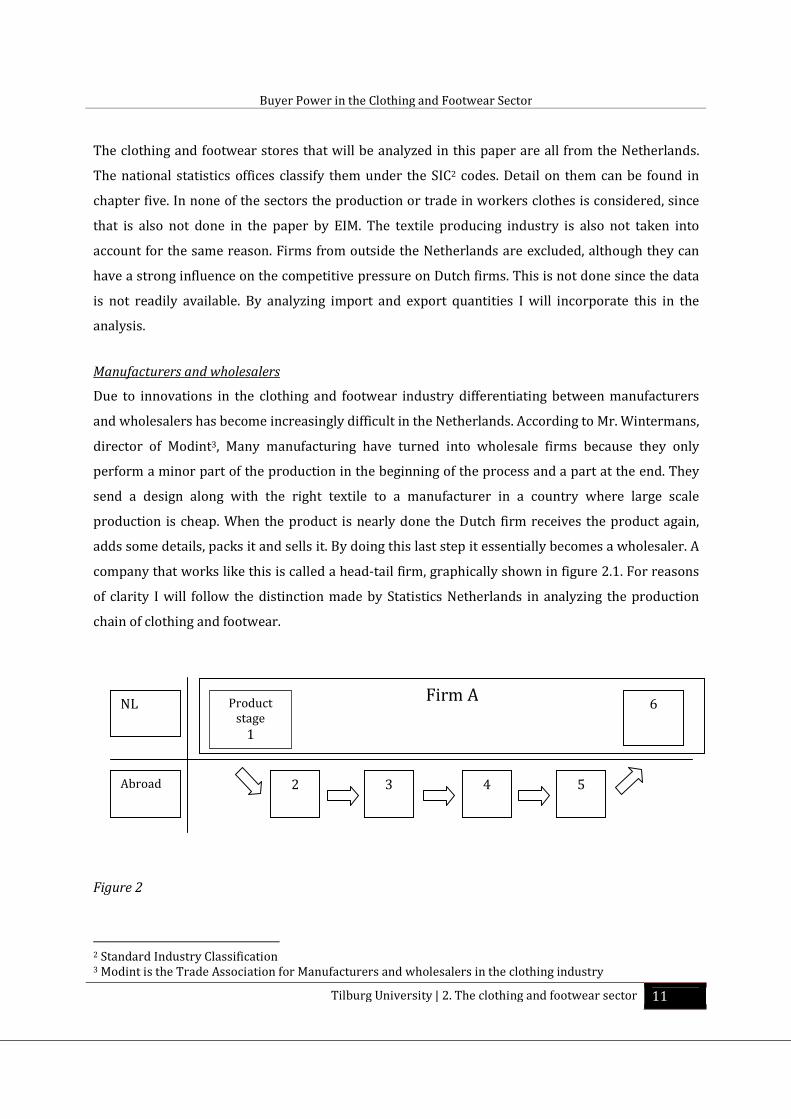
Manufacturers and wholesalers
Due to innovations in the clothing and footwear industry differentiating between manufacturers
and wholesalers has become increasingly difficult in the Netherlands. According to Mr. Wintermans,
director of Modint3, Many manufacturing have turned into wholesale firms because they only
perform a minor part of the production in the beginning of the process and a part at the end. They
send a design along with the right textile to a manufacturer in a country where large scale
production is cheap. When the product is nearly done the Dutch firm receives the product again,
adds some details, packs it and sells it. By doing this last step it essentially becomes a wholesaler. A
company that works like this is called a head-tail firm, graphically shown in figure 2.1. For reasons
of clarity I will follow the distinction made by Statistics Netherlands in analyzing the production
chain of clothing and footwear.
Figure 2
2 Standard Industry Classification 3 Modint is the Trade Association for Manufacturers and wholesalers in the clothing industry
Firm A
Product
stage
1
2 3 4 5
6 NL
Abroad
Buyer Power in the Clothing and Footwear Sector
12 2. The clothing and footwear sector | Ernst-Jan Sillem
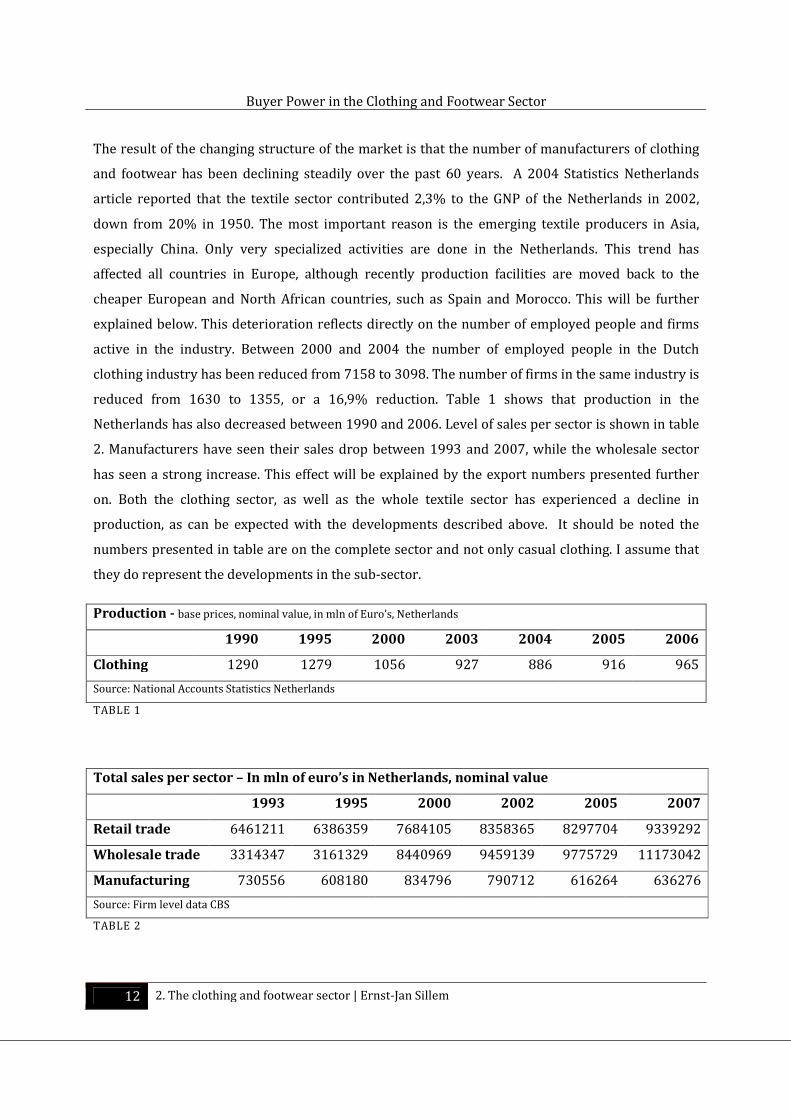
The result of the changing structure of the market is that the number of manufacturers of clothing
and footwear has been declining steadily over the past 60 years. A 2004 Statistics Netherlands
article reported that the textile sector contributed 2,3% to the GNP of the Netherlands in 2002,
down from 20% in 1950. The most important reason is the emerging textile producers in Asia,
especially China. Only very specialized activities are done in the Netherlands. This trend has
affected all countries in Europe, although recently production facilities are moved back to the
cheaper European and North African countries, such as Spain and Morocco. This will be further
explained below. This deterioration reflects directly on the number of employed people and firms
active in the industry. Between 2000 and 2004 the number of employed people in the Dutch
clothing industry has been reduced from 7158 to 3098. The number of firms in the same industry is
reduced from 1630 to 1355, or a 16,9% reduction. Table 1 shows that production in the
Netherlands has also decreased between 1990 and 2006. Level of sales per sector is shown in table
2. Manufacturers have seen their sales drop between 1993 and 2007, while the wholesale sector
has seen a strong increase. This effect will be explained by the export numbers presented further
on. Both the clothing sector, as well as the whole textile sector has experienced a decline in
production, as can be expected with the developments described above. It should be noted the
numbers presented in table are on the complete sector and not only casual clothing. I assume that
they do represent the developments in the sub-sector.
TABLE 1
TABLE 2
Production - base prices, nominal value, in mln of Euro’s, Netherlands
1990 1995 2000 2003 2004 2005 2006
Clothing 1290 1279 1056 927 886 916 965
Source: National Accounts Statistics Netherlands
Total sales per sector – In mln of euro’s in Netherlands, nominal value
1993 1995 2000 2002 2005 2007
Retail trade 6461211 6386359 7684105 8358365 8297704 9339292
Wholesale trade 3314347 3161329 8440969 9459139 9775729 11173042
Manufacturing 730556 608180 834796 790712 616264 636276
Source: Firm level data CBS
Buyer Power in the Clothing and Footwear Sector
Tilburg University | 2. The clothing and footwear sector 13
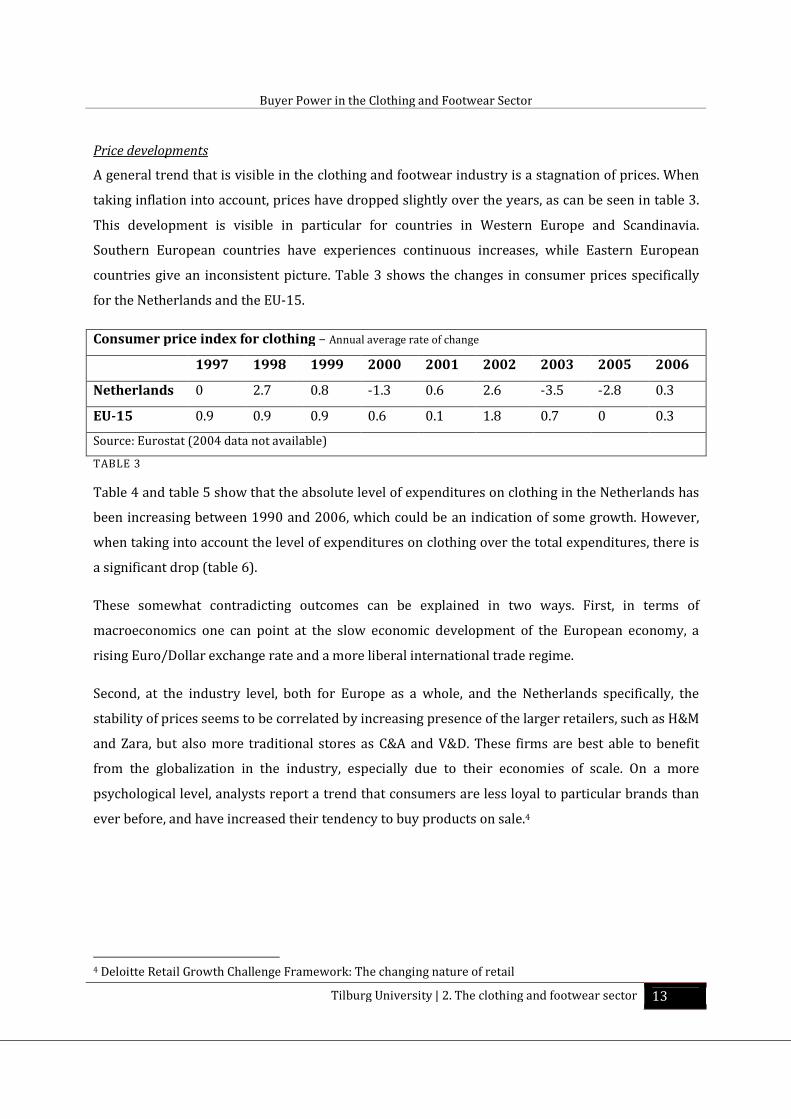
Price developments
A general trend that is visible in the clothing and footwear industry is a stagnation of prices. When
taking inflation into account, prices have dropped slightly over the years, as can be seen in table 3.
This development is visible in particular for countries in Western Europe and Scandinavia.
Southern European countries have experiences continuous increases, while Eastern European
countries give an inconsistent picture. Table 3 shows the changes in consumer prices specifically
for the Netherlands and the EU-15.
Consumer price index for clothing – Annual average rate of change
1997 1998 1999 2000 2001 2002 2003 2005 2006
Netherlands 0 2.7 0.8 -1.3 0.6 2.6 -3.5 -2.8 0.3
EU-15 0.9 0.9 0.9 0.6 0.1 1.8 0.7 0 0.3
Source: Eurostat (2004 data not available)
TABLE 3
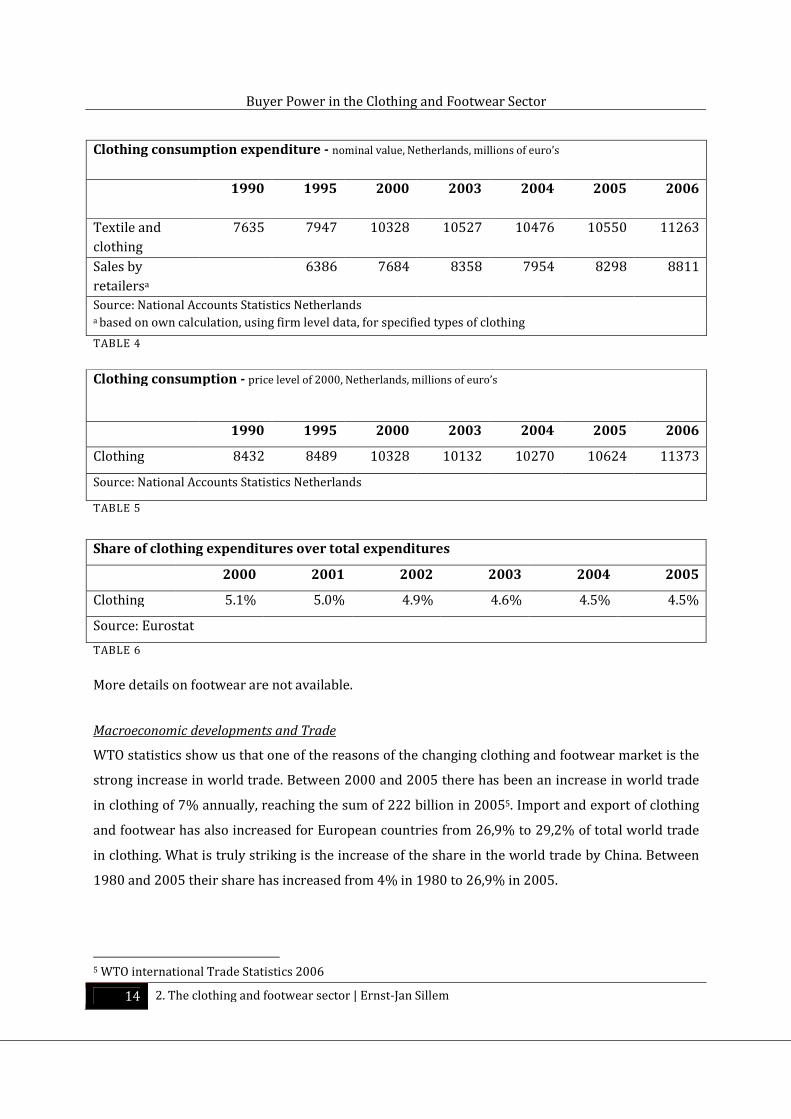
Table 4 and table 5 show that the absolute level of expenditures on clothing in the Netherlands has
been increasing between 1990 and 2006, which could be an indication of some growth. However,
when taking into account the level of expenditures on clothing over the total expenditures, there is
a significant drop (table 6).
These somewhat contradicting outcomes can be explained in two ways. First, in terms of
macroeconomics one can point at the slow economic development of the European economy, a
rising Euro/Dollar exchange rate and a more liberal international trade regime.
Second, at the industry level, both for Europe as a whole, and the Netherlands specifically, the
stability of prices seems to be correlated by increasing presence of the larger retailers, such as H&M
and Zara, but also more traditional stores as C&A and V&D. These firms are best able to benefit
from the globalization in the industry, especially due to their economies of scale. On a more
psychological level, analysts report a trend that consumers are less loyal to particular brands than
ever before, and have increased their tendency to buy products on sale.4
4 Deloitte Retail Growth Challenge Framework: The changing nature of retail
Buyer Power in the Clothing and Footwear Sector
14 2. The clothing and footwear sector | Ernst-Jan Sillem
Clothing consumption expenditure - nominal value, Netherlands, millions of euro’s
1990 1995 2000 2003 2004 2005 2006
Textile and
clothing
7635 7947 10328 10527 10476 10550 11263
Sales by
retailersa
6386 7684 8358 7954 8298 8811
Source: National Accounts Statistics Netherlands a based on own calculation, using firm level data, for specified types of clothing
TABLE 4
Clothing consumption - price level of 2000, Netherlands, millions of euro’s
1990 1995 2000 2003 2004 2005 2006
Clothing 8432 8489 10328 10132 10270 10624 11373
Source: National Accounts Statistics Netherlands
TABLE 5
TABLE 6
More details on footwear are not available.
Macroeconomic developments and Trade
WTO statistics show us that one of the reasons of the changing clothing and footwear market is the
strong increase in world trade. Between 2000 and 2005 there has been an increase in world trade
in clothing of 7% annually, reaching the sum of 222 billion in 20055. Import and export of clothing
and footwear has also increased for European countries from 26,9% to 29,2% of total world trade
in clothing. What is truly striking is the increase of the share in the world trade by China. Between
1980 and 2005 their share has increased from 4% in 1980 to 26,9% in 2005.
5 WTO international Trade Statistics 2006
Share of clothing expenditures over total expenditures
2000 2001 2002 2003 2004 2005
Clothing 5.1% 5.0% 4.9% 4.6% 4.5% 4.5%
Source: Eurostat
Buyer Power in the Clothing and Footwear Sector
Tilburg University | 2. The clothing and footwear sector 15
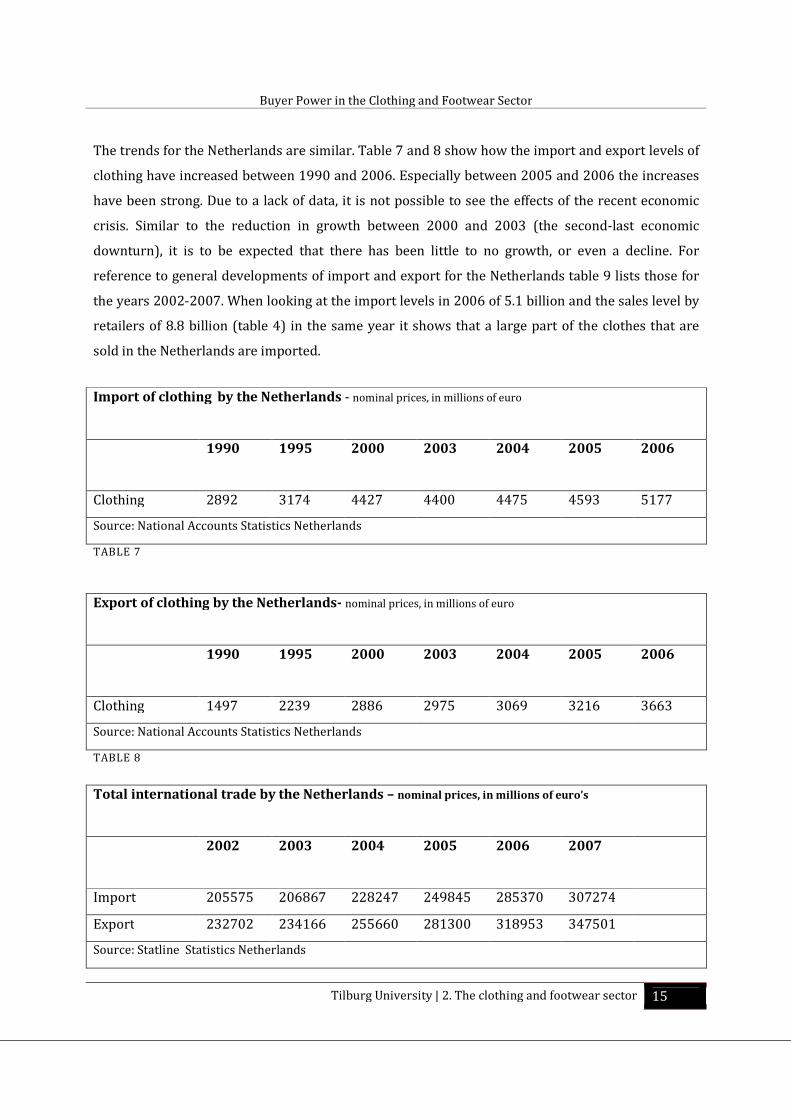
The trends for the Netherlands are similar. Table 7 and 8 show how the import and export levels of
clothing have increased between 1990 and 2006. Especially between 2005 and 2006 the increases
have been strong. Due to a lack of data, it is not possible to see the effects of the recent economic
crisis. Similar to the reduction in growth between 2000 and 2003 (the second-last economic
downturn), it is to be expected that there has been little to no growth, or even a decline. For
reference to general developments of import and export for the Netherlands table 9 lists those for
the years 2002-2007. When looking at the import levels in 2006 of 5.1 billion and the sales level by
retailers of 8.8 billion (table 4) in the same year it shows that a large part of the clothes that are
sold in the Netherlands are imported.
TABLE 7
TABLE 8
Import of clothing by the Netherlands - nominal prices, in millions of euro
1990 1995 2000 2003 2004 2005 2006
Clothing 2892 3174 4427 4400 4475 4593 5177
Source: National Accounts Statistics Netherlands
Export of clothing by the Netherlands- nominal prices, in millions of euro
1990 1995 2000 2003 2004 2005 2006
Clothing 1497 2239 2886 2975 3069 3216 3663
Source: National Accounts Statistics Netherlands
Total international trade by the Netherlands – nominal prices, in millions of euro’s
2002 2003 2004 2005 2006 2007
Import 205575 206867 228247 249845 285370 307274
Export 232702 234166 255660 281300 318953 347501
Source: Statline Statistics Netherlands
Buyer Power in the Clothing and Footwear Sector
16 2. The clothing and footwear sector | Ernst-Jan Sillem
TABLE 9
Retailers
Retailers in clothing and footwear can best be separated in two different parts. First there are the
large, international chains such as Zara, H&M and C&A, which are the largest three in Europe, all
having a turnover over five billion in 2005.6 Inditex, the company behind Zara, is present in 64
countries and has experienced a compounded annual growth rate of 15% up to 2006. H&M has
experienced even stronger growth with a 22% compounded annual growth rate over 5 years up to
2006 and is present in 24 countries.7
An interesting development that has occurred is the vertical integration that especially Zara has
implemented quite successfully (Report by Bocconi university, ESSEC Business School and Baker &
McKenzie). Of the fabrics used for the clothing, 40% is produced by Zara internally, while 50% of
production takes place internally. Combined with the fact that most of the production facilities are
located in Spain it enables Zara to make new designs continuously, produce them right away and
thereby reduce the time-to-market, increasing the turnover in stores. Although countries as
Bangladesh and India are cheaper, communication is more complex, delivery times are longer and
more uncertain. H&M has production offices in countries where its suppliers reside. They are
responsible for the production, prices and quality. The other large players in the clothing retail
industry still use more traditional supply methods, where they deal with a wholesaler or a producer
directly. Often these manufacturing firms are located in Asia.
In the Netherlands, especially the large retailers that purchase goods in the Netherlands are
accused of abusing their buyer power (Letter of Modint to Ministry of Economic Affairs, 2010). A
reason for this can be because their purchases from suppliers make up a large part of their
operating costs. A reduction in these cost will have a relatively strong effect on these costs and
therefore on profits. Another reason for the strong focus on cost reduction, indicated by Mr.
Wintermans of Modint, could be the ownership structure in place for companies as V&D, Bijenkorf,
Hunkemoller and M&S mode. Until the 8th of November these stores were all owned by Maxeda,
which was in turn owned by private-equity firms. These private equity firms are often said to load
up the firms with debt, possibly reducing profits artificially. Not all clothing retailers are owned by
private equity firms: Tesco and Marks and Spencer (public firms) and C&A (family owned) are all
6 Deloitte, Global power of retailing, 2007 7 Deloitte, Global power of retailing, 2007 and website information
Buyer Power in the Clothing and Footwear Sector
Tilburg University | 2. The clothing and footwear sector 17
major players in clothing retail in the world and because of their corporate structure less likely to
pill up debt.
The other part of the retailers in the Netherlands consists of the smaller retailers. They typically
have one to five stores in 1-3 cities with a limited number of employees. There are assumed to have
more national suppliers. They have a number of disadvantages compared to the larger stores, the
most important one being the lack of economies of scale and scope. Since this part of the sector is so
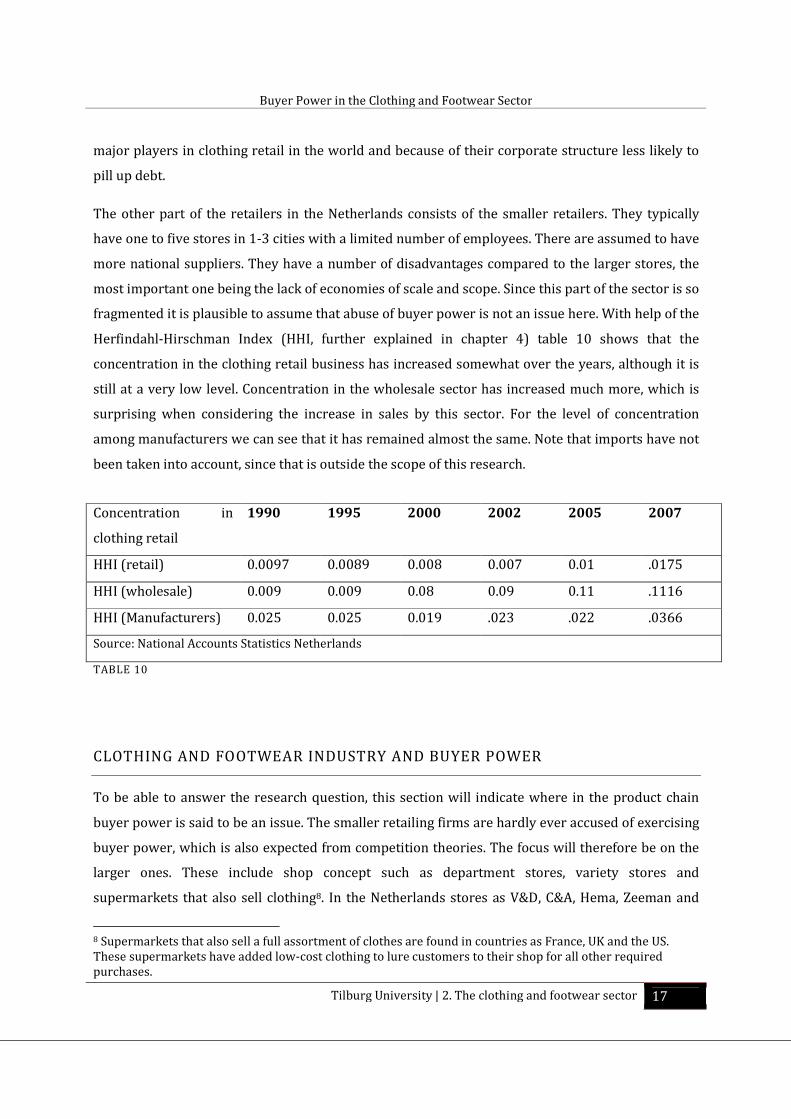
fragmented it is plausible to assume that abuse of buyer power is not an issue here. With help of the
Herfindahl-Hirschman Index (HHI, further explained in chapter 4) table 10 shows that the
concentration in the clothing retail business has increased somewhat over the years, although it is
still at a very low level. Concentration in the wholesale sector has increased much more, which is
surprising when considering the increase in sales by this sector. For the level of concentration
among manufacturers we can see that it has remained almost the same. Note that imports have not
been taken into account, since that is outside the scope of this research.
TABLE 10
CLOTHING AND FOOTWEAR INDUSTRY AND BUYER POWER
To be able to answer the research question, this section will indicate where in the product chain
buyer power is said to be an issue. The smaller retailing firms are hardly ever accused of exercising
buyer power, which is also expected from competition theories. The focus will therefore be on the
larger ones. These include shop concept such as department stores, variety stores and
supermarkets that also sell clothing8. In the Netherlands stores as V&D, C&A, Hema, Zeeman and
8 Supermarkets that also sell a full assortment of clothes are found in countries as France, UK and the US.
These supermarkets have added low-cost clothing to lure customers to their shop for all other required
purchases.
Concentration in
clothing retail
1990 1995 2000 2002 2005 2007
HHI (retail) 0.0097 0.0089 0.008 0.007 0.01 .0175
HHI (wholesale) 0.009 0.009 0.08 0.09 0.11 .1116
HHI (Manufacturers) 0.025 0.025 0.019 .023 .022 .0366
Source: National Accounts Statistics Netherlands
Buyer Power in the Clothing and Footwear Sector
18 2. The clothing and footwear sector | Ernst-Jan Sillem
Scapino are examples of stores that could be considered as variety stores. All of these stores have
an international presence or are part of a larger retailer group. Since the data used in this paper is
anonymous it is not possible to make statements about individual firms.
Although not directly leading to bankruptcy for smaller manufacturers, unfair practices by large
retailers are often mentioned as an illustration of the abuse of buyer power. Practices that
manufacturers consider as unfair are, among others: imposition of fixed entry fees, the automatic
charge of promotional costs, unjustified penalties for minor or unproven infringements of the
contract (“charge backs”), the imposed return of unsold goods, systematic delays in payments, and
the unfair appropriation of stylistic innovation included in collections. An example provided by Mr.
Wintermans is a letter that is send out by V&D, announcing a reduction of 2% on the next payable
bill, as a contribution to the renovation of its buildings. Modint, speaking on behalf of the
manufacturers, agrees that competition is useful on the market, but that the buyers need to stick to
their contracts. Running a business becomes increasingly harder when there is more uncertainty,
especially for smaller firms with small capital buffers. This undermines the function of the market,
which can possibly result in higher prices and lower stocks. Mr. Wintermans added that especially
the private label producers are particularly vulnerable for these unfair practices, because they are
easily interchangeable.
Opponents of this theory argue that contracts are legally binding so breaking them open without
consent gives the possibility to go to court and demand payment. Another argument often used is
that it is nothing less than regular competition. If you do not agree with the change in terms you
simply stop supplying this buyer. Manufacturers will in turn argue that after a contract is signed
and orders are made, it is often impossible to simply stop supplying, due to costs that have already
been incurred
In the EIM report (2009) the authors have surveyed a sample of manufacturers and wholesalers to
determine to what degree they are affected by the exercise of buyer power by their buyers. In order
to get a better understanding of experienced buyer power by these two links in the clothing and
footwear sector the relevant outcome will shortly be discussed here. Of the surveyed firms 63%
report that their negotiation position to their buyers is strong or very strong, while 35% percent
report a weak or very weak position. For 65% of the manufacturers and wholesalers their
negotiation position has either remained the same or increased over the past 5 years, whereas the
other 35% of the firms report a weaker position over the same period. The unfair practices that
Buyer Power in the Clothing and Footwear Sector
Tilburg University | 2. The clothing and footwear sector 19
have been mentioned above are experienced in a strong fashion by 26% of the firms, while 32%
experience it to a certain extent. 41% of the firms do not have the feeling their buyers have posed
unreasonable and unfair conditions. Since one-sided changes in contracts are a problem in
particularly for manufacturers and wholesalers that use contracts, this has also been investigated
by EIM (2009). They report that 86% of the firms have experienced a one sided change in contracts
by buyers in the past years. This equals 42% of all the firms that have been surveyed. Interestingly,
50% of the manufacturers and wholesalers renegotiate with the buyers after they have made an
unreasonable proposal, while 29% simply stops doing business with them, and 5% brings the buyer
to court. At first glance it seems as though many of the manufacturers and wholesalers do not
simply accept the unfair terms. There is no information on the outcome of the negotiations.
CONCLUSION
It has become clear that a number of important changes have occurred in the clothing and footwear
industry in the past decades. The clothing and footwear manufacturing sector in the Netherlands
has shrunk notably, leading to fewer firms, employees and production. Prices have remained
roughly constant over time, thereby not keeping up with inflation. The loss in national production
has been made up by a growth in the wholesale sector, possible through increased imports from
Asia.
Another important development is the changing structure of the retail side of the market. More and
more, large, international firms set up retail networks to achieve economies of scale, while also
attempting vertical integration. Retailers that are large, but not vertically integrated, are sometimes
accused of abusing their buyer power.
The next chapter will describe the theoretical framework behind buyer power. The link between
the developments in the clothing and footwear industry and buyer power will be explained further.
Buyer Power in the Clothing and Footwear Sector
20 3. Theory on Buyer Power | Ernst-Jan Sillem
3. THEORY ON BUYER POWER
INTRODUCTION
Buyer power has been acknowledged as a part of competition ever since firms had to compete. Only
more recently buyer power is seen as potentially detrimental to welfare. Galbraith (1952) was the
first to mention that seller power may cause buyers to become larger to neutralize this power. He
observed that market power is not only limited to seller power and competition among sellers, but
also to the market power of firms on the buying side of the market. Most competitive regulation
however focuses on selling power and in particular seller power detrimental for consumers.
Chapter two already mentioned that manufacturers oppose buyer power because it makes buyers
change contracts and not comply with terms, both practices by which producers can be seriously
harmed. In a strict economic approach, this is not a problem per se. If other suppliers are more
efficient and thereby cheaper, the buyer demands the same conditions from all suppliers. If none of
the supplier is able or willing to do it for that price, the buyer will eventually pay a higher price.
In the recent literature, buyer power is analysed in a variety of models. Under certain conditions
those models result in a detrimental effect for welfare, while other conditions and other models fail
to find such an effect. To develop a better understanding of buyer power, the most important
models and empirical findings will be outlined in the third part of this chapter. Before proceeding to
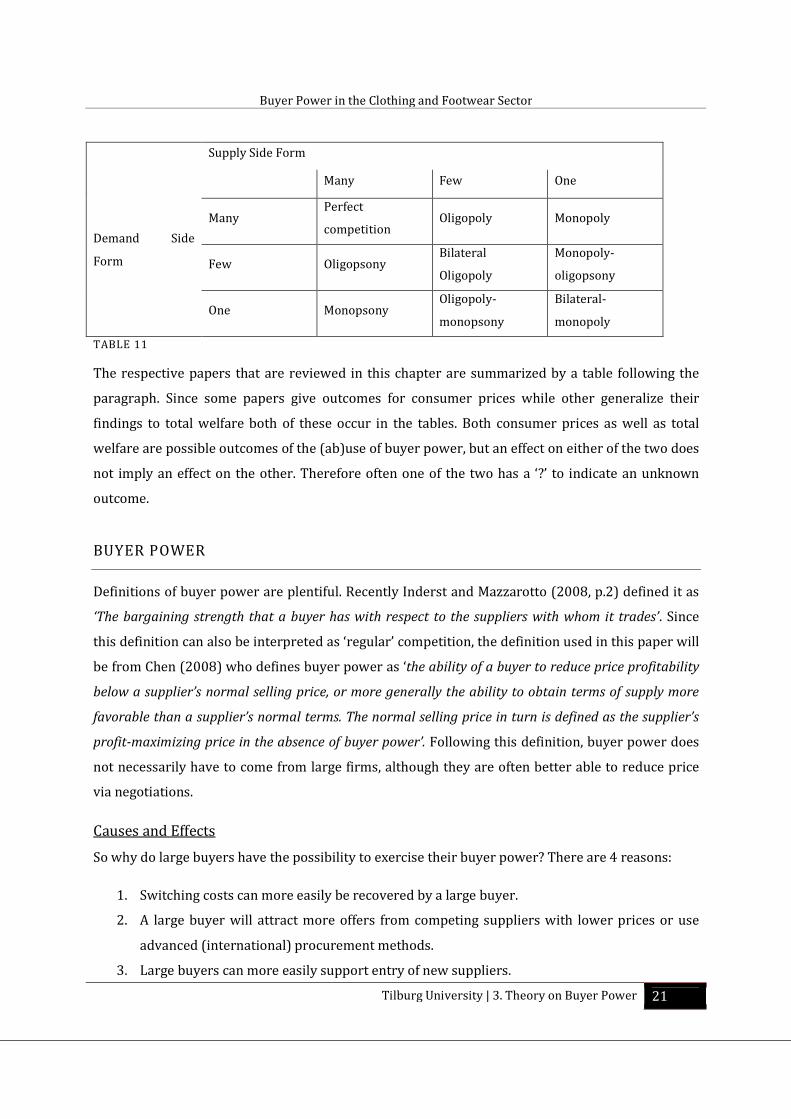
the models, a general concept of buyer power will be presented. Table 11 provides a rough sketch
of possible types of market structures, developed by Von Stackelberg (1939). Typically, buyer
power can be found in situations where there are only one or a few firms on the demand side of the
market, which is presented in the bottom two rows of the table. In the clothing and footwear
industry we have seen that there are both many suppliers and many buyers. What is important to
observe is the fact that some of the retailers are much larger than the suppliers, and can therefore
account for large parts of supplier’s capacity.
Buyer Power in the Clothing and Footwear Sector
Tilburg University | 3. Theory on Buyer Power 21
Supply Side Form
Demand Side
Form
Many Few One
Many Perfect
competition Oligopoly Monopoly
Few Oligopsony Bilateral
Oligopoly
Monopoly-
oligopsony
One Monopsony Oligopoly-
monopsony
Bilateral-
monopoly
TABLE 11
The respective papers that are reviewed in this chapter are summarized by a table following the
paragraph. Since some papers give outcomes for consumer prices while other generalize their
findings to total welfare both of these occur in the tables. Both consumer prices as well as total
welfare are possible outcomes of the (ab)use of buyer power, but an effect on either of the two does
not imply an effect on the other. Therefore often one of the two has a ‘?’ to indicate an unknown
outcome.
BUYER POWER
Definitions of buyer power are plentiful. Recently Inderst and Mazzarotto (2008, p.2) defined it as
‘The bargaining strength that a buyer has with respect to the suppliers with whom it trades’. Since
this definition can also be interpreted as ‘regular’ competition, the definition used in this paper will
be from Chen (2008) who defines buyer power as ‘the ability of a buyer to reduce price profitability
below a supplier’s normal selling price, or more generally the ability to obtain terms of supply more
favorable than a supplier’s normal terms. The normal selling price in turn is defined as the supplier’s
profit-maximizing price in the absence of buyer power’. Following this definition, buyer power does
not necessarily have to come from large firms, although they are often better able to reduce price
via negotiations.
Causes and Effects
So why do large buyers have the possibility to exercise their buyer power? There are 4 reasons:
1. Switching costs can more easily be recovered by a large buyer.
2. A large buyer will attract more offers from competing suppliers with lower prices or use
advanced (international) procurement methods.
3. Large buyers can more easily support entry of new suppliers.
Buyer Power in the Clothing and Footwear Sector
22 3. Theory on Buyer Power | Ernst-Jan Sillem
4. Because of the size advantages a large buyer can also integrate backwards, assuming some
or all of the work of the supplier. This varies from setting up an own brand as a private
label, to setting up a complete production facility.
5. The supplier has no choice but the supply the buyer. In this situation the buyer is called a
gatekeeper.
Politicians are concerned about the consequences of buyer power as is shown by the motions that
have recently been introduced by Dutch members of parliament.9 They have similar concerns as
those listed in EIM (2009), which indicates five possible outcomes of the use of buyer power by
buyers. All of these are also mentioned by many of the papers on buyer power which can be found
in the next chapter.
• Innovation increase/decrease
• Higher costs
• Lower profit margins
• Decreasing number of suppliers
• Lower quality and variety
Waterbed Effect
An effect that follows from the second and third outcome mentioned above is the waterbed effect. It
implies that the seller gives a discount to the large buyer, possible resulting in a higher price and
lower quantity for the smaller buyers because the seller makes up for lost profit he used to have
from the large buyer. The effect on total welfare depends on the size of the waterbed effect which in
turn depends on the size of the small buyers and the terms of the contract.
As can be seen, the use of buyer power by retailers can affect supplying firms, other retailers as well
as consumers. When considering the clothing and footwear retail sector, it seems unlikely that
product variety has been reduced. For the other effects of buyer power, it is not yet possible to say
how they have influenced welfare.
9 Motion Aptroot en Vos, Parliament-document II 2007-2008, nr 62 (31200-XIII), Motion Rouwe, Parliament-
documents II 2008-2009, 31531, nr. 13, Motion Van der Ham, Parliament-documents II 2008-2009, 31531, nr
14.
Buyer Power in the Clothing and Footwear Sector
Tilburg University | 3. Theory on Buyer Power 23
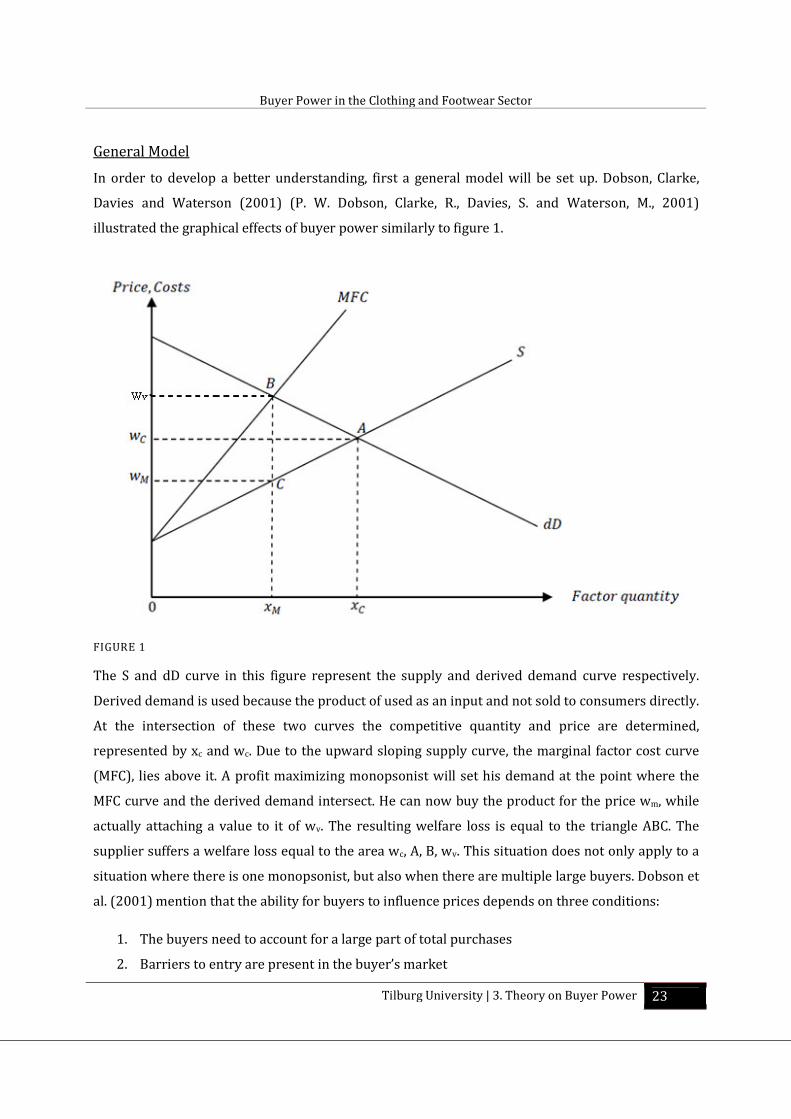
General Model
In order to develop a better understanding, first a general model will be set up. Dobson, Clarke,
Davies and Waterson (2001) (P. W. Dobson, Clarke, R., Davies, S. and Waterson, M., 2001)
illustrated the graphical effects of buyer power similarly to figure 1.
FIGURE 1
The S and dD curve in this figure represent the supply and derived demand curve respectively.
Derived demand is used because the product of used as an input and not sold to consumers directly.
At the intersection of these two curves the competitive quantity and price are determined,
represented by xc and wc. Due to the upward sloping supply curve, the marginal factor cost curve
(MFC), lies above it. A profit maximizing monopsonist will set his demand at the point where the
MFC curve and the derived demand intersect. He can now buy the product for the price wm, while
actually attaching a value to it of wv. The resulting welfare loss is equal to the triangle ABC. The
supplier suffers a welfare loss equal to the area wc, A, B, wv. This situation does not only apply to a
situation where there is one monopsonist, but also when there are multiple large buyers. Dobson et
al. (2001) mention that the ability for buyers to influence prices depends on three conditions:
1. The buyers need to account for a large part of total purchases
2. Barriers to entry are present in the buyer’s market
Buyer Power in the Clothing and Footwear Sector
24 3. Theory on Buyer Power | Ernst-Jan Sillem
3. The supply curve is upward sloping
Extensions on this very general model, such as different types of up and/or downstream
competition and limited number of time periods will be analysed in the remainder of this chapter.
LITERATURE REVIEW
Now that we have developed a basic model of buyer power, the next step is to analyse the different
models that have been used to see the effects of buyer power. Many papers try to find if large,
powerful buyers have an effect on the consumer price, product diversity, product quality and
innovations.
Theoretical Literature
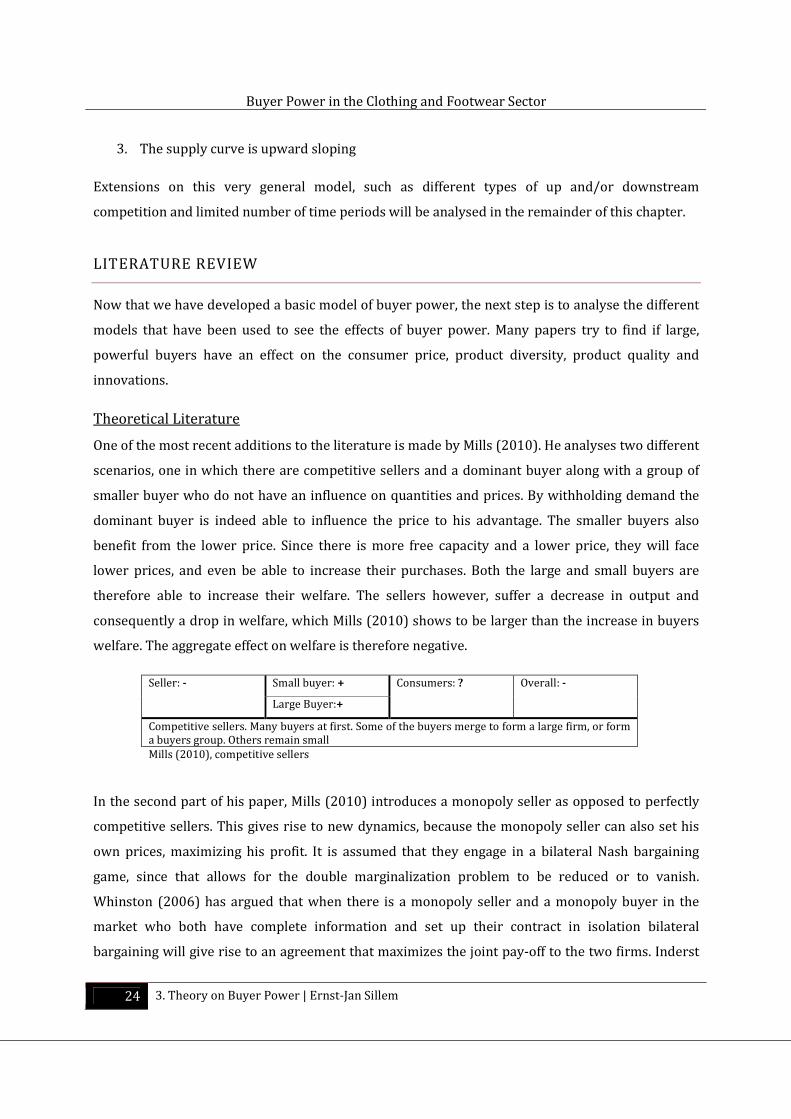
One of the most recent additions to the literature is made by Mills (2010). He analyses two different
scenarios, one in which there are competitive sellers and a dominant buyer along with a group of
smaller buyer who do not have an influence on quantities and prices. By withholding demand the
dominant buyer is indeed able to influence the price to his advantage. The smaller buyers also
benefit from the lower price. Since there is more free capacity and a lower price, they will face
lower prices, and even be able to increase their purchases. Both the large and small buyers are
therefore able to increase their welfare. The sellers however, suffer a decrease in output and
consequently a drop in welfare, which Mills (2010) shows to be larger than the increase in buyers
welfare. The aggregate effect on welfare is therefore negative.
Seller: - Small buyer: + Consumers: ? Overall: -
Large Buyer:+
Competitive sellers. Many buyers at first. Some of the buyers merge to form a large firm, or form
a buyers group. Others remain small
Mills (2010), competitive sellers
In the second part of his paper, Mills (2010) introduces a monopoly seller as opposed to perfectly
competitive sellers. This gives rise to new dynamics, because the monopoly seller can also set his
own prices, maximizing his profit. It is assumed that they engage in a bilateral Nash bargaining
game, since that allows for the double marginalization problem to be reduced or to vanish.
Whinston (2006) has argued that when there is a monopoly seller and a monopoly buyer in the
market who both have complete information and set up their contract in isolation bilateral
bargaining will give rise to an agreement that maximizes the joint pay-off to the two firms. Inderst
Buyer Power in the Clothing and Footwear Sector
Tilburg University | 3. Theory on Buyer Power 25
and Mazzarotto (2008) go into further detail on bargaining, indicating that quantity forcing
contracts and two part tariffs are often used to split up the surplus. In this scenario the large seller
and buyer first negotiate about a quantity and a price. The price is based on the cost that the two
firms will have, and the surplus that remains. The bargaining is about how to split this surplus.
Which of the two receives most of the surplus depends on the bargaining power and its outside
options.
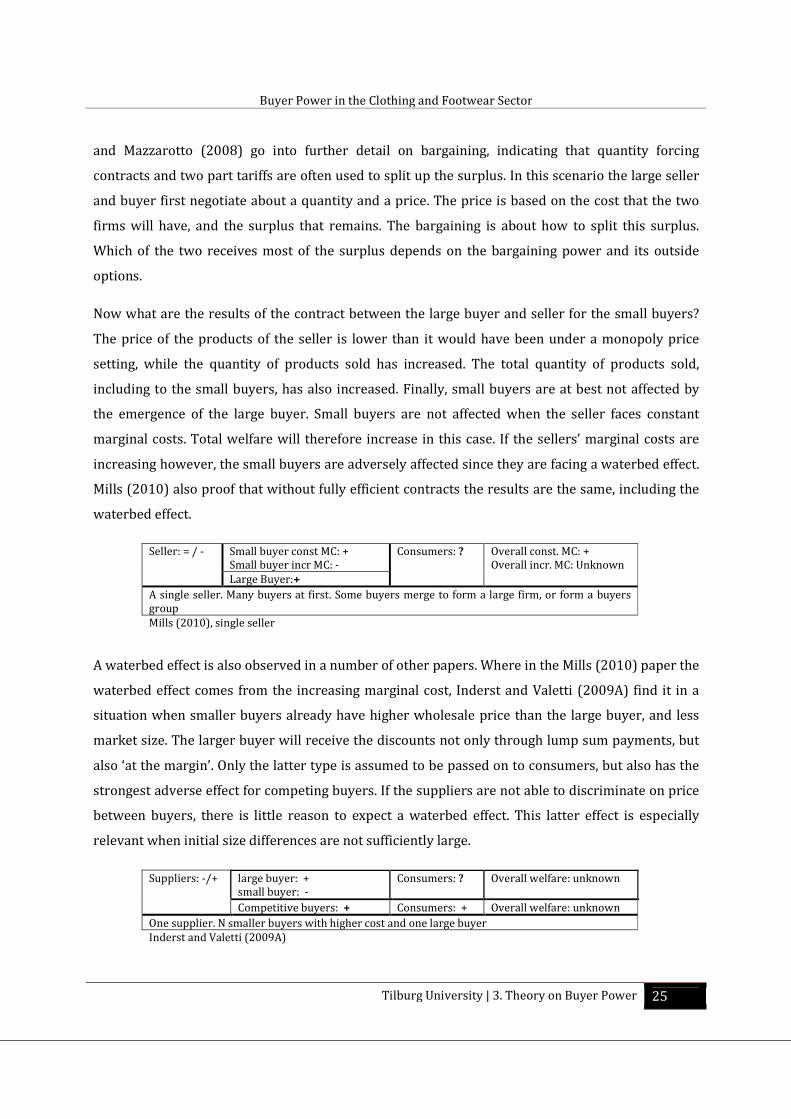
Now what are the results of the contract between the large buyer and seller for the small buyers?
The price of the products of the seller is lower than it would have been under a monopoly price
setting, while the quantity of products sold has increased. The total quantity of products sold,
including to the small buyers, has also increased. Finally, small buyers are at best not affected by
the emergence of the large buyer. Small buyers are not affected when the seller faces constant
marginal costs. Total welfare will therefore increase in this case. If the sellers’ marginal costs are
increasing however, the small buyers are adversely affected since they are facing a waterbed effect.
Mills (2010) also proof that without fully efficient contracts the results are the same, including the
waterbed effect.
Seller: = / - Small buyer const MC: +
Small buyer incr MC: -
Consumers: ? Overall const. MC: +
Overall incr. MC: Unknown
Large Buyer:+
A single seller. Many buyers at first. Some buyers merge to form a large firm, or form a buyers
group
Mills (2010), single seller
A waterbed effect is also observed in a number of other papers. Where in the Mills (2010) paper the
waterbed effect comes from the increasing marginal cost, Inderst and Valetti (2009A) find it in a
situation when smaller buyers already have higher wholesale price than the large buyer, and less
market size. The larger buyer will receive the discounts not only through lump sum payments, but
also ‘at the margin’. Only the latter type is assumed to be passed on to consumers, but also has the
strongest adverse effect for competing buyers. If the suppliers are not able to discriminate on price
between buyers, there is little reason to expect a waterbed effect. This latter effect is especially
relevant when initial size differences are not sufficiently large.
Suppliers: -/+ large buyer: +
small buyer: -
Consumers: ? Overall welfare: unknown
Competitive buyers: + Consumers: + Overall welfare: unknown
One supplier. N smaller buyers with higher cost and one large buyer
Inderst and Valetti (2009A)
Buyer Power in the Clothing and Footwear Sector
26 3. Theory on Buyer Power | Ernst-Jan Sillem
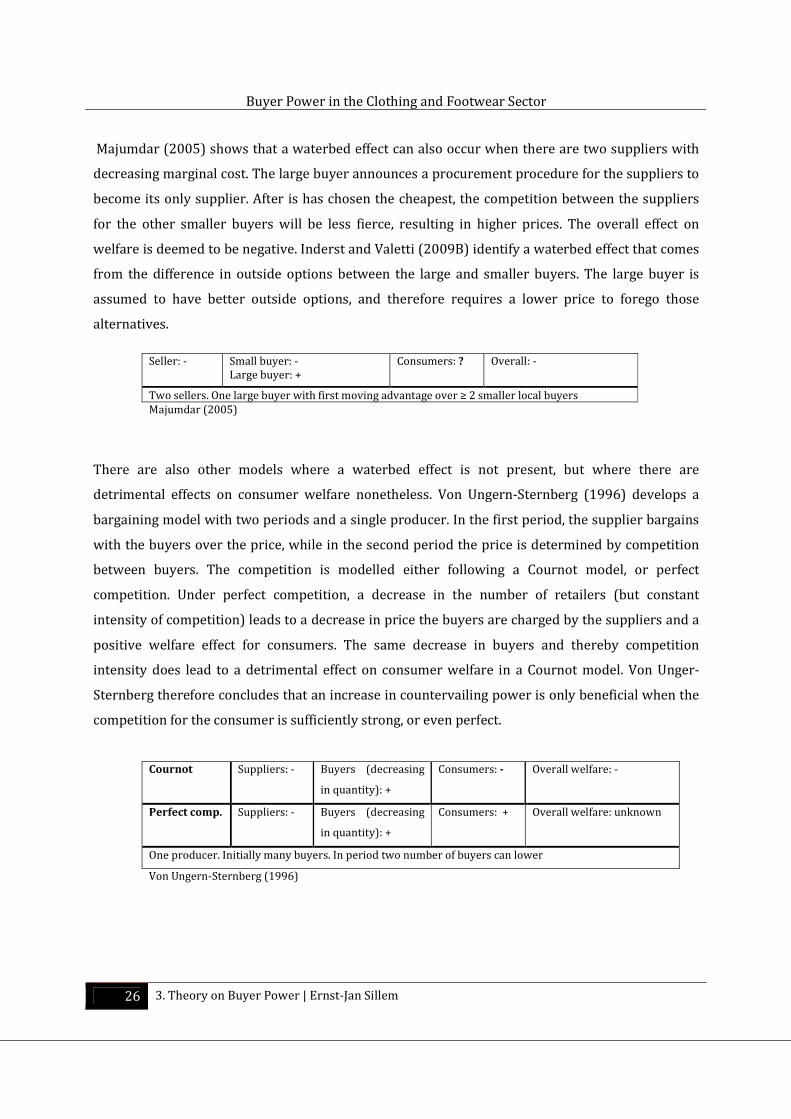
Majumdar (2005) shows that a waterbed effect can also occur when there are two suppliers with
decreasing marginal cost. The large buyer announces a procurement procedure for the suppliers to
become its only supplier. After is has chosen the cheapest, the competition between the suppliers
for the other smaller buyers will be less fierce, resulting in higher prices. The overall effect on
welfare is deemed to be negative. Inderst and Valetti (2009B) identify a waterbed effect that comes
from the difference in outside options between the large and smaller buyers. The large buyer is
assumed to have better outside options, and therefore requires a lower price to forego those
alternatives.
Seller: - Small buyer: -
Large buyer: +
Consumers: ? Overall: -
Two sellers. One large buyer with first moving advantage over ≥ 2 smaller local buyers
Majumdar (2005)
There are also other models where a waterbed effect is not present, but where there are
detrimental effects on consumer welfare nonetheless. Von Ungern-Sternberg (1996) develops a
bargaining model with two periods and a single producer. In the first period, the supplier bargains
with the buyers over the price, while in the second period the price is determined by competition
between buyers. The competition is modelled either following a Cournot model, or perfect
competition. Under perfect competition, a decrease in the number of retailers (but constant
intensity of competition) leads to a decrease in price the buyers are charged by the suppliers and a
positive welfare effect for consumers. The same decrease in buyers and thereby competition
intensity does lead to a detrimental effect on consumer welfare in a Cournot model. Von Unger-
Sternberg therefore concludes that an increase in countervailing power is only beneficial when the
competition for the consumer is sufficiently strong, or even perfect.
Cournot Suppliers: - Buyers (decreasing
in quantity): +
Consumers: - Overall welfare: -
Perfect comp. Suppliers: - Buyers (decreasing
in quantity): +
Consumers: + Overall welfare: unknown
One producer. Initially many buyers. In period two number of buyers can lower
Von Ungern-Sternberg (1996)
Buyer Power in the Clothing and Footwear Sector
Tilburg University | 3. Theory on Buyer Power 27
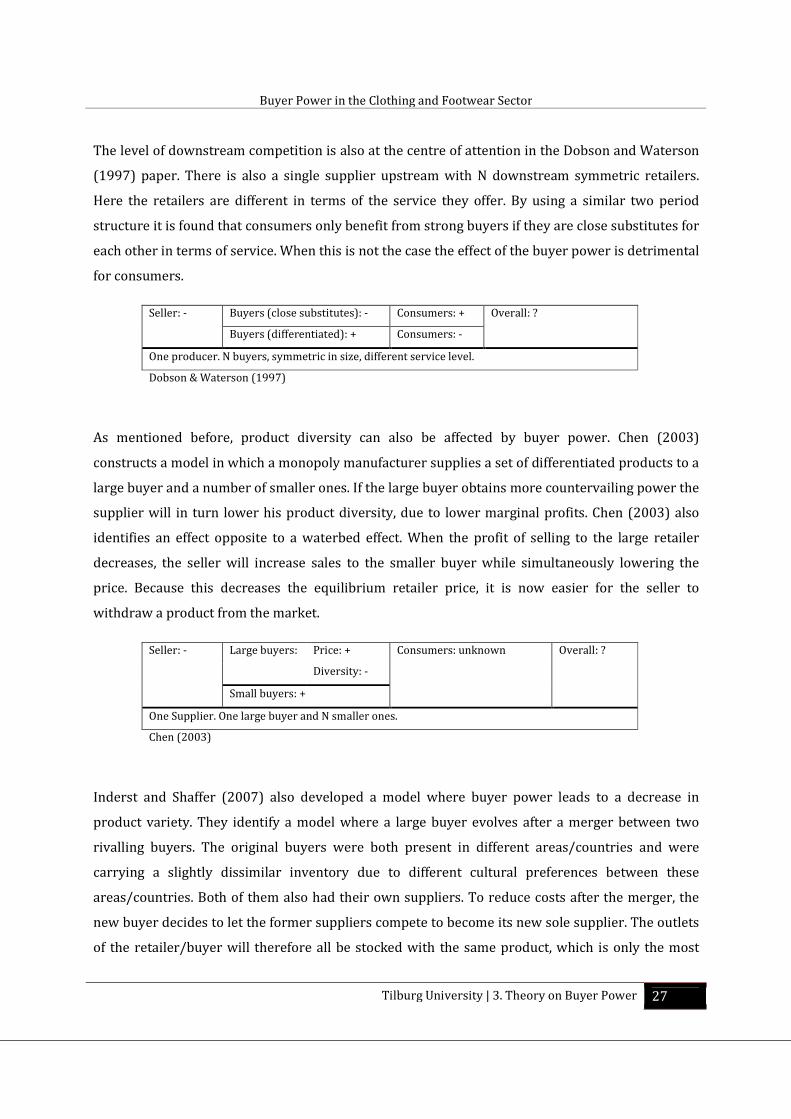
The level of downstream competition is also at the centre of attention in the Dobson and Waterson
(1997) paper. There is also a single supplier upstream with N downstream symmetric retailers.
Here the retailers are different in terms of the service they offer. By using a similar two period
structure it is found that consumers only benefit from strong buyers if they are close substitutes for
each other in terms of service. When this is not the case the effect of the buyer power is detrimental
for consumers.
Seller: - Buyers (close substitutes): - Consumers: + Overall: ?
Buyers (differentiated): + Consumers: -
One producer. N buyers, symmetric in size, different service level.
Dobson & Waterson (1997)
As mentioned before, product diversity can also be affected by buyer power. Chen (2003)
constructs a model in which a monopoly manufacturer supplies a set of differentiated products to a
large buyer and a number of smaller ones. If the large buyer obtains more countervailing power the
supplier will in turn lower his product diversity, due to lower marginal profits. Chen (2003) also
identifies an effect opposite to a waterbed effect. When the profit of selling to the large retailer
decreases, the seller will increase sales to the smaller buyer while simultaneously lowering the
price. Because this decreases the equilibrium retailer price, it is now easier for the seller to
withdraw a product from the market.
Seller: - Large buyers: Price: + Consumers: unknown Overall: ?
Diversity: -
Small buyers: +
One Supplier. One large buyer and N smaller ones.
Chen (2003)
Inderst and Shaffer (2007) also developed a model where buyer power leads to a decrease in
product variety. They identify a model where a large buyer evolves after a merger between two
rivalling buyers. The original buyers were both present in different areas/countries and were
carrying a slightly dissimilar inventory due to different cultural preferences between these
areas/countries. Both of them also had their own suppliers. To reduce costs after the merger, the
new buyer decides to let the former suppliers compete to become its new sole supplier. The outlets
of the retailer/buyer will therefore all be stocked with the same product, which is only the most
Buyer Power in the Clothing and Footwear Sector
28 3. Theory on Buyer Power | Ernst-Jan Sillem
preferred in one of the two countries. The product will be less well suited for the other country,
consequently reducing welfare there.
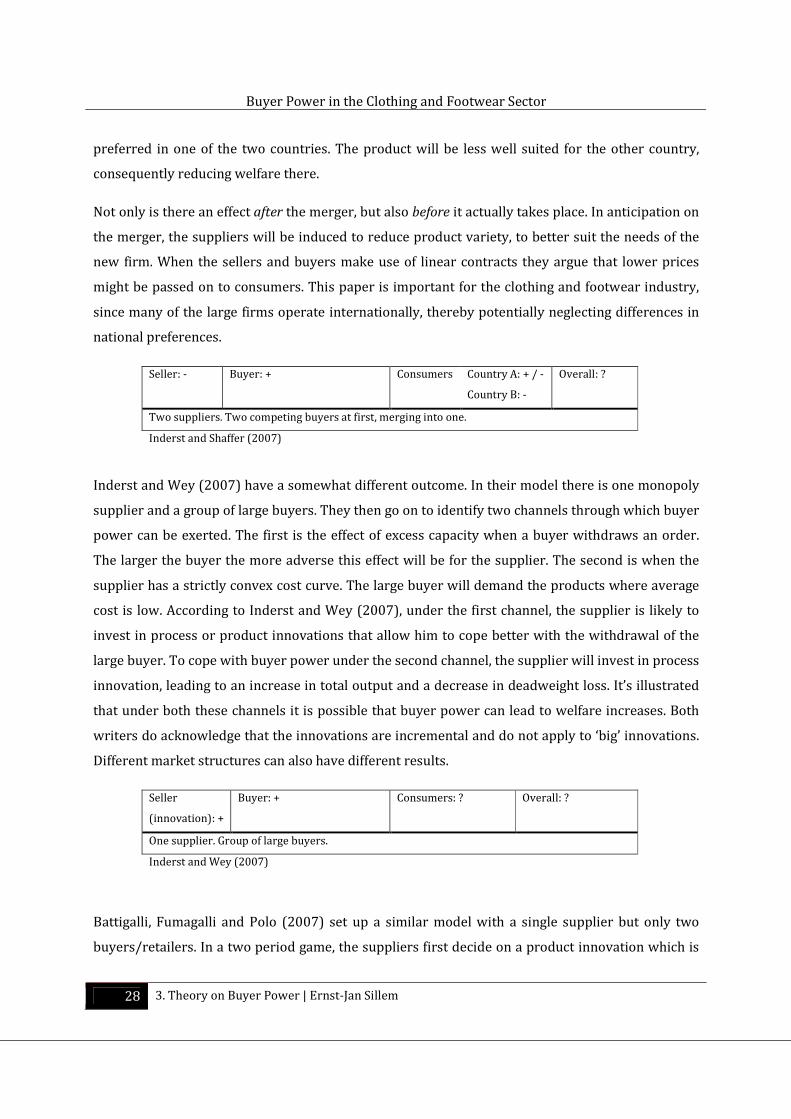
Not only is there an effect after the merger, but also before it actually takes place. In anticipation on
the merger, the suppliers will be induced to reduce product variety, to better suit the needs of the
new firm. When the sellers and buyers make use of linear contracts they argue that lower prices
might be passed on to consumers. This paper is important for the clothing and footwear industry,
since many of the large firms operate internationally, thereby potentially neglecting differences in
national preferences.
Seller: - Buyer: + Consumers Country A: + / -
Country B: -
Overall: ?
Two suppliers. Two competing buyers at first, merging into one.
Inderst and Shaffer (2007)
Inderst and Wey (2007) have a somewhat different outcome. In their model there is one monopoly
supplier and a group of large buyers. They then go on to identify two channels through which buyer
power can be exerted. The first is the effect of excess capacity when a buyer withdraws an order.
The larger the buyer the more adverse this effect will be for the supplier. The second is when the
supplier has a strictly convex cost curve. The large buyer will demand the products where average
cost is low. According to Inderst and Wey (2007), under the first channel, the supplier is likely to
invest in process or product innovations that allow him to cope better with the withdrawal of the
large buyer. To cope with buyer power under the second channel, the supplier will invest in process
innovation, leading to an increase in total output and a decrease in deadweight loss. It’s illustrated
that under both these channels it is possible that buyer power can lead to welfare increases. Both
writers do acknowledge that the innovations are incremental and do not apply to ‘big’ innovations.
Different market structures can also have different results.
Seller
(innovation): +
Buyer: + Consumers: ? Overall: ?
One supplier. Group of large buyers.
Inderst and Wey (2007)
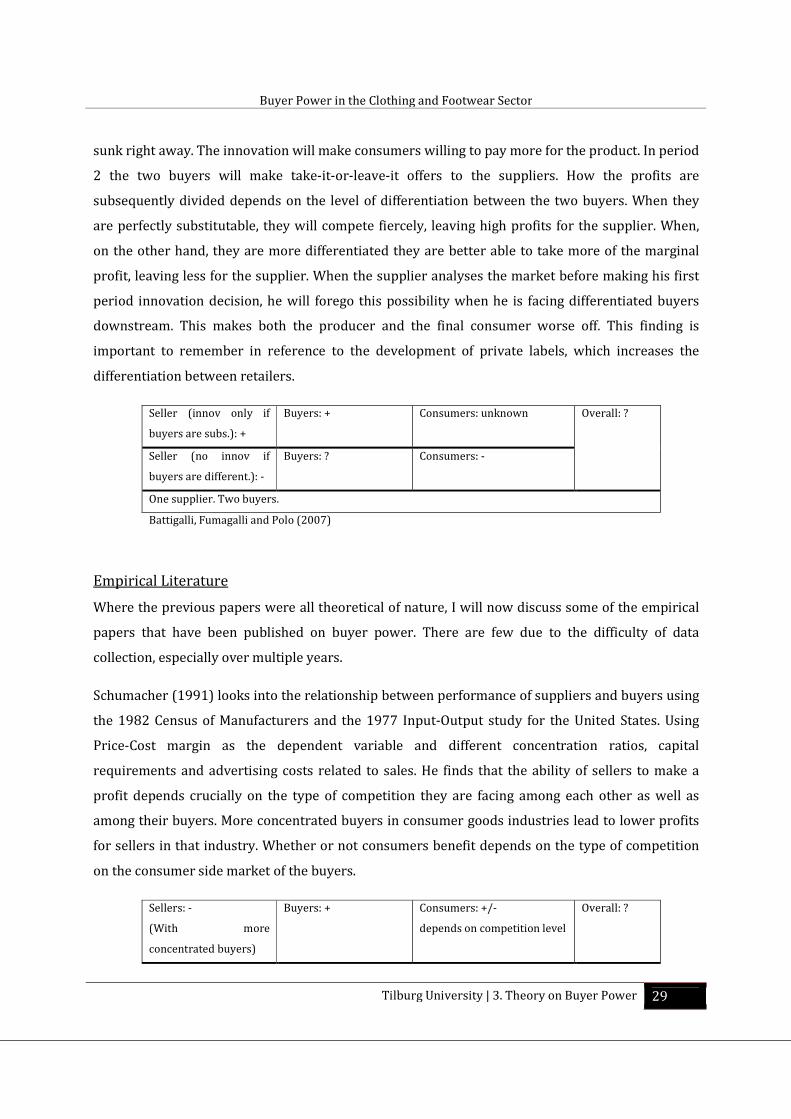
Battigalli, Fumagalli and Polo (2007) set up a similar model with a single supplier but only two
buyers/retailers. In a two period game, the suppliers first decide on a product innovation which is
Buyer Power in the Clothing and Footwear Sector
Tilburg University | 3. Theory on Buyer Power 29
sunk right away. The innovation will make consumers willing to pay more for the product. In period
2 the two buyers will make take-it-or-leave-it offers to the suppliers. How the profits are
subsequently divided depends on the level of differentiation between the two buyers. When they
are perfectly substitutable, they will compete fiercely, leaving high profits for the supplier. When,
on the other hand, they are more differentiated they are better able to take more of the marginal
profit, leaving less for the supplier. When the supplier analyses the market before making his first
period innovation decision, he will forego this possibility when he is facing differentiated buyers
downstream. This makes both the producer and the final consumer worse off. This finding is
important to remember in reference to the development of private labels, which increases the
differentiation between retailers.
Seller (innov only if
buyers are subs.): +
Buyers: +
Consumers: unknown Overall: ?
Seller (no innov if
buyers are different.): -
Buyers: ? Consumers: -
One supplier. Two buyers.
Battigalli, Fumagalli and Polo (2007)
Empirical Literature
Where the previous papers were all theoretical of nature, I will now discuss some of the empirical
papers that have been published on buyer power. There are few due to the difficulty of data
collection, especially over multiple years.
Schumacher (1991) looks into the relationship between performance of suppliers and buyers using
the 1982 Census of Manufacturers and the 1977 Input-Output study for the United States. Using
Price-Cost margin as the dependent variable and different concentration ratios, capital
requirements and advertising costs related to sales. He finds that the ability of sellers to make a
profit depends crucially on the type of competition they are facing among each other as well as
among their buyers. More concentrated buyers in consumer goods industries lead to lower profits
for sellers in that industry. Whether or not consumers benefit depends on the type of competition
on the consumer side market of the buyers.
Sellers: -
(With more
concentrated buyers)
Buyers: +
Consumers: +/-
depends on competition level
Overall: ?
Buyer Power in the Clothing and Footwear Sector
30 3. Theory on Buyer Power | Ernst-Jan Sillem
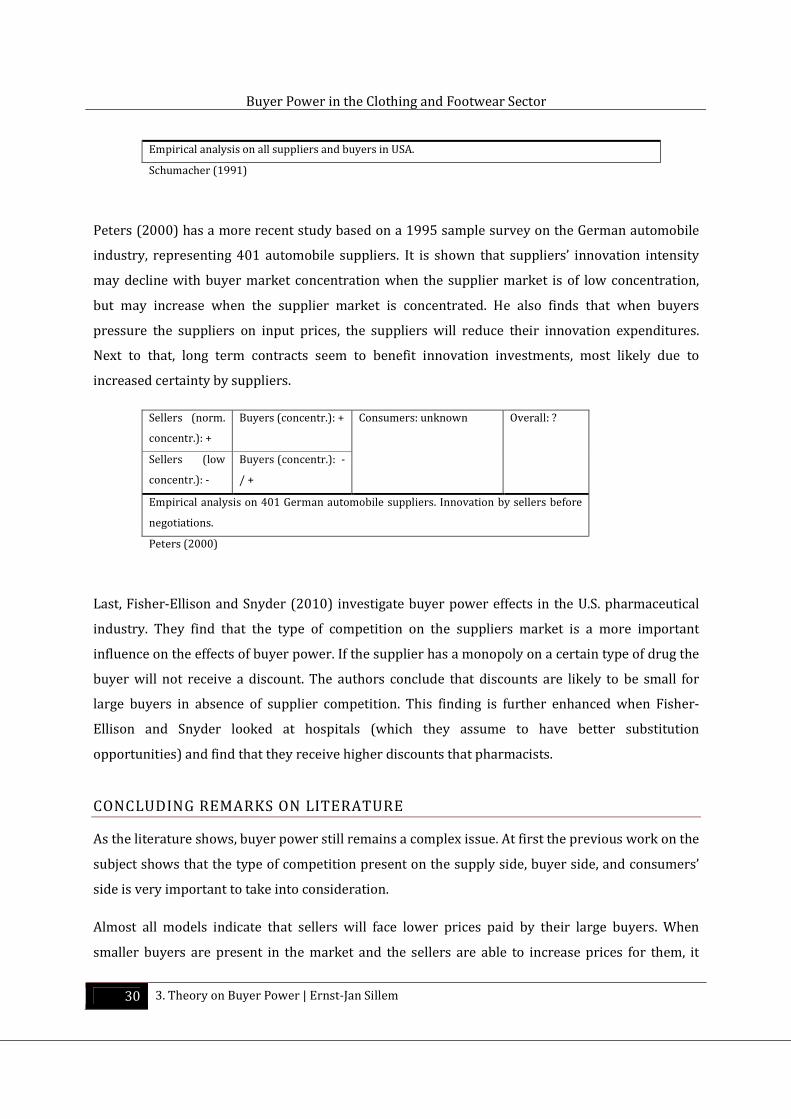
Empirical analysis on all suppliers and buyers in USA.
Schumacher (1991)
Peters (2000) has a more recent study based on a 1995 sample survey on the German automobile
industry, representing 401 automobile suppliers. It is shown that suppliers’ innovation intensity
may decline with buyer market concentration when the supplier market is of low concentration,
but may increase when the supplier market is concentrated. He also finds that when buyers
pressure the suppliers on input prices, the suppliers will reduce their innovation expenditures.
Next to that, long term contracts seem to benefit innovation investments, most likely due to
increased certainty by suppliers.
Sellers (norm.
concentr.): +
Buyers (concentr.): + Consumers: unknown Overall: ?
Sellers (low
concentr.): -
Buyers (concentr.): -
/ +
Empirical analysis on 401 German automobile suppliers. Innovation by sellers before
negotiations.
Peters (2000)
Last, Fisher-Ellison and Snyder (2010) investigate buyer power effects in the U.S. pharmaceutical
industry. They find that the type of competition on the suppliers market is a more important
influence on the effects of buyer power. If the supplier has a monopoly on a certain type of drug the
buyer will not receive a discount. The authors conclude that discounts are likely to be small for
large buyers in absence of supplier competition. This finding is further enhanced when Fisher-
Ellison and Snyder looked at hospitals (which they assume to have better substitution
opportunities) and find that they receive higher discounts that pharmacists.
CONCLUDING REMARKS ON LITERATURE
As the literature shows, buyer power still remains a complex issue. At first the previous work on the
subject shows that the type of competition present on the supply side, buyer side, and consumers’
side is very important to take into consideration.
Almost all models indicate that sellers will face lower prices paid by their large buyers. When
smaller buyers are present in the market and the sellers are able to increase prices for them, it
Buyer Power in the Clothing and Footwear Sector
Tilburg University | 3. Theory on Buyer Power 31
depends on other circumstances if sellers are able to benefit. Whether or not the small buyers
active next to a large buyer will have to pay higher or lower prices than before the large buyer
emerged or increased in buyer power mainly depends on the cost structure of the seller. Constant
marginal cost will lead to a lower increase (if any) in price than if the seller has increasing marginal
costs. In the latter case the large buyer will demand the cheaper marginal products, which can also
be seen as the buyer receiving a discount on it purchases. Taken all this into account it can be
concluded that to analyze buyer power the size of the firm has to be considered.
In general it seems as competition on the consumer market is important for the price reducing
effects of buyer power to be passed on to consumers. When the concentration among
buyers/retailers increases, leading to a less intense downstream competition, consumers will likely
suffer. If competition intensity for the consumer market remains the same, benefits of buyer power
will likely be passed on to the consumers. A manufacturer with a monopoly or oligopoly position
and therefore naturally also seller power, can also effectively counter buyer power in some
instances. Measuring the developments of seller power is therefore an important step in order to
assess the effects of buyer power on consumers.
Innovation and product diversity appears to lose out in almost all models. In the empirical model by
Peters (2000) innovations depend on the level of concentration among both sellers and buyers.
When looking at the model of Battigalli, Fumagalli and Polo (2007) it seems as though the number
of potential buyers using the innovation is an important factor when considering initiating an
innovation process. Higher level of concentration would therefore seem to be detrimental for
innovation. Since innovation is not to be measured with the available data, it will not be
investigated in this paper.
When relating this to the clothing and footwear industry we observe a low concentration in the
manufacturing and the retail link. On the retail market, there is however a number of large firms
that account for a large part of the sales in the sector. The HHI is not very suitable to pick up those
few larger firms, but they can have a strong influence on the suppliers that deal with them. It is hard
to say anything about the level of innovation in the clothing and footwear industry. According to Mr.
Wintermans, innovations in the clothing and footwear sector can mainly be done in the field of
logistics, both the actual transport as well as inventory logistics. A new information system to which
all supplier and buyers are connected could be an example. These are however extremely hard to
implement due to a coordination problem.
Buyer Power in the Clothing and Footwear Sector
32 3. Theory on Buyer Power | Ernst-Jan Sillem
The complaints by the manufacturers about the changed contracts, delayed payments and
unannounced discounts on bill payable by retailers cannot be confirmed or dismissed by the data at
our disposal. The effects are measured in an indirect way by looking at the indicators in the next
chapter. If effects of buyer power on the manufacturers are strong this should show in the results of
the analysis.
Buyer Power in the Clothing and Footwear Sector
Tilburg University | 4. Analytical Framework 33
4. ANALYTICAL FRAMEWORK
Now that I have analyzed the prevailing theories on buyer power, this chapter will line out the
indicators that will be used for the empirical analysis. It will also be explained why they are suited
for the clothing and footwear sector. As mentioned before, the empirical analysis will mainly be
done based on the firm level data of Statistics Netherlands. This dataset has observations for the
years 1992 to 2007, making it possible to look at developments over time. The dataset is also split
up in three sectors within the industry: Manufacturers, wholesale and retailers. By looking at the
datasets separately, the seller and buyer power developments should become clear. Since the
models assume that large firms typically have more buyer power, the datasets are also split up
according to size. To see if there are differences between the clothing sector and the footwear
sector they have also been split up in the analysis.
The rest of this chapter will be structured as follows. First the indicators for the selling power
indicators will be described. In the second part the indicators for buyer power will be presented.
For both parts the division based on size and clothing or footwear will also be included.
MEASURING SELLER POWER
Seller power has been under investigation almost as long as competition policy and its effects are
being investigated, which according to Motta (2004) is since the end of the 19th century. It is often
defined as ‘a firm’s ability to set its price above marginal cost when selling a product on the market’
(Tirole, 1988).
Next to the issue of measuring seller power, a definition of competition is also required before
proceeding. Following Boone et al. (2007) and Creusen et al. (2006) the notion of product market
competition will be: The more competitive the market, the more harshly are firms punished in terms
of profit for being inefficient. Low levels of market power or fierce competition therefore relates
directly to low levels of mark-up in an industry or economy.
Three Indicators
In line with Boone et al. (2007) and Creusen et al. (2006) and (2008) I will use two main indicators
to measure the development of seller power over the years.
Buyer Power in the Clothing and Footwear Sector
34 4. Analytical Framework | Ernst-Jan Sillem
• Herfindahl-Hirschman Index
• Price Cost Margins
Although not perfect to measure seller power, a lack of data prevents me from using more detailed
and suitable indicators.
The HHI is explained below since it was used as an indication of concentration in the second
chapter, where the sector was described. The same table can be found in this chapter.
Price Cost Margin
A well-known indicator of competition is the PCM. It is based on the difference between the
marginal cost of a product and the price for which it is sold, relative to the price of the product.
Depending on whether we are investigating a manufacturer or a retailer the method of calculation
differs.
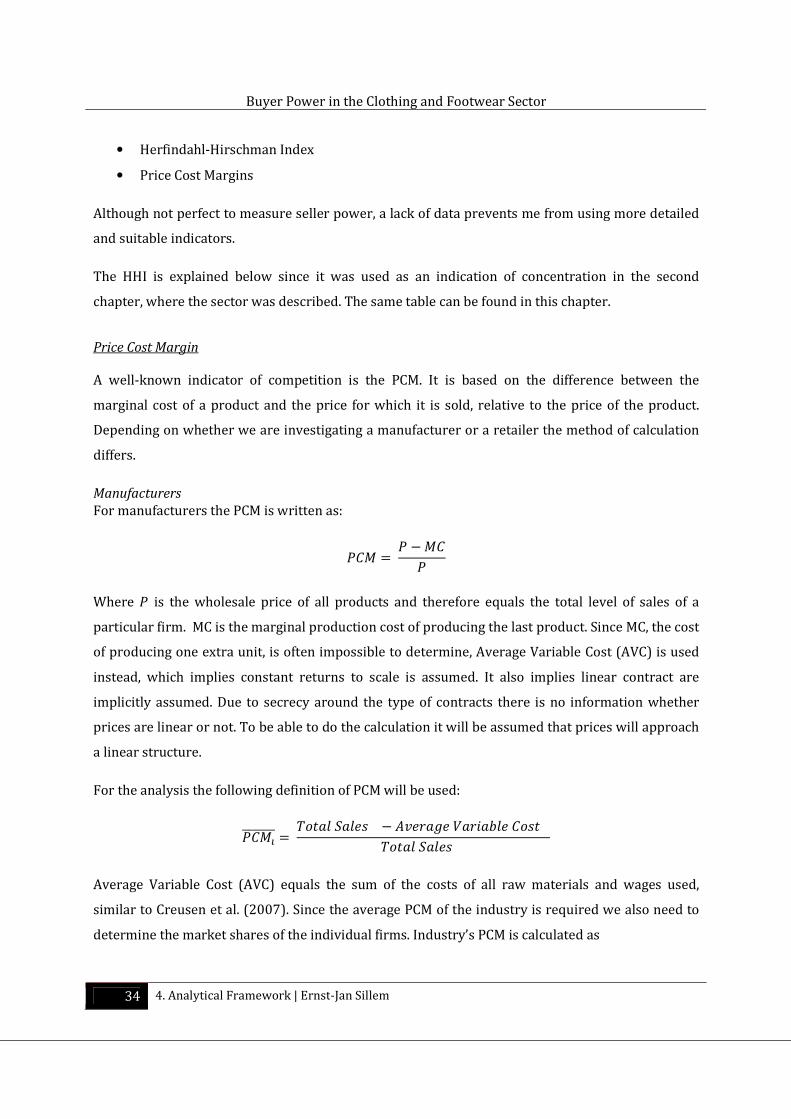
Manufacturers
For manufacturers the PCM is written as:
��� � � ����
Where � is the wholesale price of all products and therefore equals the total level of sales of a
particular firm. MC is the marginal production cost of producing the last product. Since MC, the cost
of producing one extra unit, is often impossible to determine, Average Variable Cost (AVC) is used
instead, which implies constant returns to scale is assumed. It also implies linear contract are
implicitly assumed. Due to secrecy around the type of contracts there is no information whether
prices are linear or not. To be able to do the calculation it will be assumed that prices will approach
a linear structure.
For the analysis the following definition of PCM will be used:
����������� � �� �� �� � ������� ������ � ����� �� ��
Average Variable Cost (AVC) equals the sum of the costs of all raw materials and wages used,
similar to Creusen et al. (2007). Since the average PCM of the industry is required we also need to
determine the market shares of the individual firms. Industry’s PCM is calculated as
Buyer Power in the Clothing and Footwear Sector
Tilburg University | 4. Analytical Framework 35
������������� �! � "�#���������##
Where �# is the market share of supplier � in terms of sales.
Wholesale
For the PCM of the wholesale link a similar formula as for the manufactures is used except that raw
materials are now replaced with purchases from manufacturers.
Retailers
To fully understand the dynamics behind the cost structure of a retailer there is distinction between
the Marginal Purchasing Cost (MPC) and the Marginal Retail Costs (MRC). The PCM for retailers is
formally written as
��� � � ���� � � ���� ��$�
�
MPC reflects the influence of the purchases by the retailer on its total purchasing cost, while MRC
includes transportation costs, storage costs, promotional costs and wages. Due to the same data
limitations present for the manufactures I will use total purchase and total retail cost instead, based
on Creusen et al. (2007). This average PCM for each retailer % is measured with the following
formula:
���������& � ��� �� �� � '(�)*���� � ����� )����� �� ��
The average PCM for the complete industry is obtained by
���������+ ��#, �! �" �&& ���������&
Where s is the market share of each firm in total industry sales.
Herfindahl-Hirschman Index
The HHI is one of the most well known competition measurement indexes, although widely
criticized because of its shortcomings. According to the European Commission (2004) ‘Market
shares and the degree of competition are the first indicators of a market structure’. Since an
indicator of seller power is needed, the share of sales per firm in the total industry will be used. In
this analysis market shares of firms in their respective industry will be used. Having a high
concentration in an industry may, but need not be an indication of market power for the firms in
Buyer Power in the Clothing and Footwear Sector
36 4. Analytical Framework | Ernst-Jan Sillem
that industry. A high concentration could give the possibility to charge prices above marginal cost,
leading to inefficiencies. Next to that it is easier to collude, due to the low number of participants.
The HHI is calculated as follows:
--./012/ �" /343
Where /3 is the market share in terms of sales of firm � over the total industry sales. From this
formula it follows that the index is high if there are only a few firms on the market or if there are a
number of large firms next to small firms. An outcome close to 1 indicates a high concentration,
while an outcome close to 0 indicates a low concentration.
As mentioned above, the HHI is not without flaws. It does not take efficiency of firms into account.
In a normal competitive setting efficient firms are rewarded with higher sales since they can lower
their price below that of inefficient firms, increasing their market share. Another problem can be
the definition of the relevant market. In a globalizing world many firms also compete abroad, while
the market is limited to a particular country.10 A firm with a large market share, next to many
smaller firms will result in a low HHI, while that might not be how the market will behave in reality.
Limitations of indicators
The indicators above all have limitations in their use for buyer power analysis. I will briefly discuss
the most elementary for this paper. For a more detailed elaboration Boone et al. (2007) and
Creusen et al. (2006) can be consulted. A first limitation is that marginal cost cannot be observed
from the data used, and therefore average variable cost is used. To approach the value of the
marginal cost per unit, I have chosen costs that will also follow quantity changes quickly.
Distribution, storage, advertising, and wages are all costs that change along with quantities sold. A
better approximation is hard to find due to the lack of specific data. Since AVC assumes linear
pricing, it is assumed that firms do not give discounts to large buyers. These non-linear prices are
assumed not to occur.
10 Some of the problems with the HHI are solved by using the alternative Cx-ratio, which measures the market
share of the largest x firms in the market. Advantage is that only the market share of the largest firms is
needed. Disadvantage is that it does not give a good picture of the distribution of the firms if there are many
small firms next to the x largest.
Buyer Power in the Clothing and Footwear Sector
Tilburg University | 4. Analytical Framework 37
Another limitation is the fact that changes in PCM may also be the result of other determinants than
buyer power. For example technological improvements, cyclical developments or other exogenous
influences can be the reason of changes.
MEASURING BUYER POWER
As is shown in the discussion on buyer power in CHAPTER 3, there is no univocal definition of
buyer power. What did become apparent was that firms with buyer power are often of large size
and receive discounts on the products they buy from their suppliers. These two factors imply that
because of the lower prices buyers/retailers pay for their input, they should be able to have a
relatively higher profit margin on their sales. Profits related to their purchases should also be
higher, and purchases over sales should be lower. These facts have been taken and used to create
indicators on buyer power. The interest will be on the developments of the indicators over time for
the whole sector. Additionally I will split up the sample in large and small firms to see if being a
larger firm has had a positive effect on developing buyer relative to smaller firms. Theoretically,
knowing the exact discounts, slotting allowances, terms of payment and other contract details
between the all suppliers and all buyers would give the best estimation of buyer power. As is also
the case for marginal costs, such detailed strategic information is not available. So, although not
perfect estimators they should give a good indication of the developments of buyer power in the
past 15 years.
Measuring buyer power, the indicators
After discussing the possible approaches, four sensible indicators remain:
• HHI Purchases
• Buyer Power Index (BPI)
• Relative Buyer Power Index (Rel. BPI)
• Purchasing Cost indicator
HHI Purchases
This indicator is almost identical to the HHI for selling power. The difference is that the HHI
purchases measures the concentration of the purchases of a firm on the total purchases from the
sector. This implies that it computed as:
Buyer Power in the Clothing and Footwear Sector
38 4. Analytical Framework | Ernst-Jan Sillem
5567���8�! ! �" 9 '&∑ '&& ;<
&
With '& the market share of each supermarketor wholesale company in the total purchases of the
industry
Buyer Power Index
When using a slightly different definition of buyer power it can also be interpreted as ‘buyers’ ability
to obtain rebates (at the expense of the supplier) or a lower wholesale price than the “competitive”
wholesale price in negotiations with suppliers’ (Creusen et al., 2008, p56). Blair and Harrison (1993)
used this interpretation and constructed the BPI by using the Value of the Marginal Product and the
wholesale price. This index is constructed by
=�6 � ��� �>>
where VMP is the Value of the Marginal Product for each product and W is the wholesale price of
each product for the buyer. VMP represents the marginal revenue on the retail market minus the
marginal retail cost.
��� � 9� ? @�ABC@B B; ��$�ABC
When a buyer has seller power the Marginal Revenue (D� ? EFAGCEG BH will be higher, showing the
relation between buyer and seller power in the BPI. This was also shown in the literature review.
Since the buyer/retailer sells different products to his customers, the BPI is an average of the BPI of
all those products.
Similar to the other marginal product measures, the VMP is not directly observable. An estimation
of this value is obtained by taking the selling price instead of the marginal revenue, and the average
retail cost instead of the marginal retail cost:
=�6 � A�B � $�C �>B>B � ����������B �>B
>B Where
���������� � � � $�B
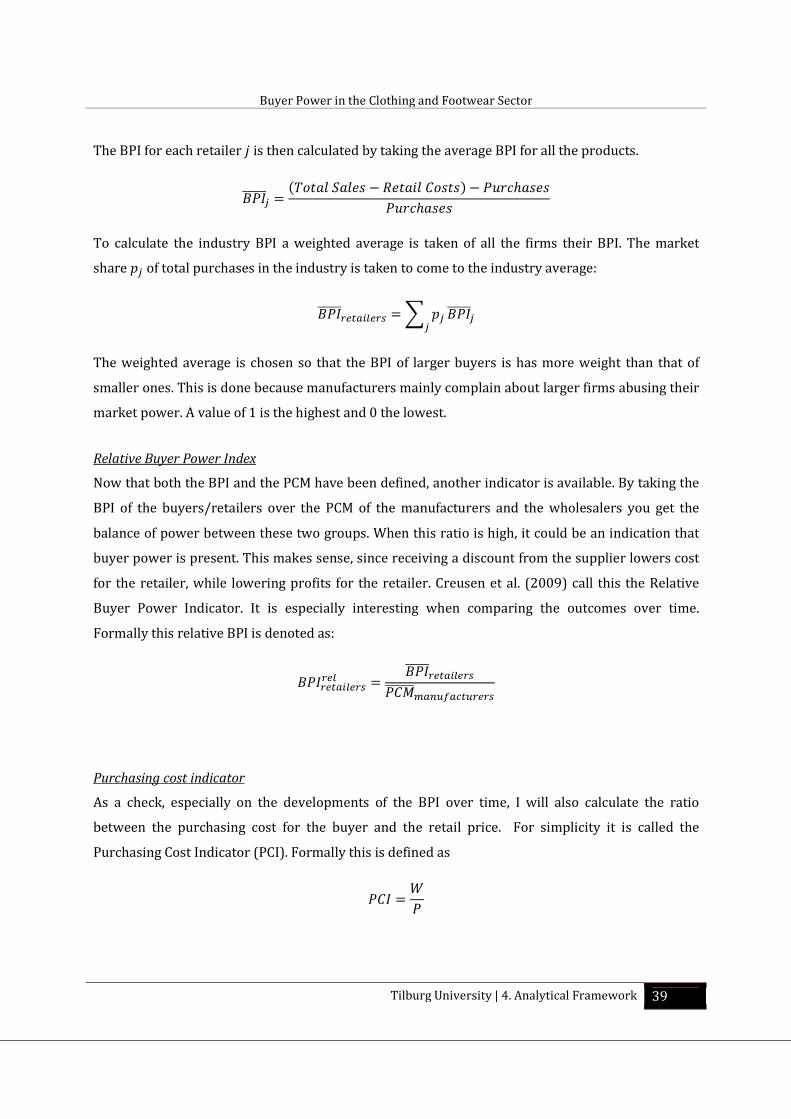
Buyer Power in the Clothing and Footwear Sector
Tilburg University | 4. Analytical Framework 39
The BPI for each retailer % is then calculated by taking the average BPI for all the products.
=�6�����& � A�� �� �� � $���� ����C � �(�)*�����(�)*����
To calculate the industry BPI a weighted average is taken of all the firms their BPI. The market
share '& of total purchases in the industry is taken to come to the industry average:
=�6������ ��#, �! �" '&& =�6�����&
The weighted average is chosen so that the BPI of larger buyers is has more weight than that of
smaller ones. This is done because manufacturers mainly complain about larger firms abusing their
market power. A value of 1 is the highest and 0 the lowest.
Relative Buyer Power Index
Now that both the BPI and the PCM have been defined, another indicator is available. By taking the
BPI of the buyers/retailers over the PCM of the manufacturers and the wholesalers you get the
balance of power between these two groups. When this ratio is high, it could be an indication that
buyer power is present. This makes sense, since receiving a discount from the supplier lowers cost
for the retailer, while lowering profits for the retailer. Creusen et al. (2009) call this the Relative
Buyer Power Indicator. It is especially interesting when comparing the outcomes over time.
Formally this relative BPI is denoted as:
=�6� ��#, �!� , � =�6������ ��#, �!������������������� �!
Purchasing cost indicator
As a check, especially on the developments of the BPI over time, I will also calculate the ratio
between the purchasing cost for the buyer and the retail price. For simplicity it is called the
Purchasing Cost Indicator (PCI). Formally this is defined as
��6 � >�
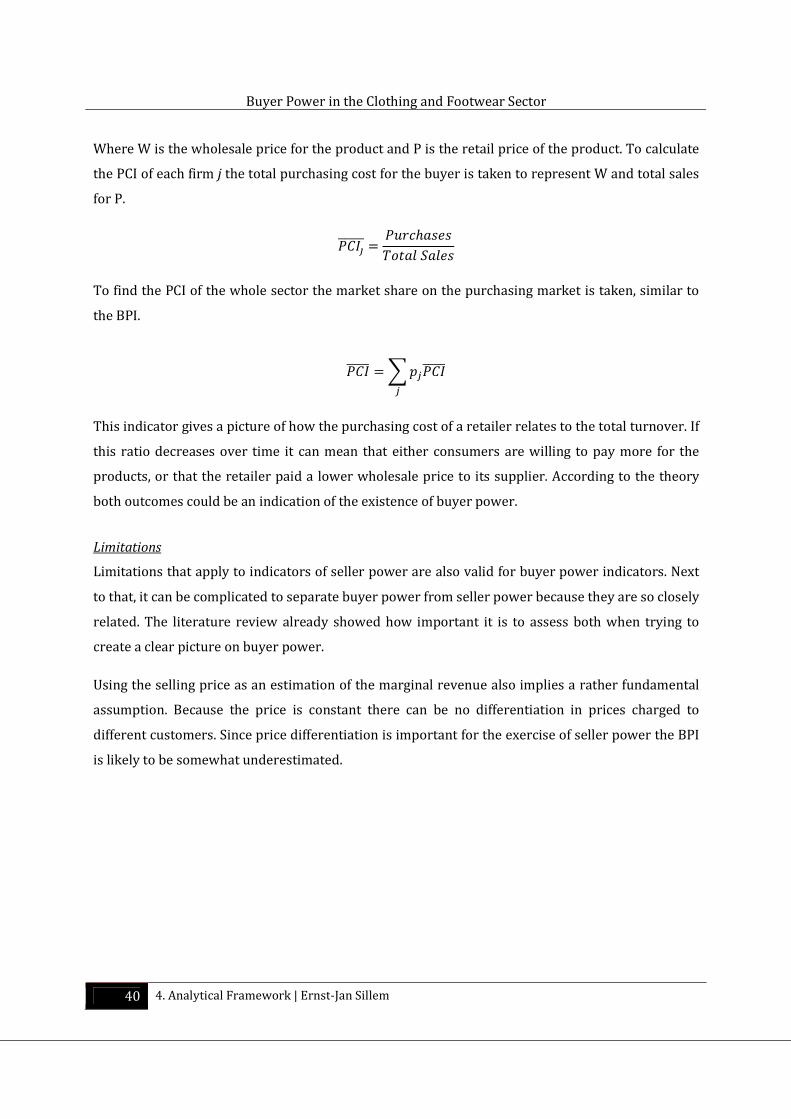
Buyer Power in the Clothing and Footwear Sector
40 4. Analytical Framework | Ernst-Jan Sillem
Where W is the wholesale price for the product and P is the retail price of the product. To calculate
the PCI of each firm j the total purchasing cost for the buyer is taken to represent W and total sales
for P.
��6I������ � �(�)*������ �� ��
To find the PCI of the whole sector the market share on the purchasing market is taken, similar to
the BPI.
��6����� �"'&��6�����&
This indicator gives a picture of how the purchasing cost of a retailer relates to the total turnover. If
this ratio decreases over time it can mean that either consumers are willing to pay more for the
products, or that the retailer paid a lower wholesale price to its supplier. According to the theory
both outcomes could be an indication of the existence of buyer power.
Limitations
Limitations that apply to indicators of seller power are also valid for buyer power indicators. Next
to that, it can be complicated to separate buyer power from seller power because they are so closely
related. The literature review already showed how important it is to assess both when trying to
create a clear picture on buyer power.
Using the selling price as an estimation of the marginal revenue also implies a rather fundamental
assumption. Because the price is constant there can be no differentiation in prices charged to
different customers. Since price differentiation is important for the exercise of seller power the BPI
is likely to be somewhat underestimated.
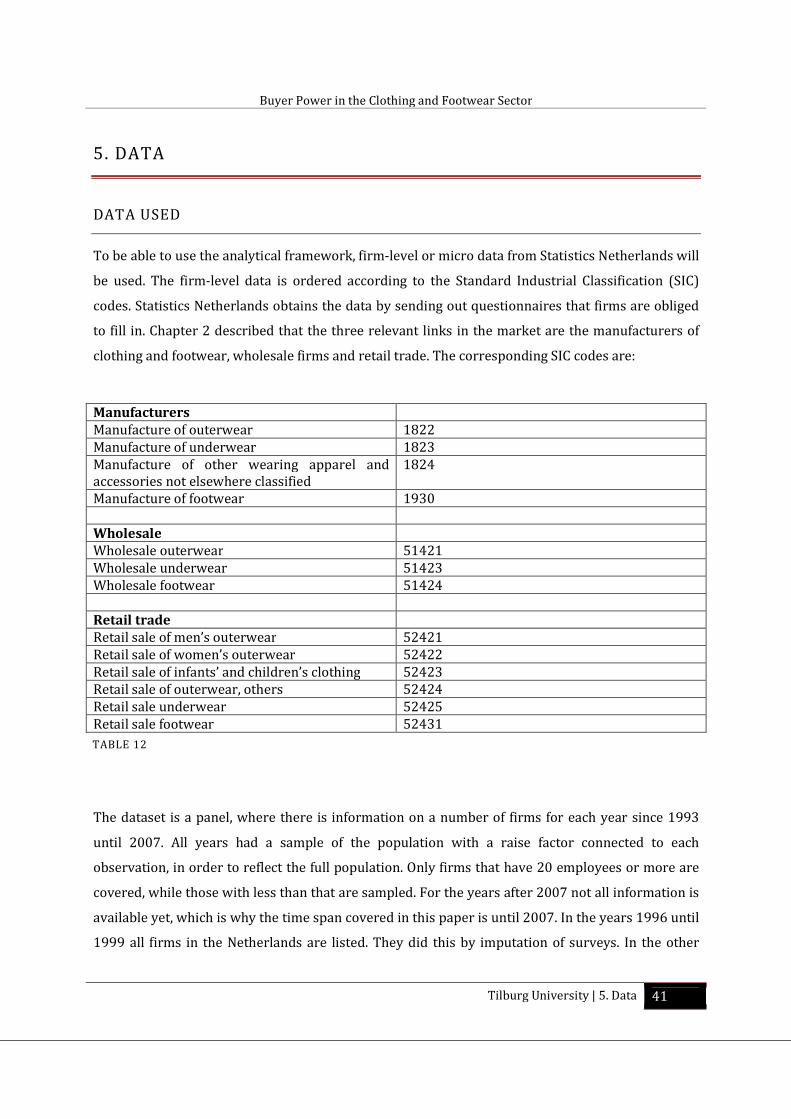
Buyer Power in the Clothing and Footwear Sector
Tilburg University | 5. Data 41
5. DATA
DATA USED
To be able to use the analytical framework, firm-level or micro data from Statistics Netherlands will
be used. The firm-level data is ordered according to the Standard Industrial Classification (SIC)
codes. Statistics Netherlands obtains the data by sending out questionnaires that firms are obliged
to fill in. Chapter 2 described that the three relevant links in the market are the manufacturers of
clothing and footwear, wholesale firms and retail trade. The corresponding SIC codes are:
The dataset is a panel, where there is information on a number of firms for each year since 1993
until 2007. All years had a sample of the population with a raise factor connected to each
observation, in order to reflect the full population. Only firms that have 20 employees or more are
covered, while those with less than that are sampled. For the years after 2007 not all information is
available yet, which is why the time span covered in this paper is until 2007. In the years 1996 until
1999 all firms in the Netherlands are listed. They did this by imputation of surveys. In the other
Manufacturers
Manufacture of outerwear 1822
Manufacture of underwear 1823
Manufacture of other wearing apparel and
accessories not elsewhere classified
1824
Manufacture of footwear 1930
Wholesale
Wholesale outerwear 51421
Wholesale underwear 51423
Wholesale footwear 51424
Retail trade
Retail sale of men’s outerwear 52421
Retail sale of women’s outerwear 52422
Retail sale of infants’ and children’s clothing 52423
Retail sale of outerwear, others 52424
Retail sale underwear 52425
Retail sale footwear 52431
TABLE 12
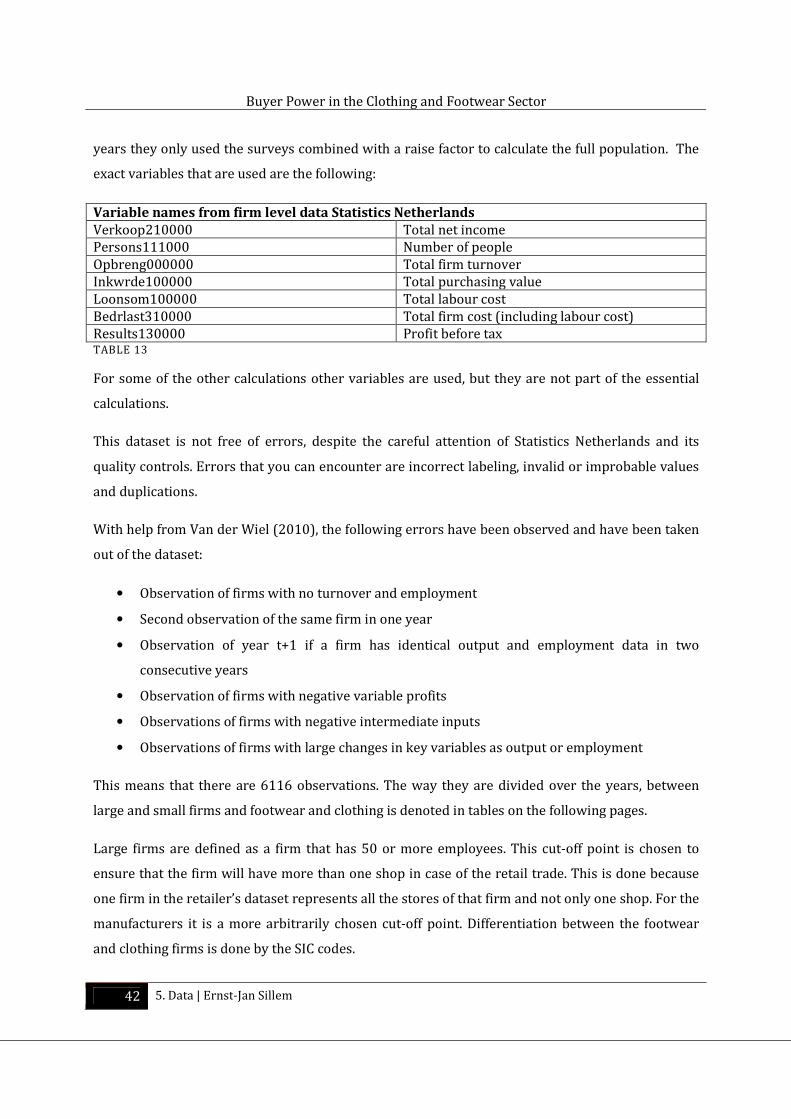
Buyer Power in the Clothing and Footwear Sector
42 5. Data | Ernst-Jan Sillem
years they only used the surveys combined with a raise factor to calculate the full population. The
exact variables that are used are the following:
Variable names from firm level data Statistics Netherlands
Verkoop210000 Total net income
Persons111000 Number of people
Opbreng000000 Total firm turnover
Inkwrde100000 Total purchasing value
Loonsom100000 Total labour cost
Bedrlast310000 Total firm cost (including labour cost)
Results130000 Profit before tax TABLE 13
For some of the other calculations other variables are used, but they are not part of the essential
calculations.
This dataset is not free of errors, despite the careful attention of Statistics Netherlands and its
quality controls. Errors that you can encounter are incorrect labeling, invalid or improbable values
and duplications.
With help from Van der Wiel (2010), the following errors have been observed and have been taken
out of the dataset:
• Observation of firms with no turnover and employment
• Second observation of the same firm in one year
• Observation of year t+1 if a firm has identical output and employment data in two
consecutive years
• Observation of firms with negative variable profits
• Observations of firms with negative intermediate inputs
• Observations of firms with large changes in key variables as output or employment
This means that there are 6116 observations. The way they are divided over the years, between
large and small firms and footwear and clothing is denoted in tables on the following pages.
Large firms are defined as a firm that has 50 or more employees. This cut-off point is chosen to
ensure that the firm will have more than one shop in case of the retail trade. This is done because
one firm in the retailer’s dataset represents all the stores of that firm and not only one shop. For the
manufacturers it is a more arbitrarily chosen cut-off point. Differentiation between the footwear
and clothing firms is done by the SIC codes.
Buyer Power in the Clothing and Footwear Sector
Tilburg University | 5. Data 43
Other data sources
Next to the firm level data, other data sources such as Statline and the National Accounts of
Statistics Netherlands. These sources are mainly used for robustness checks for the outcomes of the
micro data analysis.
SUMMARY STATISTICS
Summary statistics of the most important variables is given below.
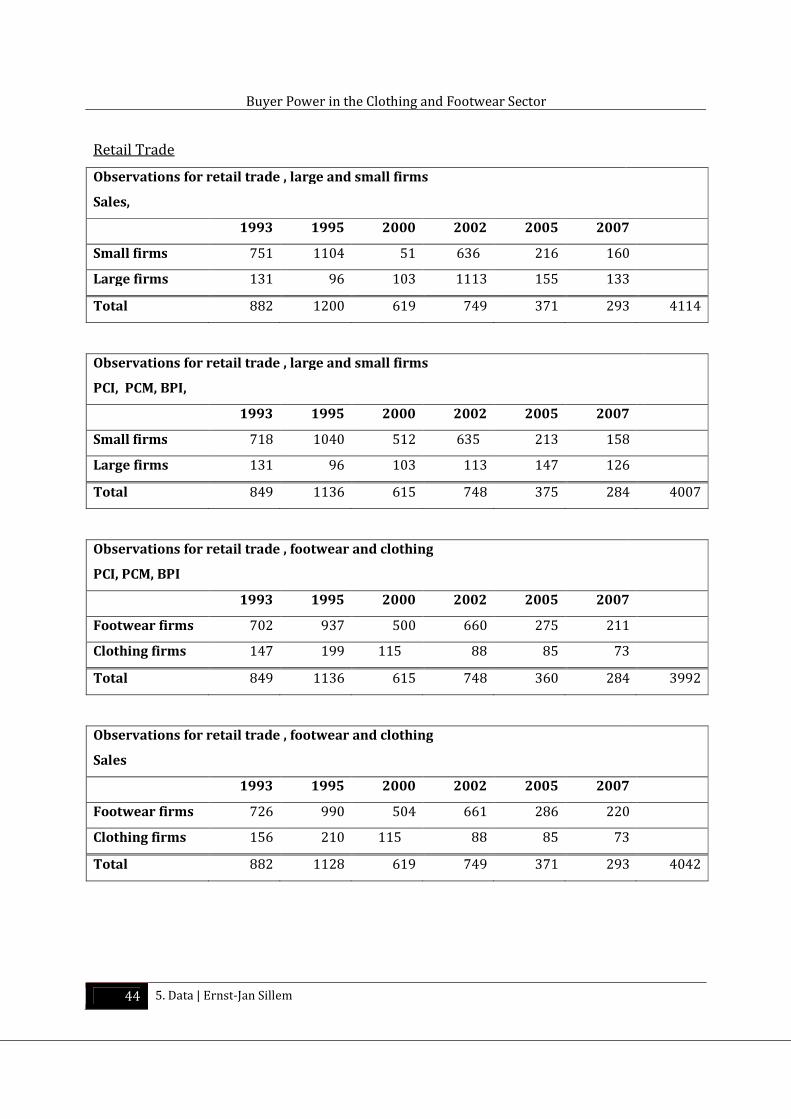
Buyer Power in the Clothing and Footwear Sector
44 5. Data | Ernst-Jan Sillem
Retail Trade
Observations for retail trade , large and small firms
Sales,
1993 1995 2000 2002 2005 2007
Small firms 751 1104 51 636 216 160
Large firms 131 96 103 1113 155 133
Total 882 1200 619 749 371 293 4114
Observations for retail trade , large and small firms
PCI, PCM, BPI,
1993 1995 2000 2002 2005 2007
Small firms 718 1040 512 635 213 158
Large firms 131 96 103 113 147 126
Total 849 1136 615 748 375 284 4007
Observations for retail trade , footwear and clothing
PCI, PCM, BPI
1993 1995 2000 2002 2005 2007
Footwear firms 702 937 500 660 275 211
Clothing firms 147 199 115 88 85 73
Total 849 1136 615 748 360 284 3992
Observations for retail trade , footwear and clothing
Sales
1993 1995 2000 2002 2005 2007
Footwear firms 726 990 504 661 286 220
Clothing firms 156 210 115 88 85 73
Total 882 1128 619 749 371 293 4042
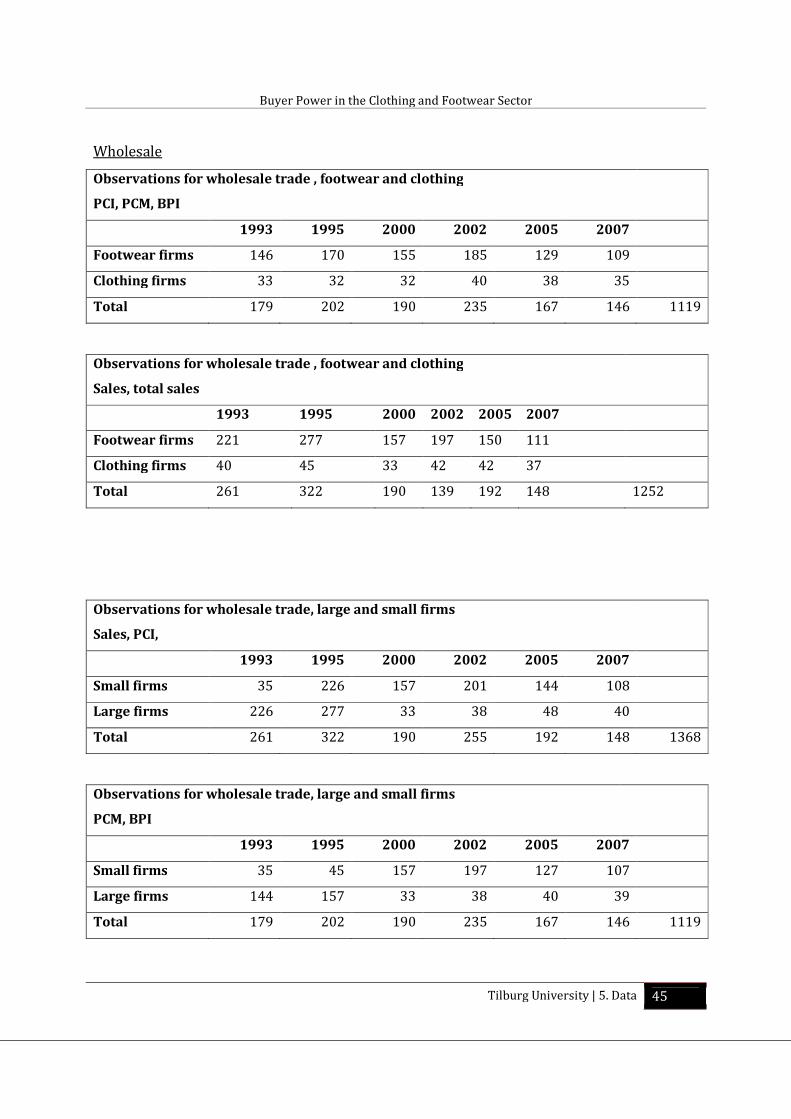
Buyer Power in the Clothing and Footwear Sector
Tilburg University | 5. Data 45
Wholesale
Observations for wholesale trade , footwear and clothing
PCI, PCM, BPI
1993 1995 2000 2002 2005 2007
Footwear firms 146 170 155 185 129 109
Clothing firms 33 32 32 40 38 35
Total 179 202 190 235 167 146 1119
Observations for wholesale trade , footwear and clothing
Sales, total sales
1993 1995 2000 2002 2005 2007
Footwear firms 221 277 157 197 150 111
Clothing firms 40 45 33 42 42 37
Total 261 322 190 139 192 148 1252
Observations for wholesale trade, large and small firms
Sales, PCI,
1993 1995 2000 2002 2005 2007
Small firms 35 226 157 201 144 108
Large firms 226 277 33 38 48 40
Total 261 322 190 255 192 148 1368
Observations for wholesale trade, large and small firms
PCM, BPI
1993 1995 2000 2002 2005 2007
Small firms 35 45 157 197 127 107
Large firms 144 157 33 38 40 39
Total 179 202 190 235 167 146 1119
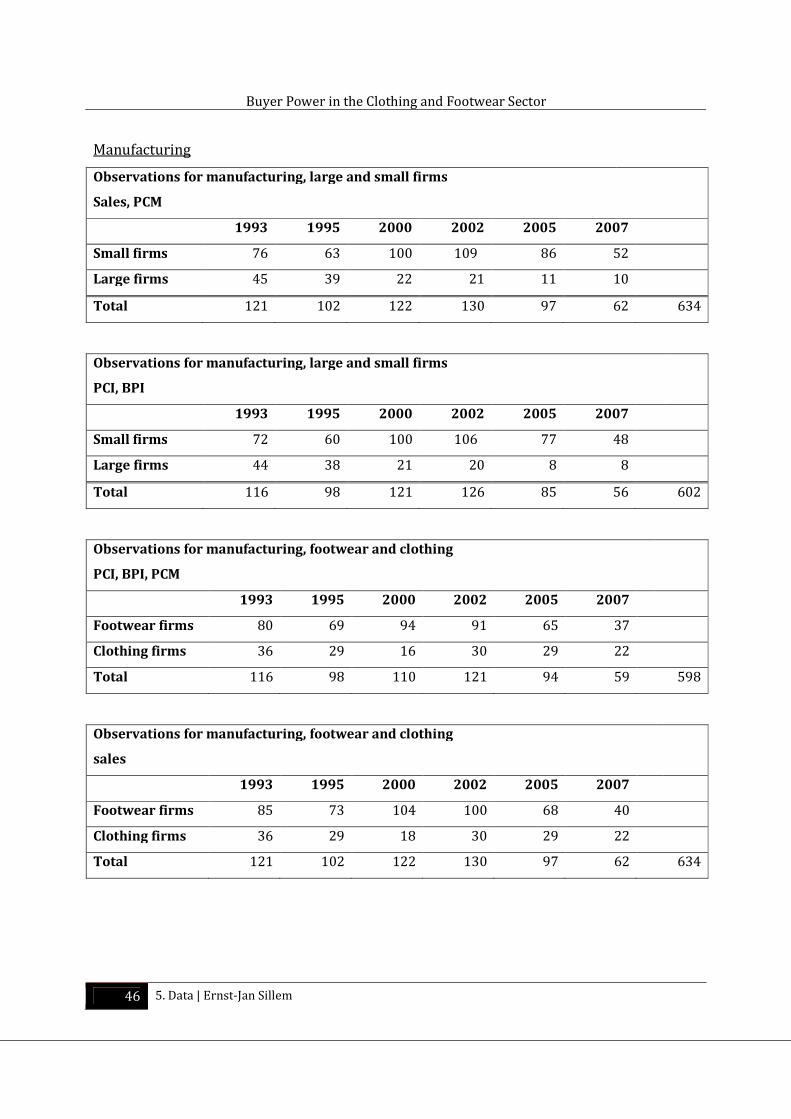
Buyer Power in the Clothing and Footwear Sector
46 5. Data | Ernst-Jan Sillem
Manufacturing
Observations for manufacturing, large and small firms
Sales, PCM
1993 1995 2000 2002 2005 2007
Small firms 76 63 100 109 86 52
Large firms 45 39 22 21 11 10
Total 121 102 122 130 97 62 634
Observations for manufacturing, large and small firms
PCI, BPI
1993 1995 2000 2002 2005 2007
Small firms 72 60 100 106 77 48
Large firms 44 38 21 20 8 8
Total 116 98 121 126 85 56 602
Observations for manufacturing, footwear and clothing
PCI, BPI, PCM
1993 1995 2000 2002 2005 2007
Footwear firms 80 69 94 91 65 37
Clothing firms 36 29 16 30 29 22
Total 116 98 110 121 94 59 598
Observations for manufacturing, footwear and clothing
sales
1993 1995 2000 2002 2005 2007
Footwear firms 85 73 104 100 68 40
Clothing firms 36 29 18 30 29 22
Total 121 102 122 130 97 62 634
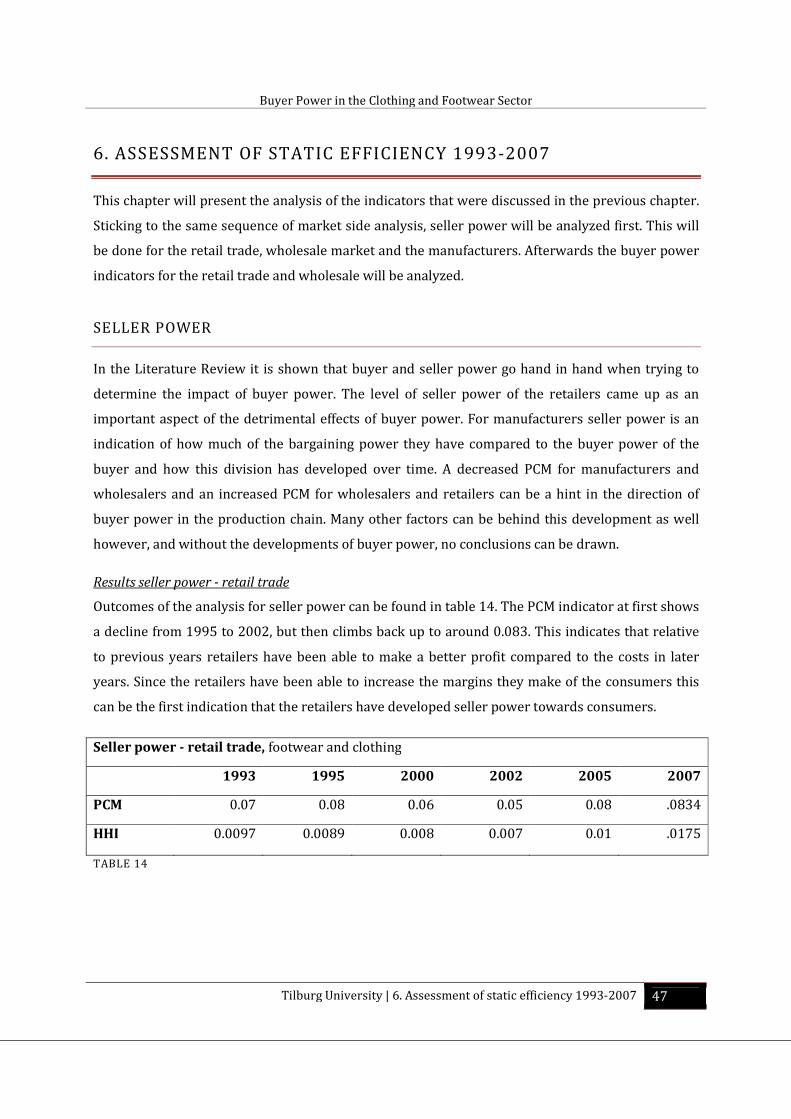
Buyer Power in the Clothing and Footwear Sector
Tilburg University | 6. Assessment of static efficiency 1993-2007 47
6. ASSESSMENT OF STATIC EFFICIENCY 1993-2007
This chapter will present the analysis of the indicators that were discussed in the previous chapter.
Sticking to the same sequence of market side analysis, seller power will be analyzed first. This will
be done for the retail trade, wholesale market and the manufacturers. Afterwards the buyer power
indicators for the retail trade and wholesale will be analyzed.
SELLER POWER
In the Literature Review it is shown that buyer and seller power go hand in hand when trying to
determine the impact of buyer power. The level of seller power of the retailers came up as an
important aspect of the detrimental effects of buyer power. For manufacturers seller power is an
indication of how much of the bargaining power they have compared to the buyer power of the
buyer and how this division has developed over time. A decreased PCM for manufacturers and
wholesalers and an increased PCM for wholesalers and retailers can be a hint in the direction of
buyer power in the production chain. Many other factors can be behind this development as well
however, and without the developments of buyer power, no conclusions can be drawn.
Results seller power - retail trade
Outcomes of the analysis for seller power can be found in table 14. The PCM indicator at first shows
a decline from 1995 to 2002, but then climbs back up to around 0.083. This indicates that relative
to previous years retailers have been able to make a better profit compared to the costs in later
years. Since the retailers have been able to increase the margins they make of the consumers this
can be the first indication that the retailers have developed seller power towards consumers.
Seller power - retail trade, footwear and clothing
1993 1995 2000 2002 2005 2007
PCM 0.07 0.08 0.06 0.05 0.08 .0834
HHI 0.0097 0.0089 0.008 0.007 0.01 .0175
TABLE 14
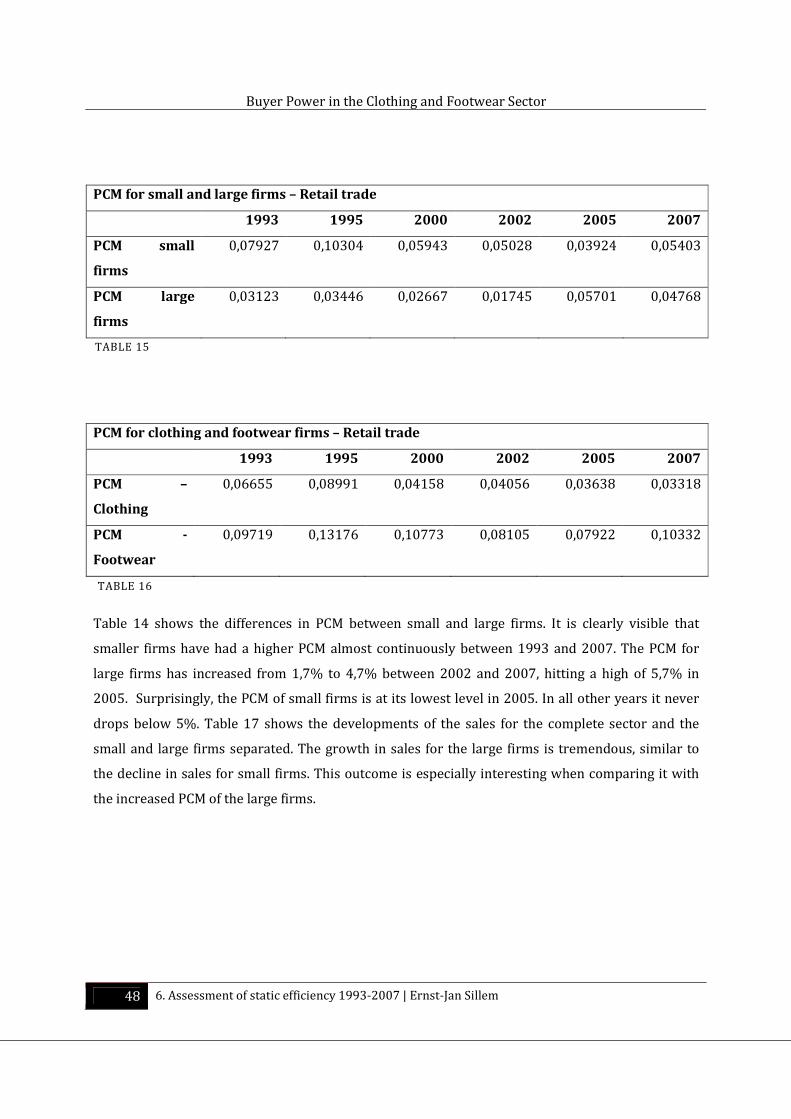
Buyer Power in the Clothing and Footwear Sector
48 6. Assessment of static efficiency 1993-2007 | Ernst-Jan Sillem
Table 14 shows the differences in PCM between small and large firms. It is clearly visible that
smaller firms have had a higher PCM almost continuously between 1993 and 2007. The PCM for
large firms has increased from 1,7% to 4,7% between 2002 and 2007, hitting a high of 5,7% in
2005. Surprisingly, the PCM of small firms is at its lowest level in 2005. In all other years it never
drops below 5%. Table 17 shows the developments of the sales for the complete sector and the
small and large firms separated. The growth in sales for the large firms is tremendous, similar to
the decline in sales for small firms. This outcome is especially interesting when comparing it with
the increased PCM of the large firms.
PCM for clothing and footwear firms – Retail trade
1993 1995 2000 2002 2005 2007
PCM –
Clothing
0,06655 0,08991 0,04158 0,04056 0,03638 0,03318
PCM -
Footwear
0,09719 0,13176 0,10773 0,08105 0,07922 0,10332
PCM for small and large firms – Retail trade
1993 1995 2000 2002 2005 2007
PCM small
firms
0,07927 0,10304 0,05943 0,05028 0,03924 0,05403
PCM large
firms
0,03123 0,03446 0,02667 0,01745 0,05701 0,04768
TABLE 15
TABLE 16
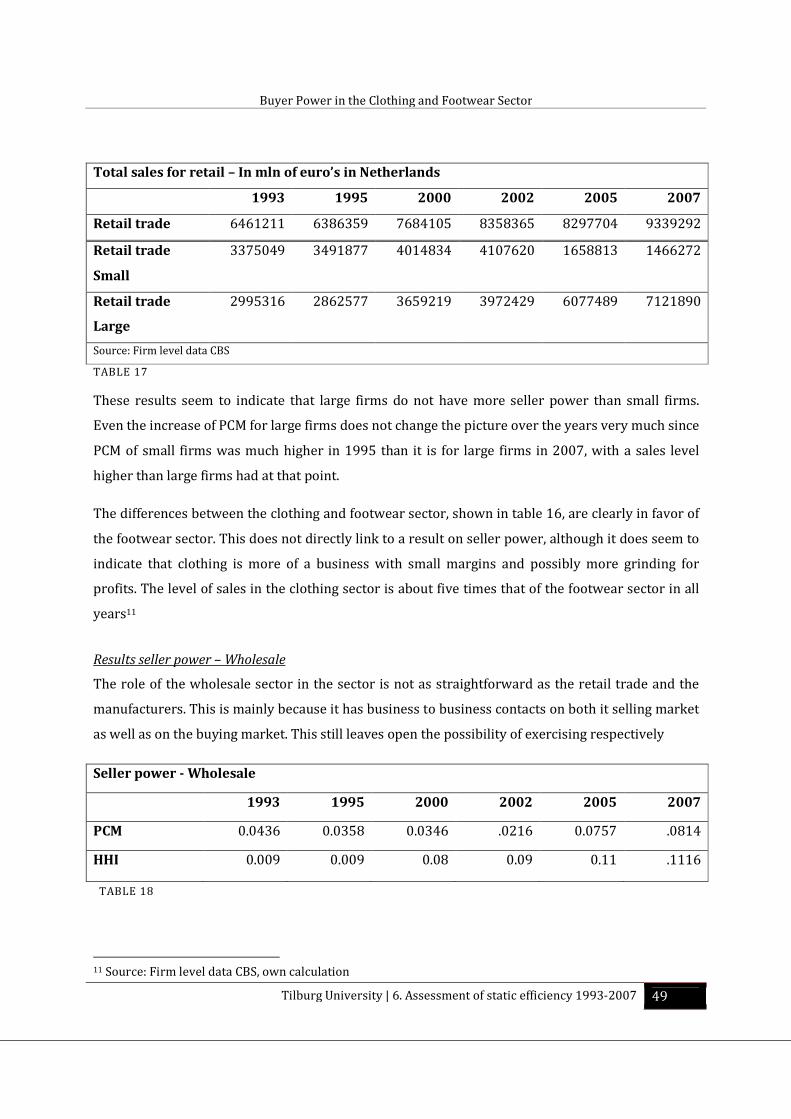
Buyer Power in the Clothing and Footwear Sector
Tilburg University | 6. Assessment of static efficiency 1993-2007 49
TABLE 17
These results seem to indicate that large firms do not have more seller power than small firms.
Even the increase of PCM for large firms does not change the picture over the years very much since
PCM of small firms was much higher in 1995 than it is for large firms in 2007, with a sales level
higher than large firms had at that point.
The differences between the clothing and footwear sector, shown in table 16, are clearly in favor of
the footwear sector. This does not directly link to a result on seller power, although it does seem to
indicate that clothing is more of a business with small margins and possibly more grinding for
profits. The level of sales in the clothing sector is about five times that of the footwear sector in all
years11
Results seller power – Wholesale
The role of the wholesale sector in the sector is not as straightforward as the retail trade and the
manufacturers. This is mainly because it has business to business contacts on both it selling market
as well as on the buying market. This still leaves open the possibility of exercising respectively
11 Source: Firm level data CBS, own calculation
Total sales for retail – In mln of euro’s in Netherlands
1993 1995 2000 2002 2005 2007
Retail trade 6461211 6386359 7684105 8358365 8297704 9339292
Retail trade
Small
3375049 3491877 4014834 4107620 1658813 1466272
Retail trade
Large
2995316 2862577 3659219 3972429 6077489 7121890
Source: Firm level data CBS
TABLE 18
Seller power - Wholesale
1993 1995 2000 2002 2005 2007
PCM 0.0436 0.0358 0.0346 .0216 0.0757 .0814
HHI 0.009 0.009 0.08 0.09 0.11 .1116
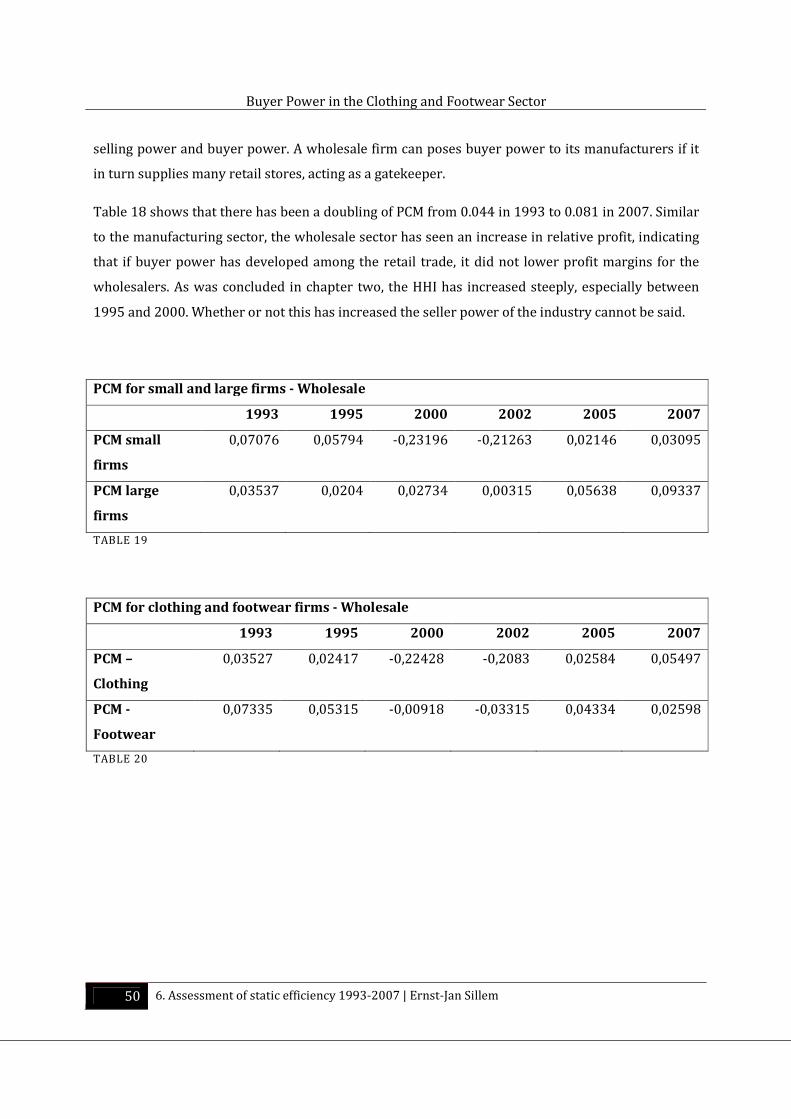
Buyer Power in the Clothing and Footwear Sector
50 6. Assessment of static efficiency 1993-2007 | Ernst-Jan Sillem
selling power and buyer power. A wholesale firm can poses buyer power to its manufacturers if it
in turn supplies many retail stores, acting as a gatekeeper.
Table 18 shows that there has been a doubling of PCM from 0.044 in 1993 to 0.081 in 2007. Similar
to the manufacturing sector, the wholesale sector has seen an increase in relative profit, indicating
that if buyer power has developed among the retail trade, it did not lower profit margins for the
wholesalers. As was concluded in chapter two, the HHI has increased steeply, especially between
1995 and 2000. Whether or not this has increased the seller power of the industry cannot be said.
PCM for small and large firms - Wholesale
1993 1995 2000 2002 2005 2007
PCM small
firms
0,07076 0,05794 -0,23196 -0,21263 0,02146 0,03095
PCM large
firms
0,03537 0,0204 0,02734 0,00315 0,05638 0,09337
TABLE 19
PCM for clothing and footwear firms - Wholesale
1993 1995 2000 2002 2005 2007
PCM –
Clothing
0,03527 0,02417 -0,22428 -0,2083 0,02584 0,05497
PCM -
Footwear
0,07335 0,05315 -0,00918 -0,03315 0,04334 0,02598
TABLE 20
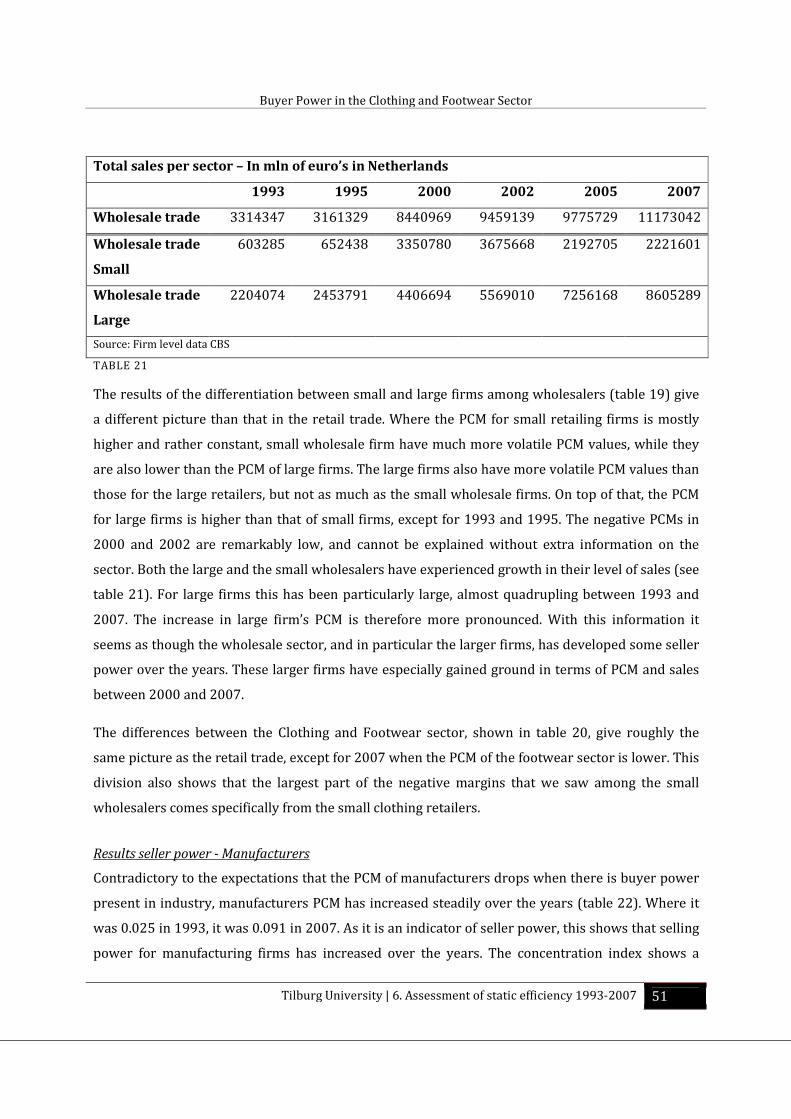
Buyer Power in the Clothing and Footwear Sector
Tilburg University | 6. Assessment of static efficiency 1993-2007 51
TABLE 21
The results of the differentiation between small and large firms among wholesalers (table 19) give
a different picture than that in the retail trade. Where the PCM for small retailing firms is mostly
higher and rather constant, small wholesale firm have much more volatile PCM values, while they
are also lower than the PCM of large firms. The large firms also have more volatile PCM values than
those for the large retailers, but not as much as the small wholesale firms. On top of that, the PCM
for large firms is higher than that of small firms, except for 1993 and 1995. The negative PCMs in
2000 and 2002 are remarkably low, and cannot be explained without extra information on the
sector. Both the large and the small wholesalers have experienced growth in their level of sales (see
table 21). For large firms this has been particularly large, almost quadrupling between 1993 and
2007. The increase in large firm’s PCM is therefore more pronounced. With this information it
seems as though the wholesale sector, and in particular the larger firms, has developed some seller
power over the years. These larger firms have especially gained ground in terms of PCM and sales
between 2000 and 2007.
The differences between the Clothing and Footwear sector, shown in table 20, give roughly the
same picture as the retail trade, except for 2007 when the PCM of the footwear sector is lower. This
division also shows that the largest part of the negative margins that we saw among the small
wholesalers comes specifically from the small clothing retailers.
Results seller power - Manufacturers
Contradictory to the expectations that the PCM of manufacturers drops when there is buyer power
present in industry, manufacturers PCM has increased steadily over the years (table 22). Where it
was 0.025 in 1993, it was 0.091 in 2007. As it is an indicator of seller power, this shows that selling
power for manufacturing firms has increased over the years. The concentration index shows a
Total sales per sector – In mln of euro’s in Netherlands
1993 1995 2000 2002 2005 2007
Wholesale trade 3314347 3161329 8440969 9459139 9775729 11173042
Wholesale trade
Small
603285 652438 3350780 3675668 2192705 2221601
Wholesale trade
Large
2204074 2453791 4406694 5569010 7256168 8605289
Source: Firm level data CBS
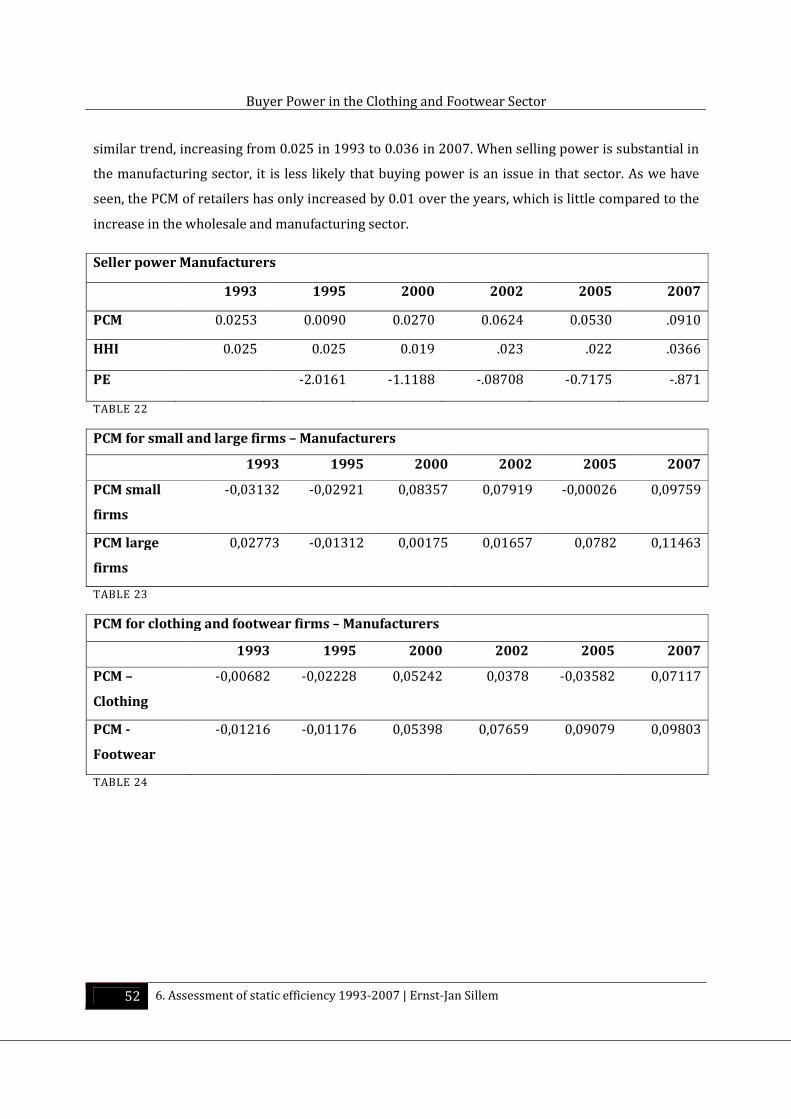
Buyer Power in the Clothing and Footwear Sector
52 6. Assessment of static efficiency 1993-2007 | Ernst-Jan Sillem
similar trend, increasing from 0.025 in 1993 to 0.036 in 2007. When selling power is substantial in
the manufacturing sector, it is less likely that buying power is an issue in that sector. As we have
seen, the PCM of retailers has only increased by 0.01 over the years, which is little compared to the
increase in the wholesale and manufacturing sector.
Seller power Manufacturers
1993 1995 2000 2002 2005 2007
PCM 0.0253 0.0090 0.0270 0.0624 0.0530 .0910
HHI 0.025 0.025 0.019 .023 .022 .0366
PE -2.0161 -1.1188 -.08708 -0.7175 -.871
TABLE 22
PCM for small and large firms – Manufacturers
1993 1995 2000 2002 2005 2007
PCM small
firms
-0,03132
-0,02921
0,08357
0,07919
-0,00026
0,09759
PCM large
firms
0,02773
-0,01312
0,00175
0,01657
0,0782
0,11463
TABLE 23
PCM for clothing and footwear firms – Manufacturers
1993 1995 2000 2002 2005 2007
PCM –
Clothing
-0,00682
-0,02228
0,05242
0,0378
-0,03582
0,07117
PCM -
Footwear
-0,01216
-0,01176
0,05398
0,07659
0,09079
0,09803
TABLE 24
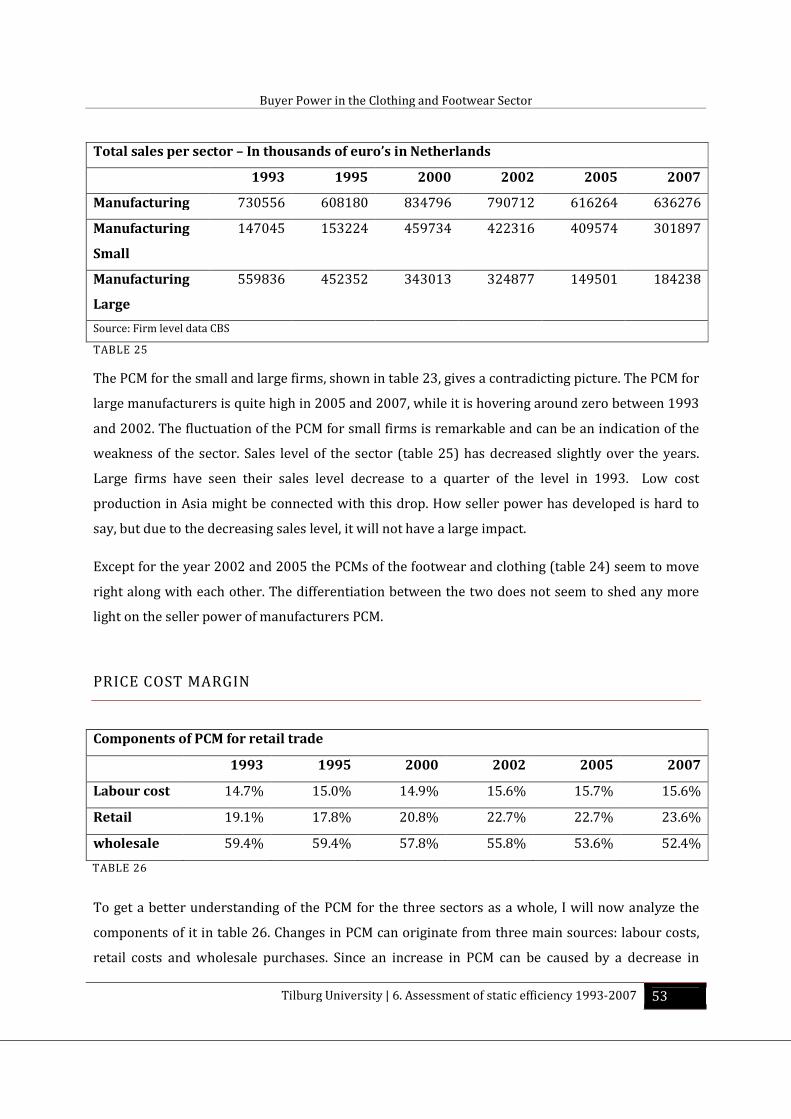
Buyer Power in the Clothing and Footwear Sector
Tilburg University | 6. Assessment of static efficiency 1993-2007 53
TABLE 25
The PCM for the small and large firms, shown in table 23, gives a contradicting picture. The PCM for
large manufacturers is quite high in 2005 and 2007, while it is hovering around zero between 1993
and 2002. The fluctuation of the PCM for small firms is remarkable and can be an indication of the
weakness of the sector. Sales level of the sector (table 25) has decreased slightly over the years.
Large firms have seen their sales level decrease to a quarter of the level in 1993. Low cost
production in Asia might be connected with this drop. How seller power has developed is hard to
say, but due to the decreasing sales level, it will not have a large impact.
Except for the year 2002 and 2005 the PCMs of the footwear and clothing (table 24) seem to move
right along with each other. The differentiation between the two does not seem to shed any more
light on the seller power of manufacturers PCM.
PRICE COST MARGIN
To get a better understanding of the PCM for the three sectors as a whole, I will now analyze the
components of it in table 26. Changes in PCM can originate from three main sources: labour costs,
retail costs and wholesale purchases. Since an increase in PCM can be caused by a decrease in
Total sales per sector – In thousands of euro’s in Netherlands
1993 1995 2000 2002 2005 2007
Manufacturing 730556 608180 834796 790712 616264 636276
Manufacturing
Small
147045 153224 459734 422316 409574 301897
Manufacturing
Large
559836 452352 343013 324877 149501 184238
Source: Firm level data CBS
Components of PCM for retail trade
1993 1995 2000 2002 2005 2007
Labour cost 14.7% 15.0% 14.9% 15.6% 15.7% 15.6%
Retail 19.1% 17.8% 20.8% 22.7% 22.7% 23.6%
wholesale 59.4% 59.4% 57.8% 55.8% 53.6% 52.4%
TABLE 26
Buyer Power in the Clothing and Footwear Sector
54 6. Assessment of static efficiency 1993-2007 | Ernst-Jan Sillem
marginal cost, it should be noticed that marginal cost is influenced mainly by labour costs and retail
costs. Wholesale purchases will reflect potential buyer power de- or increases. Table 26 shows the
other components of the retail price. It is clearly visible that over the years the retail costs have
increased by 4% of total sales, while the wholesale cost have decreased by almost 7 percent. This
would account for the 3-4% percent increase in the PCM that we have observed above. It would
also be an indication that the retailers posses some buyer power towards their suppliers.
It can also be explained by an increase in labour productivity, although the decrease in wholesale
purchases seems to explain most of the change. To make sure there are no underlying
developments in for instance labour productivity, I have analyzed the labour productivity in the
retail trade.
Labour Productivity in the Netherlands
1993 1995 2000 2002 2005 2007
Based on firm
level data for
clothing sector
34.12 33.14 42.86 44.52 45.36 45.01
Statline 35 36 47 52 55 59
TABLE 27
As table 27 shows there has been a steady and continuous climb in labour productivity. It does
become apparent that the labour productivity has increased more according to Statline than
according to the firm level data. Combined with the steady labour cost share in the PCM ratio this
suggests that real wages have been in line with real labour productivity.
Table 28 shows the same components of the PCM, but now for wholesalers. In the previous section
the wholesale sector showed to have the largest increase in their PCM.
Components of PCM for Wholesale
1993 1995 2000 2002 2005 2007
Labour cost 7.3% 7.5% 5.2% 5.7% 5.6% 5.7%
retail 11.2% 14.1% 22.4% 23.4% 19.7% 21.7%
Wholesale 77.0% 74.6% 68.9% 68.6% 66.9% 64.4%
TABLE 28
The picture for the wholesale sector is very different than that of the retail sector. The share of
labour costs has decreased from 7.5% in 1995 to 5.7% in 2007. The largest part of this decrease has
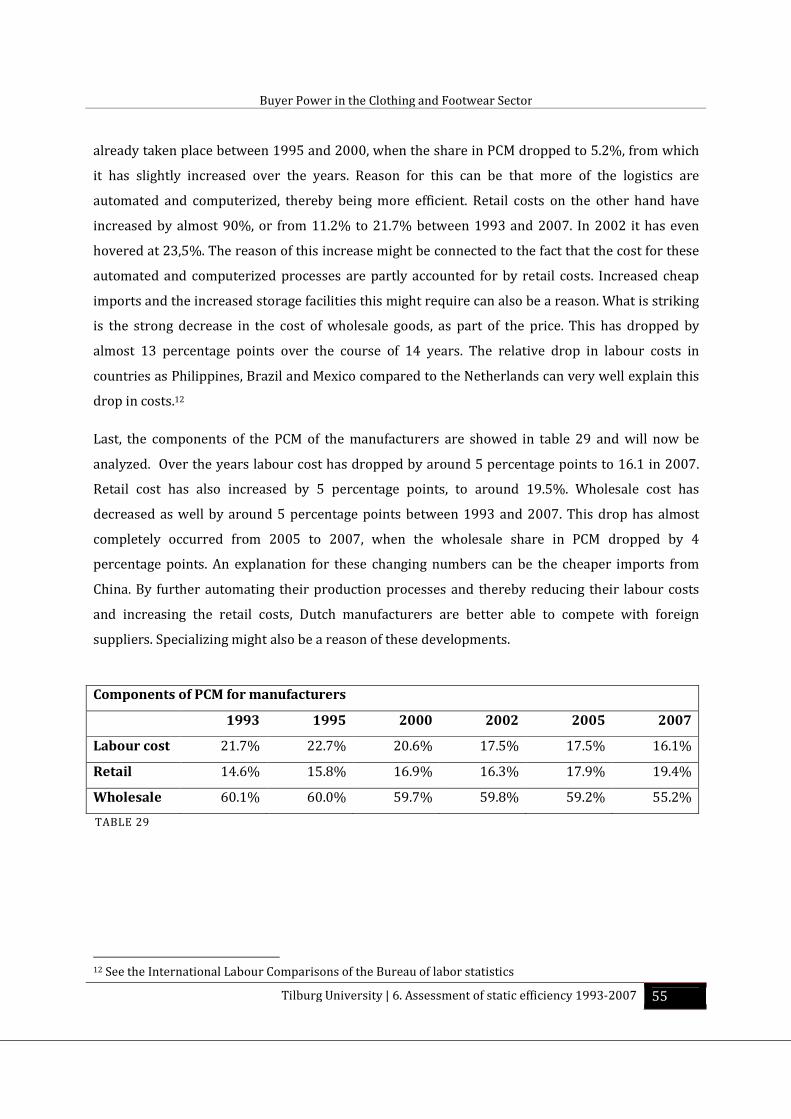
Buyer Power in the Clothing and Footwear Sector
Tilburg University | 6. Assessment of static efficiency 1993-2007 55
already taken place between 1995 and 2000, when the share in PCM dropped to 5.2%, from which
it has slightly increased over the years. Reason for this can be that more of the logistics are
automated and computerized, thereby being more efficient. Retail costs on the other hand have
increased by almost 90%, or from 11.2% to 21.7% between 1993 and 2007. In 2002 it has even
hovered at 23,5%. The reason of this increase might be connected to the fact that the cost for these
automated and computerized processes are partly accounted for by retail costs. Increased cheap
imports and the increased storage facilities this might require can also be a reason. What is striking
is the strong decrease in the cost of wholesale goods, as part of the price. This has dropped by
almost 13 percentage points over the course of 14 years. The relative drop in labour costs in
countries as Philippines, Brazil and Mexico compared to the Netherlands can very well explain this
drop in costs.12
Last, the components of the PCM of the manufacturers are showed in table 29 and will now be
analyzed. Over the years labour cost has dropped by around 5 percentage points to 16.1 in 2007.
Retail cost has also increased by 5 percentage points, to around 19.5%. Wholesale cost has
decreased as well by around 5 percentage points between 1993 and 2007. This drop has almost
completely occurred from 2005 to 2007, when the wholesale share in PCM dropped by 4
percentage points. An explanation for these changing numbers can be the cheaper imports from
China. By further automating their production processes and thereby reducing their labour costs
and increasing the retail costs, Dutch manufacturers are better able to compete with foreign
suppliers. Specializing might also be a reason of these developments.
12 See the International Labour Comparisons of the Bureau of labor statistics
Components of PCM for manufacturers
1993 1995 2000 2002 2005 2007
Labour cost 21.7% 22.7% 20.6% 17.5% 17.5% 16.1%
Retail 14.6% 15.8% 16.9% 16.3% 17.9% 19.4%
Wholesale 60.1% 60.0% 59.7% 59.8% 59.2% 55.2%
TABLE 29
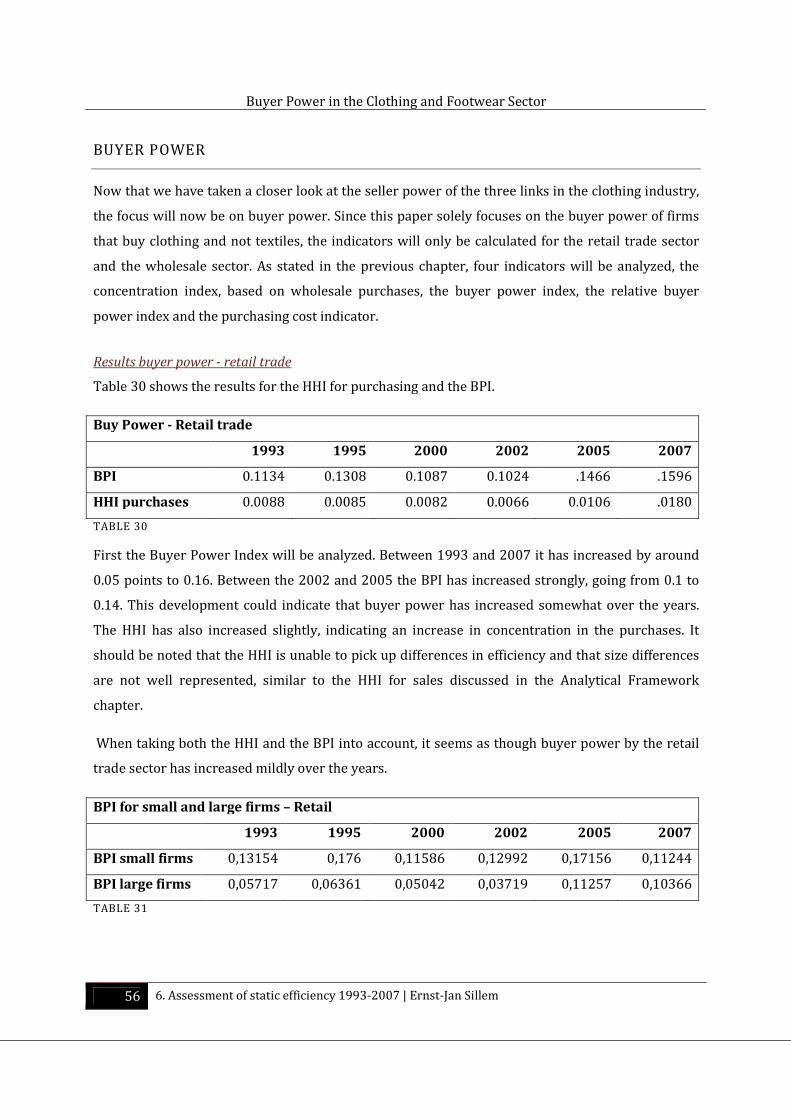
Buyer Power in the Clothing and Footwear Sector
56 6. Assessment of static efficiency 1993-2007 | Ernst-Jan Sillem
BUYER POWER
Now that we have taken a closer look at the seller power of the three links in the clothing industry,
the focus will now be on buyer power. Since this paper solely focuses on the buyer power of firms
that buy clothing and not textiles, the indicators will only be calculated for the retail trade sector
and the wholesale sector. As stated in the previous chapter, four indicators will be analyzed, the
concentration index, based on wholesale purchases, the buyer power index, the relative buyer
power index and the purchasing cost indicator.
Results buyer power - retail trade
Table 30 shows the results for the HHI for purchasing and the BPI.
Buy Power - Retail trade
1993 1995 2000 2002 2005 2007
BPI 0.1134 0.1308 0.1087 0.1024 .1466 .1596
HHI purchases 0.0088 0.0085 0.0082 0.0066 0.0106 .0180
TABLE 30
First the Buyer Power Index will be analyzed. Between 1993 and 2007 it has increased by around
0.05 points to 0.16. Between the 2002 and 2005 the BPI has increased strongly, going from 0.1 to
0.14. This development could indicate that buyer power has increased somewhat over the years.
The HHI has also increased slightly, indicating an increase in concentration in the purchases. It
should be noted that the HHI is unable to pick up differences in efficiency and that size differences
are not well represented, similar to the HHI for sales discussed in the Analytical Framework
chapter.
When taking both the HHI and the BPI into account, it seems as though buyer power by the retail
trade sector has increased mildly over the years.
BPI for small and large firms – Retail
1993 1995 2000 2002 2005 2007
BPI small firms 0,13154 0,176 0,11586 0,12992 0,17156 0,11244
BPI large firms 0,05717 0,06361 0,05042 0,03719 0,11257 0,10366
TABLE 31
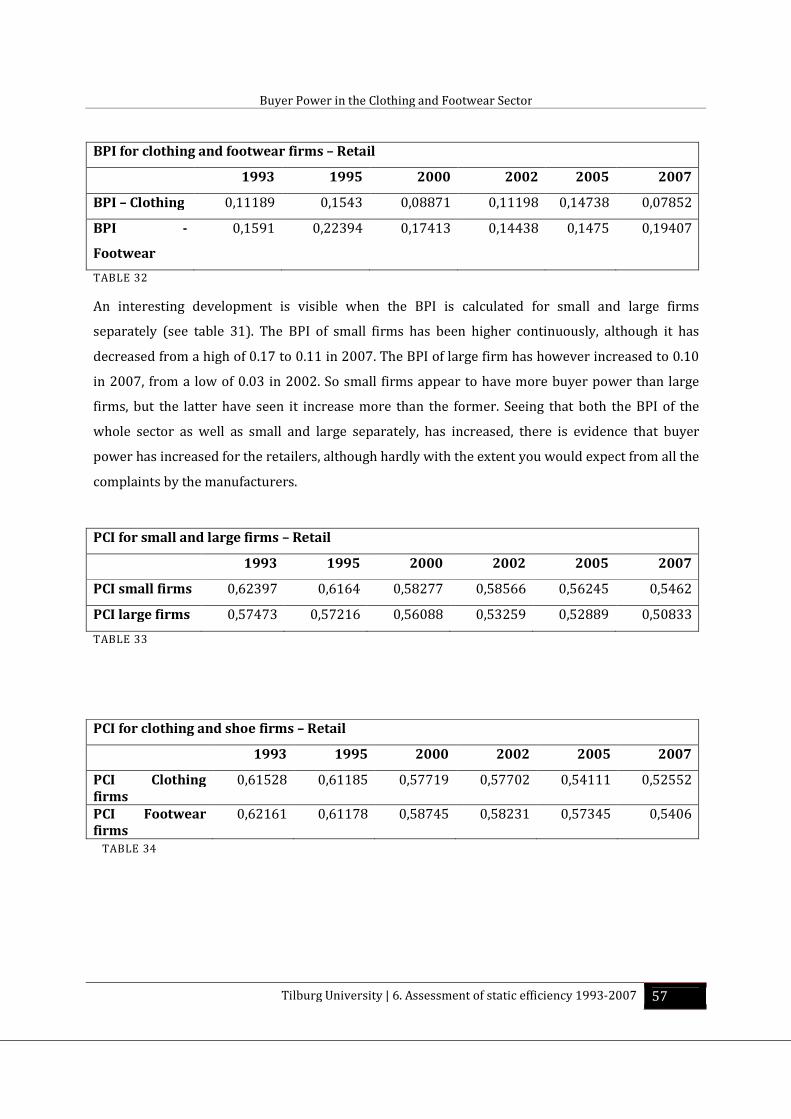
Buyer Power in the Clothing and Footwear Sector
Tilburg University | 6. Assessment of static efficiency 1993-2007 57
BPI for clothing and footwear firms – Retail
1993 1995 2000 2002 2005 2007
BPI – Clothing 0,11189 0,1543 0,08871 0,11198 0,14738 0,07852
BPI -
Footwear
0,1591 0,22394 0,17413 0,14438 0,1475 0,19407
TABLE 32
An interesting development is visible when the BPI is calculated for small and large firms
separately (see table 31). The BPI of small firms has been higher continuously, although it has
decreased from a high of 0.17 to 0.11 in 2007. The BPI of large firm has however increased to 0.10
in 2007, from a low of 0.03 in 2002. So small firms appear to have more buyer power than large
firms, but the latter have seen it increase more than the former. Seeing that both the BPI of the
whole sector as well as small and large separately, has increased, there is evidence that buyer
power has increased for the retailers, although hardly with the extent you would expect from all the
complaints by the manufacturers.
PCI for small and large firms – Retail
1993 1995 2000 2002 2005 2007
PCI small firms 0,62397 0,6164 0,58277 0,58566 0,56245 0,5462
PCI large firms 0,57473 0,57216 0,56088 0,53259 0,52889 0,50833
TABLE 33
PCI for clothing and shoe firms – Retail
1993 1995 2000 2002 2005 2007
PCI Clothing
firms
0,61528
0,61185
0,57719
0,57702
0,54111
0,52552
PCI Footwear
firms
0,62161
0,61178
0,58745
0,58231
0,57345
0,5406
TABLE 34
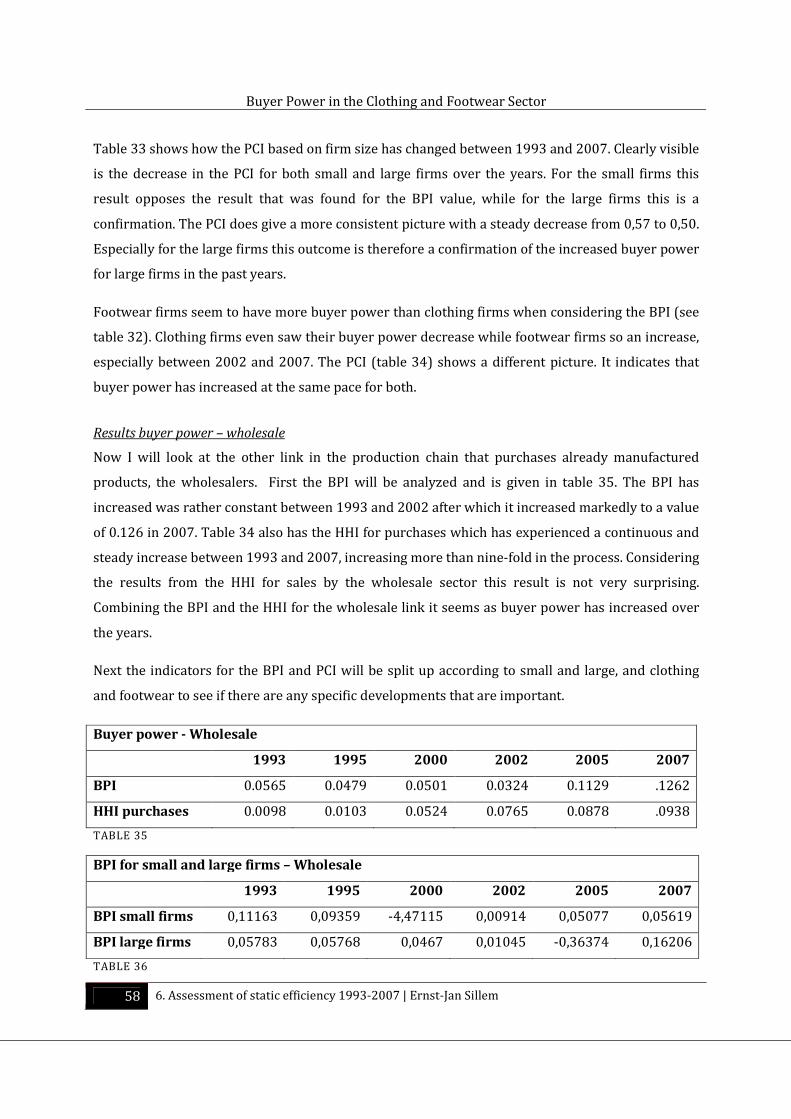
Buyer Power in the Clothing and Footwear Sector
58 6. Assessment of static efficiency 1993-2007 | Ernst-Jan Sillem
Table 33 shows how the PCI based on firm size has changed between 1993 and 2007. Clearly visible
is the decrease in the PCI for both small and large firms over the years. For the small firms this
result opposes the result that was found for the BPI value, while for the large firms this is a
confirmation. The PCI does give a more consistent picture with a steady decrease from 0,57 to 0,50.
Especially for the large firms this outcome is therefore a confirmation of the increased buyer power
for large firms in the past years.
Footwear firms seem to have more buyer power than clothing firms when considering the BPI (see
table 32). Clothing firms even saw their buyer power decrease while footwear firms so an increase,
especially between 2002 and 2007. The PCI (table 34) shows a different picture. It indicates that
buyer power has increased at the same pace for both.
Results buyer power – wholesale
Now I will look at the other link in the production chain that purchases already manufactured
products, the wholesalers. First the BPI will be analyzed and is given in table 35. The BPI has
increased was rather constant between 1993 and 2002 after which it increased markedly to a value
of 0.126 in 2007. Table 34 also has the HHI for purchases which has experienced a continuous and
steady increase between 1993 and 2007, increasing more than nine-fold in the process. Considering
the results from the HHI for sales by the wholesale sector this result is not very surprising.
Combining the BPI and the HHI for the wholesale link it seems as buyer power has increased over
the years.
Next the indicators for the BPI and PCI will be split up according to small and large, and clothing
and footwear to see if there are any specific developments that are important.
Buyer power - Wholesale
1993 1995 2000 2002 2005 2007
BPI 0.0565 0.0479 0.0501 0.0324 0.1129 .1262
HHI purchases 0.0098 0.0103 0.0524 0.0765 0.0878 .0938
TABLE 35
BPI for small and large firms – Wholesale
1993 1995 2000 2002 2005 2007
BPI small firms 0,11163 0,09359 -4,47115 0,00914 0,05077 0,05619
BPI large firms 0,05783 0,05768 0,0467 0,01045 -0,36374 0,16206
TABLE 36
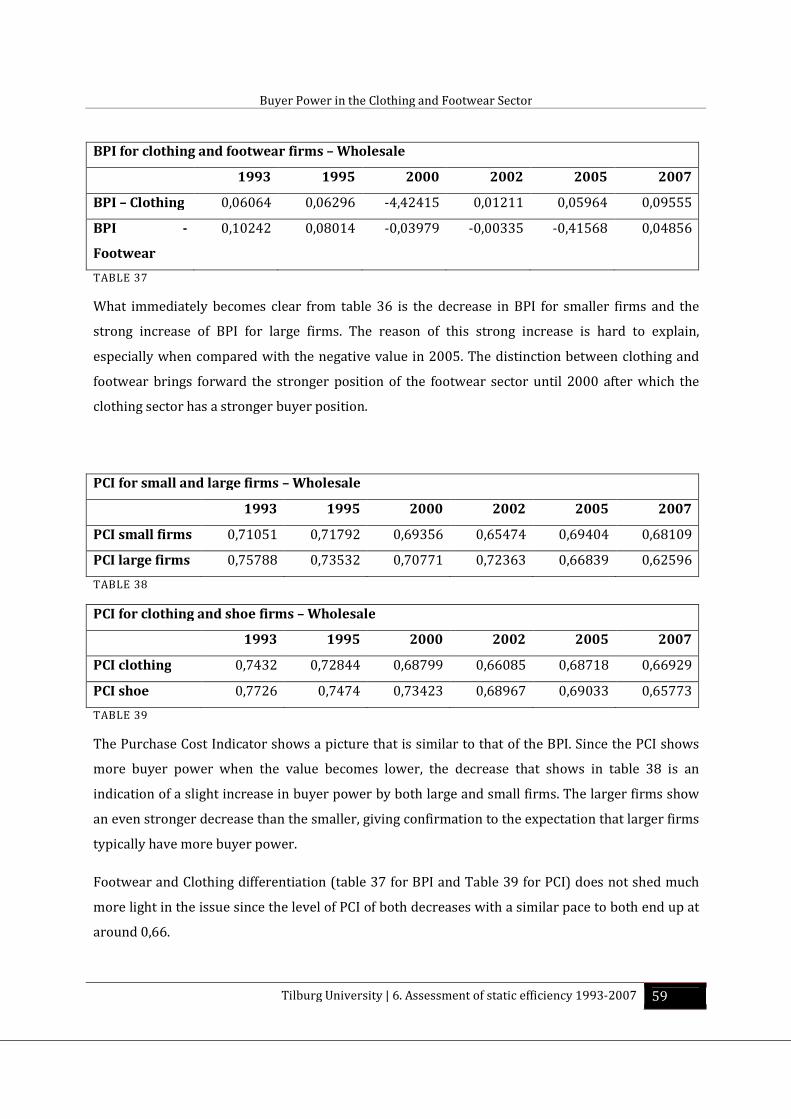
Buyer Power in the Clothing and Footwear Sector
Tilburg University | 6. Assessment of static efficiency 1993-2007 59
BPI for clothing and footwear firms – Wholesale
1993 1995 2000 2002 2005 2007
BPI – Clothing 0,06064 0,06296 -4,42415 0,01211 0,05964 0,09555
BPI -
Footwear
0,10242 0,08014 -0,03979 -0,00335 -0,41568 0,04856
TABLE 37
What immediately becomes clear from table 36 is the decrease in BPI for smaller firms and the
strong increase of BPI for large firms. The reason of this strong increase is hard to explain,
especially when compared with the negative value in 2005. The distinction between clothing and
footwear brings forward the stronger position of the footwear sector until 2000 after which the
clothing sector has a stronger buyer position.
PCI for small and large firms – Wholesale
1993 1995 2000 2002 2005 2007
PCI small firms 0,71051 0,71792 0,69356 0,65474 0,69404 0,68109
PCI large firms 0,75788 0,73532 0,70771 0,72363 0,66839 0,62596
TABLE 38
PCI for clothing and shoe firms – Wholesale
1993 1995 2000 2002 2005 2007
PCI clothing 0,7432 0,72844 0,68799 0,66085 0,68718 0,66929
PCI shoe 0,7726 0,7474 0,73423 0,68967 0,69033 0,65773
TABLE 39
The Purchase Cost Indicator shows a picture that is similar to that of the BPI. Since the PCI shows
more buyer power when the value becomes lower, the decrease that shows in table 38 is an
indication of a slight increase in buyer power by both large and small firms. The larger firms show
an even stronger decrease than the smaller, giving confirmation to the expectation that larger firms
typically have more buyer power.
Footwear and Clothing differentiation (table 37 for BPI and Table 39 for PCI) does not shed much
more light in the issue since the level of PCI of both decreases with a similar pace to both end up at
around 0,66.
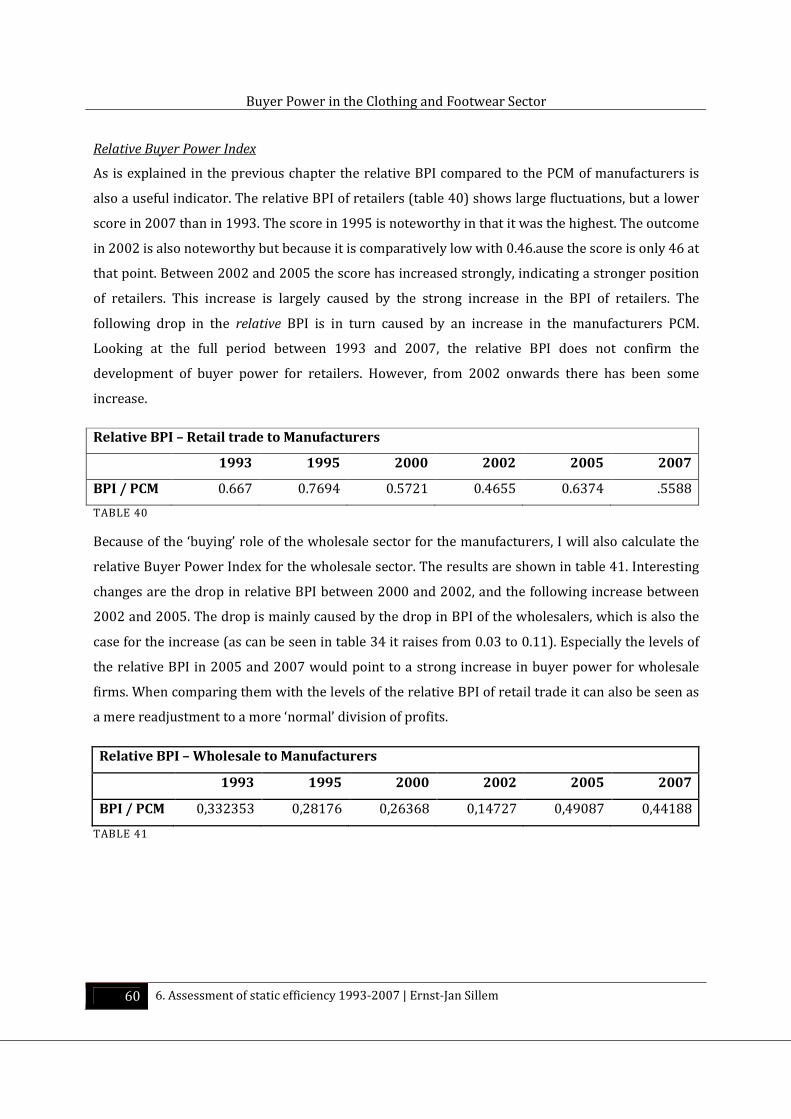
Buyer Power in the Clothing and Footwear Sector
60 6. Assessment of static efficiency 1993-2007 | Ernst-Jan Sillem
Relative Buyer Power Index
As is explained in the previous chapter the relative BPI compared to the PCM of manufacturers is
also a useful indicator. The relative BPI of retailers (table 40) shows large fluctuations, but a lower
score in 2007 than in 1993. The score in 1995 is noteworthy in that it was the highest. The outcome
in 2002 is also noteworthy but because it is comparatively low with 0.46.ause the score is only 46 at
that point. Between 2002 and 2005 the score has increased strongly, indicating a stronger position
of retailers. This increase is largely caused by the strong increase in the BPI of retailers. The
following drop in the relative BPI is in turn caused by an increase in the manufacturers PCM.
Looking at the full period between 1993 and 2007, the relative BPI does not confirm the
development of buyer power for retailers. However, from 2002 onwards there has been some
increase.
Relative BPI – Retail trade to Manufacturers
1993 1995 2000 2002 2005 2007
BPI / PCM 0.667 0.7694 0.5721 0.4655 0.6374 .5588
TABLE 40
Because of the ‘buying’ role of the wholesale sector for the manufacturers, I will also calculate the
relative Buyer Power Index for the wholesale sector. The results are shown in table 41. Interesting
changes are the drop in relative BPI between 2000 and 2002, and the following increase between
2002 and 2005. The drop is mainly caused by the drop in BPI of the wholesalers, which is also the
case for the increase (as can be seen in table 34 it raises from 0.03 to 0.11). Especially the levels of
the relative BPI in 2005 and 2007 would point to a strong increase in buyer power for wholesale
firms. When comparing them with the levels of the relative BPI of retail trade it can also be seen as
a mere readjustment to a more ‘normal’ division of profits.
Relative BPI – Wholesale to Manufacturers
1993 1995 2000 2002 2005 2007
BPI / PCM 0,332353 0,28176 0,26368 0,14727 0,49087 0,44188
TABLE 41
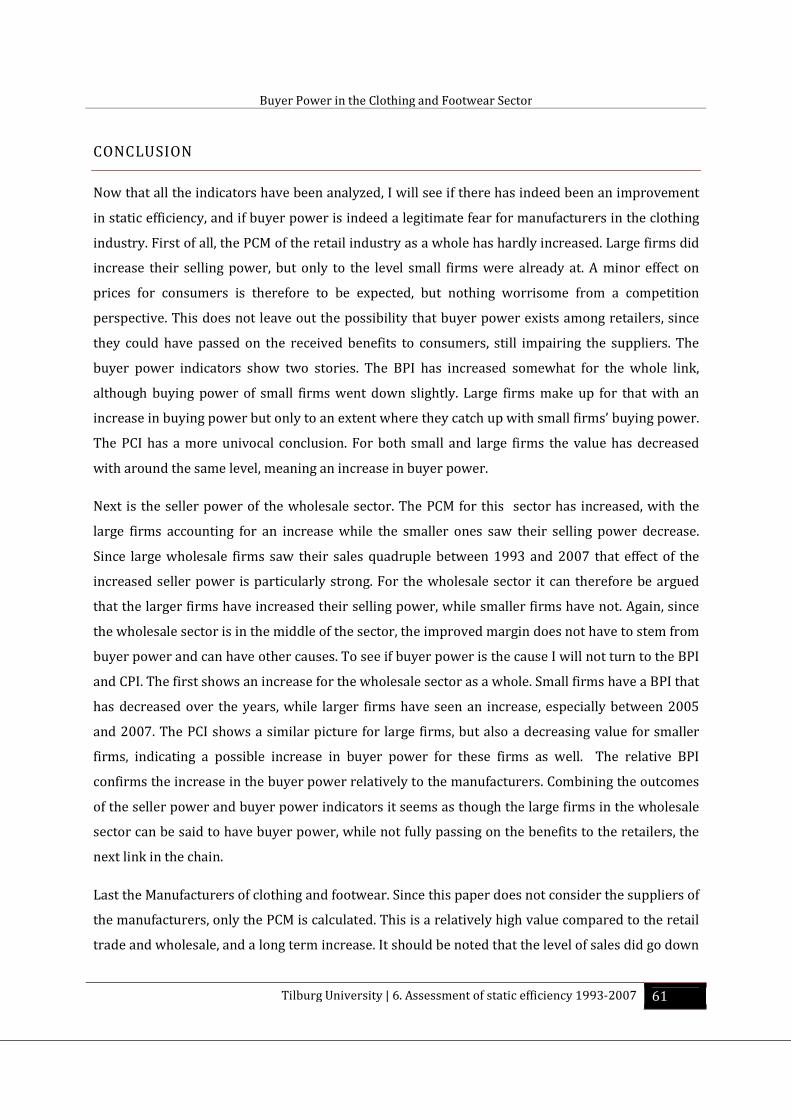
Buyer Power in the Clothing and Footwear Sector
Tilburg University | 6. Assessment of static efficiency 1993-2007 61
CONCLUSION
Now that all the indicators have been analyzed, I will see if there has indeed been an improvement
in static efficiency, and if buyer power is indeed a legitimate fear for manufacturers in the clothing
industry. First of all, the PCM of the retail industry as a whole has hardly increased. Large firms did
increase their selling power, but only to the level small firms were already at. A minor effect on
prices for consumers is therefore to be expected, but nothing worrisome from a competition
perspective. This does not leave out the possibility that buyer power exists among retailers, since
they could have passed on the received benefits to consumers, still impairing the suppliers. The
buyer power indicators show two stories. The BPI has increased somewhat for the whole link,
although buying power of small firms went down slightly. Large firms make up for that with an
increase in buying power but only to an extent where they catch up with small firms’ buying power.
The PCI has a more univocal conclusion. For both small and large firms the value has decreased
with around the same level, meaning an increase in buyer power.
Next is the seller power of the wholesale sector. The PCM for this sector has increased, with the
large firms accounting for an increase while the smaller ones saw their selling power decrease.
Since large wholesale firms saw their sales quadruple between 1993 and 2007 that effect of the
increased seller power is particularly strong. For the wholesale sector it can therefore be argued
that the larger firms have increased their selling power, while smaller firms have not. Again, since
the wholesale sector is in the middle of the sector, the improved margin does not have to stem from
buyer power and can have other causes. To see if buyer power is the cause I will not turn to the BPI
and CPI. The first shows an increase for the wholesale sector as a whole. Small firms have a BPI that
has decreased over the years, while larger firms have seen an increase, especially between 2005
and 2007. The PCI shows a similar picture for large firms, but also a decreasing value for smaller
firms, indicating a possible increase in buyer power for these firms as well. The relative BPI
confirms the increase in the buyer power relatively to the manufacturers. Combining the outcomes
of the seller power and buyer power indicators it seems as though the large firms in the wholesale
sector can be said to have buyer power, while not fully passing on the benefits to the retailers, the
next link in the chain.
Last the Manufacturers of clothing and footwear. Since this paper does not consider the suppliers of
the manufacturers, only the PCM is calculated. This is a relatively high value compared to the retail
trade and wholesale, and a long term increase. It should be noted that the level of sales did go down
Buyer Power in the Clothing and Footwear Sector
62 6. Assessment of static efficiency 1993-2007 | Ernst-Jan Sillem
markedly. So although the retail and wholesale sector has seen an increase in its buyer power, the
manufacturers have nonetheless managed to sustain some selling power.
Buyer Power in the Clothing and Footwear Sector
Tilburg University | 7. Conclusion 63
7. CONCLUSION
Now that both the theoretical insights and the empirical findings in buyer power in the clothing
sector have been analyzed, I will answer the research question posed at the beginning of this paper:
What is the distribution of market power between clothing and footwear retailers, wholesalers and
manufacturers, and how has it developed over time?
First a literature review was performed where it was found that under certain, sometimes
stringent, assumptions most papers find that a large firm that demands a discount or benefits from
winning a procurement will receive benefits not available to other and/or smaller buyer firms. The
EIM report (2009) confirms these findings since 58% of the manufacturers and wholesalers have
been confronted with unreasonable demands by large retailers.
The empirical findings suggest that retailers did have some increase in seller and buyer power.
Large firms had a strong increase in selling power, but only to catch up with the seller power level
of small firms. Buyer power for retailers has developed mostly in the same fashion. Possible
detrimental effects of the development in the distribution of market power are therefore possible.
Pin pointing the larger firms as the main abusers of buyer power therefore seems incorrect based
on the absent difference in market power between small and large retailing firms.
Wholesale firms show a clearer picture, since they have seen both an increase in the selling and
buying power. Possible detrimental effects in the clothing and footwear industry therefore seem to
take place in this link more than in the retail trade. This effect is enhanced by the strong increase in
sales by the wholesalers. Both small and large manufacturers have seen their seller power increase.
The increased in buyer power of wholesalers therefore did not have a negative effect on them.
When relating the outcomes of the empirical research to the EIM report (2009) it is surprising that
the wholesale sector has experienced both an increase in buyer and seller power, while being
portrayed as the victim of buyer power by retailers in the report. So although especially large
retailers saw their buyer and seller power increase somewhat, this does not have to indicate a
detrimental development for wholesalers and manufacturers. Even the increase in seller power by
retailers has not led to higher prices for consumers as was shown by the retail price developments.
Buyer Power in the Clothing and Footwear Sector
64 7. Conclusion | Ernst-Jan Sillem
Whether or not measures need to be taken cannot be said with certainty, but looking at the results
in the market power distribution and consumer price developments there appears to be no reason
to do so.
Buyer Power in the Clothing and Footwear Sector
Tilburg University | 8. References 65
8. REFERENCES
Battigalli, P., Fumagalli, C., and Polo, M. 2007. "Buyer Power and Quality Improvements."
Research in Economics, 61, pp. 45-61.
Blair, R.D., and Harrison, J.L. 1993. Monopsony: Antitrust Law and Economics. Princeton University
Press.
Bocconi_University. 2007. "Business Relations in the Eu Clothing Chain: From Industry to Retail
and Distribution," In.
Chen, Z. 2004. "Countervailing Power and Product Diversity." Econometric Society 2004 North
American Winter Meetings, 279.
____. 2008. "Defining Buyer Power." The Antitrust Bulletin, 53(2 / Summer 2008), pp. 241-50.
Creusen, H., Meijer, A., Zwart, G., and V.d. Wiel, H. 2008. "Static Efficiency in Dutch Supermarket
Chain." CPB Document, no. 163.
Deloitte. 2006. "Retail Growth Challenge Framework: The Changing Nature of Retail."
Dobson, P. W., Clarke, R., Davies, S. and Waterson, M. 2001. "Buyer Power and Its Impact on
Competition in the Food Retail Distribution Sector of the European Union." Journal of Industry,
Competition and Trade, 1(3), pp. 247 – 81.
Dobson, P.W., and Waterson, M. 1997. "Countervailing Power and Consumer Prices." The
Economic Journal, 107(March), pp. 418-30.
Drost, F. 2004. "De Neergang Van De Textielindustrie." Webmagazine CBS.
EIM. 2009. "De Aard and Omvang Van Inkoopmacht," In. Zoetermeer: EIM.
Fisher-Ellison, S., and Snyder, C.M. 2001. "Countervailing Power in Wholesale Pharmaceuticals."
MIT Dept. of Economics, Working Paper, 01-27.
Galbraith, J.K. 1952. American Capitalism: The Concept of Countervailing Power. Houghton Mifflin.
Inderst, R., and Mazzarotto, N. . 2008. "Buyer Power in Distribution," In Issues in Competition Law
and Policy (Aba Antitrust Section Handbook), ed. W. D. Collins.
Inderst, R., and Shaffer, G. 2007. "Retail Mergers, Buyer Power and Product Variety." The
Economic Journal, 117(January), pp. 45-67.
Inderst, R., and Valetti, M. 2009A. "Buyer Power and the "Waterbed Effect"." Working paper.
Forthcoming in Journal of Industrial Economics.
____. 2009B. "Price Discrimination in Input Markets." RAND Journal of Economics, 40(1).
Buyer Power in the Clothing and Footwear Sector
66 8. References | Ernst-Jan Sillem
Inderst, R., and Wey, C. 2007. "Buyer Power and Supplier Incentives." European Economic Review,
51, pp. 647-67.
Majumdar, A. 2005. "Waterbed Effects and Buyer Mergers." Centre for Competition Policy Working
Paper, 05-7.
Mills, D. 2010. "Buyer Power and Industry Structure." Review of Industrial Organisation, 36, pp.
213-25.
Nagurney, A. 2010. "Formulation and Analysis of Horizontal Mergers among Oligopolistic Firms
with Insights into the Merger Paradox: A Supply Chain Network Perspective." Computer
Management Science, 7, pp. 377-406.
Peters, J. 2000. "Buyer Market Power and Innovative Activities " Review of Industrial Organisation,
16, pp. 13-38.
Schumacher, U. 1991. "Buyer Structure and Seller Performance in U.S. Manufacturing Industries."
The Review of Economics and Statistics, 73(2), pp. 277-84.
Stackelberg, H. von. 1939. Marktform Und Gleichgewicht. Berlin: Julius Springer.
Tirole, J. 1988. The Theory of Industrial Organisation. Cambridge, MA: MIT Press.
Van der Wiel, H. 2010. "Competition and Innovation - Together a Tricky Rollercoaster for
Productivity," In. Tilburg: Tilburg university.
Von Ungern-Sternberg, T. 1996. "Countervailing Power Revisited." International Journal of
Industrial Organisation, 14, pp. 507-20.
Whinstons, M.D. 2006. "Lectures on Antitrust Economics," In. Cambridge: MIT press.
WTO. 2006. "International Trade Statistics," In. Geneva.
(P. Battigalli, Fumagalli, C., and Polo, M., 2007, R.D. Blair, and Harrison, J.L., 1993,
Bocconi_University, 2007, Z. Chen, 2004, 2008, H. Creusen, Meijer, A., Zwart, G., and V.d. Wiel, H.,
2008, Deloitte, 2006, P. W. Dobson, Clarke, R., Davies, S. and Waterson, M., 2001, P.W. Dobson, and
Waterson, M., 1997, F. Drost, 2004, EIM, 2009, S. Fisher-Ellison, and Snyder, C.M., 2001, J.K.
Galbraith, 1952, R. Inderst, and Mazzarotto, N. , 2008, R. Inderst, and Shaffer, G., 2007, R. Inderst,
and Valetti, M., 2009A, 2009B, R. Inderst, and Wey, C., 2007, A. Majumdar, 2005, D. Mills, 2010, A.
Nagurney, 2010, J. Peters, 2000, U. Schumacher, 1991, H. von Stackelberg, 1939, J. Tirole, 1988, H.
Van der Wiel, 2010, T. Von Ungern-Sternberg, 1996, M.D. Whinstons, 2006, WTO, 2006)
Buyer Power in the Clothing and Footwear Sector
Tilburg University | 8. References 67
This thesis is the final product of month-long process that started in March 2010. After a lucky
break on a website that had not been updated for over two years I was given the opportunity to do
an internship at the Ministry of Economic Affairs, directorate Competition and Consumers, in the
months May, June and July. During the interview some of the current issues that the directorate was
dealing with were shared with me and buyer power immediately caught my attention.
After reading into the topic I approached Prof. Dr. van Damme to ask if he wanted to supervise my
thesis, which he did. I owe him many thanks for the time he has taken in reading the chapters of this
paper and commenting on them extensively, which was highly appreciated.
The three months at the Ministry were also very useful, valuable and enjoyable, for me, my thesis as
well a potential future career path. In particular I would like to thank Tjade Stroband, Anne-Mieke
den Teuling, and Wynand Brants for supporting me in writing my thesis as well as involving me in
the day to day business of policy making at the Ministry.
Due to the economic nature of master degree I was still looking for a possibility to do an empirical
analysis on buyer power. Statistics Netherlands gave me this opportunity via a short internship
during which I could use their firm-level data and facilities. Dr. George van Leeuwen has been
extremely helpful during my time there, both in making the arrangements as well as helping on the
statistical programs and some of the indicators. I am very grateful for his help.
Dr. Henry van der Wiel is not only contributing to this thesis in his capacity as exam committee
member, but also by tirelessly answering my emails on some of the details of his articles. For both I
am very appreciative.
Last, I would like to thank my parents and girlfriend in supporting me, during my thesis,
internships, and during my time at the university in general.


![“BUYER POWER” AND ECONOMIC POLICY - American … · · 2013-10-292005] “Buyer Power” and Economic Policy 591 The issue of whether antitrust enforcement should be symmetric](https://img.pdfslide.us/doc/110x75/5b06f8237f8b9a56408c61da/buyer-power-and-economic-policy-american-buyer-power-and-economic.jpg)