Embed Size (px)
Citation preview

INITIATING COVERAGE 16 OCT 2017
Strides Shasun BUY
HDFC securities Institutional Research is also available on Bloomberg HSLB <GO>& Thomson Reuters
Specialist in wealth creationOver the last decade, Strides Shasun (STR) has given its shareholders a phenomenal ~30% compounded annual return. Capital invested in Oct-07 would have grown ~10x today. While STR’s aggressive M&A activity can be viewed negatively in-terms of capital allocation, its track record of value creation cannot be questioned. The company’s philosophy on this remains unchanged and its focus remains firmly on enhancing shareholder wealth. Post the sale of the Agila Specialties division in 2013, STR’s top-line has grown at 47% CAGR, driven by both organic and inorganic expansion. STR has now rebuilt its businesses in Australia and the US and the majority of investments are now complete. These businesses are hence likely to grow at a fast clip, resulting in top-line/earnings CAGR of 18%/34% over FY17-20E (adj. for API hive-off). We believe that STR possesses the potent combination of a diversified business mix, strong regulatory record, high growth potential and comfortable valuation. Initiate coverage with BUY rating and a TP of Rs 1,200 (18x Sep-19E + Rs 100/sh for Solara + Rs 30/sh for the biopharma investments).
The US is gaining mass again: Post the Agila sale in 2013, STR has since re-built its US business and filed 40 ANDAs. Focus has been on launching products in differentiated categories like softgels, modified releases and topicals. At present, there are 26 ANDAs pending with the US FDA, most being post-GDUFA. With 20+ launches expected over the next two years, we believe that the US business will scale up from
US$ 95mn in FY17 to US$ 230mn by FY20. Launches like potassium citrate, gLovaza, gGilenya and gRenvela/gRenagel would be key growth drivers.
Australian investments to pay off: At present, STR is the third largest company in the region. Tie-ups with organizations like Sigma and Pharmacy Alliance have given STR priority access to 20% of Australian pharmacies. Going ahead, the focus is on launching more products from its pipeline and start manufacturing in India and Singapore, which will more than offset the impact of PBS price erosion and facilitate top-line CAGR of 13-14% over FY17-20E.
Improving fundamentals: Return ratios currently look unimpressive, owing to the recent investments that are yet to play out. However, with no major capex planned, and operating leverage to aid margins in both the US and Australia, we expect return ratios to reach high-teens by FY20E. This will be driven by both a better product mix and higher asset turnover.
Valuation and view: At CMP, the stock is trading at 17x FY19E and 13x FY20E, a discount to mid-cap peers. We believe that this discount is likely to contract once the US approvals run-rate picks up.
Financial Summary YE Mar (Rs mn) FY16 FY17 FY18E FY19E FY20E Net Sales 28,044 34,131 35,360 39,888 46,810 EBITDA 4,140 6,428 6,471 7,658 9,596 APAT 1,085 3,997 3,578 4,592 6,040 Adj. EPS (Rs/sh) 20.8 34.0 40.0 51.3 67.5 P/E (x) 48.8 15.8 22.0 17.2 13.1 RoE (%) 8.4 13.1 13.7 15.7 18.0 Source: Company, HDFC sec Inst Research
INDUSTRY PHARMA
CMP (as on 16 Oct 2017) Rs 881
Target Price Rs 1,200 Nifty 10,231
Sensex 32,634
KEY STOCK DATA Bloomberg STR IN
No. of Shares (mn) 89
MCap (Rs bn) / ($ mn) 79/1,218
6m avg traded value (Rs mn) 368
STOCK PERFORMANCE (%)
52 Week high / low Rs 1,275/832
3M 6M 12M
Absolute (%) (17.1) (21.5) (11.2)
Relative (%) (18.3) (31.6) (28.4)
SHAREHOLDING PATTERN (%)
Promoters 31.1
FIs & Local MFs 14.6
FPIs 34.5
Public & Others 19.8 Source : BSE Amey Chalke [email protected] +91-22-6171-7321
Siddhant Mansukhani [email protected] +91-22-6639-2476

STRIDES SHASUN: INITIATING COVERAGE
Page | 2
Strong track record of value creation Shareholder Wealth Added By STR Since Oct-07
STR has a strong history of value creation. Since October 1, 2007, the company has compounded shareholder wealth at an outstanding ~30% annually.
In FY14 and FY15, STR distributed an aggregate special dividend of Rs 605/sh (Rs 500 in FY14, Rs 105 in FY15), aggregating US$ 650mn (pre-tax), a corporate record in India.
Over the same period, only 2 pharma companies (>Rs70bn Mcap) have delivered >30% returns.
We believe that with 30+% earnings CAGR, STR is likely to continue enhancing shareholder wealth over the next three years, this time largely driven by organic growth.
Source: Company, HDFC sec Inst Research *We have assumed a dividend re-investment return of 7%, compounded annually.
Australia and the US lead the way Revenue Waterfall Over FY17-20E (Rs bn)
The US and Australian businesses are crucial going forward, and will contribute 55% of revenues and 60% of profits in FY20E.
With STR striving to become the number one player in Australia, it is likely to cross US$ 200mn sales by FY21E and will be launching 65-70 products over the next two years. This will be driven by past investments in R&D, product acquisitions, in-licensing, and distribution tie-ups.
With 20+ ANDA filings done in GDUFA cohorts 4-5, STR would be launching close to 20 products over FY18-19E in the US. These launches include topicals, softgels, hard-gels and modified releases and STR could easily cross US$ 200mn sales in FY20E.
Source: Company, HDFC sec Inst Research
10
69
37
8
Dividend re-investment return*
Dividends received
Market Cap added as of today
Market Cap - Oct 1, 2007
(Rs bn)
35
77% 29%
39% -46%
47
20
25
30
35
40
45
50
55
FY17 The US Australia Others API FY20E
STRIDES SHASUN: INITIATING COVERAGE
Page | 3
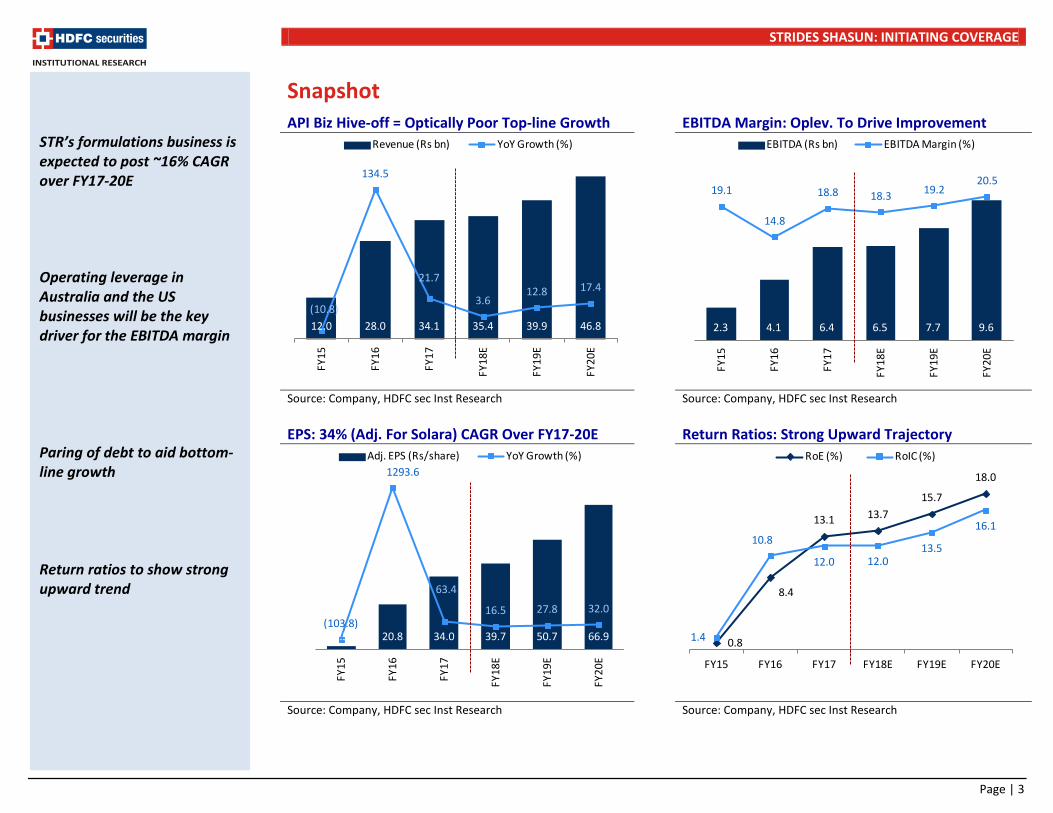
Snapshot API Biz Hive-off = Optically Poor Top-line Growth EBITDA Margin: Oplev. To Drive Improvement
Source: Company, HDFC sec Inst Research Source: Company, HDFC sec Inst Research EPS: 34% (Adj. For Solara) CAGR Over FY17-20E Return Ratios: Strong Upward Trajectory
Source: Company, HDFC sec Inst Research Source: Company, HDFC sec Inst Research
12.0 28.0 34.1 35.4 39.9 46.8(10.8)
134.5
21.7
3.6 12.8 17.4
FY15
FY16
FY17
FY18
E
FY19
E
FY20
E
Revenue (Rs bn) YoY Growth (%)
0.8
8.4
13.1 13.715.7
18.0
1.4
10.8
12.0 12.013.5
16.1
FY15 FY16 FY17 FY18E FY19E FY20E
RoE (%) RoIC (%)
STR’s formulations business is expected to post ~16% CAGR over FY17-20E Operating leverage in Australia and the US businesses will be the key driver for the EBITDA margin Paring of debt to aid bottom-line growth Return ratios to show strong upward trend
2.3 4.1 6.4 6.5 7.7 9.6
19.1
14.8
18.8 18.3 19.2 20.5
FY15
FY16
FY17
FY18
E
FY19
E
FY20
E
EBITDA (Rs bn) EBITDA Margin (%)
1.5 20.8 34.0 39.7 50.7 66.9(103.8)
1293.6
63.4
16.5 27.8 32.0
0
10
20
30
40
50
60
70
80
FY15
FY16
FY17
FY18
E
FY19
E
FY20
E
Adj. EPS (Rs/share) YoY Growth (%)
STRIDES SHASUN: INITIATING COVERAGE
Page | 4
Table of contents Business summary ................................................................................................................................................. .5
Australia: Aiming to become no. 1 ........................................................................................................................ .6
US business: Regaining mass ............................................................................................................................... .11 Emerging markets ................................................................................................................................................ .15 Africa: On auto-pilot ...................................................................................................................................... .15 Institutional business: Focus on vertical integration .................................................................................... .16 India: Underperforming business ................................................................................................................. .18 Biologics: Preparing for the future ...................................................................................................................... .20 API business: Hive-off value accretive ................................................................................................................. .21 Financial analysis .................................................................................................................................................. .22
Valuation .............................................................................................................................................................. .24
Management profile ............................................................................................................................................ .25
Strides Shasun in charts ....................................................................................................................................... .26
Financial statements ............................................................................................................................................ .29
STRIDES SHASUN: INITIATING COVERAGE
Page | 5
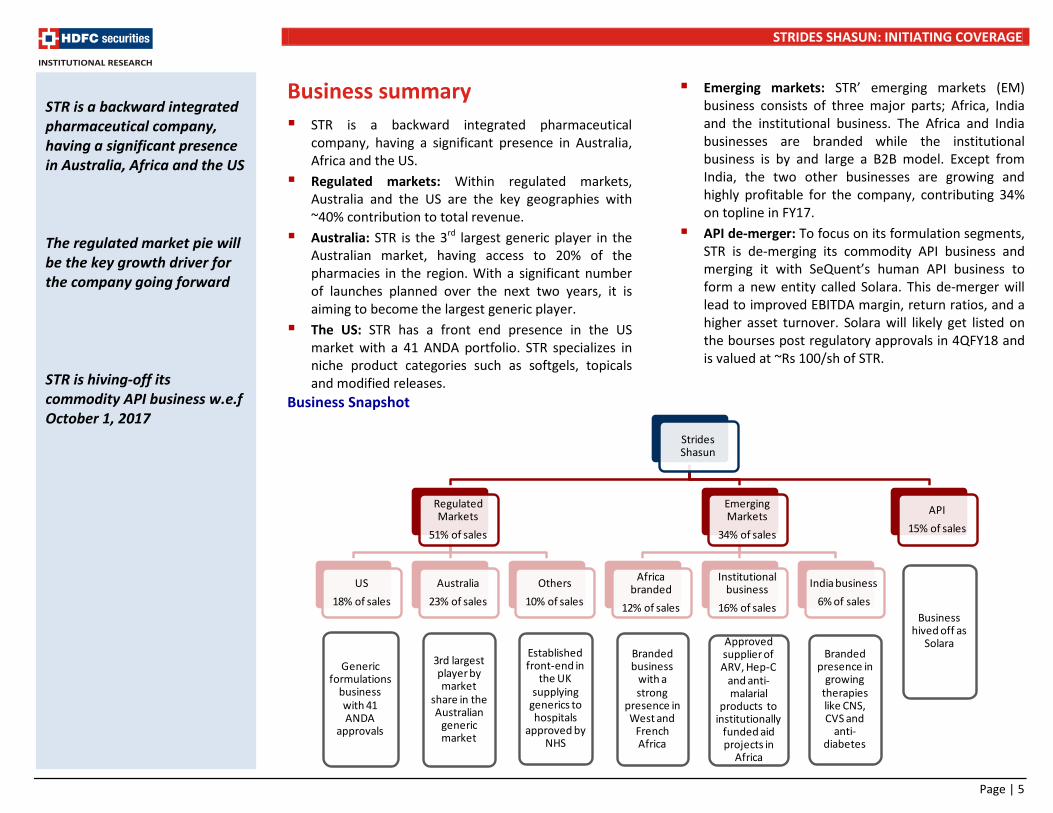
Business summary STR is a backward integrated pharmaceutical
company, having a significant presence in Australia, Africa and the US.
Regulated markets: Within regulated markets, Australia and the US are the key geographies with ~40% contribution to total revenue.
Australia: STR is the 3rd largest generic player in the Australian market, having access to 20% of the pharmacies in the region. With a significant number of launches planned over the next two years, it is aiming to become the largest generic player.
The US: STR has a front end presence in the US market with a 41 ANDA portfolio. STR specializes in niche product categories such as softgels, topicals and modified releases.
Emerging markets: STR’ emerging markets (EM) business consists of three major parts; Africa, India and the institutional business. The Africa and India businesses are branded while the institutional business is by and large a B2B model. Except from India, the two other businesses are growing and highly profitable for the company, contributing 34% on topline in FY17.
API de-merger: To focus on its formulation segments, STR is de-merging its commodity API business and merging it with SeQuent’s human API business to form a new entity called Solara. This de-merger will lead to improved EBITDA margin, return ratios, and a higher asset turnover. Solara will likely get listed on the bourses post regulatory approvals in 4QFY18 and is valued at ~Rs 100/sh of STR.
Business Snapshot
Strides Shasun
Regulated Markets
51% of sales
US18% of sales
Generic formulations
business with 41 ANDA
approvals
Australia23% of sales
3rd largest player by market
share in the Australian
generic market
Others10% of sales
Established front-end in
the UK supplying
generics to hospitals
approved by NHS
Emerging Markets
34% of sales
Africa branded
12% of sales
Branded business
with a strong
presence in West and
French Africa
Institutional business
16% of sales
Approved supplier of ARV, Hep-C
and anti-malarial
products to institutionally
funded aid projects in
Africa
India business6% of sales
Branded presence in
growing therapies like CNS, CVS and
anti-diabetes
API15% of sales
Business hived off as
Solara
STR is a backward integrated pharmaceutical company, having a significant presence in Australia, Africa and the US The regulated market pie will be the key growth driver for the company going forward STR is hiving-off its commodity API business w.e.f October 1, 2017

STRIDES SHASUN: INITIATING COVERAGE
Page | 6
Australia: Aiming to become no. 1 Approximately 23% of Strides’ overall top-line comes from the Australian Pharma market. After initially selling its business in the year 2012, STR re-entered the market in FY16 with the acquisition of ~130 products from Aspen, re-branding it Arrow (same as original Aus business).
Australian Pharma Market
Market Structure: The size of the APM was estimated to be ~A$ 14bn in 2016. Products are sold in the Australian market via two routes, through or outside the PBS. The Pharmaceutical Benefits Scheme (PBS), which is a part of Australia’s universal healthcare system and most drugs are sold via this route. Total PBS share of the market was ~A$ 11bn. The balance market flows via the non-PBS route comprises various pharmacy OTC products. However, in order to market goods on any platform, companies have to go through the process of registering a drug with the Therapeutic Goods Association (TGA), which functions similarly to the US FDA.
Australian Market Break-up (IMS MAT Jun-14)
Source: HDFC Sec Inst Research
What is PBS?: The PBS is a national scheme to provide affordable medicines to all Australians. It is essentially a list of medicines that are subsidized by the government. The Pharmaceutical Benefit Advisory Committee (PBAC) advises the Minister for Health on whether or not a drug should be listed on the PBS. It typically takes 2-3 years from product filing to listing on the PBS list. PBS medicines have been split-up under two sections, Section 85, containing the majority of the drugs which are used commonly and Section 100 for highly specialized medicines (eg. chemotherapy).
Govt. and Patient Expenditure Under PBS
Source: HDFC Sec Inst Research *Section 100 portion of public cost is not included. **The table is as per Australian FY, which is July 1 to June 30.
PBS Prices and Safety Net: When purchasing medicine under PBS, the maximum price a patient pays is the patient contribution (also called a co-payment or out-of-pocket cost). Patients are divided into two categories, general and concessional (low-income earners, welfare recipients etc.). The general patients pay a maximum total charge of A$ 38.30, while concessional patients pay A$ 6.3 per medicine. The safety net provision of PBS caps patient spending
Approximately 23% of Strides’ overall top-line comes from the Australian Pharma market The size of the APM was estimated to be ~A$ 14bn in 2016 Products are sold in the Australian market via two routes, through or outside the PBS The PBS is a national scheme to provide affordable medicines to all Australians. It is essentially a list of medicines that are subsidized by the government
8.62.5
2.9Branded
Generic
OTC
7.2 7.5 7.7 7.2 7.1 6.9 7.9
1.2 1.4 1.5 1.8 2.0 2.22.71.4 1.4 1.5 1.5 1.5 1.5
1.4
FY10
FY11
FY12
FY13
FY14
FY15
FY16
Govt - Sec. 85 (A$ bn) Govt - Sec. 100 (A$ bn)
Patient Cost (A$ bn)*

STRIDES SHASUN: INITIATING COVERAGE
Page | 7
at a certain amount per calendar year, A$ 1494.9 for general and A$ 378 for concessional. Beyond this, general patients pay for medicines at the concessional rate and concessional patients are not charged any further for that calendar year.
PBS Price Changes: There are a few mechanisms by which prices are adjusted under PBS. Drugs are listed under two lists, F1 and F2. F1 are those drugs that do not have a bioequivalent in the market and are generally on-patent drugs. F2 drugs are generally off-patent drugs. In PBS pricing, the concept of AEMP (average ex-manufacturers price) is crucial, with the AEMP being the determined PBS price for all brands of a pharmaceutical item.
PBS Price Change (%) In Top 5 Vol Products (2016)
Source: HDFC Sec Inst Research
Drugs under the F1 list have a compulsory 5% AEMP reduction after being listed on the PBS for 5 years.
Drugs under the F2 list have prices adjusted twice in a year, on April 1 and October 1. A weighted average price deduction is calculated based on the adjusted volumes and revenues for the relevant period of all brands in a pharmaceutical item. In order for the
price to be reduced, the WAPD needs to be 10% minimum, i.e. the AEMP is not adjusted unless there is a 10% or more reduction as per the calculation.
Besides these, a statutory price reduction of 16% is applied to existing PBS-listed products when the first new brand or item that is bioequivalent or biosimilar and has the same manner of administration as an existing brand or item lists on the PBS.
Non-PBS Sales: Outside of the PBS structure, various OTC products are sold by pharmacies, such as medicines for self-treatment, nutraceuticals etc. These account for ~20% of the APM. Prices in this segment are un-regulated, and hence present an opportunity for companies to earn higher margins.
Wholesale distribution: Market structure is concentrated in terms of wholesale distribution. The top three generic companies holding 75% market share (Apotex, Mylan and Arrow) have each tied-up with a wholesaler - Symbian, API and Sigma, who together hold 90% of the wholesale market share. This has been stable over the last few years.
Wholesale Market Share In The APM
Source: HDFC Sec Inst Research
There are various mechanisms by which prices are adjusted under PBS Outside of the PBS structure, various OTC products are sold by pharmacies. These account for ~20% of the APM. Prices in this segment are un-regulated Market structure is concentrated in terms of wholesale distribution Symbian, API and Sigma together have 90% of the wholesale market share
-50
-40
-30
-20
-10
0
10
20
FY11
FY12
FY13
FY14
FY15
FY16
Atorvastatin EsomeprazoleRosuvastatin ParacetamolPantoprazole
30%
29%
36%
5%
Symbion
API
Sigma
DHL

STRIDES SHASUN: INITIATING COVERAGE
Page | 8
Pharmacy-centric: It is worth noting that the APM is an extremely pharmacy-centric market, with the key customers being pharmacies. The Australian Government reimburses the pharmacist for the cost of the medicine, as well as paying a nominal mark-up and dispensing fee. The pharmacist in turn pays the wholesaler who distributes the medicine.
It is also significant that pharmacies typically have one principal generic supplier and give preference to said supplier for all their requirements. Only four generic players (incl STR) supply 90% of the generic drugs sold in the APM. Even if the supplier is late to launch a generic, the pharmacy will continue to purchase the brand until the principal supplier launches a generic version (assuming visibility on launch). Hence, it becomes crucial for generic players to have as wide a range of products as possible.
By law, pharmacy ownership in Australia must be independent from manufacturing, hence preventing vertical integration across the supply chain.
Gaining market share: There are ~5500 pharmacies in Australia, with ~3500 pharmacy owners. This has led to the development of major pharmacy brands, which follow a membership / franchisee model and help smaller pharmacy owners streamline their operations and improve profitability. Hence, as opposed to a traditional MR to doctor marketing dynamic, market share gains in the APM are driven at a senior level by capturing additional pharmacies as customers. Another key driver of market share is the major pharmacy groups bringing more pharmacies under their brand leading to new customers for the supplier. Unlike other markets, there is no price differentiation between players.
Strides in Australia The nature of the Australian market has led STR to adopt an acquisitive approach in this market. STR’s non-compete for the APM expired in Jan-15, post which the company re-entered the market in FY16, via the acquisition of Aspen’s generic business. Re-entry with Aspen deal: The Aspen deal gave STR
access to ~130 commercialised products and made STR the 3rd largest generic manufacturer by market share, and 2nd largest in terms of drug product range. STR also gained access to “Chemists’ Own”, an OTC product range. It is the preferred OTC range in 20% of pharmacies in Australia.
Generic Market Share (Pre-Aspen Deal)
Source: HDFC Sec Inst Research
Investment in GP: A controlling stake in a generic supplier, Generic Partners (GP), gave STR access to 47 commercialsed products, 22 products pending TGA registration and a pipeline of 32 molecules. GP currently develops and out-licenses products to customers in Australia. Manufacturing requirements are out-sourced. GP’s customer base included the top 5 generic pharmaceutical companies including Aspen/Arrow. GP had revenues of A$ 39mn and
The APM is an extremely pharmacy-centric market, with the key customers being pharmacies In the APM, pharmacies typically identify one principal generic supplier and purchase all their requirements from said supplier Only four generic players (STR being one) supply 90% of all generic drugs sold in Australia The Aspen deal gave STR access to ~130 commercialised products and made STR the 3rd largest generic manufacturer by market share, and 2nd largest in terms of drug product range
25%
23%20%
15%
8%3% 6%
Apotex
Mylan
Aspen
Sandoz
Amneal
Lupin
Other

STRIDES SHASUN: INITIATING COVERAGE
Page | 9
operating loss. However, adjusted EBITDA is ~18% (ex-R&D). STR’s R&D initiatives for the APM will be consolidated under GP, leveraging its product development and registration capabilities. GP will continue to supply to other generic players as the need for product exclusivity is nullified by the pharmacy tie-ups.
Amneal acquisition: The recent acquisition of Amneal’s Australian operations further boosted STR’s market share and product range. Post integration, the acquisition is expected to add revenues of A$ 25mn and improve Arrow’s generic market share to 22%.
Distribution tie-ups: A 10-year supply partnership with Pharmacy Alliance, a major pharmacy brand
strengthened STR’s supply relationships. Pharmacy Alliance currently has ~600 pharmacies i.e.10% of the market under its network, and plans to double this to 20%. STR is also the preferred generic partner, and has signed an exclusive distribution agreement with Sigma, the largest pharmacy wholesaler by market share in Australia. Sigma also has the largest retail pharmacy footprint in Australia.
While the top-line has been flat since re-entry, margins have contracted sharply (almost ~700-800bps). Our conversation with the CEO of Arrow Pharma, Mr. Dennis Bastas, revealed that the margins have been under pressure largely owing to investments for increasing the scale of the business.
Strides in Australia: Sequence Of Events
When Event Deal Value (A$ mn)
Deal Value (Rs cr)
Feb-08 Entered APM in by acquiring a controlling stake in Ascent PharmaHealth 65 260 Dec-10 Stake in Ascent increased to 94% from 58% 36 162 Jan-12 Sold the Australian business (full 94% stake) to Watson 375 1,968
May-15 Re-entered the APM with purchase of a generic business from Aspen (re-named Arrow) 380 1,900 Feb-16 Purchased 51% stake in Generic Partners, a generic player in the APM 15 75 Aug-17 Acquired Australian operations of Amneal 17 85
Source: HDFC Sec Inst Research
What next?: The strategy for STR going forward would be to leverage the recent investments and achieve a large scale of business in the APM. Increasing market share via the deployment of a larger product basket is a primary goal. The acquisition of Amneal’s Australian business has supplemented its portfolio, provided new customers and also eliminated competition.
STR plans to launch 70 products in the coming two years, the market value of which would be A$ 4-5bn. We expect STR to at least maintain its current run-rate of an average of ~A$ 1mn per product.
In-licensing opportunities are also being sought, such as the recent launch of Cipla’s inhalers in the APM.
Expanding distribution reach is a primary driver of growth in the APM, and STR has made significant moves in this direction with the agreements with Sigma and Pharmacy Alliance. Currently, STR is the front-line supplier for 700-800 pharmacies. STR is targeting 1,100 by FY18 end and 2,000 by FY20.
Margin levers: (1) STR’s planned 70 launches over the next two years would have a higher margin than the current average margin of the company, (2) Significant operating leverage is available for the
Acquisitions like Generic Partners (GP) and Amneal’s Australian operations further boosted STR’s capabilities and product range Margins have contracted sharply since re-entry (almost ~700-800bps), largely owing to investments for increasing the scale of the business Increasing market share via the deployment of a larger product basket is a primary goal Currently, STR is the front-line supplier for 700-800 pharmacies. STR is targeting 1,100 by FY18 end and 2,000 by FY20

STRIDES SHASUN: INITIATING COVERAGE
Page | 10
company considering the extent of investments made recently, and (3) Shifting of a large part of the manufacturing base to India and Singapore, which will provide significant cost advantages, especially considering that currently 85-90% of the production requirements are out-sourced.
As a part of the Aspen deal, STR also acquired an established OTC brand – Chemists’ Own. Sales from this business have come off significantly over the past 2-3 years and were ~A$ 25mn at their peak. STR’s initial target is to return to historical levels and the business is now growing in high double-digits.
Market opportunity and growth: Generic penetration in the APM is low compared to the US (60% vs 90-95%). This gap is expected to narrow over the coming years. The generic market is ~A$ 2bn and STR’s mgt pegs its covered market opportunity at A$ 1.5bn.
The APM is expected to grow at a modest 0-3% CAGR over 2018-2022. However, within this, generics are predicted to grow at 7.2% CAGR.
Overall, we foresee 12-13% revenue CAGR in Australia over FY17-20E. Operating leverage from business scale and the launch of higher margin products would be the keys to expanding margins in Australia. We expect ~200bps expansion by FY20E.
Australian Market Forecast Until 2022 Australia Business: Growth To Pick Up
Source: Company, HDFC sec Inst Research Source: Company, HDFC sec Inst Research
7.9 8.6 9.8 11.3
FY17
FY18
E
FY19
E
FY20
E
Australian business (Rs bn)
There are various margin levers in Australia such as higher margin average from new launches, operating leverage and cost saving from shifting of manufacturing base to India/Singapore Overall, we foresee 12-13% revenue CAGR in Australia over FY17-20E
6.3 6.1 6.3 6.5 6.6 6.8 6.9 7.0 7.1 7.1 7.2
1.1 1.1 1.2 1.3 1.4 1.5 1.7 1.8 1.9 2.0 2.2 1.7 1.8 1.9 1.9 2.0 2.0 2.1 2.1 2.1 2.2 2.2
2012
2013
2014
2015
2016
2017
2018
2019
2020
2021
2022
Branded Generics OTC

STRIDES SHASUN: INITIATING COVERAGE
Page | 11
US business: Regaining mass The US is gaining mass again: Post the sale of Agila in
2013, STR had a minimal presence in the US. It has re-built its business there and has since filed 40 ANDAs. Focus remained on launching niche products in categories like softgels, modified release and topicals. At present, there are 26 ANDAs pending with the US FDA. Most of these filings are post GDUFA. With 20+ launches expected over the next two years, we believe that the US business will scale up from US$ 95mn sales in FY17 to US$ 230mn by FY20E. Launches like gLovaza, potassium citrate, gGilenya and gRenvela would be key growth drivers for the US market.
Cetrizine: Strides recently received final approval for Cetirizine 10mg. These are soft gel capsules and will be sold over-the-counter. It is used to reduce the symptoms of respiratory allergies. At present, the market size is US$ 60mn and there is only one other generic player with approval. We have modeled US$ 15mn in sales from this product by FY20, as the scale up through the OTC channel is gradual due to required branding.
Potassium citrate: It is the first modified release product for STR. Potassium citrate is a urinary alkalinizing agent and used for preventing certain types of kidney stones. At present, there are two other players who have received approvals along with Stides – Cadila and Impax. However, Impax has not launched this product yet. Overall, post Cadila launch in FY15 market size is reduced to US$ 110mn. We believe Strides can generate US$ 10-15mn sales from this product annually.
Lovaza: A key launch for STR in FY18 will be the Lovaza capsules (Omega-3-acid ethyl esters). As per the management, the opportunity size is estimated to
be ~US$ 300mn. There are currently four generic players selling this product. Teva was the first to launch in April-14, at which point the US market size alone was US$ 1.1bn. STR has partnered with Par Pharma for this product, with STR doing the manufacturing. Par is an existing player in gLovaza and has 30% market share, thus ensuring that STR will generate ~US$30mn annually from this opportunity.
Gilenya: Strides has settled this para IV opportunity to launch it in Feb-19. Although there are several players who would be launching this product on approval, it is a sizable market with annual sales of US$ 3bn. We believe Strides can generate ~US$ 8-10mn in its first year of launch.
Daliresp: Daliresp is another para IV opportunity in STR’s pipeline. Daliresp is AstraZeneca product with market sales of US$ 200mn. The product is protected by 6 patents and one exclusivity. Earliest patent will expire in Jan-20 while labeling exclusivity will protect the product till Aug-20. We expect generic product to get launched between Jan 2020 to 2024. STR is among the first three filers and also received tentative approval early this year. It could become a significant opportunity for the company if not more than three players enters the market.
Soft Gel capabilities: With over two decades of experience, STR is among the world's largest manufacturers of specialty soft gelatin capsules. The global soft gel capsules market was estimated to be ~US$ 200bn in 2016. STR’s 1mn sq ft. soft gel facility at Bangalore is one of the largest of its kind in the world with an annual capacity of 2.5 bn soft gel capsules.
With 20+ launches expected over next two years, we believe US business will scale up from US$ 95mn sales in FY17 to US$ 230mn by FY20E Launches like gLovaza, potassium citrate, gGilenya, gRenvela would be key growth drivers for the US market

STRIDES SHASUN: INITIATING COVERAGE
Page | 12
Filing/approval momentum expected to pick-up over the next 15-18 months: STR has filed 67 ANDAs in the US market till now. It has received 41 ANDA approvals till date and 26 ANDA fillings are still pending with the US FDA. As most of the filings are post GDUFA filings, the company expects to receive at least 20 approvals over next 15-18 months. Of 26 pending ANDAs, 7 products are topicals, 5-6 are soft/hard gelatin capsules and 2 are modified release. Among these, 6 are para IVs (2 settled, 4 pending approval). The company is also working on a few 505b(2) products for the US market. These are likely to get filed over the next 2 years.
Filing momentum too has picked up strongly, with 5 ANDAs filed in 1QFY18. The mgt expects to file 15-20 ANDAs in FY18 including softgels, topicals and modified release platforms. Historically, STR’s annual filing rate has been in the single-digits.
Vivimed JVs: STR has signed definitive agreements with Vivimed Labs to form a 50:50 JV which will own Vivimed’s US FDA approved formulations facility in Chennai. Another JV in Singapore will be formed through STR’s Singapore arm which will own certain approved ANDAs and product pipeline. STR will pay Rs 750 mn towards these JVs. As a part of these JVs, STR will get access to the 1.5bn tablet capacity to manufacture some of its own ANDAs, as well as marketing rights to the ANDAs being developed by Vivimed. On the manufacturing front, this will be STR’s 4th facility in addition to Bengaluru, Puducherry and Singapore (upcoming). This will secure STR’s capacity requirements for atleast 3-4 years.
Looking ahead: With more than 20 launches over the next two years, which include key product launches like Lovaza, potassium citrate, gGilenya, gRenvela, we believe Strides’ US business is likely to grow at +30% CAGR over FY17-20E (from US$ 95mn to US$ 220m by FY20E.)
US Revenues To Grow At A Fast Clip High Number Of Approvals Pending From Cohort 5
Source: Company, HDFC sec Inst Research Source: Company, HDFC sec Inst Research
6.3 7.1 11.7 15.3
FY17
FY18
E
FY19
E
FY20
E
US revenues (Rs bn)
As most of the filings are post GDUFA filings, STR expects to receive at least 20 approvals over next 15-18 months Of 26 pending ANDAs, 7 products are topicals, 5-6 are soft/hard gelatin capsules and 2 are modified release. Among these, 6 are para IVs (2 settled, 4 pending approval With more than 20 launches over the next two years, we believe STR’ US business is likely to grow at +30% CAGR over FY17-20E

STRIDES SHASUN: INITIATING COVERAGE
Page | 13
ANDA Approval Pace Picking Up R&D Expense: Below Peer Levels
*FY14 represents a 15 month period **Denotes ANDA approvals as of today Source: Company, HDFC sec Inst Research
Source: Company, HDFC sec Inst Research
Market Share In Key Products
Brand Molecule Form Market Size
(at launch, US$ mn)
Launch Date Players Aug-17 Aug-16 Aug-15
Precose Acarbose Tablet 21 Jul-11 8 19% 13% 2% Tessalon Benzonatate Capsule - Softgel 41 Jul-15 11 20% 19% 0% Rocaltrol Calcitriol Capsule - Softgel 50 Dec-14 5 17% 15% 5% Avodart Dutasteride Capsule - Softgel 470 Nov-15 16 28% 16% N/A Vitamin D Ergocalciferol Capsule - Softgel 63 Aug-10 4 47% 41% 25% Oxsoralen-Ultra Methoxsalen Capsule - Softgel 14 Jul-14 2 36% 48% 49% Zantac Ranitidine HCL Tablet 125 Aug-16 10 26% N/A N/A Soma Carisoprodol Tablet 38 Nov-15 10+ 96% N/A N/A Vancocin Vancomycin HCL Capsule 332 Apr-12 5 55% N/A N/A Source: Bloomberg, HDFC Sec Inst Research
4 1 6 5 4 7
6 5
7
9 8
5
CY12
FY14
*
FY15
FY16
FY17
FY18
**
ANDAs approved during the year ANDAs filed during the year
ANDA approval pace is clearly picking up STR has managed to achieve good market share in a number of competitive products
0.4 0.9 1.5 1.6 1.9 2.1
3.0 3.2
4.5 4.6 4.8 4.5
FY15
FY16
FY17
FY18
E
FY19
E
FY20
E
R&D (Rs bn) R&D to sales (%)

STRIDES SHASUN: INITIATING COVERAGE
Page | 14
Potential ANDA Opportunities:
Molecule Brand Name Form Generic? Therapy Market Size
(US$ mn) No. of
Players Potential Launch
Based on tentative approvals / settlements / on-going litigation Tenofovir Disoproxil Fumarate Viread Tablet No HIV/ARV 591 8 4QFY18
Efavirenz Sustiva Tablet No HIV/ARV 901
10 FY19 Efavirenz Sustiva Capsule No HIV/ARV 3 FY19 Fingolimod Gilenya Capsule No CNS 3109 10 2HFY19 Roflumilast Daliresp Tablet No Respiratory 134 10 2HFY20 Emtricitabine; Tenofovir Disoproxil Fumarate
Truvada Tablet No HIV/ARV 2400 5 FY21-22
Diclofenac Potassium Zipsor Capsule No Pain/Analgesics 30 6-7 FY23 Rilpivirine Edurant Tablet No HIV/ARV 600 1 FY23-24 Based on DMF filings
Pregabalin Lyrica Capsule/ Solution No CNS 3139 10 2HFY19
Lurasidone Hydrochloride Latuda Tablet No CNS 1254 15+ FY19-20
Sevelamer Carbonate Renvela Suspension, Tablet Yes Nephrology ~1000 3-4 Upon approval
Sevelamer Hydrochloride Renagel Tablet No Nephrology ~200 5-6 Upon approval
Colesevelam Hydrochloride Welchol Suspension,
Tablet No CVS ~750 4-5 FY23
Celecoxib Celebrex Capsule Yes Others 976 9 Upon approval Dextromethorphan Polistirex Delsym Suspension
ER Oral Yes Anti-infective 100 2 Upon approval
Aprepitant Emend Capsule; Suspension Yes Others 62 3 N/A
Posaconazole Noxafil Suspension No Others 595
1 N/A Posaconazole Noxafil Tablet DR No Others 1 N/A Posaconazole Noxafil Solution; IV No Others 1 N/A Source: HDFC Sec Inst Research
Opportunities like gRenvela, gRenagel, gLovaza, gGilenya and gDaliresp will be important growth drivers for STR

STRIDES SHASUN: INITIATING COVERAGE
Page | 15
Emerging markets Strides’ emerging markets (EM) business consists of three major parts; Africa, India and the institutional business (grouped here from FY18). The Africa and India businesses are branded while the institutional business is by and large a B2B model. Africa: On auto-pilot Africa accounted for ~13% of FY17 revenues, and STR follows an ‘in Africa, for Africa’ strategy here, with and a special focus on the Sub-Saharan region (presence in over 40 countries). STR has over 750 products registered in Africa and a further 500 in the pipeline. STR currently operates with a sales force of 250 MRs in the region and plans to significantly ramp up this number to 1,000 over the next five years.
STR In Africa
Source: Company, HDFC Sec Inst Research
Re-structuring: STR announced this year, its plans to exit its African generics business for a cash consideration was ~US$ 16mn. This was a low-margin business and contributed ~US$ 21mn (~4% of total revenue) and an EBITDA of ~US$ 1.6mn. The exit was hence margin accretive.
Universal Corporation acquisition: In Feb-16, STR acquired Universal Corporation (UC), a Nairobi based pharma manufacturing and marketing company with a strong presence in East Africa, for a consideration of US$ 11mn (with performance-related payout capped at US$ 3mn). This acquisition complimented STR’s strong foothold in West and French Africa. UC’s facility is one of only two WHO Pre-qualified sites in Sub-Saharan Africa, other than in South Africa. This is in-line with the ‘in Africa, for Africa’ strategy, and STR will leverage this facility’s multiple dosage capabilities and rising preference for local procurement in the region. STR also plans to transfer several strategic institutional products to this facility as donor agencies prefer ‘Made in Africa’ products.
Looking ahead: STR’s focus in this region is firmly on creating a strong branded presence backed by local manufacturing. Boosted by growth in the African market, we expect STR to post a double-digit growth in the region on the back of the expanding geographical footprint and new product launches. Margins are expected to expand gradually with higher MR productivity and improving business mix.
Strides’ emerging markets (EM) business consists of three major parts; Africa, India and the institutional business Africa accounted for ~13% of FY17 revenues, and STR follows an ‘in Africa, for Africa’ strategy here, with and a special focus on the Sub-Saharan region (presence in over 40 countries) STR’s focus in this region is firmly on creating a strong branded presence backed by local manufacturing We expect STR to post a double-digit growth in the region on the back of the expanding geographical footprint and new product launches

STRIDES SHASUN: INITIATING COVERAGE
Page | 16
Institutional Business: Focus on vertical integration
STR had sales of Rs 5.7bn in this segment in FY17, ~16% of total revenue. Currently, STR is an approved supplier to institutionally funded aid projects and global procurement agencies like UNITAID, PFSCM, PEPFAR, CHAI and Global Fund. STR believes while the market is concentrated between 5-6 key players, there is an opportunity of ~US$ 2.5bn in terms of procurement.
ARV and Hep-C franchise: STR has entered into a licensing agreement with Gilead Sciences to produce and distribute (1) sofosbuvir (gSovaldi), and (2) an investigational single tablet regimen of ledipasvir/sofosbovir (gHarvoni) for treatment of chronic Hepatitis C. The agreement is for distribution to 101 developing countries including high burden countries like India, Eqypt and Indonesia. STR is one of 11 companies with whom Gilead has signed licensing agreements. STR is focused on selling the two in-licensed drugs (branded ‘Virso’ and ‘Virpas’ respectively) in lower competition markets like CIS and South East Asia, where margins and realizations would be higher.
In Dec-15, STR became the third company to get the DCGI’s (Drug Controller General of India) approval to manufacture Sofosbuvir 400mg, after Natco Pharma and Hetero.
There is also a licensing agreement with Gilead for the rights to manufacture and distribute Tenofovir Alafenamide (TAF), both as a single agent product and in combination with other drugs. The license being granted to Strides extends to 112 countries, which together account for more than 30 million people living with HIV.
STR has also signed a sub-licensing agreement with the Medicines Patent Pool (MPP) to develop Dolutegravir (DTG) for treatment of HIV in developing
countries. Other companies with this license include Cipla, Desano, Emcure, Hetero Labs, Laurus Labs, Lupin, Micro Labs and Mylan.
Anti-malarials: STR started receiving orders from Global Fund to supply anti-malaria products from 2HFY15. Strong execution and problems for key competitor IPCA led to quick business growth. As compared to ARV, this has been a much higher margin business for the company. STR is also collaborating with MMV for the development of rectal artesunate for pre-referral treatment of children with severe malaria (Cipla is the only other company partnering MMV for this drug).
This business is now however seeing a slowdown, with a decline in donor funding (down 20-25% in FY17). While STR was able to maintain its market share, there was a significantly lower contribution from the malarial portfolio during FY17, which led to a decline in the overall institutional business. IPCA’s re-entry in this business would be a key monitorable.
Merger benefits: Prior to the merger with Shasun, STR was a fringe player in the business, with limited formulation capacities. STR was also the only non-backward integrated player in the business other than Aspen. The merger added this crucial element of vertical integration to STR’s institutional business, as well as additional formulations capacities. Shasun had a portfolio of 23 DMFs under development, including DMF filings for Tenofovir (anti-retroviral) and commercialised Cycloserine (anti-TB), which complemented STR’s institutional business. Following the de-merger of the API business, STR plans to support its institutional business through the recently acquired Perrigo API facility.
UC plant: STR plans to transfer large parts of its institutional business to the Universal Corporation
STR had sales of Rs 5.7bn in this segment in FY17, ~16% of total revenue Currently, STR is an approved supplier to institutionally funded aid projects and global procurement agencies like UNITAID, PFSCM, PEPFAR, CHAI and Global Fund STR is present in ARV, Hep-C and anti-malarials

STRIDES SHASUN: INITIATING COVERAGE
Page | 17
facility in Kenya. This will enable to gain access to local business funded by local agencies and also deploy a more robust supply chain for the emerging market and institutional business. The tech transfer of the institutional products has been initiated, with supplies expected to commence from 2HFY18.
Outlook: While the success rates for these medicines are high, the penetration is low. STR plans to leverage its quickly expanding footprint and strong supply chain to access a wider range of markets, and also derive cost and reach synergies from the UC plant in Kenya. There is also a focus on developing the next generation of products in line with evolving treatment regimens. However, with lower funding in the anti-malarials business combined with increasing competitve intensity in the ARV segment, we believe that the growth in this segment will be in single digits going forward. Foresee 7% rev. CAGR over FY18-20E.
Growth To Be Muted Going Forward
Source: Company, HDFC Sec Inst Research
With lower funding in the anti-malarials business combined with increasing competitve intensity in the ARV segment, we believe that the growth in this segment will be in single digits going forward. Foresee 7% rev. CAGR over FY18-20E
3.9 6.0 5.7 6.0 6.4 7.0
(27.6)
54.0
(4.6)5.0 8.0 8.0
FY15
FY16
FY17
FY18
E
FY19
E
FY20
E
Institutional business (Rs mn) YoY Growth (%)

STRIDES SHASUN: INITIATING COVERAGE
Page | 18
India: Underperforming business
STR entered the Indian Pharmaceuticals Market (IPM) market in 2007 with the acquisition of Grandix and has since followed a largely inorganic growth strategy. It has now positioned itself as a branded generics player, with established brands such as Renerve, Raricap, Solus, Otogesic, Ehnorub, and Stugil. At present, it is contributing ~Rs 2.2bn in sales to STR’s top-line and margins are likely to be in the mid-teens.
Inorganic fuel: STR has made various acquisitions over the years which have boosted the India business: (1) Global rights of Raricap (women’s health), in FY15, (2) Two CNS divisions ‘Solus’ and ‘Solus Care’ from Sun Pharma in FY16, and (3) Seven brands from Johnson & Johnson (J&J) in FY16 in the dermatology, anti-emetic and pain management therapy categories that include Otogesic eardrops, Ehnorub ointment and Stugil tablets.
Recent Acquisitions
Therapy When Consideration (Rs mn)
Annual sales
(Rs mn) Raricap Vitamins FY15 481 200 Solus, Solus Care CNS FY16 1,650 920
7 JnJ Brands Various FY16 619 320 Source: Company, HDFC Sec Inst Research
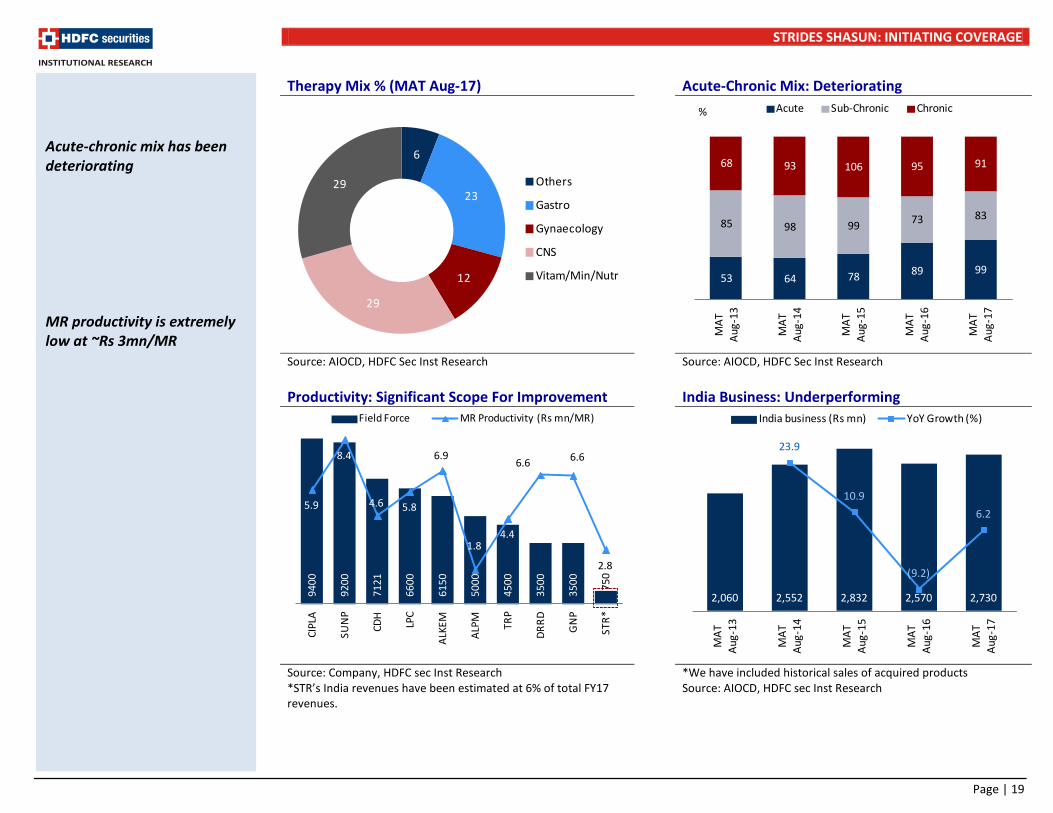
Largely chronic but not lucrative: STR has product offerings in growing therapies such as CNS, CVS, anti-diabetes, gastro intestinal, women’s health and pain management. The portfolio is largely skewed towards
specialty segment with close 65% of sales. STR has built marketing field force of 750 MRs covering 3,500 stockists and 80,000 doctors. However, the MR/productivity is significanlty low despite having large specialty portfolio.
Top 10 Brands: Mixed Growth
Brand Therapy MAT Aug-17 (Rs mn)
4 yr CAGR
Renerve Plus Vit/Min/Nutr 464 9% Lactovit Gastro 169 43% Raricap Gynaecological 160 -3% Lactogut Gastro 157 77% Desval Er Neuro / CNS 153 -1% Serlift Neuro / CNS 147 15% Domped Gastro 103 65% Selzic Neuro / CNS 89 -2% Levroxa Neuro / CNS 86 -4% Livliv Gastro 80 85% Source: AIOCD, HDFC Sec Inst Research
Underperfoming business: Despite achieving Rs 2.2bn in sales, we believe that the India business is a non-performing segment for the company as the organic growth in the existing porfolio is poor and there is no sign of a pick-up. The branded generic business in India, especially in chronic therapies, has a long gestation period with several hurdles to break the association between incumbents and speciality doctors. Pricing or quality is not the only critieria as brand loyalty is strong among doctors. We have assumed only 7-8% growth in this business over the next two years.
STR is a branded generics player in the domestic market with established brands such as Renerve, Raricap, Solus, Otogesic, Ehnorub, and Stugil We believe that the India business is a non-performing segment for the company as the organic growth in the existing porfolio is poor and there is no sign of a pick-up We have assumed only 7-8% growth in this business over the next two years
STRIDES SHASUN: INITIATING COVERAGE
Page | 19
Therapy Mix % (MAT Aug-17) Acute-Chronic Mix: Deteriorating
Source: AIOCD, HDFC Sec Inst Research Source: AIOCD, HDFC Sec Inst Research Productivity: Significant Scope For Improvement India Business: Underperforming
Source: Company, HDFC sec Inst Research *STR’s India revenues have been estimated at 6% of total FY17 revenues.
*We have included historical sales of acquired products Source: AIOCD, HDFC sec Inst Research
9400
9200
7121
6600
6150
5000
4500
3500
3500 75
0
5.9
8.4
4.6 5.8
6.9
1.84.4
6.6 6.6
2.8
CIPL
A
SUN
P
CDH
LPC
ALKE
M
ALPM TR
P
DRRD
GN
P
STR*
Field Force MR Productivity (Rs mn/MR)
Acute-chronic mix has been deteriorating MR productivity is extremely low at ~Rs 3mn/MR
53 64 78 89 99
85 98 99 73 83
68 93 106 95 91
MAT
Au
g-13
MAT
Au
g-14
MAT
Au
g-15
MAT
Au
g-16
MAT
Au
g-17
Acute Sub-Chronic Chronic%
6
23
12
29
29 Others
Gastro
Gynaecology
CNS
Vitam/Min/Nutr
2,060 2,552 2,832 2,570 2,730
23.9
10.9
(9.2)
6.2
MAT
Au
g-13
MAT
Au
g-14
MAT
Au
g-15
MAT
Au
g-16
MAT
Au
g-17
India business (Rs mn) YoY Growth (%)

STRIDES SHASUN: INITIATING COVERAGE
Page | 20
Biologics: Preparing for the future Strides entered into the biologics business in 2010, through the acquisition of a 70% stake in Bangalore based biotech startup, Inbiopro Solutions. At the time, Inbiopro had a pipeline of eight oncology candidates, estimated to have global sales of over US$ 28bn and the start of commercialization was targeted in 2013. Evolution since entry: STR went on to acquire the
remaining shares of Inbiopro in 2012, and consolidated its biologics business under Stelis Biopharma, a fully owned subsidiary in 2013. The company develops both ‘biosimilars’ and ‘novel biotherapeutics’ for regulated global markets and its business spans the full value chain from development to production and commercialisation.
Stelis had begun the construction of a biopharma manufacturing facility in Malaysia in 2014. Due to operational issues, this project was shifted to Bangalore, and a 22,000 sq ft facility is being constructed. It will house 60 scientists.
Although there is no visibility on the out-licensing of existing molecules, Stelis can also de-risk its investments by venturing into the CDMO business in the biopharma space. This would lead to higher utilization of its developing capacities both in R&D and manufacturing.
Oncobiologics investment: In Jul-2014, STR made a strategic investment in Oncobiologics Inc., a privately held New Jersey biopharmaceutical firm developing a pipeline of biosimilars and next generation biotherapeutics, for an undisclosed sum.
Oncobiologics has biosimilars for four drugs (Humira, Avastin, Herceptin and Prolia/Xgeva) in the pipeline. A Phase 3 trial for ONS-3010 was initiated in Jul-16, after the Phase I trial met primary and secondary end points. A Phase III trial is to be initiated for ONS-1045 in the near-term. Oncobiologics has out-licensed the rights to ONS-3010 and 1045 to GMS Tenshi for emerging markets except India, China and Mexico for an upfront payment of US$ 2.5mn, US$ 5mn in milestones and also a net profit share.
Other developments: (1) GMS Holdings, a Jordan-based privately-owned investment fund, acquired a 25.1% strategic stake in Stelis Biopharma via GMS Pharma (Singapore) Private Limited in Dec-15 for US$ 10mn, thereby valuing the company at US$ 40mn (2) Oncobiologics was listed in the US at a price of US$ 4.8/share. STR holds ~6 mn shares in the company, at a cost of US$ 1.83/sh.
Hidden value?: STR has consistently missed deadlines and targets in this business, and we do not expect any revenues from biopharma for the next 1-1.5 years. However, the opportunity is significant and the outlook is promising. The Stelis and Oncobiologics investments could lead to strong value unlocking for STR. Even if Stelis becomes successful in the CDMO business and not in its own filings, and Oncobiologics is able to launch a couple of biosimilars by FY20E, there would be significant jump in the valuations of these investments. At present, both businesses are valued at a combined Rs 30/sh.
STR has consistently missed deadlines and targets in this business, and we do not expect any revenues from biopharma for the next 1-1.5 years. However, the opportunity is significant and the outlook is promising If Stelis becomes successful in the CDMO business and Oncobiologics is able to launch a couple of biosimilars by FY20E, there would be significant jump in the valuations of these investments At present, both businesses are valued at a combined Rs 30/sh

STRIDES SHASUN: INITIATING COVERAGE
Page | 21
STR’s Biopharma Pipeline
Product From Nature Brand Global sales (US$ bn) Therapy Current Status Potential
Launch No. of
Approvals SBL001 Stelis Biosim - - Pain - 2019 - SBL005 Stelis Biosim - - Pain - 2018 - SBL011 Stelis NBE - - Ophthalmology - N/A - SBL012 Stelis Biosim - - Anti-diabetes - 2019 - ONS-3010 Oncobio. Biosim Humira 16.1 Oncology Phase III 2 ONS-1045 Oncobio. Biosim Avastin 6.9 Oncology Phase III ready 1 ONS-1050 Oncobio. Biosim Herceptin 6.9 Oncology Phase I ready - ONS-4010 Oncobio. Biosim Prolia/Xgeva 3.2 Oncology Phase I ready - Source: Company, HDFC Sec Inst Research
API biz: Hive-off value accretive Current API busines: At present, 15% of total
revenues comes from APIs sold to third parties. It has two key US FDA approved facilities in India, with a large customer base for high volume commodity products like ibuprofen, naproxen, gabapentin, ranitidine and olanzapine. STR is one of the five API suppliers of ibuprofen for the US market. The margin of this business is close to 15-16% due to economies of scale achieved in key products. Interestingly, it will also be supplying sevelamer/colesevelam API to several Indian players who have filed gRenvela, gRenagel and gWelchol in the US. Put together, these 3 products represent a US$ 3bn+ ANDA opportunity, which could translate into a ~US$ 300mn sustainable generic market for the suppliers.
Hive-off: As the focus & skillset required for an API B2B business is significantly different than STR’s current goal of building a B2C franchise, the management has decided to hive-off its commodity third-party API business. This will be combined with SeQuent Scientific’s human API business in one entity called Solara Active Pharma Sciences. The effective date of this transaction is October 1, 2017.
We believe STR’s commodity API business (being transferred to Solara) will achieve a Rs 8.5bn top-line over the next three years by gaining higher market share in key products like gabapentin and new product launches like sevelamer and colesevelam.
Solara listing and value: Solara is likely to be listed once the required regulatory approvals are in place and we expect this to happen in 4QFY18. As per the scheme of arrangement, STR’s shareholders will have 60% holding in Solara, leading to a ~Rs 100/sh value on their per share holding in STR.
Solara: Valuation FY17 FY18E FY19E FY20E
Solara 5,336 6,200 7,130 8,200 SeQuent 3,000 3,360 3,763 4,215 Total sales (Rs mn) 8,336 9,560 10,893 12,414 EBITDA (%) 16% 16% 16% 17% EBITDA (Rs mn) 1,334 1,530 1,743 2,110 EV/EBITDA (x) 10 EV (Rs mn) 19,267 Expected mkt cap (Rs mn) 14,767
60% (STR’s SHs share) 8,860 Value for STR’s shareholders (Rs/share) 100
Source: Company, HDFC Sec Inst Research
At present, 15% of total revenues comes from APIs sold to third parties STR has decided to hive-off its commodity third-party API business. This will be combined with SeQuent Scientific’s human API business in one entity called Solara Active Pharma Sciences As per the scheme of arrangement, STR’s shareholders will have 60% holding in Solara, leading to a ~Rs 100/sh value on their per share holding in STR

STRIDES SHASUN: INITIATING COVERAGE
Page | 22
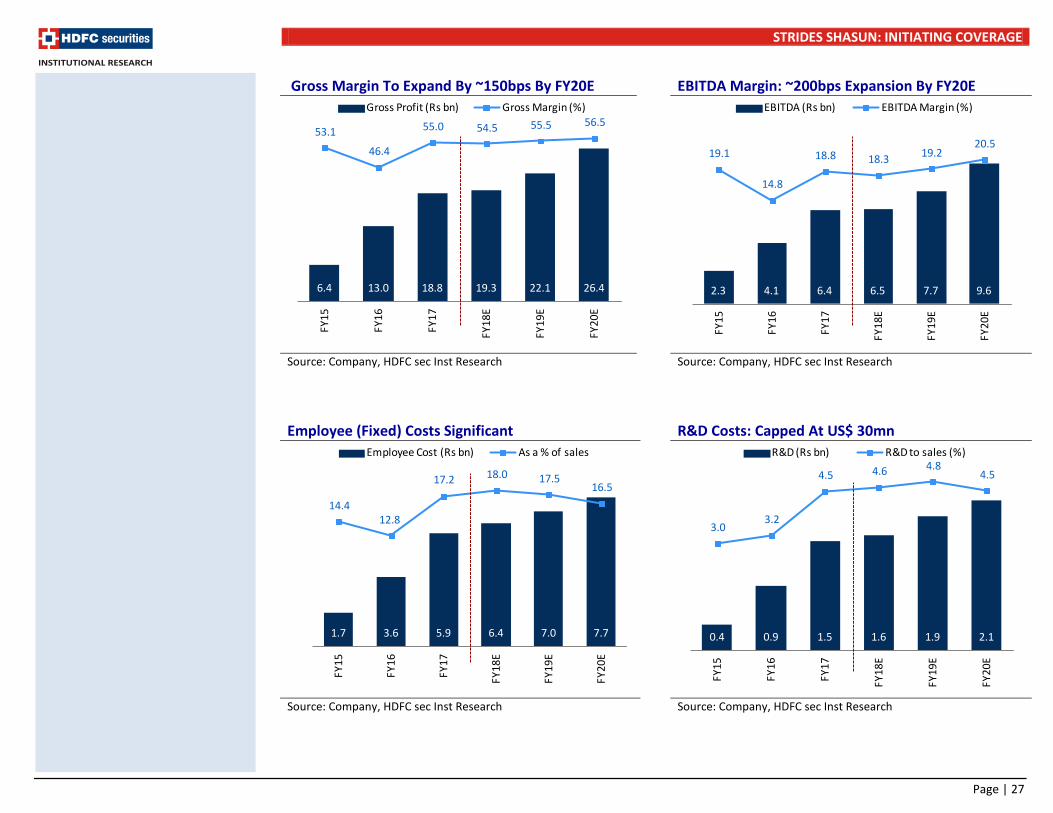
Financial analysis Gross margin: STR’s gross margin is restricted by a
high contribution from the Australian business, where margin expansion is constrained by the PBS price cuts. The gross margin in the institutional business too is not increasing. However, (1) Improving business mix (higher contribution from the US and Australia), (2) Shift to in-house manufacturing for the Australia business, and (3) Divestment of the lower margin API and African generic businesses should see a pick-up in the gross margin going ahead. On a conservative basis, we foresee ~150bps expansion over FY17-20E.
EBITDA margin: There are several EBITDA margin drivers for STR in the foreseeable future; (1) Operating leverage in the US and Australia led by numerous product launches every year, and (2) Expanding presence and higher capacity utilization in the high margin African branded generics business will be margin accretive. Overall, we foresee 20% EBITDA CAGR (adjusted for API hive-off) and ~200 bps margin expansion over FY17-20E.
Gross Margin: Multiple Drivers Op Lev. To Boost EBITDA Margin
Source: Company, HDFC sec Inst Research Source: Company, HDFC sec Inst Research
Gross margin triggers include improving business mix, shift to in-house manufacturing for the Australia biz and divestment of the lower margin API and African generic businesses Overall, we foresee 20% EBITDA CAGR (adjusted for API hive-off) and ~200 bps margin expansion over FY17-20E
6.4 13.0 18.8 19.3 22.1 26.4
53.1
46.4
55.0 54.5 55.5 56.5
FY15
FY16
FY17
FY18
E
FY19
E
FY20
E
Gross Profit (Rs bn) Gross Margin (%)
2.3 4.1 6.4 6.5 7.7 9.6
19.1
14.8
18.8 18.3 19.2 20.5
FY15
FY16
FY17
FY18
E
FY19
E
FY20
E
EBITDA (Rs bn) EBITDA Margin (%)

STRIDES SHASUN: INITIATING COVERAGE
Page | 23
Strong FCF generation: Aggressive M&A activity and high investments in the Australian and US businesses have hampered FCF generation over the last 2-3 years. Debt too was taken on in order to fuel the re-entry into the Australian market and the net debt to equity ratio rose from 0.3x in FY15 to 1x in FY17. FCF generation is of particular importance to STR due to its aggressive inorganic pursuits. A higher degree of internal funding for expansion plans could provide a
significant boost to STR’s bottom line. We expect the FCF generation momentum to pick-up over the next three years, with upto US$ 80-100 mn generated annually. This will also enable debt reduction, and we expect the net debt to equity to fall to 0.2x by FY20E. Modest capex plans, important launches like gLovaza and potassium citrate in the US market and operating leverage from the investments in Australia will be the primary drivers behind FCF generation.
Asset Turnover: Stable At 1.6-1.7x FCF Generation To Pick Up From FY18E
Source: Company, HDFC sec Inst Research Source: Company, HDFC sec Inst Research
(3.2)
20.9 2.9
(2.3)
2.3 1.9
2.5
1.5 1.5 1.7 1.6 1.6
FY15
FY16
FY17
FY18
E
FY19
E
FY20
E
Additn to FA (Rs bn) Asset Turnover (x)
1.5
(3.0) (3.9)
3.7 7.1 5.7
0.3
1.1 1.0
0.8
0.6
0.2-6
-4
-2
0
2
4
6
8
FY15
FY16
FY17
FY18
E
FY19
E
FY20
E
FCF (Rs bn) Net D/E (x)
Aggressive M&A activity and high investments in the Australian and US businesses have hampered FCF generation over the last 2-3 years Modest capex plans, important launches like gLovaza and potassium citrate in the US market and operating leverage from the investments in Australia will be the primary drivers behind FCF generation Higher FCF generation will also enable debt reduction, and we expect the net debt to equity to fall to 0.2x by FY20E

STRIDES SHASUN: INITIATING COVERAGE
Page | 24
Valuation At CMP, STR is trading at 17x FY19E and 13x FY20E EPS, a 15-20% discount to mid-cap peers. We believe this discount is unjustified owing to: A strong EPS outlook; 33% CAGR over FY17-20E
backed by 18% revenue CAGR Improvement in RoIC from 12% currently to 16-17%
by FY20E Strong free cash flow generation of US$ 250mn over
FY18-20E We value STR’s base business at 18x Sep-19E, Solara at Rs 100/sh and the biopharma investments at Rs 30/sh, arriving at a TP of Rs 1,200/sh, implying ~36% upside. Key catalysts Pick up in the US and Australia businesses (from
2HFY18) Divestment of non-performing businesses at lucrative
valuations
Peer Valuations
Risks to our investment thesis: Unfavourable foreign currency fluctuations Business decline in Australia due to PBS price-cutsSTR P/E Band
Source: HDFC Sec Inst Research
Mcap (Rs bn)
CMP (Rs/sh) Reco TP
Adj EPS (Rs/sh) P/E (x) RoE (%) FY17 FY18E FY19E FY20E FY17 FY18E FY19E FY20E FY17 FY18E FY19E FY20E
Sun Pharma 1,286 548 NEU 525 26.0 15.8 23.0 30.8 21.1 34.7 23.9 17.8 17.9 10.1 13.6 16.1 Cadila Healthcare 514 501 BUY 570 14.5 14.4 19.1 26.5 34.4 34.8 26.1 18.9 23.5 19.0 20.8 23.6 Lupin 477 607 BUY 1,605 57.0 48.2 67.9 85.2 48.5 33.0 24.5 19.2 20.9 15.2 18.7 19.8 Cipla 476 1,070 NEU 565 12.5 18.4 24.7 31.7 18.8 22.2 15.7 12.6 8.4 11.2 13.5 15.2 Aurobindo Pharma 436 758 BUY 820 39.3 40.1 48.0 54.2 19.3 18.9 15.8 14.0 27.6 22.5 21.8 20.2 Dr Reddy's 400 2,404 SELL 2,300 72.7 77.2 123.4 165.2 33.1 31.1 19.5 14.5 9.5 10.0 14.5 17.0 Alkem Laboratories 219 1,843 BUY 2,060 74.6 64.9 87.9 108.2 24.7 28.4 21.0 17.0 21.9 16.3 19.2 20.3 Torrent Pharma 215 1,287 BUY 1,400 51.2 46.9 60.7 79.0 25.1 27.4 21.2 16.3 22.1 17.8 20.6 22.7 Glenmark 170 612 BUY 1,035 29.6 27.2 43.7 55.1 20.7 22.5 14.0 11.1 18.1 14.1 19.0 19.9 Alembic Pharma 93 496 BUY 650 21.4 21.0 27.7 37.2 23.2 23.6 17.9 13.3 23.0 19.4 21.8 24.2 Strides Shasun 78 881 BUY 1,200 34.0 40.0 51.3 67.5 25.9 22.0 17.2 13.1 13.1 13.7 15.7 18.0 Granules India 31 141 BUY 190 7.2 8.4 10.6 13.3 19.6 16.7 13.3 10.6 21.0 19.6 20.7 22.2 Source: HDFC sec Inst Research
26.0
0.0
10.0
20.0
30.0
40.0
50.0
60.0
Avg P/E 1 yr fwd P/E Last 3 year average
Valuation discount to narrow owing to strong EPS outlook, improving return ratios and strong FCF generation

STRIDES SHASUN: INITIATING COVERAGE
Page | 25
Management profile Who Designation Education Other Details
Arun Kumar Founder and Chairman of the Board
Degree in Commerce Has moved to a Non-Exec position effective May 18, 2017. He has been on the Board since inception of the Company in 1990. He was earlier the General Manager of British Pharmaceuticals Limited.
Shashank Sinha Managing Director Bachelor’s Degree in Engineering, MBA (IIM, Lucknow)
Appointed to the Board on May 18, 2017. He was the Group CEO and associated with the Strides since March 2016. Prior to Strides, led the US$ 1 billion global flexibles business of Huhtamaki Oyj, a leading consumer packaging company headquartered in Finland. He has also held senior leadership positions at Godrej Consumer Products, Sara Lee Corporation, Reckitt Benckiser plc and Navis Capital Partners.
Badree Komandur Executive Director CA, CS, CWA, Degree in Commerce from Univ of Madras
Appointed to the Board on May 18, 2017. He was the Group CFO and is associated with Strides since February 2010. Prior to joining Strides, had 15 years of industrial experience in Information Technology and Engineering Sectors.
Ramaraju P. V. S Chief Operations Officer
N/A Has been with Strides for the last 10 years and has over 23 years of experience in the pharmaceutical industry. Has a successful track record of handling inspections, regulatory audits and documentation. Has led many international regulatory audits like USFDA, UK-MHRA, WHO, SA-MCC, Brazil-Anvisa, TGA Australia etc.
Umesh Kale Chief Quality Officer
M.Pharm (gold medalist) from SGS Institute of Technology and Science, Indore
Has over 24 years of experience in the Pharma industry and is currently responsible for the quality governance of the entire organization, including subsidiaries. Prior to joining Strides, he worked with organizations like Nicholas Piramal, FDC, Lupin, Dr. Reddy’s and Ranbaxy. Has handled various regulatory and customer inspections and has successfully led many international regulatory audits like USFDA, UK-MHRA, WHO, SA-MCC, Brazil-Anvisa, TGA Australia, EU etc.

STRIDES SHASUN: INITIATING COVERAGE
Page | 26
Strides Shasun in charts Revenue: 18% CAGR Over FY17-20E (Ex-API sales) Regulated Markets Business: Key Growth Driver
Source: Company, HDFC sec Inst Research Source: Company, HDFC sec Inst Research Emerging Markets Business: Modest Growth Institutional Business: Muted Growth
Source: Company, HDFC sec Inst Research Source: Company, HDFC sec Inst Research
12.0 28.0 34.1 35.4 39.9 46.8-10.8
134.5
21.7
3.612.8 17.4
FY15
FY16
FY17
FY18
E
FY19
E
FY20
E
Revenue (Rs bn) YoY Growth (%)
4.3 11.4 17.8 19.5 25.8 31.3
(15.9)
167.8
55.9
9.8
32.3 21.3
FY15
FY16
FY17
FY18
E
FY19
E
FY20
E
Regulated markets (Rs bn) YoY Growth (%)
3.9 6.0 5.7 6.0 6.4 7.0
(27.6)
54.0
(4.6)5.0 8.0 8.0
FY15
FY16
FY17
FY18
E
FY19
E
FY20
E
Institutional business (Rs mn) YoY Growth (%)
4.1 3.8 6.3 6.8 7.7 8.6
21.5
(5.7)
64.9
8.0 12.0 12.0
FY15
FY16
FY17
FY18
E
FY19
E
FY20
E
Emerging market (Rs bn) YoY Growth (%)
STRIDES SHASUN: INITIATING COVERAGE
Page | 27
Gross Margin To Expand By ~150bps By FY20E EBITDA Margin: ~200bps Expansion By FY20E
Source: Company, HDFC sec Inst Research Source: Company, HDFC sec Inst Research
Employee (Fixed) Costs Significant R&D Costs: Capped At US$ 30mn
Source: Company, HDFC sec Inst Research Source: Company, HDFC sec Inst Research
6.4 13.0 18.8 19.3 22.1 26.4
53.1
46.4
55.0 54.5 55.5 56.5
FY15
FY16
FY17
FY18
E
FY19
E
FY20
E
Gross Profit (Rs bn) Gross Margin (%)
2.3 4.1 6.4 6.5 7.7 9.6
19.1
14.8
18.8 18.3 19.2 20.5
FY15
FY16
FY17
FY18
E
FY19
E
FY20
E
EBITDA (Rs bn) EBITDA Margin (%)
1.7 3.6 5.9 6.4 7.0 7.7
14.4 12.8
17.2 18.0 17.5 16.5
0
1
2
3
4
5
6
7
8
9
FY15
FY16
FY17
FY18
E
FY19
E
FY20
E
Employee Cost (Rs bn) As a % of sales
0.4 0.9 1.5 1.6 1.9 2.1
3.0 3.2
4.5 4.6 4.8 4.5
FY15
FY16
FY17
FY18
E
FY19
E
FY20
E
R&D (Rs bn) R&D to sales (%)

STRIDES SHASUN: INITIATING COVERAGE
Page | 28
EPS CAGR Of 33% Over FY17-20E (Ex-API biz) Asset Turnover: Stable At 1.6-1.7x
Source: Company, HDFC sec Inst Research Source: Company, HDFC sec Inst Research
Prudent Capex Will Lead To Higher FCF Generation Return Ratios: Strong Upward Trajectory
Source: Company, HDFC sec Inst Research Source: Company, HDFC sec Inst Research
1.5 20.8 34.0 40.0 51.3 67.5(103.8)
1293.6
63.4
17.5 28.3 31.5
0
10
20
30
40
50
60
70
80
FY15
FY16
FY17
FY18
E
FY19
E
FY20
E
Adj. EPS (Rs/share) YoY Growth (%)
(3.2)
20.9 2.9
(2.3)
2.3 1.9
2.5
1.5 1.5 1.7 1.6 1.6
FY15
FY16
FY17
FY18
E
FY19
E
FY20
E
Additn to FA (Rs bn) Asset Turnover (x)
1.5
(3.0) (3.9)
3.7 7.1 5.7
0.3
1.1 1.0
0.8
0.6
0.2-6
-4
-2
0
2
4
6
8
FY15
FY16
FY17
FY18
E
FY19
E
FY20
E
FCF (Rs bn) Net D/E (x)
0.8
8.4
13.1 13.715.7
18.0
1.4
10.8
12.0 12.013.5
16.1
FY15 FY16 FY17 FY18E FY19E FY20E
RoE (%) RoIC (%)

STRIDES SHASUN: INITIATING COVERAGE
Page | 29
Income Statement (Consolidated) Year ending March (Rs mn) FY16 FY17 FY18E FY19E FY20E Net Revenues 28,044 34,131 35,360 39,888 46,810 Growth (%) 134.5 21.7 3.6 12.8 17.4 Material Expenses 15,023 15,362 16,089 17,750 20,362 Employee Expenses 3,577 5,881 6,365 6,980 7,724 Other Operating Expenses 5,304 6,459 6,436 7,499 9,128 EBITDA 4,140 6,428 6,471 7,658 9,596 EBITDA Margin (%) 14.8 18.8 18.3 19.2 20.5 EBITDA Growth (%) 80.9 55.3 0.7 18.4 25.3 Depreciation 1,313 1,872 1,662 1,774 1,929 EBIT 2,827 4,556 4,809 5,884 7,667 Other Income (Including EO Items) 921 1,686 1,750 1,850 1,950
Interest 1,682 2,269 1,965 1,696 1,581 Exceptional Items (414) (1,006) - - - PBT 1,653 2,967 4,594 6,038 8,036 Tax (Incl Deferred) 425 470 666 996 1,446 Profit/(loss) from discontinuing operations (232) 1,959 - - -
Profit/(loss) of associate company (47) 4 - - -
Minority Interest 135 (462) (350) (450) (550) RPAT 1,085 3,997 3,578 4,592 6,040 EO (Loss) / Profit (Net Of Tax) (645) 953 - - - APAT 1,730 3,045 3,578 4,592 6,040 APAT Growth (%) 1836.0 75.9 17.5 28.3 31.5 Adjusted EPS (Rs) 20.8 34.0 40.0 51.3 67.5 Source: Company, HDFC sec Inst Research
Balance Sheet (Consolidated) Year ending March (Rs mn) FY16 FY17 FY18E FY19E FY20E SOURCES OF FUNDS Share Capital - Equity 893 894 894 894 894 Reserves 25,685 26,210 29,359 33,262 38,214 Total Shareholders’ Funds 26,579 27,104 30,253 34,156 39,109 Minority Interest 502 1,640 1,990 2,440 2,990 Long Term Debt 26,270 16,377 11,877 10,877 9,877 Short Term Debt 7,005 13,940 13,940 13,940 13,940 Total Debt 33,275 30,317 25,817 24,817 23,817 Net Deferred Taxes (502) 88 230 150 100 Other Non-current Liabilities & Provns 1,833 4,855 5,120 5,500 5,650
TOTAL SOURCES OF FUNDS 61,686 64,004 63,409 67,063 71,665 APPLICATION OF FUNDS Net Block 17,520 19,462 15,533 18,259 20,329 CWIP 8,149 7,802 7,500 5,250 3,150 Goodwill 9,267 9,670 9,670 9,670 9,670 Investments 1,272 3,157 3,906 4,226 4,578 Other Non-current Assets 2,245 2,212 2,900 3,100 3,400 Total Non-current Assets 38,452 42,302 39,508 40,504 41,127 Cash & Equivalents 15,253 16,090 12,367 15,722 17,414 Inventories 6,131 7,380 6,781 8,196 9,618 Debtors 10,330 9,971 10,656 10,928 12,825 Other Current Assets 3,434 4,734 5,311 5,547 6,280 Total Current Assets 19,896 22,084 22,749 24,672 28,723 Creditors 7,754 7,465 6,612 8,754 9,763 Other Current Liabilities & Provns 4,161 9,006 4,602 5,082 5,835 Total Current Liabilities 11,915 16,471 11,213 13,835 15,598 Net Current Assets 7,981 5,613 11,535 10,836 13,125 TOTAL APPLICATION OF FUNDS 61,686 64,005 63,410 67,063 71,665
Source: Company, HDFC sec Inst Research

STRIDES SHASUN: INITIATING COVERAGE
Page | 30
Cash Flow Year ending March (Rs mn) FY16 FY17 FY18E FY19E FY20E Reported PBT 1,464 4,971 4,594 6,038 8,036 Non-operating & EO items 941 (1,599) 142 (80) (50) Interest expenses 995 1,521 1,965 1,696 1,581 Depreciation 1,520 1,987 1,662 1,774 1,929 Working Capital Change (3,417) (3,413) (6,346) 879 (2,438) Tax Paid (770) (586) (666) (996) (1,446) OPERATING CASH FLOW ( a ) 732 2,881 1,351 9,311 7,611 Capex (3,691) (6,823) 2,302 (2,250) (1,900) Free cash flow (FCF) (2,959) (3,942) 3,653 7,061 5,711 Investments (18,506) (647) 530 (896) (957) Non-operating Income 471 846 - - - Others (521) (427) - - - INVESTING CASH FLOW ( b ) (22,248) (7,051) 2,832 (3,146) (2,857) Debt Issuance/(Repaid) 19,115 6,037 (4,500) (1,000) (1,000) Interest Expenses (1,347) (2,370) (1,965) (1,696) (1,581) FCFE (3,748) (502) (2,282) 3,469 2,174 Share Capital Issuance 12,264 165 - - - Dividend (265) (451) (429) (689) (1,087) Others (327) - 267 - - FINANCING CASH FLOW ( c ) 29,439 3,382 (6,627) (3,385) (3,668) NET CASH FLOW (a+b+c) 7,924 (788) (2,444) 2,780 1,087 EO Items, Others 195 (5,169) - - - Closing Cash & Equivalents 11,107 5,151 851 3,631 4,718 Source: Company, HDFC sec Inst Research
Key Ratios Year ending March FY16 FY17 FY18E FY19E FY20E PROFITABILITY (%) GPM 46.4 55.0 54.5 55.5 56.5 EBITDA Margin 14.8 18.8 18.3 19.2 20.5 APAT Margin 5.7 10.3 11.1 12.6 14.1 RoE 8.4 13.1 13.7 15.7 18.0 RoIC (or Core RoCE) 10.8 12.0 12.0 13.5 16.1 RoCE 1.2 4.8 8.5 8.5 9.2 EFFICIENCY Tax Rate (%) 20.5 11.8 14.5 16.5 18.0 Fixed Asset Turnover (x) 1.5 1.5 1.7 1.6 1.6 Inventory (days) 79.8 78.9 70.0 75.0 75.0 Debtors (days) 134.4 106.6 110.0 100.0 100.0 Other Current Assets (days) 40.7 36.4 43.9 41.6 40.9 Payables (days) 100.9 79.8 68.3 80.1 76.1 Other Current Liab & Provns days) 52.2 94.3 45.5 44.5 43.5 Cash Conversion Cycle (days) 101.8 47.8 110.1 92.0 96.3 Debt/EBITDA (x) 8.0 4.7 4.0 3.2 2.5 Net D/E (x) 1.1 1.0 0.8 0.6 0.2 Interest Coverage (x) 2.2 2.8 3.3 4.6 6.1 PER SHARE DATA (Rs) EPS 18.0 55.9 40.0 51.3 67.5 Dividend 4.0 4.5 4.0 6.4 10.1 Book Value 297.1 302.9 338.1 381.7 437.1 VALUATION P/E (x) 48.8 15.8 22.0 17.2 13.1 P/BV (x) 3.0 2.9 2.6 2.3 2.0 EV/EBITDA (x) 26.3 16.5 16.0 13.1 10.2 EV/Revenues (x) 3.9 3.1 2.9 2.5 2.1 OCF/EV (%) 0.7 2.7 1.3 9.3 7.8 FCF/EV (%) (2.7) (3.7) 3.5 7.1 5.8 FCFE/Mkt Cap (%) (4.8) (0.6) (2.9) 4.4 2.8 Dividend Yield (%) 0.5 0.5 0.5 0.7 1.1
Source: Company, HDFC sec Inst Research

STRIDES SHASUN: INITIATING COVERAGE
Page | 31
RECOMMENDATION HISTORY
Date CMP Reco Target 16-Oct-17 881 BUY 1,200
800850900950
1,0001,0501,1001,1501,200
Oct
-16
Nov
-16
Dec-
16
Jan-
17
Feb-
17
Mar
-17
Apr-
17
May
-17
Jun-
17
Jul-1
7
Aug-
17
Sep-
17
Oct
-17
Strides TP
Rating Definitions BUY : Where the stock is expected to deliver more than 10% returns over the next 12 month period NEUTRAL : Where the stock is expected to deliver (-)10% to 10% returns over the next 12 month period SELL : Where the stock is expected to deliver less than (-)10% returns over the next 12 month period
STRIDES SHASUN: INITIATING COVERAGE
Page | 32
Disclosure: We, Amey Chalke, MBA & Siddhant Mansukhani, ACA, authors and the names subscribed to this report, hereby certify that all of the views expressed in this research report accurately reflect our views about the subject issuer(s) or securities. HSL has no material adverse disciplinary history as on the date of publication of this report. We also certify that no part of our compensation was, is, or will be directly or indirectly related to the specific recommendation(s) or view(s) in this report. Research Analyst or his/her relative or HDFC Securities Ltd. does not have any financial interest in the subject company. Also Research Analyst or his relative or HDFC Securities Ltd. or its Associate may have beneficial ownership of 1% or more in the subject company at the end of the month immediately preceding the date of publication of the Research Report. Further Research Analyst or his relative or HDFC Securities Ltd. or its associate does not have any material conflict of interest. Any holding in stock –No HDFC Securities Limited (HSL) is a SEBI Registered Research Analyst having registration no. INH000002475. Disclaimer: This report has been prepared by HDFC Securities Ltd and is meant for sole use by the recipient and not for circulation. The information and opinions contained herein have been compiled or arrived at, based upon information obtained in good faith from sources believed to be reliable. Such information has not been independently verified and no guaranty, representation of warranty, express or implied, is made as to its accuracy, completeness or correctness. All such information and opinions are subject to change without notice. This document is for information purposes only. Descriptions of any company or companies or their securities mentioned herein are not intended to be complete and this document is not, and should not be construed as an offer or solicitation of an offer, to buy or sell any securities or other financial instruments. This report is not directed to, or intended for display, downloading, printing, reproducing or for distribution to or use by, any person or entity who is a citizen or resident or located in any locality, state, country or other jurisdiction where such distribution, publication, reproduction, availability or use would be contrary to law or regulation or what would subject HSL or its affiliates to any registration or licensing requirement within such jurisdiction. If this report is inadvertently send or has reached any individual in such country, especially, USA, the same may be ignored and brought to the attention of the sender. This document may not be reproduced, distributed or published for any purposes without prior written approval of HSL. Foreign currencies denominated securities, wherever mentioned, are subject to exchange rate fluctuations, which could have an adverse effect on their value or price, or the income derived from them. In addition, investors in securities such as ADRs, the values of which are influenced by foreign currencies effectively assume currency risk. It should not be considered to be taken as an offer to sell or a solicitation to buy any security. HSL may from time to time solicit from, or perform broking, or other services for, any company mentioned in this mail and/or its attachments. HSL and its affiliated company(ies), their directors and employees may; (a) from time to time, have a long or short position in, and buy or sell the securities of the company(ies) mentioned herein or (b) be engaged in any other transaction involving such securities and earn brokerage or other compensation or act as a market maker in the financial instruments of the company(ies) discussed herein or act as an advisor or lender/borrower to such company(ies) or may have any other potential conflict of interests with respect to any recommendation and other related information and opinions. HSL, its directors, analysts or employees do not take any responsibility, financial or otherwise, of the losses or the damages sustained due to the investments made or any action taken on basis of this report, including but not restricted to, fluctuation in the prices of shares and bonds, changes in the currency rates, diminution in the NAVs, reduction in the dividend or income, etc. HSL and other group companies, its directors, associates, employees may have various positions in any of the stocks, securities and financial instruments dealt in the report, or may make sell or purchase or other deals in these securities from time to time or may deal in other securities of the companies / organizations described in this report. HSL or its associates might have managed or co-managed public offering of securities for the subject company or might have been mandated by the subject company for any other assignment in the past twelve months. HSL or its associates might have received any compensation from the companies mentioned in the report during the period preceding twelve months from t date of this report for services in respect of managing or co-managing public offerings, corporate finance, investment banking or merchant banking, brokerage services or other advisory service in a merger or specific transaction in the normal course of business. HSL or its analysts did not receive any compensation or other benefits from the companies mentioned in the report or third party in connection with preparation of the research report. Accordingly, neither HSL nor Research Analysts have any material conflict of interest at the time of publication of this report. Compensation of our Research Analysts is not based on any specific merchant banking, investment banking or brokerage service transactions. HSL may have issued other reports that are inconsistent with and reach different conclusion from the information presented in this report. Research entity has not been engaged in market making activity for the subject company. Research analyst has not served as an officer, director or employee of the subject company. We have not received any compensation/benefits from the subject company or third party in connection with the Research Report. HDFC securities Limited, I Think Techno Campus, Building - B, "Alpha", Office Floor 8, Near Kanjurmarg Station, Opp. Crompton Greaves, Kanjurmarg (East), Mumbai 400 042 Phone: (022) 3075 3400 Fax: (022) 2496 5066 Compliance Officer: Binkle R. Oza Email: [email protected] Phone: (022) 3045 3600 HDFC Securities Limited, SEBI Reg. No.: NSE-INB/F/E 231109431, BSE-INB/F 011109437, AMFI Reg. No. ARN: 13549, PFRDA Reg. No. POP: 04102015, IRDA Corporate Agent License No.: HDF 2806925/HDF C000222657, SEBI Research Analyst Reg. No.: INH000002475, CIN - U67120MH2000PLC152193 Mutual Funds Investments are subject to market risk. Please read the offer and scheme related documents carefully before investing.

STRIDES SHASUN: INITIATING COVERAGE
Page | 33
HDFC securities Institutional Equities Unit No. 1602, 16th Floor, Tower A, Peninsula Business Park, Senapati Bapat Marg, Lower Parel, Mumbai - 400 013 Board : +91-22-6171 7330 www.hdfcsec.com