Embed Size (px)
Citation preview
COMPANY UPDATE 27 FEB 2018
Strides Shasun BUY
HDFC securities Institutional Research is also available on Bloomberg HSLB <GO>& Thomson Reuters
Saunter Down Under Our visit to Strides Shasuns’ (STR) Australian operations has re-enforced our confidence that the business is on strong footing in the region and has every ingredient in place to make it a sustainable cash generating business in the long run. From a robust pipeline and deep market access to now developing manufacturing capabilities, STR has put into place all the requisite business drivers. Our note describes dynamics of the Australian pharma market (APM) and STR’s position within. Small market with limited incumbents: In
comparison to any other regulatory market in the world, the APM is small with a 24mn population and A$ 15bn in value. However, the top three pharma players have captured 78% of the generic market and STR (Arrow) is one of them. It remains a key business for STR as it contributes 26% on top line and ~30% on EBITDA in FY18E (per our understanding).
Market access; a huge entry barrier: Since the market is largely captured by only three players and a similar situation also exists at the wholesaler level, which control the supplies to pharmacies, market access is big challenge for any new player to establish a presence in the market. The only route for a new generic entrant would be through tie-ups with wholesalers or retail alliances. Hence, the risk of new entrant or losing market share is fairly low for Arrow.
Strong growth visibility in the near-term: Although the APM is growing at only 2-3% annually, the generic market opportunity for STR is sizeable, and will be driven by new product launches over the next two years. With 65-70 launches planned covering an A$ 2bn opportunity, STR should be able to grow its top
line at 15% CAGR, in our view. Expanding market reach through independent deals and further tie-ups and also pharmacy acquisitions by STR’s existing wholesale/retail partners like Sigma Healthcare, Pharmacy Alliance would also help STR to grow its footprint beyond the current 24% market share. The mgt has an ambitious target of expanding total reach to 2,000 pharmacies from ~1,400 currently by 2020.
Multiple levers for margin expansion: Softening pricing environment (due to latest discounting rules), new product launches and increasing in-house manufacturing is likely to help in getting 100-150bps EBITDA margin expansion annually. The management believes that PBS cuts are likely to be benign going ahead as the TGA has increased the discounting margins to 30% v/s 10% for products which have been generic for more than 3 years. Moreover, 80% of STR’s portfolio is of older products and likely to see minimal further cuts. The management has also set a target of 50% in-house manufacturing by FY20E.
Valuation and view: At CMP, the stock is trading at 18.6x FY19E and 12.2x FY20E, a discount to mid-cap peers. Maintain BUY with a TP of Rs 1,090 (18x Dec-19E+ Rs 100/sh for Solara + Rs 30/sh for biopharma).
Financial Summary YE Mar (Rs mn) FY16 FY17 FY18E FY19E FY20E Net Sales 28,044 34,131 33,146 34,854 41,483 EBITDA 4,140 6,428 4,707 6,622 8,711 APAT 1,730 3,045 2,524 3,410 5,214 Adj. EPS (Rs/sh) 20.8 34.0 28.2 38.1 58.3 P/E (x) 39.4 12.7 27.7 18.6 12.2 RoE (%) 8.4 13.1 4.7 12.6 16.9 Source: Company, HDFC sec Inst Research
INDUSTRY PHARMA
CMP (as on 26 Feb 2018) Rs 710
Target Price Rs 1,090 Nifty 10,583
Sensex 34,446
KEY STOCK DATA Bloomberg STR IN
No. of Shares (mn) 90
MCap (Rs bn) / ($ mn) 64/983
6m avg traded value (Rs mn) 479
STOCK PERFORMANCE (%)
52 Week high / low Rs 1,195/641
3M 6M 12M
Absolute (%) (13.5) (24.3) (39.2)
Relative (%) (15.8) (33.3) (58.4)
SHAREHOLDING PATTERN (%)
Promoters 31.1
FIs & Local MFs 14.6
FPIs 34.5
Public & Others 19.8 Source : BSE Amey Chalke [email protected] +91-22-6171-7321
Siddhant Mansukhani [email protected] +91-22-6639-2476
STRIDES SHASUN: COMPANY UPDATE
Page | 2
Australia business: On track Approximately 26% of STR’ overall top-line comes
from the Australian business. The nature of the Australian market has led STR to adopt an acquisitive approach in this space. After initially selling its business in the year 2012, STR re-entered the market in FY16 with the acquisition of ~130 products from Aspen, re-branding it Arrow (same as original Aus business).
STR in Australia: Sequence Of Events
When Event A$ mn Rs cr
Feb-08 Entered APM - acquired controlling stake in Ascent PharmaHealth 65 260
Dec-10 Stake in Ascent increased to 94% from 58% 36 162
Jan-12 Sold the Australian business (full 94% stake) to Watson 375 1,968
May-15 Re-entered the APM with purchase of a generic business from Aspen 380 1,900
Feb-16 Purchased 51% stake in Generic Partners, a generic player 15 75
Aug-17 Acquired Australian operations of Amnea 17 85
Source: HDFC Sec Inst Research
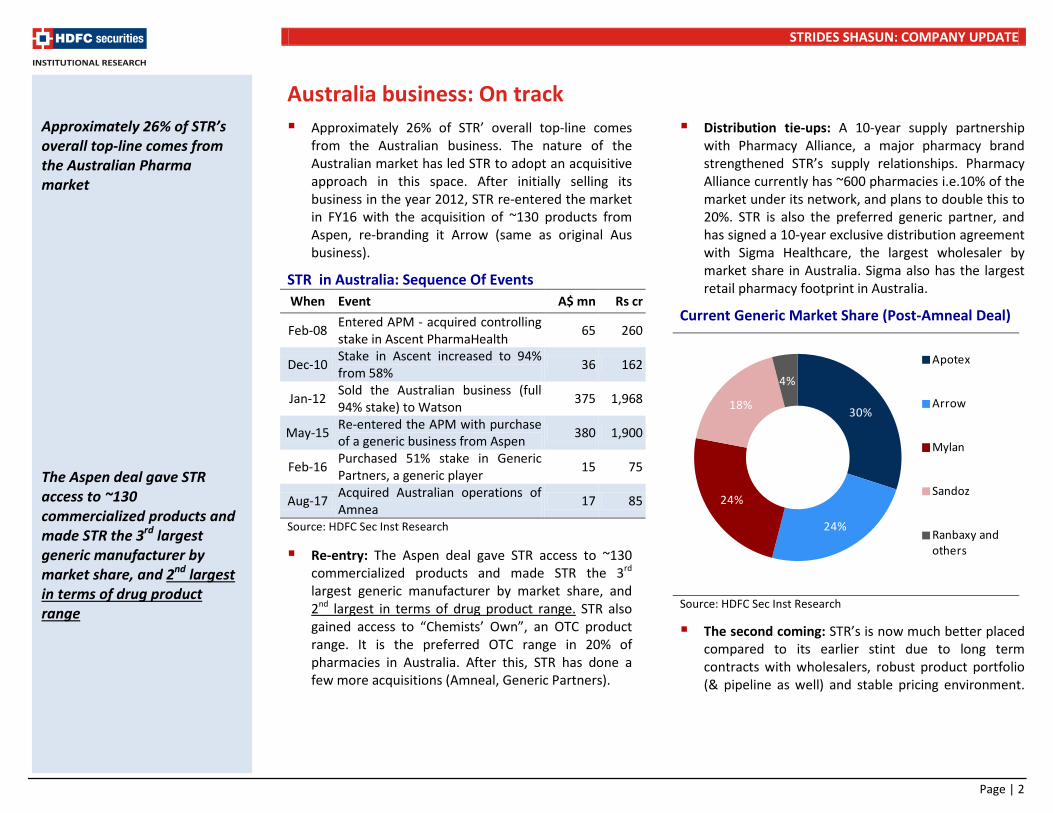
Re-entry: The Aspen deal gave STR access to ~130 commercialized products and made STR the 3rd largest generic manufacturer by market share, and 2nd largest in terms of drug product range. STR also gained access to “Chemists’ Own”, an OTC product range. It is the preferred OTC range in 20% of pharmacies in Australia. After this, STR has done a few more acquisitions (Amneal, Generic Partners).
Distribution tie-ups: A 10-year supply partnership with Pharmacy Alliance, a major pharmacy brand strengthened STR’s supply relationships. Pharmacy Alliance currently has ~600 pharmacies i.e.10% of the market under its network, and plans to double this to 20%. STR is also the preferred generic partner, and has signed a 10-year exclusive distribution agreement with Sigma Healthcare, the largest wholesaler by market share in Australia. Sigma also has the largest retail pharmacy footprint in Australia.
Current Generic Market Share (Post-Amneal Deal)
Source: HDFC Sec Inst Research
The second coming: STR’s is now much better placed compared to its earlier stint due to long term contracts with wholesalers, robust product portfolio (& pipeline as well) and stable pricing environment.
Approximately 26% of STR’s overall top-line comes from the Australian Pharma market The Aspen deal gave STR access to ~130 commercialized products and made STR the 3rd largest generic manufacturer by market share, and 2nd largest in terms of drug product range
30%
24%
24%
18%
4%
Apotex
Arrow
Mylan
Sandoz
Ranbaxy and others
STRIDES SHASUN: COMPANY UPDATE
Page | 3
STR Better Placed In Second Coming Arrow Ascent
Wholesaler partnership Sigma Healthcare: Signed 10-year exclusive preferred partnership.
No partnership. Acquired direct wholesaling through CHS.
Retail Partnerships 20 major retail banner partners (1,100 Stores). Owned – Pharmacy Alliance (600 Stores)
5 major retail banner partners (200 Stores). Owned – Pharmasave (150 Stores).
First-Line Pharmacy Customers 1,400 Stores 700 Stores Generic Range 190 Products 85 Products
OTC Range Full product range (300 SKU’s), Market leading Private Label Selected products (60 SKU’s), No Private Label
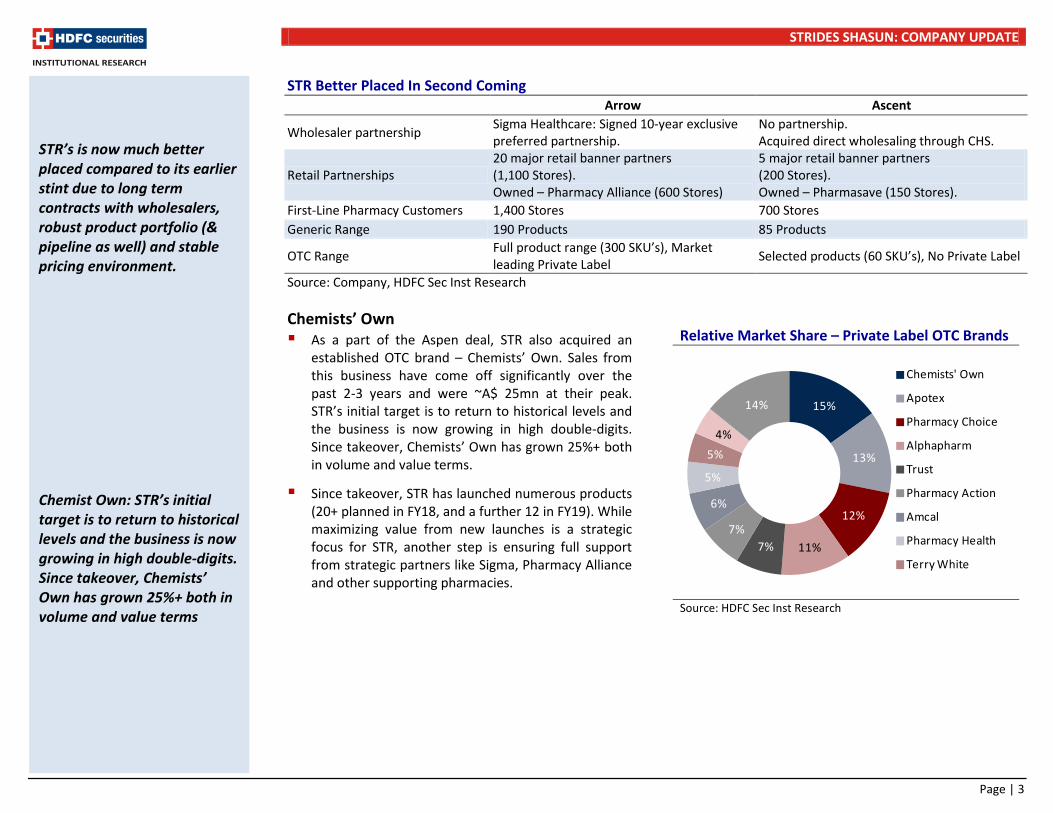
Source: Company, HDFC Sec Inst Research Chemists’ Own As a part of the Aspen deal, STR also acquired an
established OTC brand – Chemists’ Own. Sales from this business have come off significantly over the past 2-3 years and were ~A$ 25mn at their peak. STR’s initial target is to return to historical levels and the business is now growing in high double-digits. Since takeover, Chemists’ Own has grown 25%+ both in volume and value terms.
Since takeover, STR has launched numerous products (20+ planned in FY18, and a further 12 in FY19). While maximizing value from new launches is a strategic focus for STR, another step is ensuring full support from strategic partners like Sigma, Pharmacy Alliance and other supporting pharmacies.
Relative Market Share – Private Label OTC Brands
Source: HDFC Sec Inst Research
STR’s is now much better placed compared to its earlier stint due to long term contracts with wholesalers, robust product portfolio (& pipeline as well) and stable pricing environment. Chemist Own: STR’s initial target is to return to historical levels and the business is now growing in high double-digits. Since takeover, Chemists’ Own has grown 25%+ both in volume and value terms
15%
13%
12%
11%7%7%
6%
5%
5%4%
14%
Chemists' Own
Apotex
Pharmacy Choice
Alphapharm
Trust
Pharmacy Action
Amcal
Pharmacy Health
Terry White
STRIDES SHASUN: COMPANY UPDATE
Page | 4
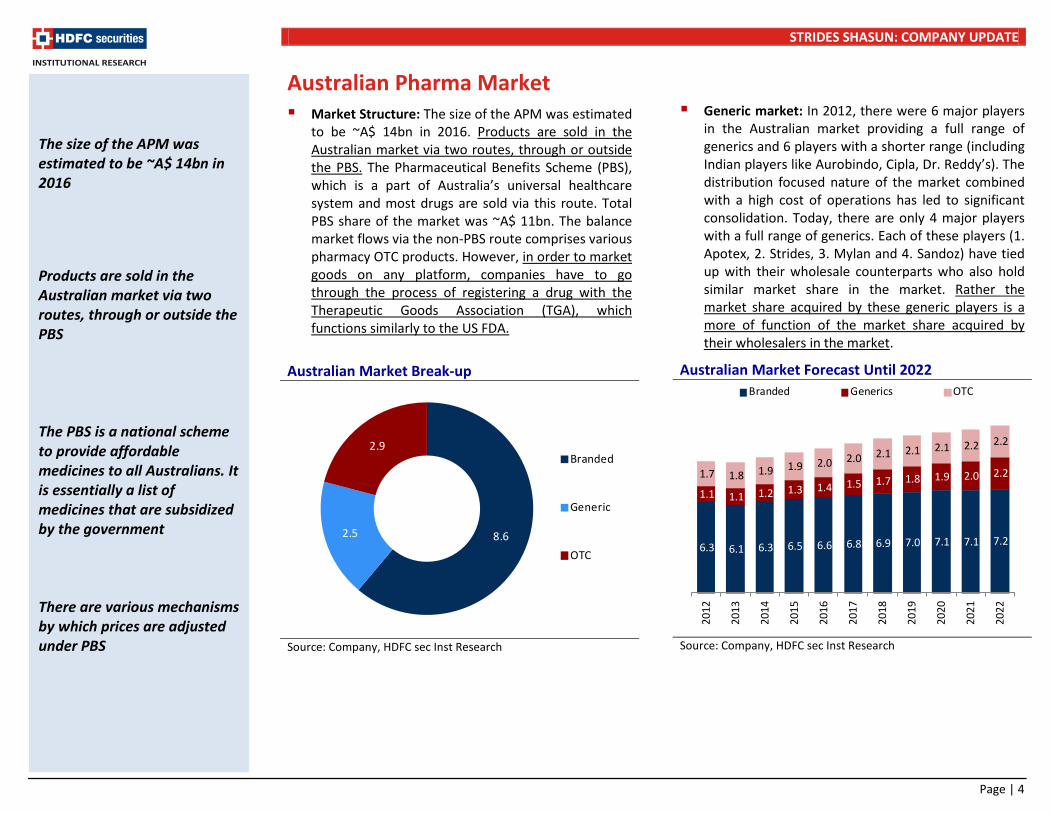
Australian Pharma Market Market Structure: The size of the APM was estimated
to be ~A$ 14bn in 2016. Products are sold in the Australian market via two routes, through or outside the PBS. The Pharmaceutical Benefits Scheme (PBS), which is a part of Australia’s universal healthcare system and most drugs are sold via this route. Total PBS share of the market was ~A$ 11bn. The balance market flows via the non-PBS route comprises various pharmacy OTC products. However, in order to market goods on any platform, companies have to go through the process of registering a drug with the Therapeutic Goods Association (TGA), which functions similarly to the US FDA.
Australian Market Break-up
Source: Company, HDFC sec Inst Research
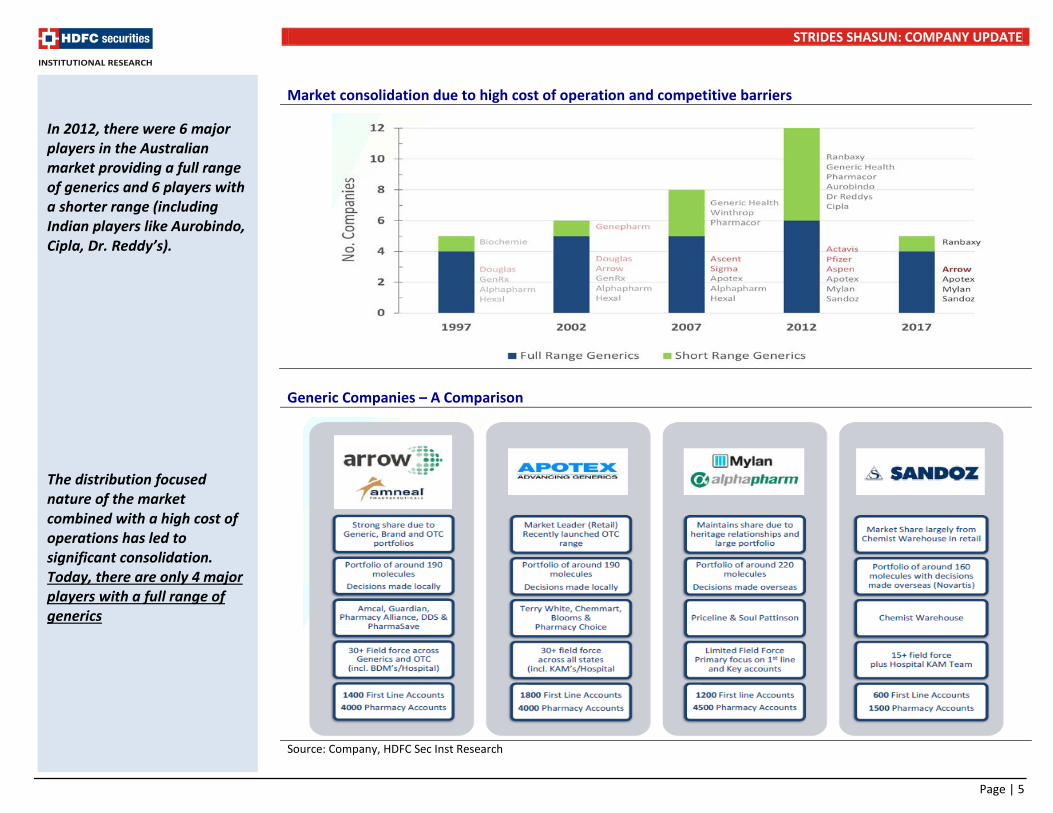
Generic market: In 2012, there were 6 major players
in the Australian market providing a full range of generics and 6 players with a shorter range (including Indian players like Aurobindo, Cipla, Dr. Reddy’s). The distribution focused nature of the market combined with a high cost of operations has led to significant consolidation. Today, there are only 4 major players with a full range of generics. Each of these players (1. Apotex, 2. Strides, 3. Mylan and 4. Sandoz) have tied up with their wholesale counterparts who also hold similar market share in the market. Rather the market share acquired by these generic players is a more of function of the market share acquired by their wholesalers in the market.
Australian Market Forecast Until 2022
Source: Company, HDFC sec Inst Research
The size of the APM was estimated to be ~A$ 14bn in 2016 Products are sold in the Australian market via two routes, through or outside the PBS The PBS is a national scheme to provide affordable medicines to all Australians. It is essentially a list of medicines that are subsidized by the government There are various mechanisms by which prices are adjusted under PBS
8.62.5
2.9Branded
Generic
OTC6.3 6.1 6.3 6.5 6.6 6.8 6.9 7.0 7.1 7.1 7.2
1.1 1.1 1.2 1.3 1.4 1.5 1.7 1.8 1.9 2.0 2.2 1.7 1.8 1.9 1.9 2.0 2.0 2.1 2.1 2.1 2.2 2.2
2012
2013
2014
2015
2016
2017
2018
2019
2020
2021
2022
Branded Generics OTC
STRIDES SHASUN: COMPANY UPDATE
Page | 5
Market consolidation due to high cost of operation and competitive barriers
Generic Companies – A Comparison
Source: Company, HDFC Sec Inst Research
In 2012, there were 6 major players in the Australian market providing a full range of generics and 6 players with a shorter range (including Indian players like Aurobindo, Cipla, Dr. Reddy’s). The distribution focused nature of the market combined with a high cost of operations has led to significant consolidation. Today, there are only 4 major players with a full range of generics
STRIDES SHASUN: COMPANY UPDATE
Page | 6
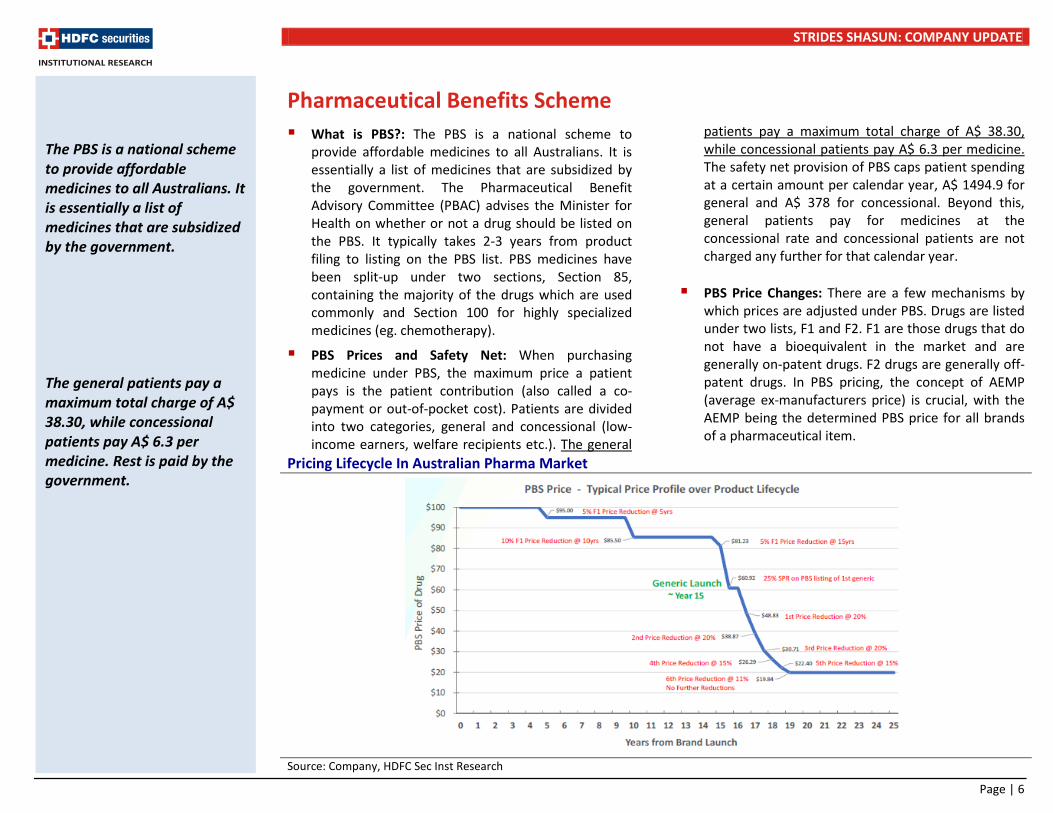
Pharmaceutical Benefits Scheme What is PBS?: The PBS is a national scheme to
provide affordable medicines to all Australians. It is essentially a list of medicines that are subsidized by the government. The Pharmaceutical Benefit Advisory Committee (PBAC) advises the Minister for Health on whether or not a drug should be listed on the PBS. It typically takes 2-3 years from product filing to listing on the PBS list. PBS medicines have been split-up under two sections, Section 85, containing the majority of the drugs which are used commonly and Section 100 for highly specialized medicines (eg. chemotherapy).
PBS Prices and Safety Net: When purchasing medicine under PBS, the maximum price a patient pays is the patient contribution (also called a co- payment or out-of-pocket cost). Patients are divided into two categories, general and concessional (low-income earners, welfare recipients etc.). The general
patients pay a maximum total charge of A$ 38.30, while concessional patients pay A$ 6.3 per medicine. The safety net provision of PBS caps patient spending at a certain amount per calendar year, A$ 1494.9 for general and A$ 378 for concessional. Beyond this, general patients pay for medicines at the concessional rate and concessional patients are not charged any further for that calendar year.
PBS Price Changes: There are a few mechanisms by which prices are adjusted under PBS. Drugs are listed under two lists, F1 and F2. F1 are those drugs that do not have a bioequivalent in the market and are generally on-patent drugs. F2 drugs are generally off-patent drugs. In PBS pricing, the concept of AEMP (average ex-manufacturers price) is crucial, with the AEMP being the determined PBS price for all brands of a pharmaceutical item.
Pricing Lifecycle In Australian Pharma Market
Source: Company, HDFC Sec Inst Research
The PBS is a national scheme to provide affordable medicines to all Australians. It is essentially a list of medicines that are subsidized by the government. The general patients pay a maximum total charge of A$ 38.30, while concessional patients pay A$ 6.3 per medicine. Rest is paid by the government.
STRIDES SHASUN: COMPANY UPDATE
Page | 7
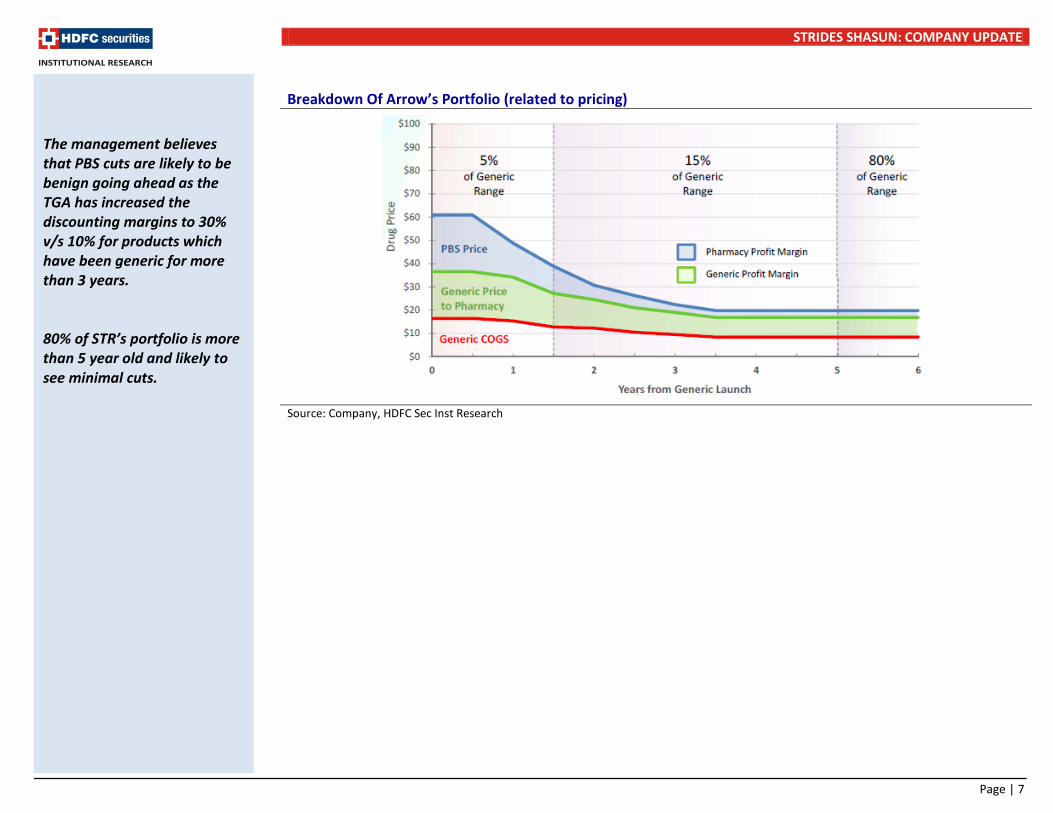
Breakdown Of Arrow’s Portfolio (related to pricing)
Source: Company, HDFC Sec Inst Research
The management believes that PBS cuts are likely to be benign going ahead as the TGA has increased the discounting margins to 30% v/s 10% for products which have been generic for more than 3 years. 80% of STR’s portfolio is more than 5 year old and likely to see minimal cuts.
STRIDES SHASUN: COMPANY UPDATE
Page | 8
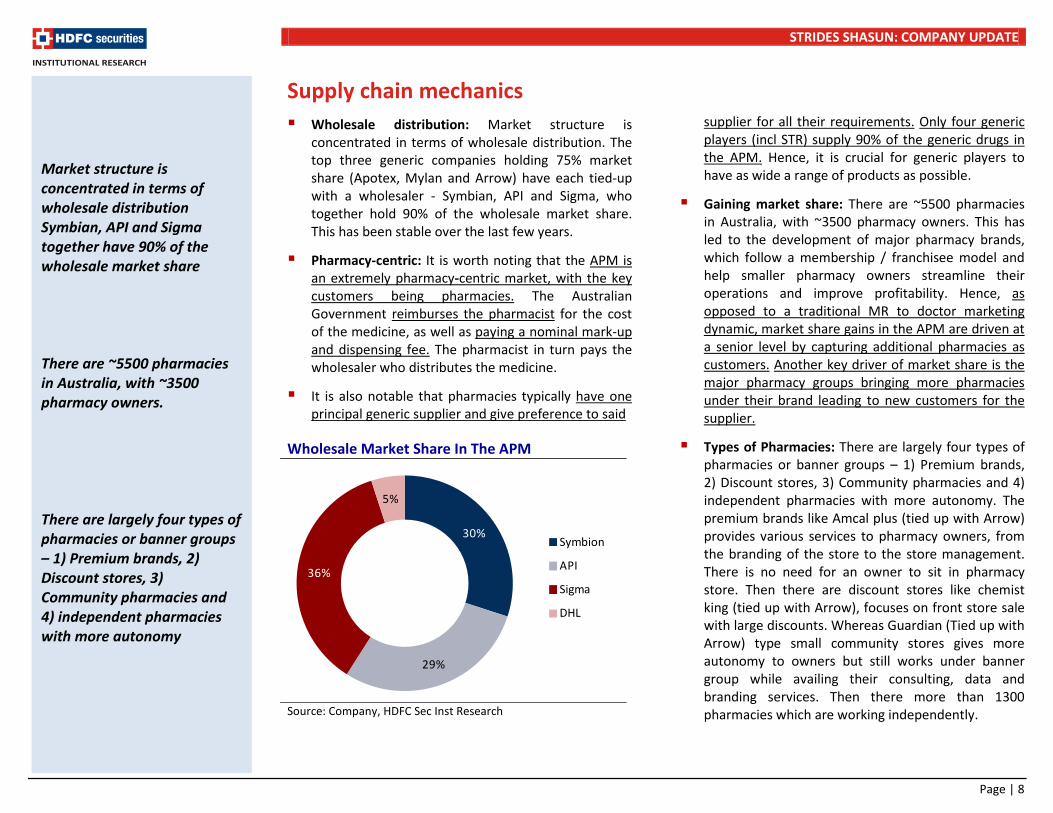
Supply chain mechanics Wholesale distribution: Market structure is
concentrated in terms of wholesale distribution. The top three generic companies holding 75% market share (Apotex, Mylan and Arrow) have each tied-up with a wholesaler - Symbian, API and Sigma, who together hold 90% of the wholesale market share. This has been stable over the last few years.
Pharmacy-centric: It is worth noting that the APM is an extremely pharmacy-centric market, with the key customers being pharmacies. The Australian Government reimburses the pharmacist for the cost of the medicine, as well as paying a nominal mark-up and dispensing fee. The pharmacist in turn pays the wholesaler who distributes the medicine.
It is also notable that pharmacies typically have one principal generic supplier and give preference to said
Wholesale Market Share In The APM
Source: Company, HDFC Sec Inst Research
supplier for all their requirements. Only four generic players (incl STR) supply 90% of the generic drugs in the APM. Hence, it is crucial for generic players to have as wide a range of products as possible.
Gaining market share: There are ~5500 pharmacies in Australia, with ~3500 pharmacy owners. This has led to the development of major pharmacy brands, which follow a membership / franchisee model and help smaller pharmacy owners streamline their operations and improve profitability. Hence, as opposed to a traditional MR to doctor marketing dynamic, market share gains in the APM are driven at a senior level by capturing additional pharmacies as customers. Another key driver of market share is the major pharmacy groups bringing more pharmacies under their brand leading to new customers for the supplier.
Types of Pharmacies: There are largely four types of pharmacies or banner groups – 1) Premium brands, 2) Discount stores, 3) Community pharmacies and 4) independent pharmacies with more autonomy. The premium brands like Amcal plus (tied up with Arrow) provides various services to pharmacy owners, from the branding of the store to the store management. There is no need for an owner to sit in pharmacy store. Then there are discount stores like chemist king (tied up with Arrow), focuses on front store sale with large discounts. Whereas Guardian (Tied up with Arrow) type small community stores gives more autonomy to owners but still works under banner group while availing their consulting, data and branding services. Then there more than 1300 pharmacies which are working independently.
30%
29%
36%
5%
Symbion
API
Sigma
DHL
Market structure is concentrated in terms of wholesale distribution Symbian, API and Sigma together have 90% of the wholesale market share There are ~5500 pharmacies in Australia, with ~3500 pharmacy owners. There are largely four types of pharmacies or banner groups – 1) Premium brands, 2) Discount stores, 3) Community pharmacies and 4) independent pharmacies with more autonomy
STRIDES SHASUN: COMPANY UPDATE
Page | 9
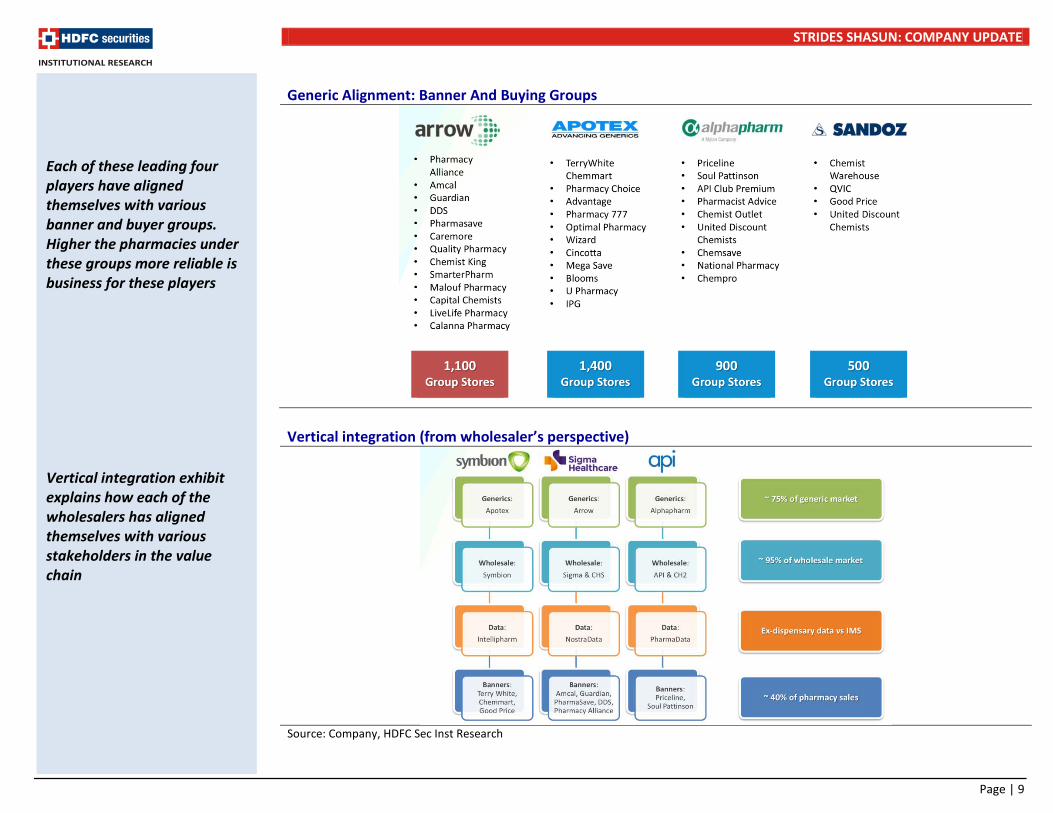
Generic Alignment: Banner And Buying Groups
Vertical integration (from wholesaler’s perspective)
Source: Company, HDFC Sec Inst Research
Each of these leading four players have aligned themselves with various banner and buyer groups. Higher the pharmacies under these groups more reliable is business for these players Vertical integration exhibit explains how each of the wholesalers has aligned themselves with various stakeholders in the value chain
STRIDES SHASUN: COMPANY UPDATE
Page | 10
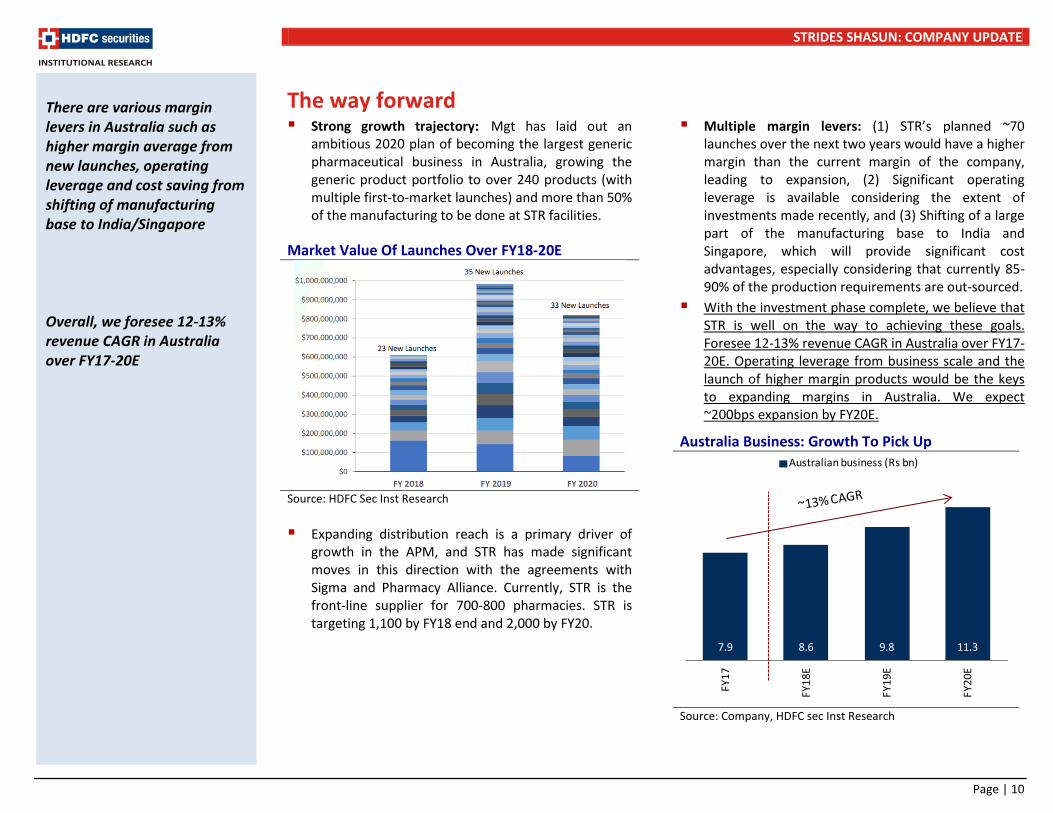
The way forward Strong growth trajectory: Mgt has laid out an
ambitious 2020 plan of becoming the largest generic pharmaceutical business in Australia, growing the generic product portfolio to over 240 products (with multiple first-to-market launches) and more than 50% of the manufacturing to be done at STR facilities.
Market Value Of Launches Over FY18-20E
Source: HDFC Sec Inst Research
Expanding distribution reach is a primary driver of growth in the APM, and STR has made significant moves in this direction with the agreements with Sigma and Pharmacy Alliance. Currently, STR is the front-line supplier for 700-800 pharmacies. STR is targeting 1,100 by FY18 end and 2,000 by FY20.
Multiple margin levers: (1) STR’s planned ~70 launches over the next two years would have a higher margin than the current margin of the company, leading to expansion, (2) Significant operating leverage is available considering the extent of investments made recently, and (3) Shifting of a large part of the manufacturing base to India and Singapore, which will provide significant cost advantages, especially considering that currently 85-90% of the production requirements are out-sourced.
With the investment phase complete, we believe that STR is well on the way to achieving these goals. Foresee 12-13% revenue CAGR in Australia over FY17-20E. Operating leverage from business scale and the launch of higher margin products would be the keys to expanding margins in Australia. We expect ~200bps expansion by FY20E.
Australia Business: Growth To Pick Up
Source: Company, HDFC sec Inst Research
There are various margin levers in Australia such as higher margin average from new launches, operating leverage and cost saving from shifting of manufacturing base to India/Singapore Overall, we foresee 12-13% revenue CAGR in Australia over FY17-20E
7.9 8.6 9.8 11.3
FY17
FY18
E
FY19
E
FY20
E
Australian business (Rs bn)
STRIDES SHASUN: COMPANY UPDATE
Page | 11
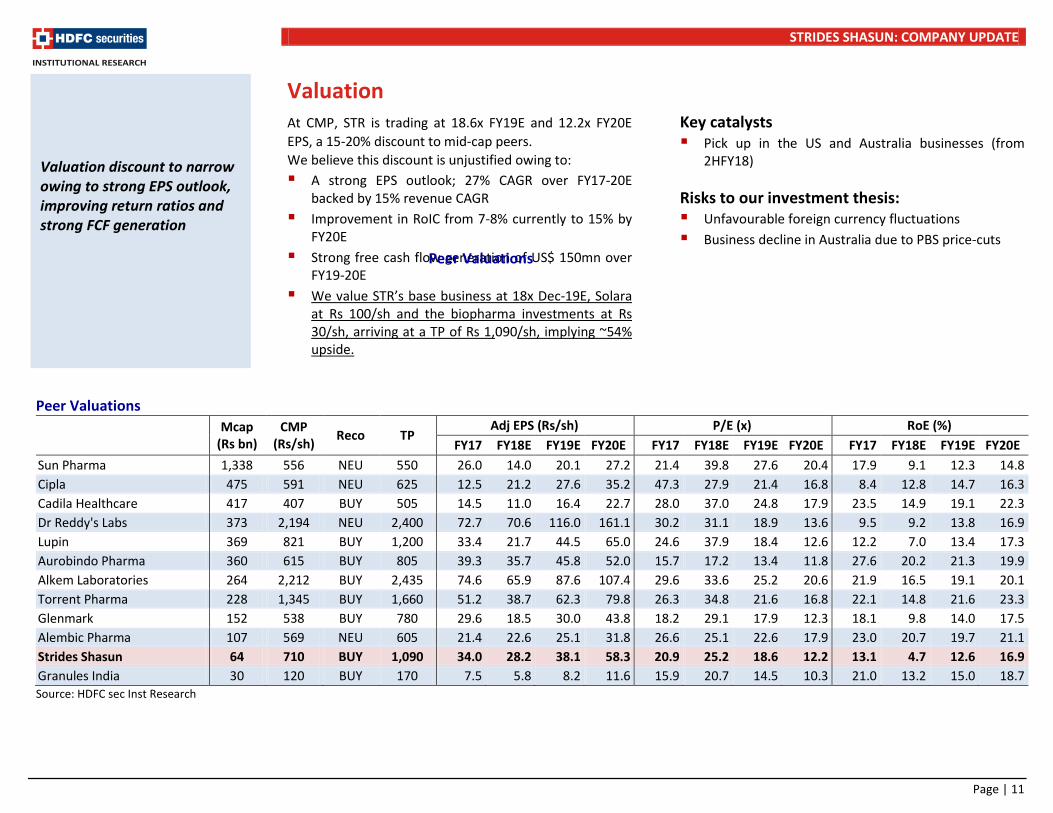
Valuation At CMP, STR is trading at 18.6x FY19E and 12.2x FY20E EPS, a 15-20% discount to mid-cap peers. We believe this discount is unjustified owing to: A strong EPS outlook; 27% CAGR over FY17-20E
backed by 15% revenue CAGR Improvement in RoIC from 7-8% currently to 15% by
FY20E Strong free cash flow generation of US$ 150mn over
FY19-20E We value STR’s base business at 18x Dec-19E, Solara
at Rs 100/sh and the biopharma investments at Rs 30/sh, arriving at a TP of Rs 1,090/sh, implying ~54% upside.
Peer Valuations
Key catalysts Pick up in the US and Australia businesses (from
2HFY18) Risks to our investment thesis: Unfavourable foreign currency fluctuations Business decline in Australia due to PBS price-cuts
Peer Valuations
Mcap (Rs bn)
CMP (Rs/sh) Reco TP
Adj EPS (Rs/sh) P/E (x) RoE (%) FY17 FY18E FY19E FY20E FY17 FY18E FY19E FY20E FY17 FY18E FY19E FY20E
Sun Pharma 1,338 556 NEU 550 26.0 14.0 20.1 27.2 21.4 39.8 27.6 20.4 17.9 9.1 12.3 14.8 Cipla 475 591 NEU 625 12.5 21.2 27.6 35.2 47.3 27.9 21.4 16.8 8.4 12.8 14.7 16.3 Cadila Healthcare 417 407 BUY 505 14.5 11.0 16.4 22.7 28.0 37.0 24.8 17.9 23.5 14.9 19.1 22.3 Dr Reddy's Labs 373 2,194 NEU 2,400 72.7 70.6 116.0 161.1 30.2 31.1 18.9 13.6 9.5 9.2 13.8 16.9 Lupin 369 821 BUY 1,200 33.4 21.7 44.5 65.0 24.6 37.9 18.4 12.6 12.2 7.0 13.4 17.3 Aurobindo Pharma 360 615 BUY 805 39.3 35.7 45.8 52.0 15.7 17.2 13.4 11.8 27.6 20.2 21.3 19.9 Alkem Laboratories 264 2,212 BUY 2,435 74.6 65.9 87.6 107.4 29.6 33.6 25.2 20.6 21.9 16.5 19.1 20.1 Torrent Pharma 228 1,345 BUY 1,660 51.2 38.7 62.3 79.8 26.3 34.8 21.6 16.8 22.1 14.8 21.6 23.3 Glenmark 152 538 BUY 780 29.6 18.5 30.0 43.8 18.2 29.1 17.9 12.3 18.1 9.8 14.0 17.5 Alembic Pharma 107 569 NEU 605 21.4 22.6 25.1 31.8 26.6 25.1 22.6 17.9 23.0 20.7 19.7 21.1 Strides Shasun 64 710 BUY 1,090 34.0 28.2 38.1 58.3 20.9 25.2 18.6 12.2 13.1 4.7 12.6 16.9 Granules India 30 120 BUY 170 7.5 5.8 8.2 11.6 15.9 20.7 14.5 10.3 21.0 13.2 15.0 18.7 Source: HDFC sec Inst Research
Valuation discount to narrow owing to strong EPS outlook, improving return ratios and strong FCF generation
STRIDES SHASUN: COMPANY UPDATE
Page | 12
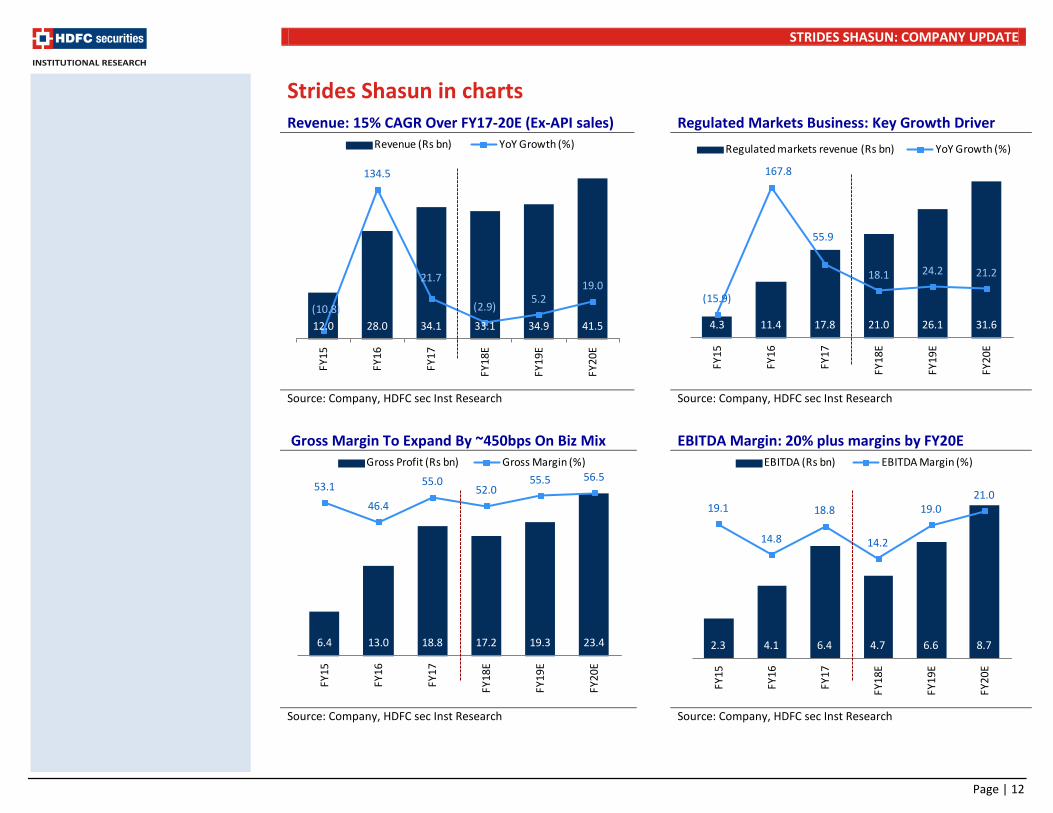
Strides Shasun in charts Revenue: 15% CAGR Over FY17-20E (Ex-API sales) Regulated Markets Business: Key Growth Driver
Source: Company, HDFC sec Inst Research Source: Company, HDFC sec Inst Research
Gross Margin To Expand By ~450bps On Biz Mix EBITDA Margin: 20% plus margins by FY20E
Source: Company, HDFC sec Inst Research Source: Company, HDFC sec Inst Research
12.0 28.0 34.1 33.1 34.9 41.5(10.8)
134.5
21.7
(2.9)5.2
19.0
FY15
FY16
FY17
FY18
E
FY19
E
FY20
E
Revenue (Rs bn) YoY Growth (%)
4.3 11.4 17.8 21.0 26.1 31.6
(15.9)
167.8
55.9
18.1 24.2 21.2
FY15
FY16
FY17
FY18
E
FY19
E
FY20
E
Regulated markets revenue (Rs bn) YoY Growth (%)
6.4 13.0 18.8 17.2 19.3 23.4
53.1
46.4
55.0 52.0
55.5 56.5
FY15
FY16
FY17
FY18
E
FY19
E
FY20
E
Gross Profit (Rs bn) Gross Margin (%)
2.3 4.1 6.4 4.7 6.6 8.7
19.1
14.8
18.8
14.2
19.0 21.0
FY15
FY16
FY17
FY18
E
FY19
E
FY20
E
EBITDA (Rs bn) EBITDA Margin (%)
STRIDES SHASUN: COMPANY UPDATE
Page | 13
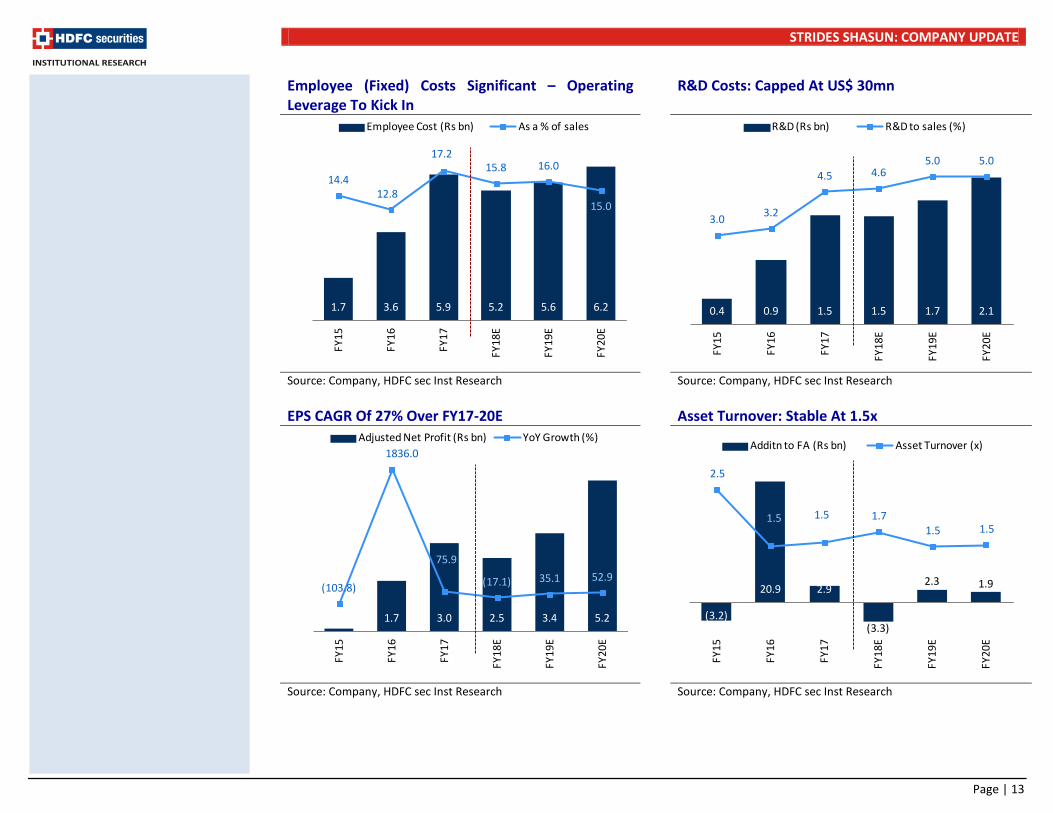
Employee (Fixed) Costs Significant – Operating Leverage To Kick In
R&D Costs: Capped At US$ 30mn
Source: Company, HDFC sec Inst Research Source: Company, HDFC sec Inst Research EPS CAGR Of 27% Over FY17-20E Asset Turnover: Stable At 1.5x
Source: Company, HDFC sec Inst Research Source: Company, HDFC sec Inst Research
1.7 3.6 5.9 5.2 5.6 6.2
14.4 12.8
17.2 15.8 16.0
15.0
0
1
2
3
4
5
6
7
FY15
FY16
FY17
FY18
E
FY19
E
FY20
E
Employee Cost (Rs bn) As a % of sales
0.4 0.9 1.5 1.5 1.7 2.1
3.0 3.2
4.5 4.6 5.0 5.0
FY15
FY16
FY17
FY18
E
FY19
E
FY20
E
R&D (Rs bn) R&D to sales (%)
0.1 1.7 3.0 2.5 3.4 5.2
(103.8)
1836.0
75.9
(17.1) 35.1 52.9
0
1
2
3
4
5
6
FY15
FY16
FY17
FY18
E
FY19
E
FY20
E
Adjusted Net Profit (Rs bn) YoY Growth (%)
(3.2)
20.9 2.9
(3.3)
2.3 1.9
2.5
1.5 1.5 1.7 1.5 1.5
FY15
FY16
FY17
FY18
E
FY19
E
FY20
E
Additn to FA (Rs bn) Asset Turnover (x)
STRIDES SHASUN: COMPANY UPDATE
Page | 14
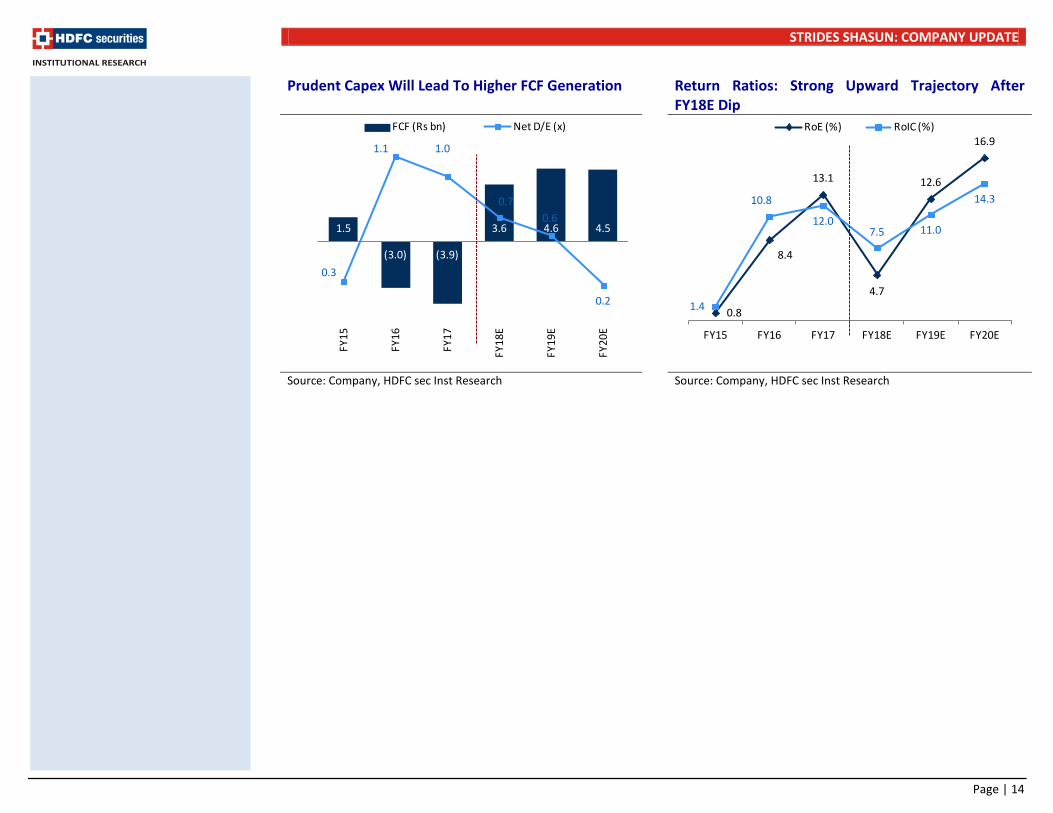
Prudent Capex Will Lead To Higher FCF Generation Return Ratios: Strong Upward Trajectory After FY18E Dip
Source: Company, HDFC sec Inst Research Source: Company, HDFC sec Inst Research
1.5
(3.0) (3.9)
3.6 4.6 4.5
0.3
1.1 1.0
0.70.6
0.2-5-4-3-2-10123456
FY15
FY16
FY17
FY18
E
FY19
E
FY20
E
FCF (Rs bn) Net D/E (x)
0.8
8.4
13.1
4.7
12.6
16.9
1.4
10.8
12.0 7.5 11.0
14.3
FY15 FY16 FY17 FY18E FY19E FY20E
RoE (%) RoIC (%)
STRIDES SHASUN: COMPANY UPDATE
Page | 15
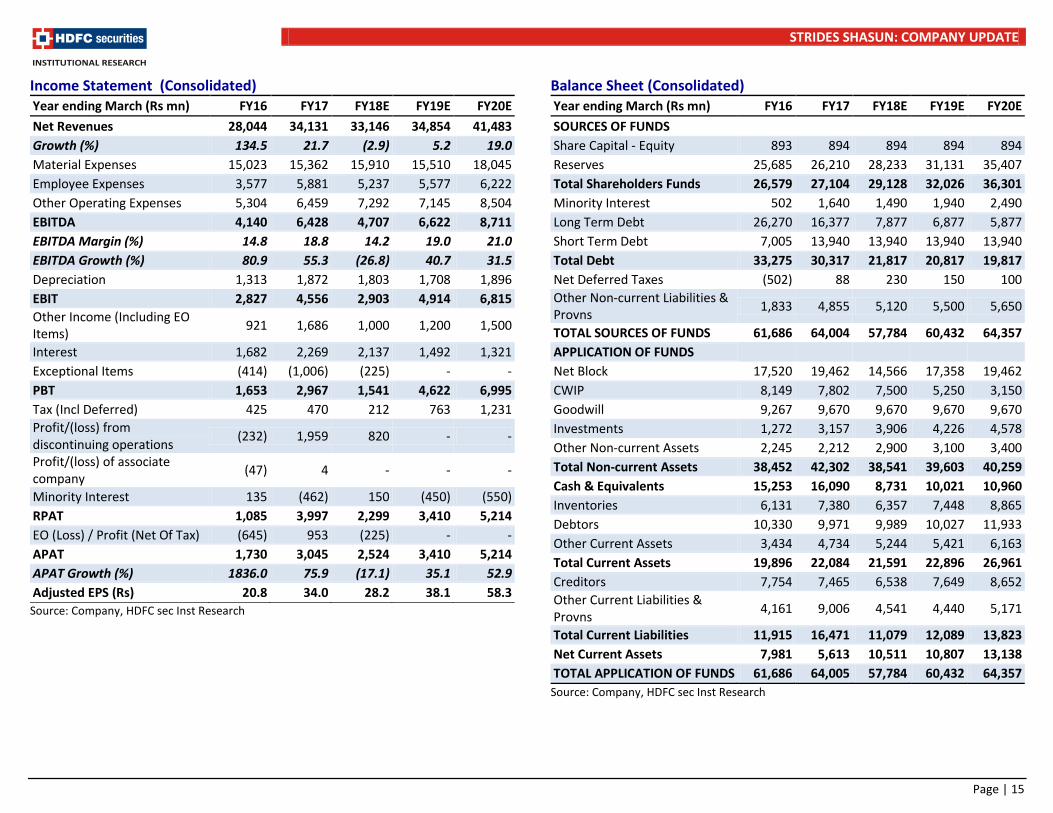
Income Statement (Consolidated) Year ending March (Rs mn) FY16 FY17 FY18E FY19E FY20E Net Revenues 28,044 34,131 33,146 34,854 41,483 Growth (%) 134.5 21.7 (2.9) 5.2 19.0 Material Expenses 15,023 15,362 15,910 15,510 18,045 Employee Expenses 3,577 5,881 5,237 5,577 6,222 Other Operating Expenses 5,304 6,459 7,292 7,145 8,504 EBITDA 4,140 6,428 4,707 6,622 8,711 EBITDA Margin (%) 14.8 18.8 14.2 19.0 21.0 EBITDA Growth (%) 80.9 55.3 (26.8) 40.7 31.5 Depreciation 1,313 1,872 1,803 1,708 1,896 EBIT 2,827 4,556 2,903 4,914 6,815 Other Income (Including EO Items) 921 1,686 1,000 1,200 1,500
Interest 1,682 2,269 2,137 1,492 1,321 Exceptional Items (414) (1,006) (225) - - PBT 1,653 2,967 1,541 4,622 6,995 Tax (Incl Deferred) 425 470 212 763 1,231 Profit/(loss) from discontinuing operations (232) 1,959 820 - -
Profit/(loss) of associate company (47) 4 - - -
Minority Interest 135 (462) 150 (450) (550) RPAT 1,085 3,997 2,299 3,410 5,214 EO (Loss) / Profit (Net Of Tax) (645) 953 (225) - - APAT 1,730 3,045 2,524 3,410 5,214 APAT Growth (%) 1836.0 75.9 (17.1) 35.1 52.9 Adjusted EPS (Rs) 20.8 34.0 28.2 38.1 58.3 Source: Company, HDFC sec Inst Research
Balance Sheet (Consolidated) Year ending March (Rs mn) FY16 FY17 FY18E FY19E FY20E SOURCES OF FUNDS Share Capital - Equity 893 894 894 894 894 Reserves 25,685 26,210 28,233 31,131 35,407 Total Shareholders Funds 26,579 27,104 29,128 32,026 36,301 Minority Interest 502 1,640 1,490 1,940 2,490 Long Term Debt 26,270 16,377 7,877 6,877 5,877 Short Term Debt 7,005 13,940 13,940 13,940 13,940 Total Debt 33,275 30,317 21,817 20,817 19,817 Net Deferred Taxes (502) 88 230 150 100 Other Non-current Liabilities & Provns 1,833 4,855 5,120 5,500 5,650
TOTAL SOURCES OF FUNDS 61,686 64,004 57,784 60,432 64,357 APPLICATION OF FUNDS Net Block 17,520 19,462 14,566 17,358 19,462 CWIP 8,149 7,802 7,500 5,250 3,150 Goodwill 9,267 9,670 9,670 9,670 9,670 Investments 1,272 3,157 3,906 4,226 4,578 Other Non-current Assets 2,245 2,212 2,900 3,100 3,400 Total Non-current Assets 38,452 42,302 38,541 39,603 40,259 Cash & Equivalents 15,253 16,090 8,731 10,021 10,960 Inventories 6,131 7,380 6,357 7,448 8,865 Debtors 10,330 9,971 9,989 10,027 11,933 Other Current Assets 3,434 4,734 5,244 5,421 6,163 Total Current Assets 19,896 22,084 21,591 22,896 26,961 Creditors 7,754 7,465 6,538 7,649 8,652 Other Current Liabilities & Provns 4,161 9,006 4,541 4,440 5,171
Total Current Liabilities 11,915 16,471 11,079 12,089 13,823 Net Current Assets 7,981 5,613 10,511 10,807 13,138 TOTAL APPLICATION OF FUNDS 61,686 64,005 57,784 60,432 64,357
Source: Company, HDFC sec Inst Research
STRIDES SHASUN: COMPANY UPDATE
Page | 16
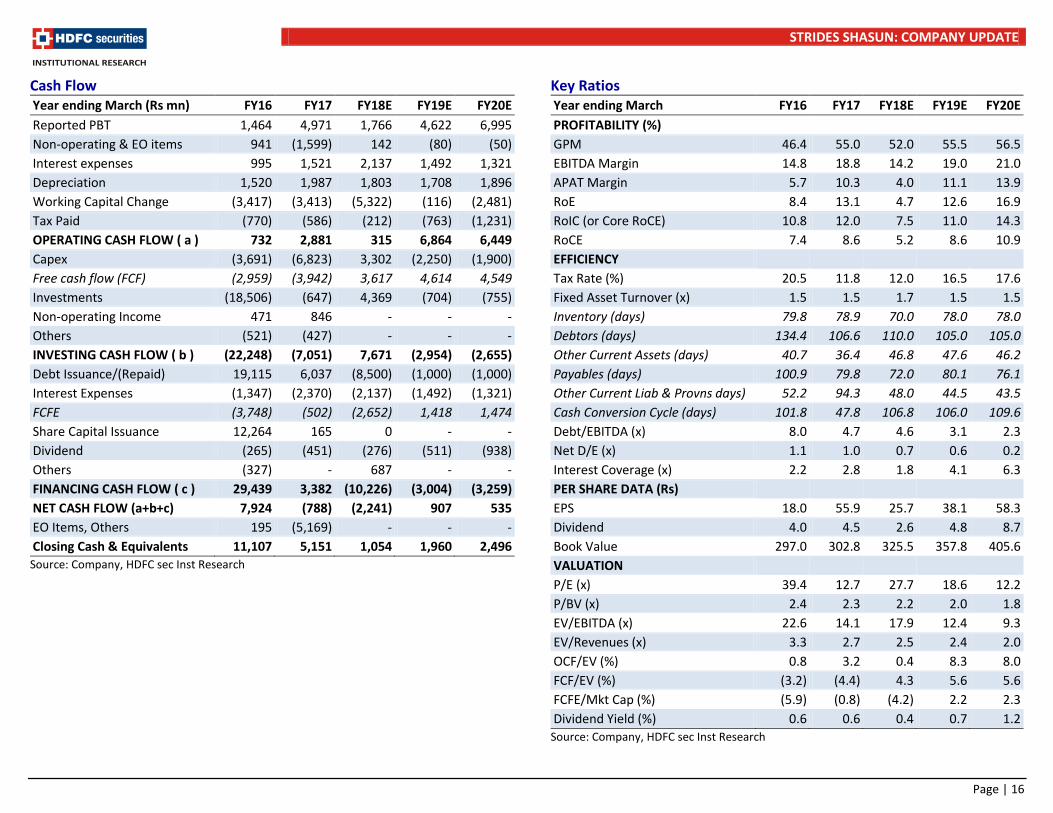
Cash Flow Year ending March (Rs mn) FY16 FY17 FY18E FY19E FY20E Reported PBT 1,464 4,971 1,766 4,622 6,995 Non-operating & EO items 941 (1,599) 142 (80) (50) Interest expenses 995 1,521 2,137 1,492 1,321 Depreciation 1,520 1,987 1,803 1,708 1,896 Working Capital Change (3,417) (3,413) (5,322) (116) (2,481) Tax Paid (770) (586) (212) (763) (1,231) OPERATING CASH FLOW ( a ) 732 2,881 315 6,864 6,449 Capex (3,691) (6,823) 3,302 (2,250) (1,900) Free cash flow (FCF) (2,959) (3,942) 3,617 4,614 4,549 Investments (18,506) (647) 4,369 (704) (755) Non-operating Income 471 846 - - - Others (521) (427) - - - INVESTING CASH FLOW ( b ) (22,248) (7,051) 7,671 (2,954) (2,655) Debt Issuance/(Repaid) 19,115 6,037 (8,500) (1,000) (1,000) Interest Expenses (1,347) (2,370) (2,137) (1,492) (1,321) FCFE (3,748) (502) (2,652) 1,418 1,474 Share Capital Issuance 12,264 165 0 - - Dividend (265) (451) (276) (511) (938) Others (327) - 687 - - FINANCING CASH FLOW ( c ) 29,439 3,382 (10,226) (3,004) (3,259) NET CASH FLOW (a+b+c) 7,924 (788) (2,241) 907 535 EO Items, Others 195 (5,169) - - - Closing Cash & Equivalents 11,107 5,151 1,054 1,960 2,496 Source: Company, HDFC sec Inst Research
Key Ratios Year ending March FY16 FY17 FY18E FY19E FY20E PROFITABILITY (%) GPM 46.4 55.0 52.0 55.5 56.5 EBITDA Margin 14.8 18.8 14.2 19.0 21.0 APAT Margin 5.7 10.3 4.0 11.1 13.9 RoE 8.4 13.1 4.7 12.6 16.9 RoIC (or Core RoCE) 10.8 12.0 7.5 11.0 14.3 RoCE 7.4 8.6 5.2 8.6 10.9 EFFICIENCY Tax Rate (%) 20.5 11.8 12.0 16.5 17.6 Fixed Asset Turnover (x) 1.5 1.5 1.7 1.5 1.5 Inventory (days) 79.8 78.9 70.0 78.0 78.0 Debtors (days) 134.4 106.6 110.0 105.0 105.0 Other Current Assets (days) 40.7 36.4 46.8 47.6 46.2 Payables (days) 100.9 79.8 72.0 80.1 76.1 Other Current Liab & Provns days) 52.2 94.3 48.0 44.5 43.5 Cash Conversion Cycle (days) 101.8 47.8 106.8 106.0 109.6 Debt/EBITDA (x) 8.0 4.7 4.6 3.1 2.3 Net D/E (x) 1.1 1.0 0.7 0.6 0.2 Interest Coverage (x) 2.2 2.8 1.8 4.1 6.3 PER SHARE DATA (Rs) EPS 18.0 55.9 25.7 38.1 58.3 Dividend 4.0 4.5 2.6 4.8 8.7 Book Value 297.0 302.8 325.5 357.8 405.6 VALUATION P/E (x) 39.4 12.7 27.7 18.6 12.2 P/BV (x) 2.4 2.3 2.2 2.0 1.8 EV/EBITDA (x) 22.6 14.1 17.9 12.4 9.3 EV/Revenues (x) 3.3 2.7 2.5 2.4 2.0 OCF/EV (%) 0.8 3.2 0.4 8.3 8.0 FCF/EV (%) (3.2) (4.4) 4.3 5.6 5.6 FCFE/Mkt Cap (%) (5.9) (0.8) (4.2) 2.2 2.3 Dividend Yield (%) 0.6 0.6 0.4 0.7 1.2
Source: Company, HDFC sec Inst Research
STRIDES SHASUN: COMPANY UPDATE
Page | 17
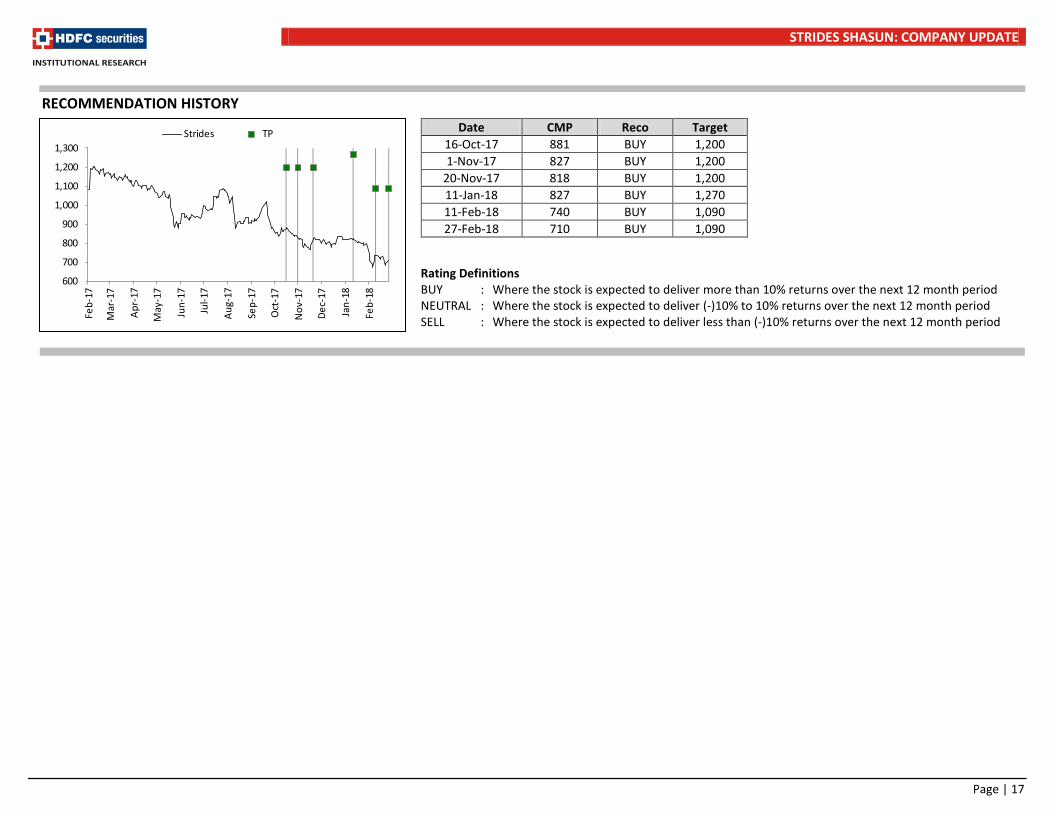
RECOMMENDATION HISTORY
Date CMP Reco Target 16-Oct-17 881 BUY 1,200 1-Nov-17 827 BUY 1,200
20-Nov-17 818 BUY 1,200 11-Jan-18 827 BUY 1,270 11-Feb-18 740 BUY 1,090 27-Feb-18 710 BUY 1,090
600
700
800
900
1,000
1,100
1,200
1,300
Feb-
17
Mar
-17
Apr-
17
May
-17
Jun-
17
Jul-1
7
Aug-
17
Sep-
17
Oct
-17
Nov
-17
Dec-
17
Jan-
18
Feb-
18
Strides TP
Rating Definitions BUY : Where the stock is expected to deliver more than 10% returns over the next 12 month period NEUTRAL : Where the stock is expected to deliver (-)10% to 10% returns over the next 12 month period SELL : Where the stock is expected to deliver less than (-)10% returns over the next 12 month period
STRIDES SHASUN: COMPANY UPDATE
Page | 18
Disclosure: We, Amey Chalke, MBA & Siddhant Mansukhani, ACA, authors and the names subscribed to this report, hereby certify that all of the views expressed in this research report accurately reflect our views about the subject issuer(s) or securities. HSL has no material adverse disciplinary history as on the date of publication of this report. We also certify that no part of our compensation was, is, or will be directly or indirectly related to the specific recommendation(s) or view(s) in this report. Research Analyst or his/her relative or HDFC Securities Ltd. does not have any financial interest in the subject company. Also Research Analyst or his relative or HDFC Securities Ltd. or its Associate may have beneficial ownership of 1% or more in the subject company at the end of the month immediately preceding the date of publication of the Research Report. Further Research Analyst or his relative or HDFC Securities Ltd. or its associate does not have any material conflict of interest. Any holding in stock –No HDFC Securities Limited (HSL) is a SEBI Registered Research Analyst having registration no. INH000002475. Disclaimer: This report has been prepared by HDFC Securities Ltd and is meant for sole use by the recipient and not for circulation. The information and opinions contained herein have been compiled or arrived at, based upon information obtained in good faith from sources believed to be reliable. Such information has not been independently verified and no guaranty, representation of warranty, express or implied, is made as to its accuracy, completeness or correctness. All such information and opinions are subject to change without notice. This document is for information purposes only. Descriptions of any company or companies or their securities mentioned herein are not intended to be complete and this document is not, and should not be construed as an offer or solicitation of an offer, to buy or sell any securities or other financial instruments. This report is not directed to, or intended for display, downloading, printing, reproducing or for distribution to or use by, any person or entity who is a citizen or resident or located in any locality, state, country or other jurisdiction where such distribution, publication, reproduction, availability or use would be contrary to law or regulation or what would subject HSL or its affiliates to any registration or licensing requirement within such jurisdiction. If this report is inadvertently send or has reached any individual in such country, especially, USA, the same may be ignored and brought to the attention of the sender. This document may not be reproduced, distributed or published for any purposes without prior written approval of HSL. Foreign currencies denominated securities, wherever mentioned, are subject to exchange rate fluctuations, which could have an adverse effect on their value or price, or the income derived from them. In addition, investors in securities such as ADRs, the values of which are influenced by foreign currencies effectively assume currency risk. It should not be considered to be taken as an offer to sell or a solicitation to buy any security. HSL may from time to time solicit from, or perform broking, or other services for, any company mentioned in this mail and/or its attachments. HSL and its affiliated company(ies), their directors and employees may; (a) from time to time, have a long or short position in, and buy or sell the securities of the company(ies) mentioned herein or (b) be engaged in any other transaction involving such securities and earn brokerage or other compensation or act as a market maker in the financial instruments of the company(ies) discussed herein or act as an advisor or lender/borrower to such company(ies) or may have any other potential conflict of interests with respect to any recommendation and other related information and opinions. HSL, its directors, analysts or employees do not take any responsibility, financial or otherwise, of the losses or the damages sustained due to the investments made or any action taken on basis of this report, including but not restricted to, fluctuation in the prices of shares and bonds, changes in the currency rates, diminution in the NAVs, reduction in the dividend or income, etc. HSL and other group companies, its directors, associates, employees may have various positions in any of the stocks, securities and financial instruments dealt in the report, or may make sell or purchase or other deals in these securities from time to time or may deal in other securities of the companies / organizations described in this report. HSL or its associates might have managed or co-managed public offering of securities for the subject company or might have been mandated by the subject company for any other assignment in the past twelve months. HSL or its associates might have received any compensation from the companies mentioned in the report during the period preceding twelve months from t date of this report for services in respect of managing or co-managing public offerings, corporate finance, investment banking or merchant banking, brokerage services or other advisory service in a merger or specific transaction in the normal course of business. HSL or its analysts did not receive any compensation or other benefits from the companies mentioned in the report or third party in connection with preparation of the research report. Accordingly, neither HSL nor Research Analysts have any material conflict of interest at the time of publication of this report. Compensation of our Research Analysts is not based on any specific merchant banking, investment banking or brokerage service transactions. HSL may have issued other reports that are inconsistent with and reach different conclusion from the information presented in this report. Research entity has not been engaged in market making activity for the subject company. Research analyst has not served as an officer, director or employee of the subject company. We have not received any compensation/benefits from the subject company or third party in connection with the Research Report. HDFC securities Limited, I Think Techno Campus, Building - B, "Alpha", Office Floor 8, Near Kanjurmarg Station, Opp. Crompton Greaves, Kanjurmarg (East), Mumbai 400 042 Phone: (022) 3075 3400 Fax: (022) 2496 5066 Compliance Officer: Binkle R. Oza Email: [email protected] Phone: (022) 3045 3600 HDFC Securities Limited, SEBI Reg. No.: NSE-INB/F/E 231109431, BSE-INB/F 011109437, AMFI Reg. No. ARN: 13549, PFRDA Reg. No. POP: 04102015, IRDA Corporate Agent License No.: HDF 2806925/HDF C000222657, SEBI Research Analyst Reg. No.: INH000002475, CIN - U67120MH2000PLC152193 Mutual Funds Investments are subject to market risk. Please read the offer and scheme related documents carefully before investing.
STRIDES SHASUN: COMPANY UPDATE
Page | 19
HDFC securities Institutional Equities Unit No. 1602, 16th Floor, Tower A, Peninsula Business Park, Senapati Bapat Marg, Lower Parel, Mumbai - 400 013 Board : +91-22-6171 7330 www.hdfcsec.com


![Strides Shasun to acquire a strategic stake in Generic Partners Holdings, Australia [Company Update]](https://img.pdfslide.us/doc/110x75/577ca5091a28abea748b5d5b/strides-shasun-to-acquire-a-strategic-stake-in-generic-partners-holdings-australia.jpg)


![Strides Shasun to acquire controlling stake in Universal Corporation, Kenya [Company Update]](https://img.pdfslide.us/doc/110x75/577ca5091a28abea748b5d5c/strides-shasun-to-acquire-controlling-stake-in-universal-corporation-kenya.jpg)