Embed Size (px)
DESCRIPTION
Buy Locally, Eat Globally. MARÍA JOSÉ SEVILLA Director, Foods & Wines from Spain Economic & Commercial Office London. Index. Spain & the UK; a long standing trading relationship Total market value UK Ranking export sectors Imports Evolution 1972 - 1992 1992 - 2010 2010… - PowerPoint PPT Presentation
Citation preview
Buy Locally,Eat Globally
MARÍA JOSÉ SEVILLADirector, Foods & Wines from Spain
Economic & Commercial Office London
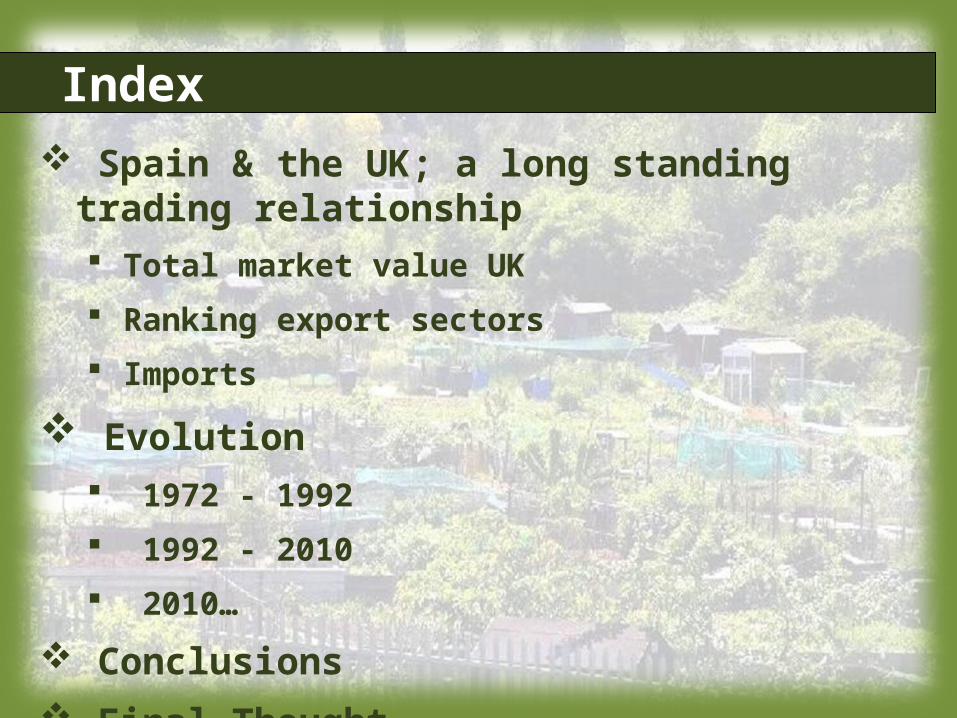
Spain & the UK; a long standing trading relationship Total market value UK
Ranking export sectors
Imports
Evolution 1972 - 1992
1992 - 2010
2010…
Conclusions Final Thought
Index
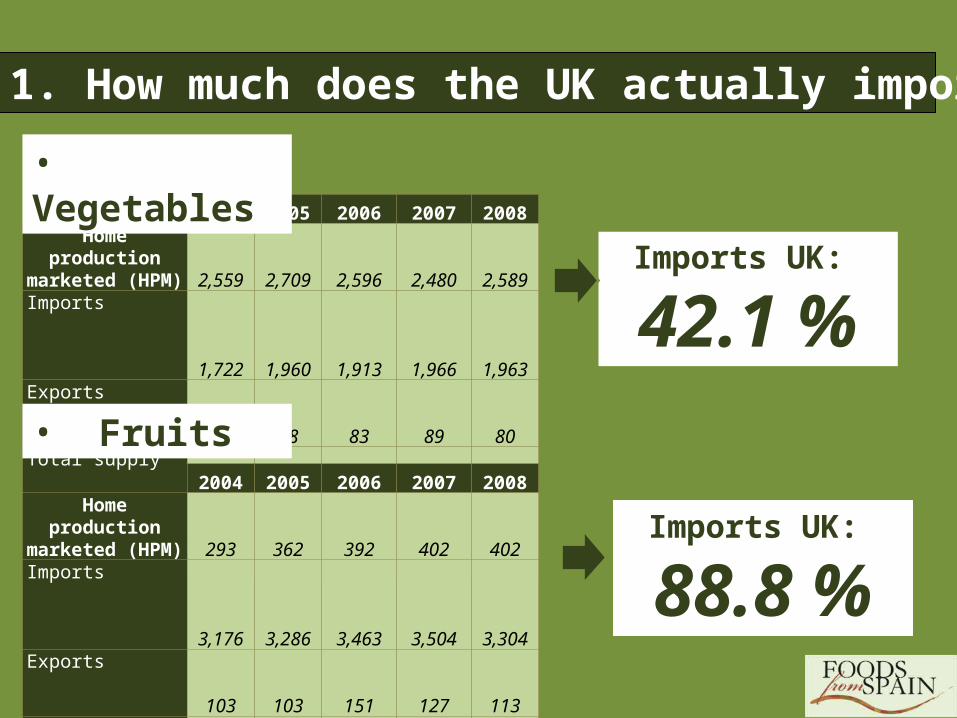
2004 2005 2006 2007 2008Home production marketed (HPM) 2,559 2,709 2,596 2,480 2,589
Imports 1,722 1,960 1,913 1,966 1,963
Exports 92 88 83 89 80
Total supply 4,188 4,581 4,427 4,357 4,472
HPM/Total supply 61.1 59.1 58.7 56.9 57.9
• Vegetables
Imports UK:
42.1 %
1. How much does the UK actually import?
• Fruits2004 2005 2006 2007 2008
Home production marketed (HPM) 293 362 392 402 402
Imports 3,176 3,286 3,463 3,504 3,304
Exports 103 103 151 127 113
Total supply 3,366 3,545 3,704 3,780 3,593
HPM/Total supply 8.7 10.2 10.6 10.7 11.2Source: Defra
Imports UK:
88.8 %
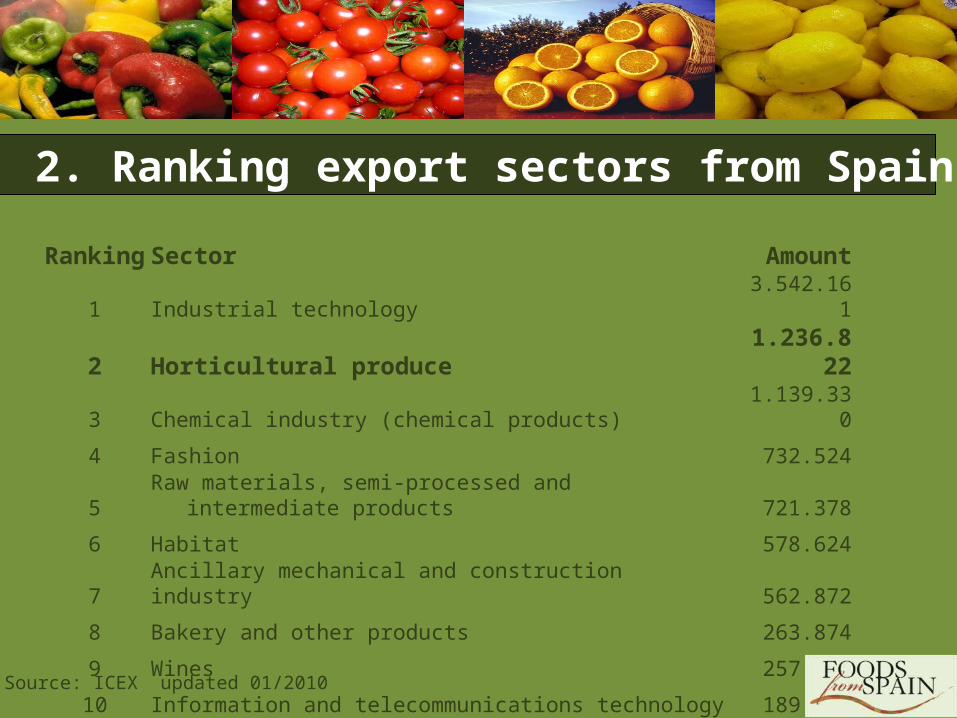
Ranking Sector Amount
1 Industrial technology 3.542.161
2 Horticultural produce 1.236.822
3 Chemical industry (chemical products) 1.139.330
4 Fashion 732.524
5 Raw materials, semi-processed and intermediate products 721.378
6 Habitat 578.624
7 Ancillary mechanical and construction industry 562.872
8 Bakery and other products 263.874
9 Wines 257.277
10 Information and telecommunications technology 189.613
Source: ICEX updated 01/2010
2. Ranking export sectors from Spain to the UK
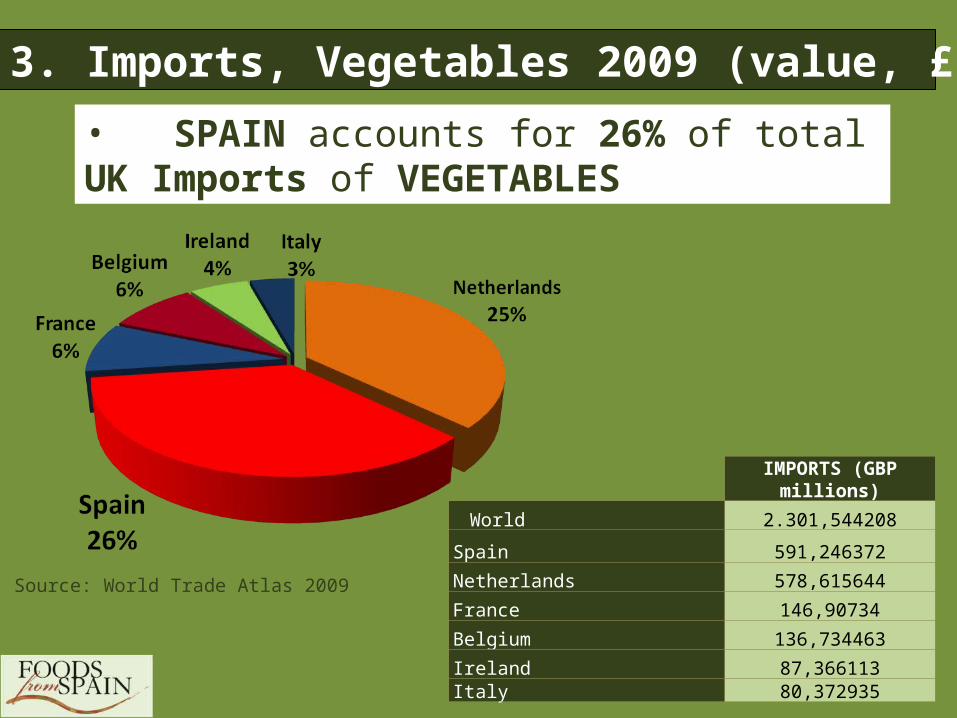
• SPAIN accounts for 26% of total UK Imports of VEGETABLES
Source: World Trade Atlas 2009
IMPORTS (GBP millions)
World 2.301,544208
Spain 591,246372
Netherlands 578,615644
France 146,90734
Belgium 136,734463
Ireland 87,366113Italy 80,372935
3. Imports, Vegetables 2009 (value, £)
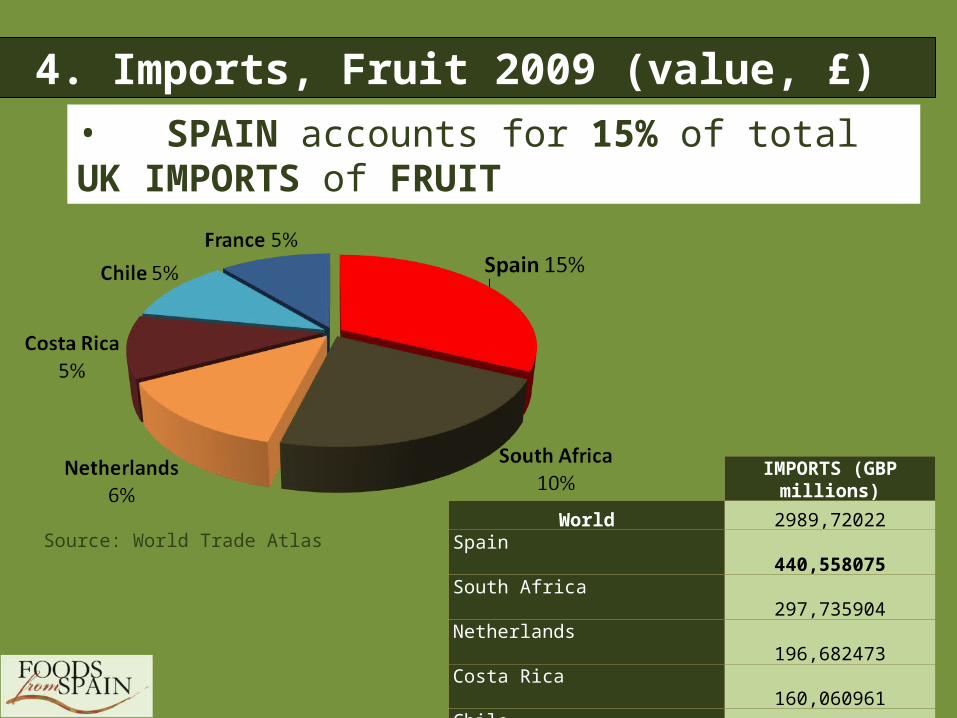
• SPAIN accounts for 15% of total UK IMPORTS of FRUIT
IMPORTS (GBP millions)
World 2989,72022Spain
440,558075South Africa
297,735904Netherlands
196,682473Costa Rica
160,060961Chile 159,69453France
150,708459
Source: World Trade Atlas
4. Imports, Fruit 2009 (value, £)
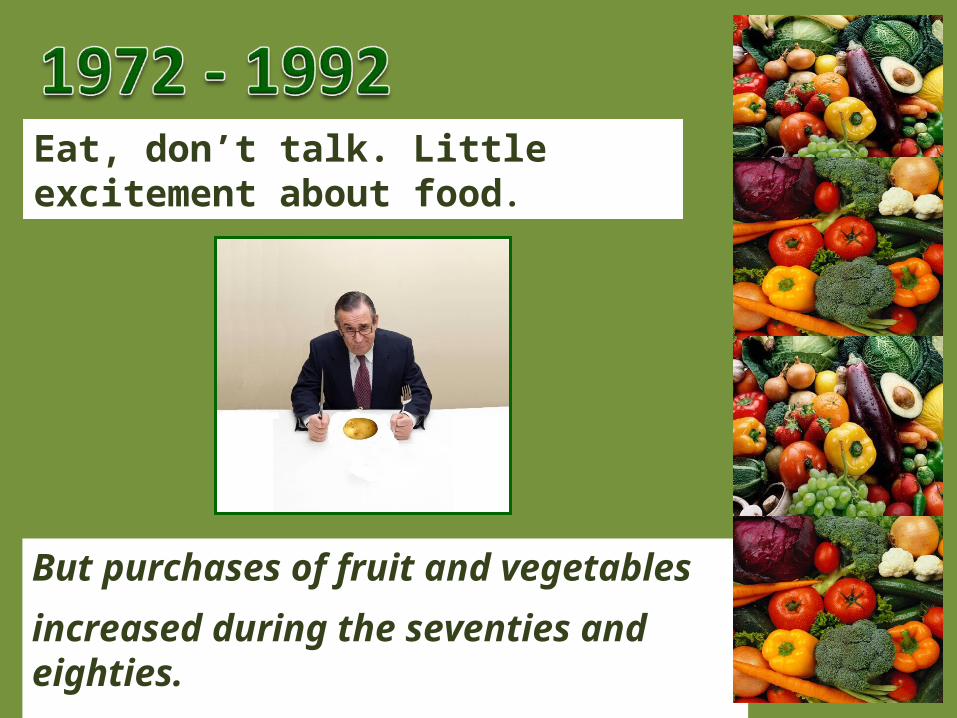
But purchases of fruit and vegetables
increased during the seventies and eighties.
Eat, don’t talk. Little excitement about food.
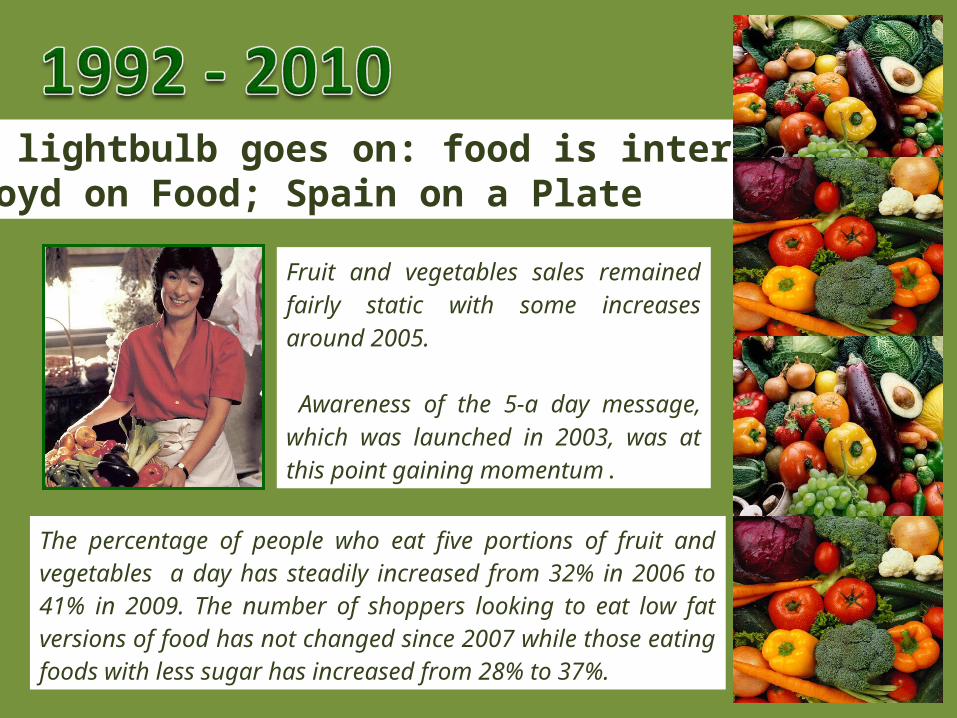
Fruit and vegetables sales remained fairly static with some increases around 2005.
Awareness of the 5-a day message, which was launched in 2003, was at this point gaining momentum.
The percentage of people who eat five portions of fruit and vegetables a day has steadily increased from 32% in 2006 to 41% in 2009. The number of shoppers looking to eat low fat versions of food has not changed since 2007 while those eating foods with less sugar has increased from 28% to 37%.
The lightbulb goes on: food is interesting! Floyd on Food; Spain on a Plate
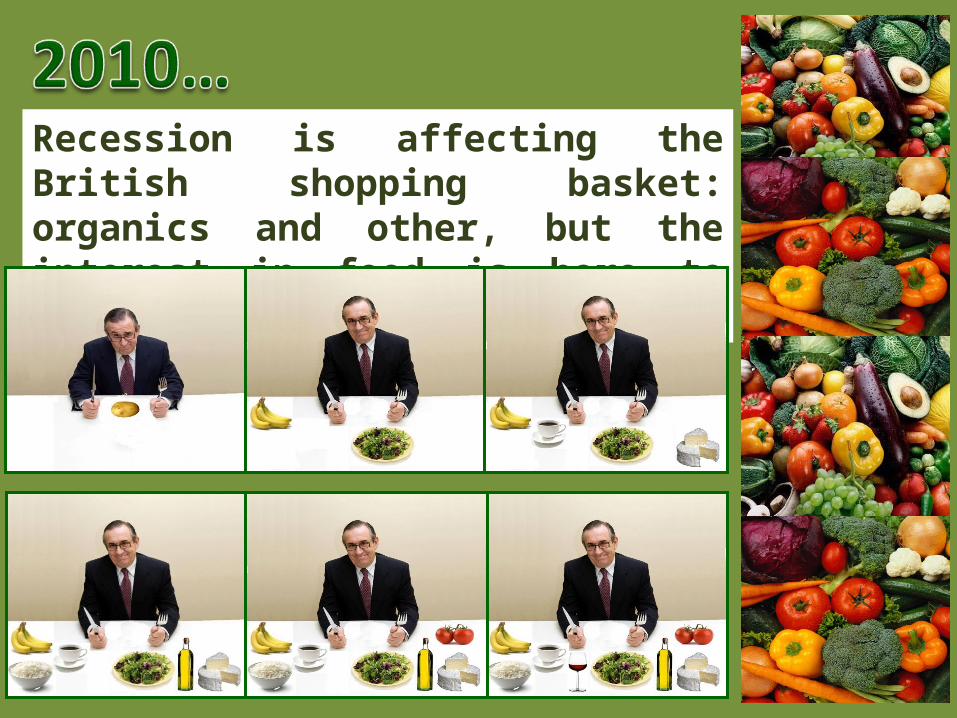
Recession is affecting the British shopping basket: organics and other, but the interest in food is here to stay.
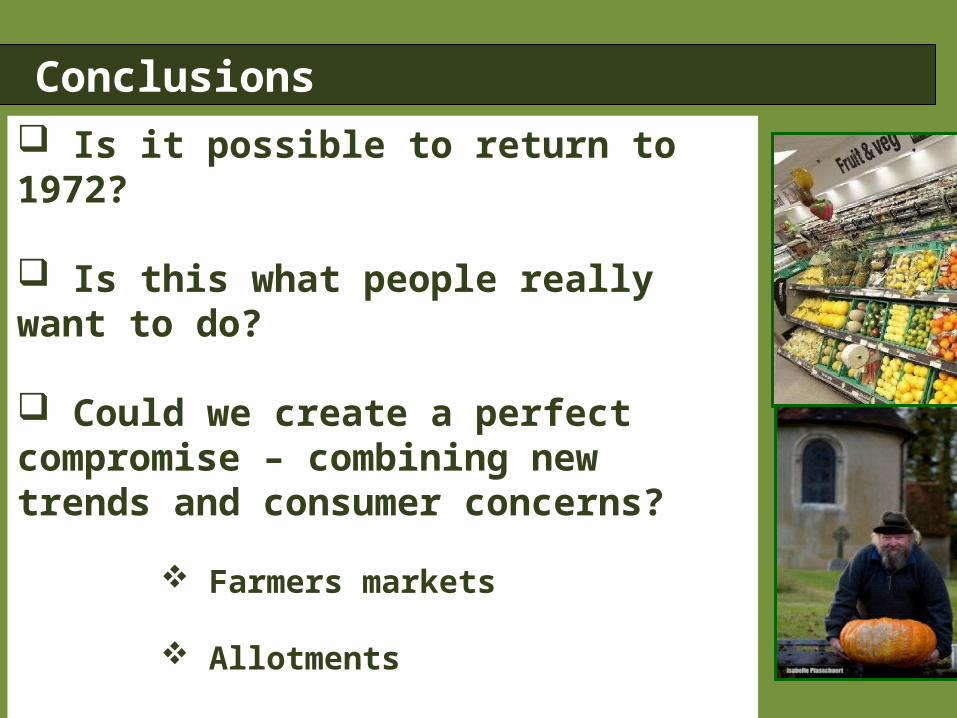
Is it possible to return to 1972?
Is this what people really want to do?
Could we create a perfect compromise – combining new trends and consumer concerns?
Farmers markets
Allotments
Supermarkets et al
Conclusions

The 2007 Foresight Report forecast dramatic increases in obesity levels over coming years, predicting that half of all adults and around a quarter of all children will be classified obese by 2050.
Final thought
Isn’t this what we should be addressing?
Shouldn’t the increase of fresh and vegetable consumption by all - especially children - be our priority?
The 2007 Foresight Report forecast dramatic increases in obesity levels over coming years, predicting that half of all adults and around a quarter of all children will be classified obese by 2050.
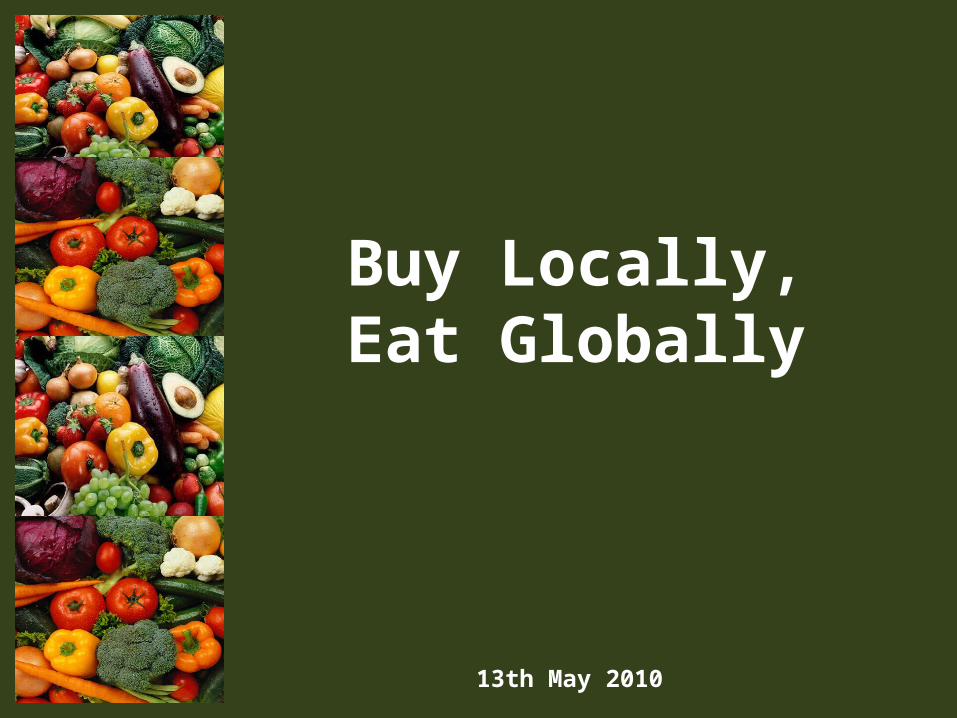
Buy Locally,Eat Globally
13th May 2010