Embed Size (px)
Citation preview
RESULTS REVIEW 4QFY18 03 MAY 2018
Marico BUY
HDFC securities Institutional Research is also available on Bloomberg HSLB <GO>& Thomson Reuters
Light at the end of the tunnel Marico’s revenues grew by 13% YoY to Rs 14.8bn (in-line). EBITDA margin dip was more than expected due to higher gross margin pressure. EBITDA/PAT increased by (2)/4% vs. expectation of 4/10% respectively. Domestic business (78% of total) posted healthy 12% growth, volume was up by mere 1%. Consistent price hike on Parachute and high base (15% in 4QFY17) impacted volumes. International business posted healthy 16% cc growth led by strong 17% cc growth in Bangladesh and 61% in MENA. Copra inflation has been impacting gross margins (down 550/500bps YoY in 4QFY18/FY18) and we believe the worst is now behind. Softening in Copra prices would result in GM expansion, since Marico cuts Parachute prices judiciously to restore margins. Historically, this trend has been visible wherein GM has expanded by ~450bps between 2QFY16-3QFY17 vs. a decline of ~450bps between 2QFY14-3QFY15. In the current copra inflation cycle, GM has declined by ~450bps between 4QFY17-4QFY18. With a fall in copra prices, we model GM expansion of 300bps (conservative) during 2QFY19-4QFY20E.
We also bake in aggressive A&P spends of 20% growth in FY19-20 to support new launches. We anticipate EBITDA margin expansion of ~200bps in FY19-20E. With a recovery in margins, stabilizing trade channels and improving international biz we expect revenue/EBITDA/APAT CAGR of 15/27/30% over FY18-FY20E. We value Marico based on P/E of 35x Mar-20, and arrive at a TP of Rs 376. Maintain BUY. Highlights for the quarter Price led domestic growth: Value/Vol growth during
4QFY18 for Parachute oil 24/-5%, VAHO 9/11% and Saffola oil -3/-1%. Parachute price hike of 21% to pass on copra inflation has impacted volume. Saffola was impacted due to sluggishness in the super-premium edible oils. Rural/urban grew 12/5% in value term.
EBITDA declines by 2%: Gradual price hike on Parachute in high copra inflation has continued to impact GM. ASP and other expenses (% of sales) declined by 55bps and 186bps. Hence, EBITDA margin was down by 263bps YoY to 17% (our expectation 18%).
Neat-term outlook: Marico underperformed the Nifty FMCG Index by 18% in 1 year. Softening copra prices would result in healthy earnings in the coming quarters.
Financial Summary (Rs mn) 4QFY18 4QFY17 YoY (%) 3QFY18 QoQ (%) FY16 FY17 FY18 FY19E FY20E Net Sales 14,801 13,146 12.6 16,243 (8.9) 60,173 59,049 63,222 73,120 83,589 EBITDA 2,523 2,586 (2.5) 3,020 (16.5) 10,514 11,464 11,377 14,244 18,275 PAT 1,832 1,709 7.2 2,206 (17.0) 7,233 7,959 8,248 10,605 13,853 Diluted EPS (Rs) 1.42 1.32 7.2 1.71 (17.0) 5.61 6.17 6.39 8.22 10.73 P/E (x) 55.7 50.6 48.8 38.0 29.1 EV / EBITDA (x) 38.1 35.1 35.4 28.0 21.7 Core RoCE (%) 44.7 48.4 41.5 51.7 70.0 Source: Company, HDFC sec Inst Research
INDUSTRY FMCG
CMP (as on 3 May 2018) Rs 312
Target Price Rs 376
Nifty 10,680 Sensex 35,103
KEY STOCK DATA Bloomberg MRCO IN No. of Shares (mn) 1,291 MCap (Rs bn)/(US$ mn) 403/6,044
6m avg traded value (Rs mn) 368
STOCK PERFORMANCE (%) 52 Week high / low Rs 349 / 284 3M 6M 12M
Absolute (%) 2.5 (0.1) (0.9) Relative (%) 2.4 (4.3) (18.4)
SHAREHOLDING PATTERN (%) Promoters 59.71
FIs & Local MFs 5.86 FPIs 27.76 Public & Others 6.67 Source : BSE
Naveen Trivedi [email protected] +91-22-6171-7324
Siddhant Chhabria [email protected] +91-22-6171-7336
MARICO : RESULTS REVIEW 4QFY18
Page | 2
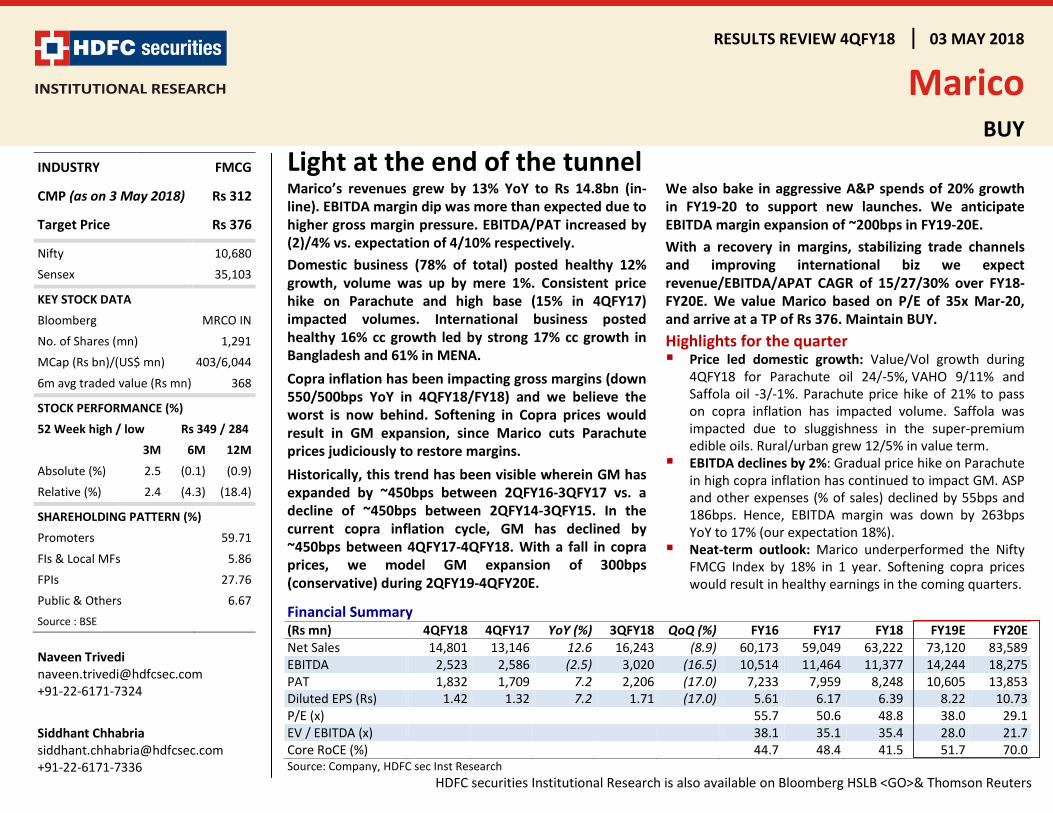
Quarterly Financials Year to March (Rs mn) 4QFY18 4QFY17 YoY (%) 3QFY18 QoQ (%) FY18 FY17 YoY (%) Net Revenue 14,801 13,146 12.6 16,243 (8.9) 63,222 59,049 7.1 Material Expenses 7,896 6,289 25.6 8,688 (9.1) 33,510 28,310 18.4 Employee Expenses 1,035 981 5.4 1,026 0.8 4,222 4,042 4.5 A&P Expenses 1,175 1,116 5.3 1,439 (18.4) 5,828 6,579 (11.4) Other Expenses 2,172 2,174 (0.1) 2,070 5.0 8,285 8,655 (4.3) EBITDA 2,523 2,586 (2.5) 3,020 (16.5) 11,377 11,464 (0.8) Depreciation 231 265 (12.9) 213 8.3 891 899 (1.0) EBIT 2,292 2,321 (1.3) 2,807 (18.4) 10,486 10,565 (0.7) Other Income 229 223 2.7 174 31.4 846 972 (13.0) Interest Cost 53 47 11.6 39 36.3 162 166 (2.3) PBT 2,468 2,497 (1.2) 2,942 (16.1) 11,171 11,371 (1.8) Tax 642 784 (18.0) 709 (9.4) 2,896 3,377 (14.3) PAT 1,832 1,709 7.2 2,206 (17.0) 8,248 7,959 3.6 EPS 1.4 1.3 7.2 1.7 (17.0) 6.4 6.2 3.6
As % Of Net Revenue 4QFY18 4QFY17 YoY (bps) 3QFY18 QoQ (bps) FY18 FY17 YoY (bps)
Material Expenses (% of Net Sales) 53.4 47.8 551 53.5 (13) 52.2 47.9 422 Employee Expenses (% of Net Sales) 7.0 7.5 (47) 6.3 67 7.0 6.8 19 A&P Expenses (% of Net Sales) 7.9 8.5 (55) 8.9 (92) 12.0 11.1 86 Other Expenses (% of Net Sales) 14.7 16.5 (186) 12.7 194 10.8 14.7 (384) EBITDA Margin (%) 17.0 19.7 (263) 18.6 (155) 18.0 19.4 (142) Tax Rate (%) 26.0 31.4 (536) 24.1 194 25.9 29.7 (378) APAT Margin (%) 12.4 13.0 (62) 13.6 (120) 13.0 13.5 (43) Source: Company, HDFC sec Inst Research
Consolidated revenues in 4QFY18 grew by 12% (in-line) driven by 12% and 13% in India and International business respectively Copra inflation during 4QFY18 was up 61% YoY and 6% QoQ. The mgt has taken insufficient price hikes (~21% in FY18) as a result gross margins were down 551bps
MARICO : RESULTS REVIEW 4QFY18
Page | 3
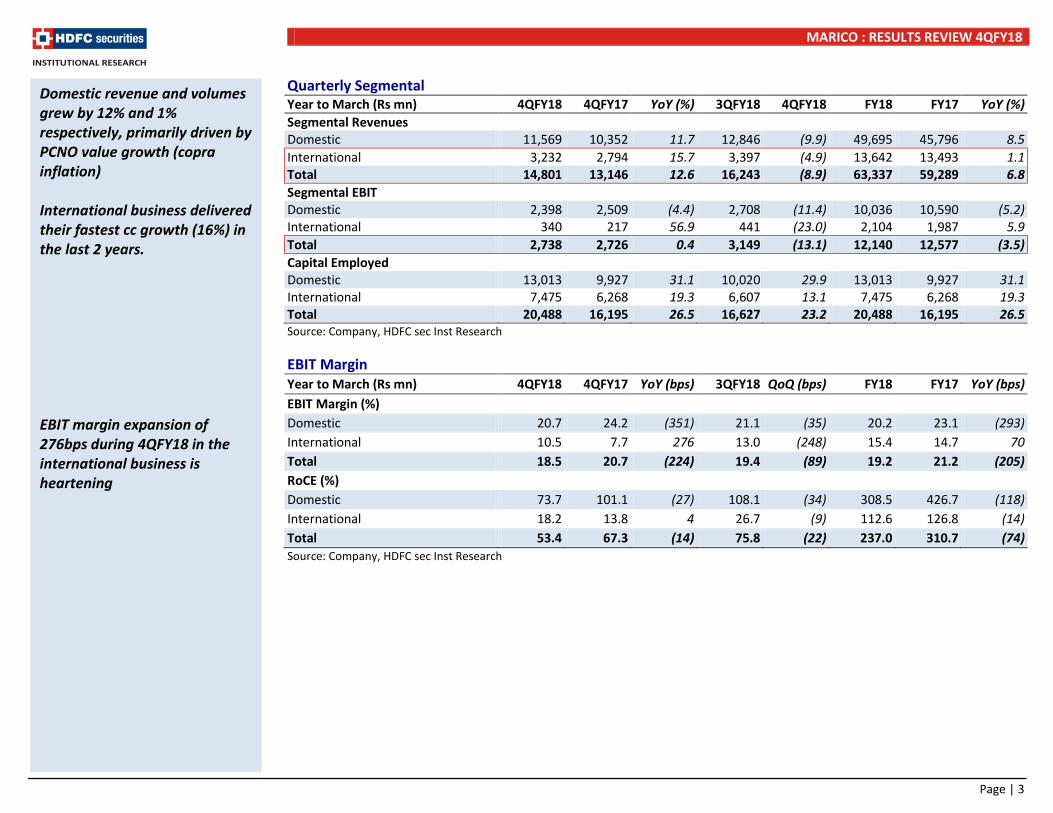
Quarterly Segmental Year to March (Rs mn) 4QFY18 4QFY17 YoY (%) 3QFY18 4QFY18 FY18 FY17 YoY (%) Segmental Revenues Domestic 11,569 10,352 11.7 12,846 (9.9) 49,695 45,796 8.5 International 3,232 2,794 15.7 3,397 (4.9) 13,642 13,493 1.1 Total 14,801 13,146 12.6 16,243 (8.9) 63,337 59,289 6.8 Segmental EBIT Domestic 2,398 2,509 (4.4) 2,708 (11.4) 10,036 10,590 (5.2) International 340 217 56.9 441 (23.0) 2,104 1,987 5.9 Total 2,738 2,726 0.4 3,149 (13.1) 12,140 12,577 (3.5) Capital Employed Domestic 13,013 9,927 31.1 10,020 29.9 13,013 9,927 31.1 International 7,475 6,268 19.3 6,607 13.1 7,475 6,268 19.3 Total 20,488 16,195 26.5 16,627 23.2 20,488 16,195 26.5 Source: Company, HDFC sec Inst Research EBIT Margin Year to March (Rs mn) 4QFY18 4QFY17 YoY (bps) 3QFY18 QoQ (bps) FY18 FY17 YoY (bps) EBIT Margin (%) Domestic 20.7 24.2 (351) 21.1 (35) 20.2 23.1 (293) International 10.5 7.7 276 13.0 (248) 15.4 14.7 70 Total 18.5 20.7 (224) 19.4 (89) 19.2 21.2 (205) RoCE (%) Domestic 73.7 101.1 (27) 108.1 (34) 308.5 426.7 (118) International 18.2 13.8 4 26.7 (9) 112.6 126.8 (14) Total 53.4 67.3 (14) 75.8 (22) 237.0 310.7 (74) Source: Company, HDFC sec Inst Research
Domestic revenue and volumes grew by 12% and 1% respectively, primarily driven by PCNO value growth (copra inflation) International business delivered their fastest cc growth (16%) in the last 2 years. EBIT margin expansion of 276bps during 4QFY18 in the international business is heartening
MARICO : RESULTS REVIEW 4QFY18
Page | 4
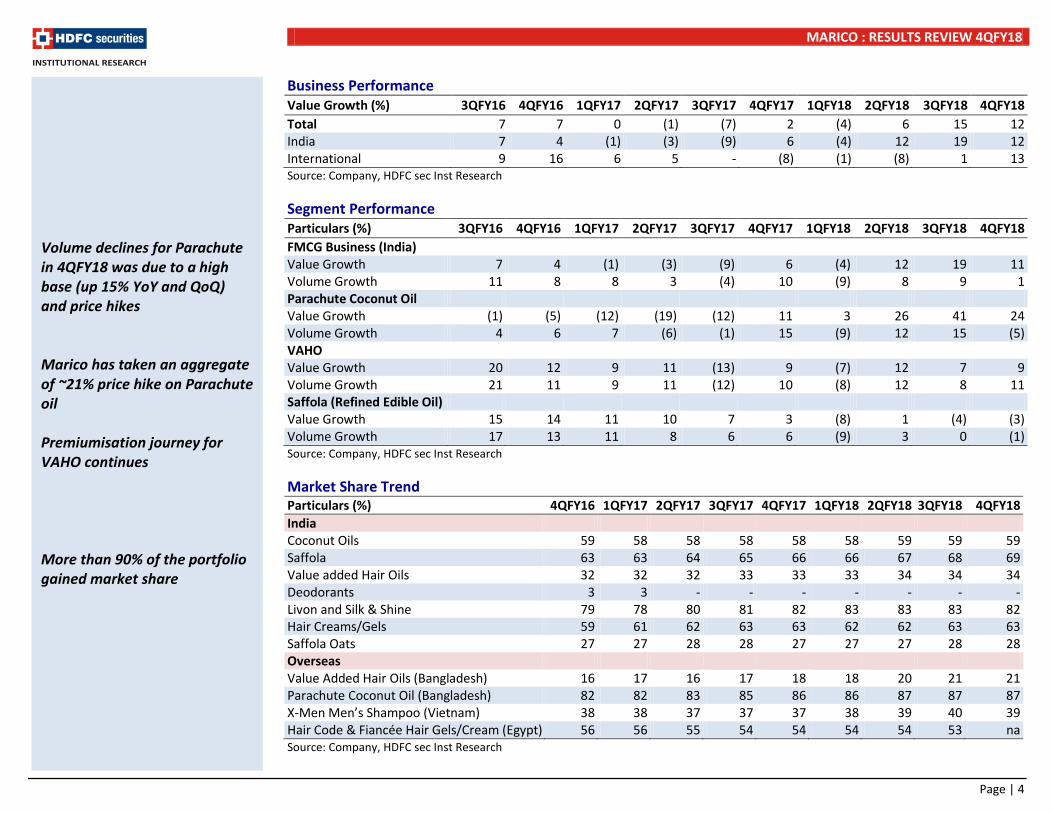
Business Performance Value Growth (%) 3QFY16 4QFY16 1QFY17 2QFY17 3QFY17 4QFY17 1QFY18 2QFY18 3QFY18 4QFY18 Total 7 7 0 (1) (7) 2 (4) 6 15 12 India 7 4 (1) (3) (9) 6 (4) 12 19 12 International 9 16 6 5 - (8) (1) (8) 1 13 Source: Company, HDFC sec Inst Research Segment Performance Particulars (%) 3QFY16 4QFY16 1QFY17 2QFY17 3QFY17 4QFY17 1QFY18 2QFY18 3QFY18 4QFY18 FMCG Business (India) Value Growth 7 4 (1) (3) (9) 6 (4) 12 19 11 Volume Growth 11 8 8 3 (4) 10 (9) 8 9 1 Parachute Coconut Oil Value Growth (1) (5) (12) (19) (12) 11 3 26 41 24 Volume Growth 4 6 7 (6) (1) 15 (9) 12 15 (5) VAHO Value Growth 20 12 9 11 (13) 9 (7) 12 7 9 Volume Growth 21 11 9 11 (12) 10 (8) 12 8 11 Saffola (Refined Edible Oil) Value Growth 15 14 11 10 7 3 (8) 1 (4) (3) Volume Growth 17 13 11 8 6 6 (9) 3 0 (1) Source: Company, HDFC sec Inst Research Market Share Trend Particulars (%) 4QFY16 1QFY17 2QFY17 3QFY17 4QFY17 1QFY18 2QFY18 3QFY18 4QFY18 India Coconut Oils 59 58 58 58 58 58 59 59 59 Saffola 63 63 64 65 66 66 67 68 69 Value added Hair Oils 32 32 32 33 33 33 34 34 34 Deodorants 3 3 - - - - - - - Livon and Silk & Shine 79 78 80 81 82 83 83 83 82 Hair Creams/Gels 59 61 62 63 63 62 62 63 63 Saffola Oats 27 27 28 28 27 27 27 28 28 Overseas Value Added Hair Oils (Bangladesh) 16 17 16 17 18 18 20 21 21 Parachute Coconut Oil (Bangladesh) 82 82 83 85 86 86 87 87 87 X-Men Men’s Shampoo (Vietnam) 38 38 37 37 37 38 39 40 39 Hair Code & Fiancée Hair Gels/Cream (Egypt) 56 56 55 54 54 54 54 53 na Source: Company, HDFC sec Inst Research
Volume declines for Parachute in 4QFY18 was due to a high base (up 15% YoY and QoQ) and price hikes Marico has taken an aggregate of ~21% price hike on Parachute oil Premiumisation journey for VAHO continues More than 90% of the portfolio gained market share
MARICO : RESULTS REVIEW 4QFY18
Page | 5
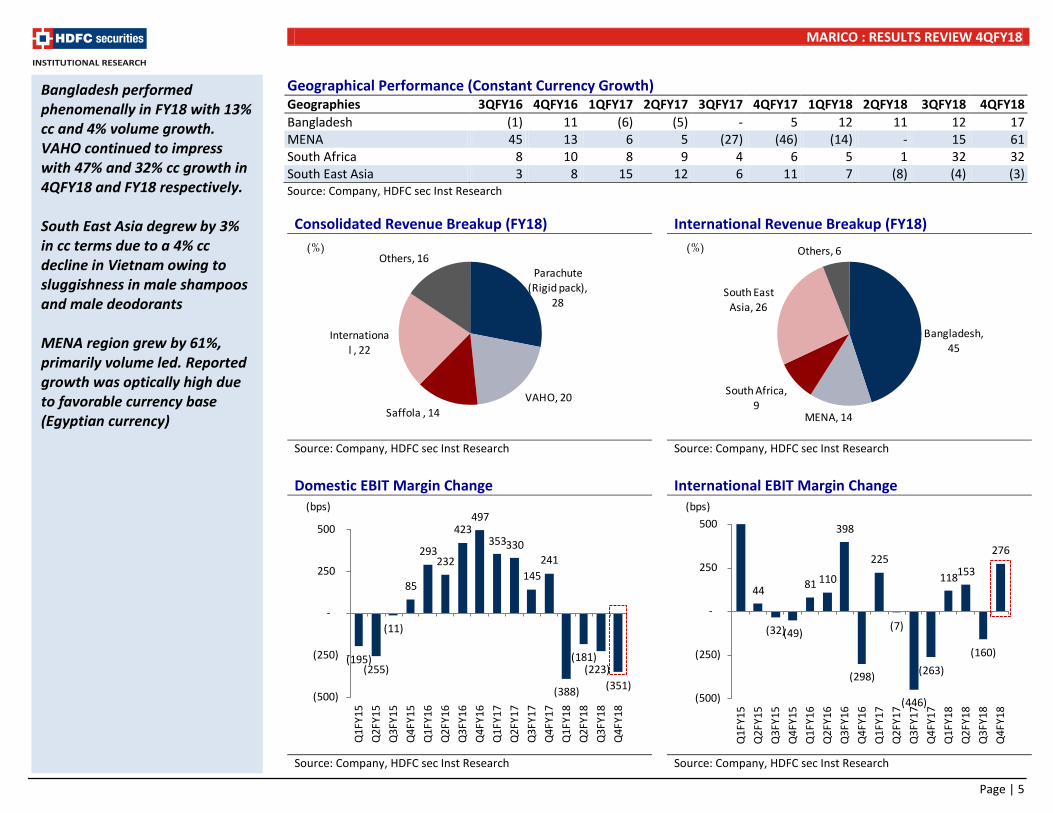
Geographical Performance (Constant Currency Growth) Geographies 3QFY16 4QFY16 1QFY17 2QFY17 3QFY17 4QFY17 1QFY18 2QFY18 3QFY18 4QFY18 Bangladesh (1) 11 (6) (5) - 5 12 11 12 17 MENA 45 13 6 5 (27) (46) (14) - 15 61 South Africa 8 10 8 9 4 6 5 1 32 32 South East Asia 3 8 15 12 6 11 7 (8) (4) (3) Source: Company, HDFC sec Inst Research Consolidated Revenue Breakup (FY18) International Revenue Breakup (FY18)
Source: Company, HDFC sec Inst Research Source: Company, HDFC sec Inst Research Domestic EBIT Margin Change International EBIT Margin Change
Source: Company, HDFC sec Inst Research Source: Company, HDFC sec Inst Research
Bangladesh performed phenomenally in FY18 with 13% cc and 4% volume growth. VAHO continued to impress with 47% and 32% cc growth in 4QFY18 and FY18 respectively. South East Asia degrew by 3% in cc terms due to a 4% cc decline in Vietnam owing to sluggishness in male shampoos and male deodorants MENA region grew by 61%, primarily volume led. Reported growth was optically high due to favorable currency base (Egyptian currency)
Parachute (Rigid pack),
28
VAHO, 20Saffola , 14
International , 22
Others, 16(%)
Bangladesh, 45
MENA, 14
South Africa, 9
South East Asia, 26
Others, 6(%)
(195)(255)
(11)
85
293 232
423 497
353 330
145 241
(388)
(181)(223)
(351)(500)
(250)
-
250
500
Q1F
Y15
Q2F
Y15
Q3F
Y15
Q4F
Y15
Q1F
Y16
Q2F
Y16
Q3F
Y16
Q4F
Y16
Q1F
Y17
Q2F
Y17
Q3F
Y17
Q4F
Y17
Q1F
Y18
Q2F
Y18
Q3F
Y18
Q4F
Y18
(bps)
44
(32)(49)
81 110
398
(298)
225
(7)
(446)
(263)
118 153
(160)
276
(500)
(250)
-
250
500
Q1F
Y15
Q2F
Y15
Q3F
Y15
Q4F
Y15
Q1F
Y16
Q2F
Y16
Q3F
Y16
Q4F
Y16
Q1F
Y17
Q2F
Y17
Q3F
Y17
Q4F
Y17
Q1F
Y18
Q2F
Y18
Q3F
Y18
Q4F
Y18
(bps)
MARICO : RESULTS REVIEW 4QFY18
Page | 6
Urban Growth (YoY) Rural Growth (YoY)
Source: Company, HDFC sec Inst Research Source: Company, HDFC sec Inst Research Modern Trade Growth (YoY) CSD Growth (YoY)
Source: Company, HDFC sec Inst Research Source: Company, HDFC sec Inst Research
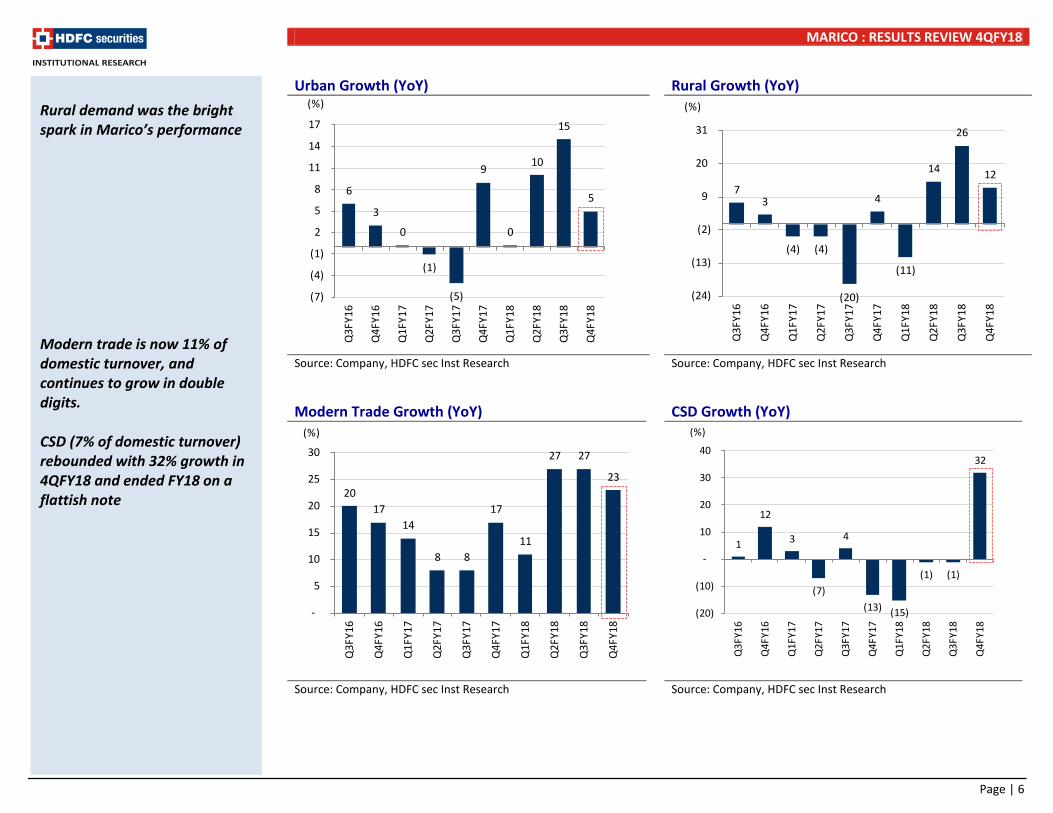
Rural demand was the bright spark in Marico’s performance Modern trade is now 11% of domestic turnover, and continues to grow in double digits. CSD (7% of domestic turnover) rebounded with 32% growth in 4QFY18 and ended FY18 on a flattish note
6
3
0
(1)
(5)
9
0
10
15
5
(7)
(4)
(1)
2
5
8
11
14
17
Q3F
Y16
Q4F
Y16
Q1F
Y17
Q2F
Y17
Q3F
Y17
Q4F
Y17
Q1F
Y18
Q2F
Y18
Q3F
Y18
Q4F
Y18
(%)
7 3
(4) (4)
(20)
4
(11)
14
26
12
(24)
(13)
(2)
9
20
31
Q3F
Y16
Q4F
Y16
Q1F
Y17
Q2F
Y17
Q3F
Y17
Q4F
Y17
Q1F
Y18
Q2F
Y18
Q3F
Y18
Q4F
Y18
(%)
20 17
14
8 8
17
11
27 27
23
-
5
10
15
20
25
30
Q3F
Y16
Q4F
Y16
Q1F
Y17
Q2F
Y17
Q3F
Y17
Q4F
Y17
Q1F
Y18
Q2F
Y18
Q3F
Y18
Q4F
Y18
(%)
1
12
3
(7)
4
(13) (15)
(1) (1)
32
(20)
(10)
-
10
20
30
40
Q3F
Y16
Q4F
Y16
Q1F
Y17
Q2F
Y17
Q3F
Y17
Q4F
Y17
Q1F
Y18
Q2F
Y18
Q3F
Y18
Q4F
Y18
(%)
MARICO : RESULTS REVIEW 4QFY18
Page | 7
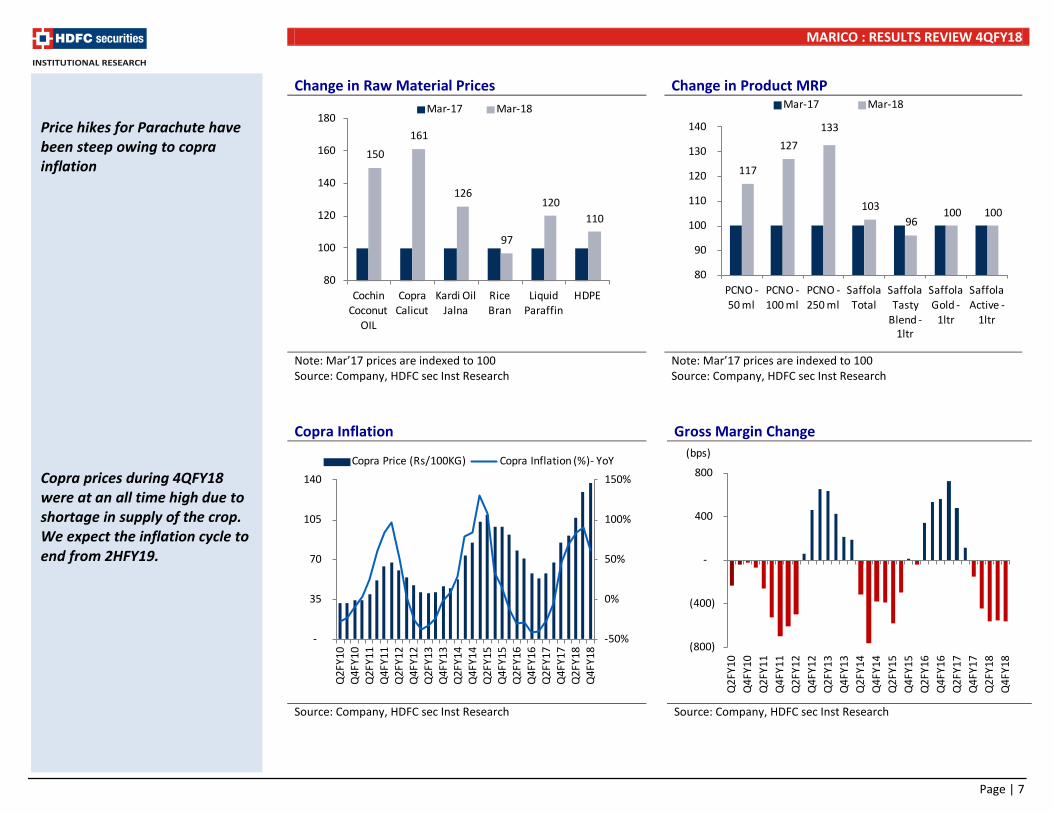
Change in Raw Material Prices Change in Product MRP
Note: Mar’17 prices are indexed to 100 Source: Company, HDFC sec Inst Research
Note: Mar’17 prices are indexed to 100 Source: Company, HDFC sec Inst Research
Copra Inflation Gross Margin Change
Source: Company, HDFC sec Inst Research Source: Company, HDFC sec Inst Research
Price hikes for Parachute have been steep owing to copra inflation Copra prices during 4QFY18 were at an all time high due to shortage in supply of the crop. We expect the inflation cycle to end from 2HFY19.
117
127 133
103 96
100 100
80
90
100
110
120
130
140
PCNO -50 ml
PCNO -100 ml
PCNO -250 ml
Saffola Total
Saffola Tasty
Blend -1ltr
Saffola Gold -
1ltr
Saffola Active -
1ltr
Mar-17 Mar-18
150 161
126
97
120 110
80
100
120
140
160
180
Cochin Coconut
OIL
Copra Calicut
Kardi Oil Jalna
Rice Bran
Liquid Paraffin
HDPE
Mar-17 Mar-18
-50%
0%
50%
100%
150%
-
35
70
105
140
Q2F
Y10
Q4F
Y10
Q2F
Y11
Q4F
Y11
Q2F
Y12
Q4F
Y12
Q2F
Y13
Q4F
Y13
Q2F
Y14
Q4F
Y14
Q2F
Y15
Q4F
Y15
Q2F
Y16
Q4F
Y16
Q2F
Y17
Q4F
Y17
Q2F
Y18
Q4F
Y18
Copra Price (Rs/100KG) Copra Inflation (%)- YoY
(800)
(400)
-
400
800
Q2F
Y10
Q4F
Y10
Q2F
Y11
Q4F
Y11
Q2F
Y12
Q4F
Y12
Q2F
Y13
Q4F
Y13
Q2F
Y14
Q4F
Y14
Q2F
Y15
Q4F
Y15
Q2F
Y16
Q4F
Y16
Q2F
Y17
Q4F
Y17
Q2F
Y18
Q4F
Y18
(bps)
MARICO : RESULTS REVIEW 4QFY18
Page | 8
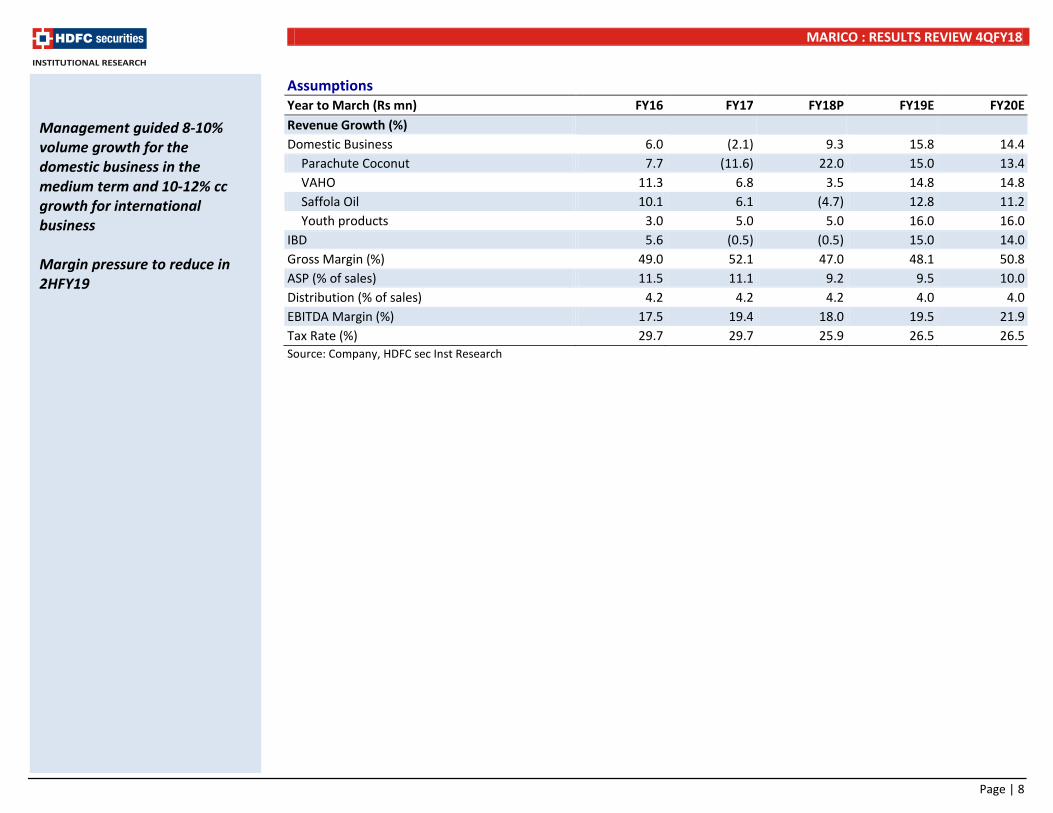
Assumptions Year to March (Rs mn) FY16 FY17 FY18P FY19E FY20E Revenue Growth (%) Domestic Business 6.0 (2.1) 9.3 15.8 14.4
Parachute Coconut 7.7 (11.6) 22.0 15.0 13.4 VAHO 11.3 6.8 3.5 14.8 14.8 Saffola Oil 10.1 6.1 (4.7) 12.8 11.2 Youth products 3.0 5.0 5.0 16.0 16.0
IBD 5.6 (0.5) (0.5) 15.0 14.0 Gross Margin (%) 49.0 52.1 47.0 48.1 50.8 ASP (% of sales) 11.5 11.1 9.2 9.5 10.0 Distribution (% of sales) 4.2 4.2 4.2 4.0 4.0 EBITDA Margin (%) 17.5 19.4 18.0 19.5 21.9 Tax Rate (%) 29.7 29.7 25.9 26.5 26.5 Source: Company, HDFC sec Inst Research
Management guided 8-10% volume growth for the domestic business in the medium term and 10-12% cc growth for international business Margin pressure to reduce in 2HFY19
MARICO : RESULTS REVIEW 4QFY18
Page | 9
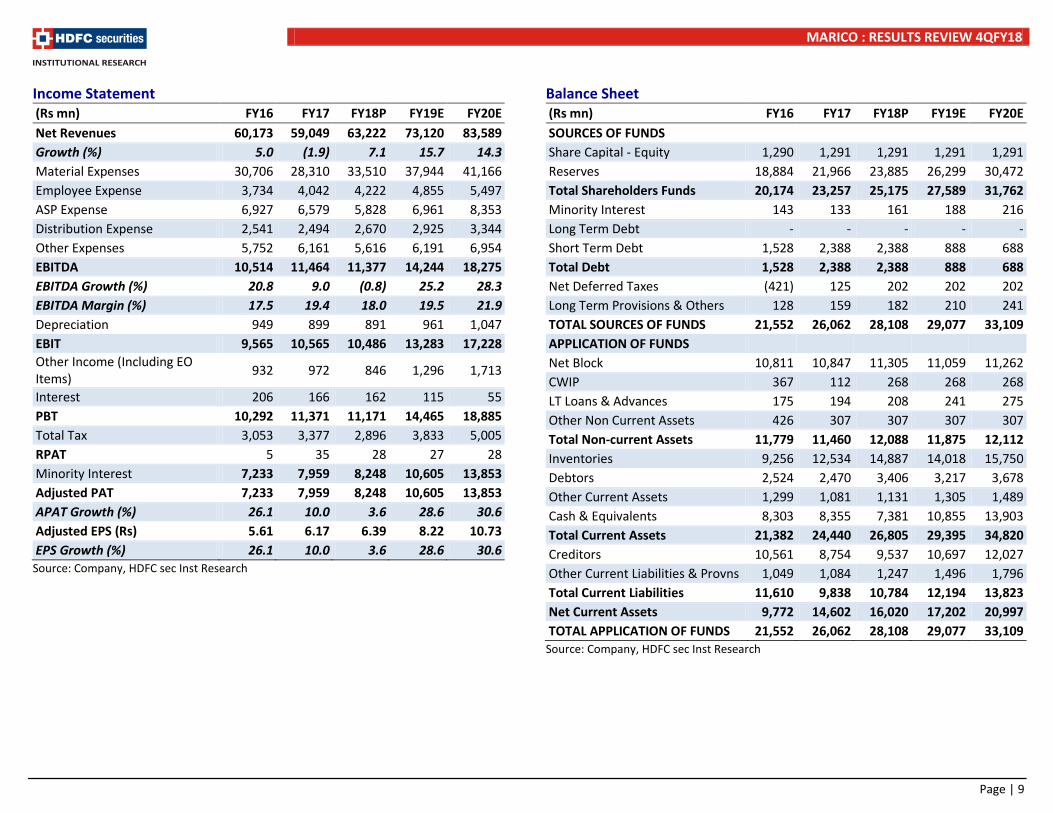
Income Statement (Rs mn) FY16 FY17 FY18P FY19E FY20E Net Revenues 60,173 59,049 63,222 73,120 83,589 Growth (%) 5.0 (1.9) 7.1 15.7 14.3 Material Expenses 30,706 28,310 33,510 37,944 41,166 Employee Expense 3,734 4,042 4,222 4,855 5,497 ASP Expense 6,927 6,579 5,828 6,961 8,353 Distribution Expense 2,541 2,494 2,670 2,925 3,344 Other Expenses 5,752 6,161 5,616 6,191 6,954 EBITDA 10,514 11,464 11,377 14,244 18,275 EBITDA Growth (%) 20.8 9.0 (0.8) 25.2 28.3 EBITDA Margin (%) 17.5 19.4 18.0 19.5 21.9 Depreciation 949 899 891 961 1,047 EBIT 9,565 10,565 10,486 13,283 17,228 Other Income (Including EO Items) 932 972 846 1,296 1,713
Interest 206 166 162 115 55 PBT 10,292 11,371 11,171 14,465 18,885 Total Tax 3,053 3,377 2,896 3,833 5,005 RPAT 5 35 28 27 28 Minority Interest 7,233 7,959 8,248 10,605 13,853 Adjusted PAT 7,233 7,959 8,248 10,605 13,853 APAT Growth (%) 26.1 10.0 3.6 28.6 30.6 Adjusted EPS (Rs) 5.61 6.17 6.39 8.22 10.73 EPS Growth (%) 26.1 10.0 3.6 28.6 30.6
Source: Company, HDFC sec Inst Research
Balance Sheet (Rs mn) FY16 FY17 FY18P FY19E FY20E SOURCES OF FUNDS Share Capital - Equity 1,290 1,291 1,291 1,291 1,291 Reserves 18,884 21,966 23,885 26,299 30,472 Total Shareholders Funds 20,174 23,257 25,175 27,589 31,762 Minority Interest 143 133 161 188 216 Long Term Debt - - - - - Short Term Debt 1,528 2,388 2,388 888 688 Total Debt 1,528 2,388 2,388 888 688 Net Deferred Taxes (421) 125 202 202 202 Long Term Provisions & Others 128 159 182 210 241 TOTAL SOURCES OF FUNDS 21,552 26,062 28,108 29,077 33,109 APPLICATION OF FUNDS Net Block 10,811 10,847 11,305 11,059 11,262 CWIP 367 112 268 268 268 LT Loans & Advances 175 194 208 241 275 Other Non Current Assets 426 307 307 307 307 Total Non-current Assets 11,779 11,460 12,088 11,875 12,112 Inventories 9,256 12,534 14,887 14,018 15,750 Debtors 2,524 2,470 3,406 3,217 3,678 Other Current Assets 1,299 1,081 1,131 1,305 1,489 Cash & Equivalents 8,303 8,355 7,381 10,855 13,903 Total Current Assets 21,382 24,440 26,805 29,395 34,820 Creditors 10,561 8,754 9,537 10,697 12,027 Other Current Liabilities & Provns 1,049 1,084 1,247 1,496 1,796 Total Current Liabilities 11,610 9,838 10,784 12,194 13,823 Net Current Assets 9,772 14,602 16,020 17,202 20,997 TOTAL APPLICATION OF FUNDS 21,552 26,062 28,108 29,077 33,109
Source: Company, HDFC sec Inst Research
MARICO : RESULTS REVIEW 4QFY18
Page | 10
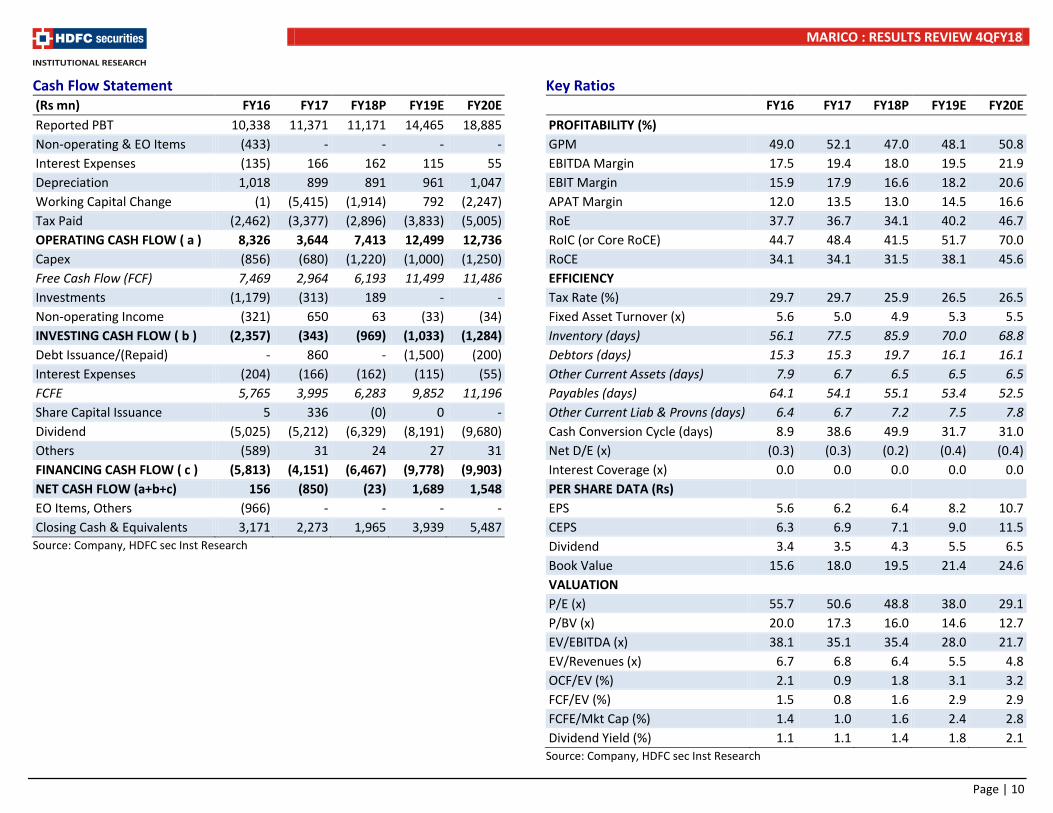
Cash Flow Statement (Rs mn) FY16 FY17 FY18P FY19E FY20E Reported PBT 10,338 11,371 11,171 14,465 18,885 Non-operating & EO Items (433) - - - - Interest Expenses (135) 166 162 115 55 Depreciation 1,018 899 891 961 1,047 Working Capital Change (1) (5,415) (1,914) 792 (2,247) Tax Paid (2,462) (3,377) (2,896) (3,833) (5,005) OPERATING CASH FLOW ( a ) 8,326 3,644 7,413 12,499 12,736 Capex (856) (680) (1,220) (1,000) (1,250) Free Cash Flow (FCF) 7,469 2,964 6,193 11,499 11,486 Investments (1,179) (313) 189 - - Non-operating Income (321) 650 63 (33) (34) INVESTING CASH FLOW ( b ) (2,357) (343) (969) (1,033) (1,284) Debt Issuance/(Repaid) - 860 - (1,500) (200) Interest Expenses (204) (166) (162) (115) (55) FCFE 5,765 3,995 6,283 9,852 11,196 Share Capital Issuance 5 336 (0) 0 - Dividend (5,025) (5,212) (6,329) (8,191) (9,680) Others (589) 31 24 27 31 FINANCING CASH FLOW ( c ) (5,813) (4,151) (6,467) (9,778) (9,903) NET CASH FLOW (a+b+c) 156 (850) (23) 1,689 1,548 EO Items, Others (966) - - - - Closing Cash & Equivalents 3,171 2,273 1,965 3,939 5,487
Source: Company, HDFC sec Inst Research
Key Ratios FY16 FY17 FY18P FY19E FY20E PROFITABILITY (%) GPM 49.0 52.1 47.0 48.1 50.8 EBITDA Margin 17.5 19.4 18.0 19.5 21.9 EBIT Margin 15.9 17.9 16.6 18.2 20.6 APAT Margin 12.0 13.5 13.0 14.5 16.6 RoE 37.7 36.7 34.1 40.2 46.7 RoIC (or Core RoCE) 44.7 48.4 41.5 51.7 70.0 RoCE 34.1 34.1 31.5 38.1 45.6 EFFICIENCY Tax Rate (%) 29.7 29.7 25.9 26.5 26.5 Fixed Asset Turnover (x) 5.6 5.0 4.9 5.3 5.5 Inventory (days) 56.1 77.5 85.9 70.0 68.8 Debtors (days) 15.3 15.3 19.7 16.1 16.1 Other Current Assets (days) 7.9 6.7 6.5 6.5 6.5 Payables (days) 64.1 54.1 55.1 53.4 52.5 Other Current Liab & Provns (days) 6.4 6.7 7.2 7.5 7.8 Cash Conversion Cycle (days) 8.9 38.6 49.9 31.7 31.0 Net D/E (x) (0.3) (0.3) (0.2) (0.4) (0.4) Interest Coverage (x) 0.0 0.0 0.0 0.0 0.0 PER SHARE DATA (Rs) EPS 5.6 6.2 6.4 8.2 10.7 CEPS 6.3 6.9 7.1 9.0 11.5 Dividend 3.4 3.5 4.3 5.5 6.5 Book Value 15.6 18.0 19.5 21.4 24.6 VALUATION P/E (x) 55.7 50.6 48.8 38.0 29.1 P/BV (x) 20.0 17.3 16.0 14.6 12.7 EV/EBITDA (x) 38.1 35.1 35.4 28.0 21.7 EV/Revenues (x) 6.7 6.8 6.4 5.5 4.8 OCF/EV (%) 2.1 0.9 1.8 3.1 3.2 FCF/EV (%) 1.5 0.8 1.6 2.9 2.9 FCFE/Mkt Cap (%) 1.4 1.0 1.6 2.4 2.8 Dividend Yield (%) 1.1 1.1 1.4 1.8 2.1
Source: Company, HDFC sec Inst Research
MARICO : RESULTS REVIEW 4QFY18
Page | 11
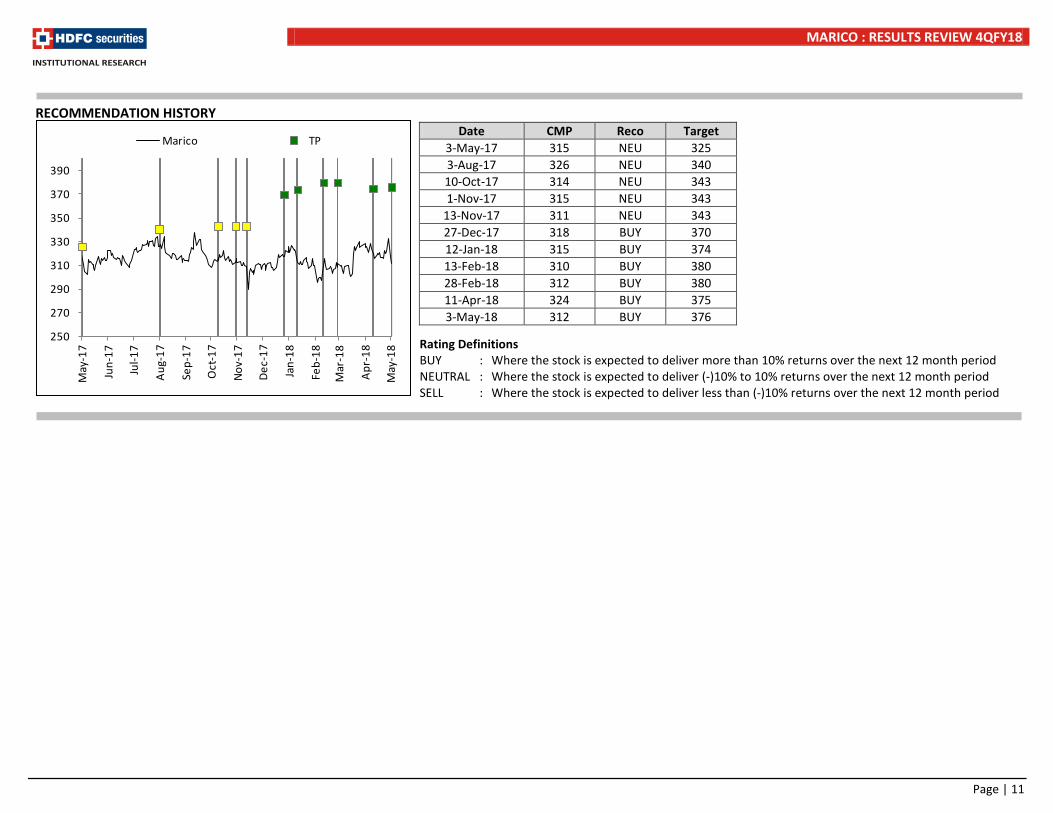
RECOMMENDATION HISTORY
Rating Definitions BUY : Where the stock is expected to deliver more than 10% returns over the next 12 month period NEUTRAL : Where the stock is expected to deliver (-)10% to 10% returns over the next 12 month period SELL : Where the stock is expected to deliver less than (-)10% returns over the next 12 month period
Date CMP Reco Target 3-May-17 315 NEU 325 3-Aug-17 326 NEU 340 10-Oct-17 314 NEU 343 1-Nov-17 315 NEU 343
13-Nov-17 311 NEU 343 27-Dec-17 318 BUY 370 12-Jan-18 315 BUY 374 13-Feb-18 310 BUY 380 28-Feb-18 312 BUY 380 11-Apr-18 324 BUY 375 3-May-18 312 BUY 376
250
270
290
310
330
350
370
390
May
-17
Jun-
17
Jul-1
7
Aug-
17
Sep-
17
Oct
-17
Nov-
17
Dec-
17
Jan-
18
Feb-
18
Mar
-18
Apr-
18
May
-18
Marico TP
MARICO : RESULTS REVIEW 4QFY18
Page | 12
Disclosure: We, Naveen Trivedi, MBA & Siddhant Chhabria, PGDBM, authors and the names subscribed to this report, hereby certify that all of the views expressed in this research report accurately reflect our views about the subject issuer(s) or securities. HSL has no material adverse disciplinary history as on the date of publication of this report. We also certify that no part of our compensation was, is, or will be directly or indirectly related to the specific recommendation(s) or view(s) in this report. Research Analyst or his/her relative or HDFC Securities Ltd. does not have any financial interest in the subject company. Also Research Analyst or his relative or HDFC Securities Ltd. or its Associate may have beneficial ownership of 1% or more in the subject company at the end of the month immediately preceding the date of publication of the Research Report. Further Research Analyst or his relative or HDFC Securities Ltd. or its associate does not have any material conflict of interest. Any holding in stock –No HDFC Securities Limited (HSL) is a SEBI Registered Research Analyst having registration no. INH000002475. Disclaimer: This report has been prepared by HDFC Securities Ltd and is meant for sole use by the recipient and not for circulation. The information and opinions contained herein have been compiled or arrived at, based upon information obtained in good faith from sources believed to be reliable. Such information has not been independently verified and no guaranty, representation of warranty, express or implied, is made as to its accuracy, completeness or correctness. All such information and opinions are subject to change without notice. This document is for information purposes only. Descriptions of any company or companies or their securities mentioned herein are not intended to be complete and this document is not, and should not be construed as an offer or solicitation of an offer, to buy or sell any securities or other financial instruments. This report is not directed to, or intended for display, downloading, printing, reproducing or for distribution to or use by, any person or entity who is a citizen or resident or located in any locality, state, country or other jurisdiction where such distribution, publication, reproduction, availability or use would be contrary to law or regulation or what would subject HSL or its affiliates to any registration or licensing requirement within such jurisdiction. If this report is inadvertently send or has reached any individual in such country, especially, USA, the same may be ignored and brought to the attention of the sender. This document may not be reproduced, distributed or published for any purposes without prior written approval of HSL. Foreign currencies denominated securities, wherever mentioned, are subject to exchange rate fluctuations, which could have an adverse effect on their value or price, or the income derived from them. In addition, investors in securities such as ADRs, the values of which are influenced by foreign currencies effectively assume currency risk. It should not be considered to be taken as an offer to sell or a solicitation to buy any security. HSL may from time to time solicit from, or perform broking, or other services for, any company mentioned in this mail and/or its attachments. HSL and its affiliated company(ies), their directors and employees may; (a) from time to time, have a long or short position in, and buy or sell the securities of the company(ies) mentioned herein or (b) be engaged in any other transaction involving such securities and earn brokerage or other compensation or act as a market maker in the financial instruments of the company(ies) discussed herein or act as an advisor or lender/borrower to such company(ies) or may have any other potential conflict of interests with respect to any recommendation and other related information and opinions. HSL, its directors, analysts or employees do not take any responsibility, financial or otherwise, of the losses or the damages sustained due to the investments made or any action taken on basis of this report, including but not restricted to, fluctuation in the prices of shares and bonds, changes in the currency rates, diminution in the NAVs, reduction in the dividend or income, etc. HSL and other group companies, its directors, associates, employees may have various positions in any of the stocks, securities and financial instruments dealt in the report, or may make sell or purchase or other deals in these securities from time to time or may deal in other securities of the companies / organizations described in this report. HSL or its associates might have managed or co-managed public offering of securities for the subject company or might have been mandated by the subject company for any other assignment in the past twelve months. HSL or its associates might have received any compensation from the companies mentioned in the report during the period preceding twelve months from t date of this report for services in respect of managing or co-managing public offerings, corporate finance, investment banking or merchant banking, brokerage services or other advisory service in a merger or specific transaction in the normal course of business. HSL or its analysts did not receive any compensation or other benefits from the companies mentioned in the report or third party in connection with preparation of the research report. Accordingly, neither HSL nor Research Analysts have any material conflict of interest at the time of publication of this report. Compensation of our Research Analysts is not based on any specific merchant banking, investment banking or brokerage service transactions. HSL may have issued other reports that are inconsistent with and reach different conclusion from the information presented in this report. Research entity has not been engaged in market making activity for the subject company. Research analyst has not served as an officer, director or employee of the subject company. We have not received any compensation/benefits from the subject company or third party in connection with the Research Report. HDFC securities Limited, I Think Techno Campus, Building - B, "Alpha", Office Floor 8, Near Kanjurmarg Station, Opp. Crompton Greaves, Kanjurmarg (East), Mumbai 400 042 Phone: (022) 3075 3400 Fax: (022) 2496 5066 Compliance Officer: Binkle R. Oza Email: [email protected] Phone: (022) 3045 3600 HDFC Securities Limited, SEBI Reg. No.: NSE-INB/F/E 231109431, BSE-INB/F 011109437, AMFI Reg. No. ARN: 13549, PFRDA Reg. No. POP: 04102015, IRDA Corporate Agent License No.: HDF 2806925/HDF C000222657, SEBI Research Analyst Reg. No.: INH000002475, CIN - U67120MH2000PLC152193 Mutual Funds Investments are subject to market risk. Please read the offer and scheme related documents carefully before investing.
MARICO : RESULTS REVIEW 4QFY18
Page | 13
HDFC securities Institutional Equities Unit No. 1602, 16th Floor, Tower A, Peninsula Business Park, Senapati Bapat Marg, Lower Parel,Mumbai - 400 013 Board : +91-22-6171 7330www.hdfcsec.com