Embed Size (px)
Citation preview

RESULTS REVIEW 2QFY18 30 OCT 2017
ITC BUY
HDFC securities Institutional Research is also available on Bloomberg HSLB <GO>& Thomson Reuters
Cigarette volume in-line ITC net revenues were up 1% YoY at Rs 97.6bn. Like-to-like revenue grew 4% vs. 6% expectation. EBITDA and PAT grew 4% and 6% respectively. Amidst a rise in taxes, cigarette revenue growth was at ~2%, impacted by ~6% volume contraction (5% fall anticipated). The hike in Cigarette prices was ~11%, but an unfavourable product mix (higher share of <65mm Cigarettes) impacted Cigarette revenue growth. Volume pressure was softer in September, and could result in better volume traction in the coming quarters. FMCG at 10% revenue growth (like-to-like) and Paper at 18% EBIT growth were outliers in the Non-cigarette segment. Cigarette business, despite punitive taxes, registered ~10% and ~9% revenue CAGR in the last 10 and 5 years resp. We expect ITC to deliver ~7% CAGR in the Cigarette business over FY17-20E. Non-cigarette business can improve gradually, as most of their demand drivers are in a recovery stage. We expect ~13% sales CAGR over FY17-20E. ITC is a market leader in Cigarettes (~70% market share), notebooks, valued-added paperboards and a critical player in biscuits. The company operates at
EBITDA margin of 36%, along with core RoCE of ~40%. We have BUY rating with a TP of Rs 358, based on 32x Sep-19EPS.
Highlights for the quarter
Cigarette EBIT growth at ~4%: ITC’s like-to-like net revenue grew by 4%. King-sized cigarettes have witnessed the greatest impact of GST. The Cigarette business clocked revenue and EBIT growth of 4% and 4% (adjusted for one-time expense), respectively.
Non-Cigarette EBIT growth of 5.5%: FMCG revenue was up 10%, with EBIT margin at 1% (up 85bps YoY), well supported by restocking. Hotels’ revenue rose by a mere 1%. Room revenues grew at a healthy pace, but F&B was impacted by the highway liquor ban. Agri revenues saw 5% growth, while EBIT margin contracted 280bps, owing to a steep rise in raw materials. Paper revenue was down 2%, while EBIT grew up by 18%, due to favourable product mix and cost-saving initiatives.
PAT grew by 6%: PAT was up by 6% to Rs 26.4bn, lower than our estimate of Rs 27.8bn.
Near-term outlook: With anticipation of improvement in operating performance, we expect healthy upside in the near-term too.
Financial Summary (Rs mn) 2QFY18 2QFY17 YoY (%) 1QFY18 QoQ (%) FY16 FY17 FY18E FY19E FY20E Net Revenue 97,639 96,607 1.1 99,547 (1.9) 3,91,921 4,28,036 4,63,293 5,10,314 5,60,041 EBITDA 37,616 36,301 3.6 37,464 0.4 1,44,509 1,54,359 1,68,997 1,89,275 2,09,895 APAT 26,399 25,001 5.6 25,605 3.1 95,009 1,04,772 1,15,557 1,29,108 1,42,481 EPS (Rs) 2.2 2.1 5.6 2.1 5.8 7.9 8.6 9.5 10.6 11.7 P/E (x) 34.2 31.2 28.3 25.3 22.9 EV/EBITDA (x) 21.2 19.9 18.2 16.1 14.5 Core RoCE (%) 40.3 36.1 36.3 37.0 38.4 Source: Company, HDFC sec Inst Research
INDUSTRY FMCG
CMP (as on 27 Jul 2017) Rs 289
Target Price Rs 353
Nifty 10,021
Sensex 32,383
KEY STOCK DATA Bloomberg ITC IN
No. of Shares (mn) 12,161
MCap (Rs bn)/(US$ mn) 3,509/54,743
6m avg traded value (Rs mn) 4,144
STOCK PERFORMANCE (%)
52 Week high / low Rs 368 / 222
3M 6M 12M
Absolute (%) 1.0 12.1 16.6
Relative (%) (6.9) (4.0) 1.1
SHAREHOLDING PATTERN (%)
Promoters 67.20
FIs & Local MFs 5.19
FPIs 13.79
Public & Others 13.82 Source : BSE
Naveen Trivedi [email protected] +91-22-6171-7324
INDUSTRY FMCG
CMP (as on 27 Oct 2017) Rs 269
Target Price Rs 358
Nifty 10,323
Sensex 33,157
KEY STOCK DATA Bloomberg ITC IN
No. of Shares (mn) 12,180
MCap (Rs bn)/(US$ mn) 3,281/50,454
6m avg traded value (Rs mn) 4,079
STOCK PERFORMANCE (%)
52 Week high / low Rs 368 / 222
3M 6M 12M
Absolute (%) (6.7) (5.8) 10.8
Relative (%) (9.0) (16.2) (8.0)
SHAREHOLDING PATTERN (%)
Promoters -
FIs & Local MFs 36.41
FPIs 21.12
Public & Others 42.47 Source : BSE
Naveen Trivedi [email protected] +91-22-6171-7324
ITC: RESULTS REVIEW 2QFY18
Page | 2
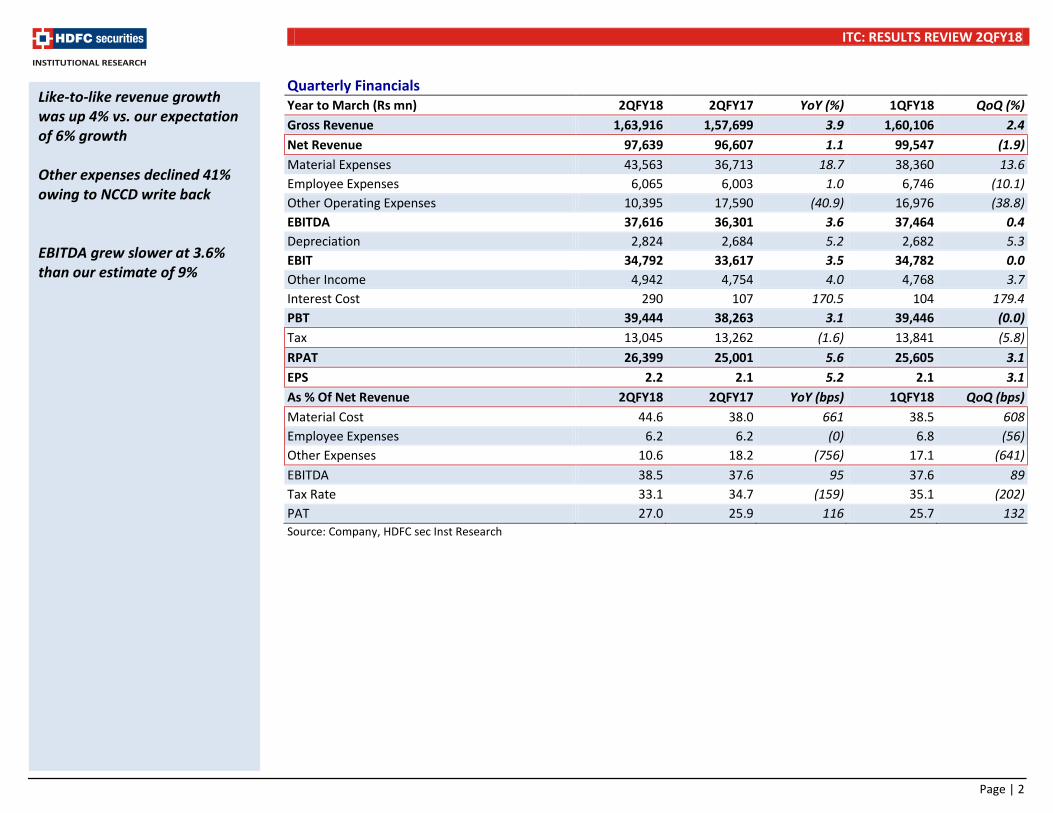
Quarterly Financials Year to March (Rs mn) 2QFY18 2QFY17 YoY (%) 1QFY18 QoQ (%) Gross Revenue 1,63,916 1,57,699 3.9 1,60,106 2.4 Net Revenue 97,639 96,607 1.1 99,547 (1.9) Material Expenses 43,563 36,713 18.7 38,360 13.6 Employee Expenses 6,065 6,003 1.0 6,746 (10.1) Other Operating Expenses 10,395 17,590 (40.9) 16,976 (38.8) EBITDA 37,616 36,301 3.6 37,464 0.4 Depreciation 2,824 2,684 5.2 2,682 5.3 EBIT 34,792 33,617 3.5 34,782 0.0 Other Income 4,942 4,754 4.0 4,768 3.7 Interest Cost 290 107 170.5 104 179.4 PBT 39,444 38,263 3.1 39,446 (0.0) Tax 13,045 13,262 (1.6) 13,841 (5.8) RPAT 26,399 25,001 5.6 25,605 3.1 EPS 2.2 2.1 5.2 2.1 3.1 As % Of Net Revenue 2QFY18 2QFY17 YoY (bps) 1QFY18 QoQ (bps) Material Cost 44.6 38.0 661 38.5 608 Employee Expenses 6.2 6.2 (0) 6.8 (56) Other Expenses 10.6 18.2 (756) 17.1 (641) EBITDA 38.5 37.6 95 37.6 89 Tax Rate 33.1 34.7 (159) 35.1 (202) PAT 27.0 25.9 116 25.7 132 Source: Company, HDFC sec Inst Research
Like-to-like revenue growth was up 4% vs. our expectation of 6% growth Other expenses declined 41% owing to NCCD write back EBITDA grew slower at 3.6% than our estimate of 9%
ITC: RESULTS REVIEW 2QFY18
Page | 3
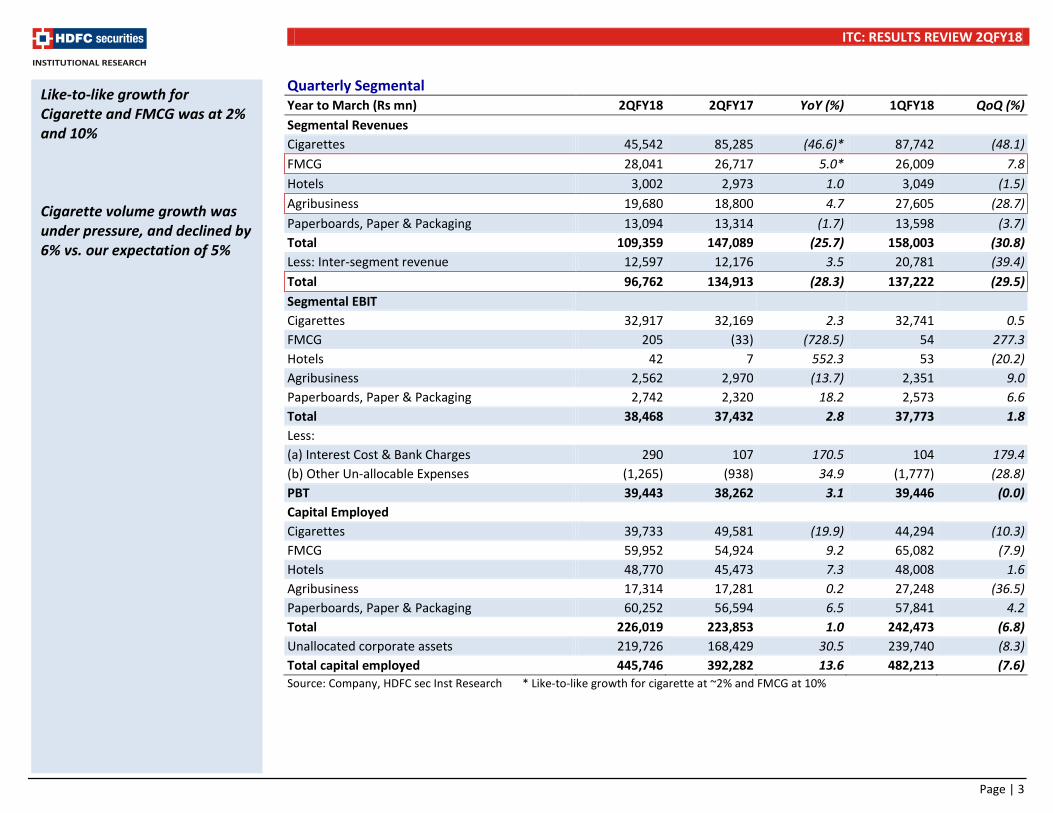
Quarterly Segmental Year to March (Rs mn) 2QFY18 2QFY17 YoY (%) 1QFY18 QoQ (%) Segmental Revenues Cigarettes 45,542 85,285 (46.6)* 87,742 (48.1) FMCG 28,041 26,717 5.0* 26,009 7.8 Hotels 3,002 2,973 1.0 3,049 (1.5) Agribusiness 19,680 18,800 4.7 27,605 (28.7) Paperboards, Paper & Packaging 13,094 13,314 (1.7) 13,598 (3.7) Total 109,359 147,089 (25.7) 158,003 (30.8) Less: Inter-segment revenue 12,597 12,176 3.5 20,781 (39.4) Total 96,762 134,913 (28.3) 137,222 (29.5) Segmental EBIT Cigarettes 32,917 32,169 2.3 32,741 0.5 FMCG 205 (33) (728.5) 54 277.3 Hotels 42 7 552.3 53 (20.2) Agribusiness 2,562 2,970 (13.7) 2,351 9.0 Paperboards, Paper & Packaging 2,742 2,320 18.2 2,573 6.6 Total 38,468 37,432 2.8 37,773 1.8 Less: (a) Interest Cost & Bank Charges 290 107 170.5 104 179.4 (b) Other Un-allocable Expenses (1,265) (938) 34.9 (1,777) (28.8) PBT 39,443 38,262 3.1 39,446 (0.0) Capital Employed Cigarettes 39,733 49,581 (19.9) 44,294 (10.3) FMCG 59,952 54,924 9.2 65,082 (7.9) Hotels 48,770 45,473 7.3 48,008 1.6 Agribusiness 17,314 17,281 0.2 27,248 (36.5) Paperboards, Paper & Packaging 60,252 56,594 6.5 57,841 4.2 Total 226,019 223,853 1.0 242,473 (6.8) Unallocated corporate assets 219,726 168,429 30.5 239,740 (8.3) Total capital employed 445,746 392,282 13.6 482,213 (7.6) Source: Company, HDFC sec Inst Research * Like-to-like growth for cigarette at ~2% and FMCG at 10%
Like-to-like growth for Cigarette and FMCG was at 2% and 10% Cigarette volume growth was under pressure, and declined by 6% vs. our expectation of 5%

ITC: RESULTS REVIEW 2QFY18
Page | 4
EBIT Margin Year to March (Rs mn) 2QFY18 2QFY17 YoY (bps) 1QFY18 QoQ (bps) Cigarettes 72.3 37.7 3,456* 37.3 3,496 FMCG 0.7 (0.1) 85 0.2 52 Hotels 1.4 0.2 119 1.7 (33) Agribusiness 13.0 15.8 (278) 8.5 450 Paperboards, Paper & Packaging 20.9 17.4 352 18.9 202 Total 35.2 25.4 973 23.9 1,127 Source: Company, HDFC sec Inst Research * Like to like expansion was ~75bps Cigarette Volume Growth Cigarette Price Growth
Source: Company, HDFC sec Inst Research Source: Company, HDFC sec Inst Research
Cigarette volume remained under pressure owing to consistent price hikes
-2.0-3.0-4.0
-15.0-13.0
-17.0-15.0
-4.0
1.03.0 3.5
-0.5
-0.51.0
-6.0
-20.0
-15.0
-10.0
-5.0
0.0
5.0M
ar-1
4
Jun-
14
Sep-
14
Dec-
14
Mar
-15
Jun-
15
Sep-
15
Dec-
15
Mar
-16
Jun-
16
Sep-
16
Dec-
16
Mar
-17
Jun-
17
Sep-
17
(%)
14.6
21.8
18.2 15.6
16.2 15.8
16.6
9.7 9.2
3.4 3.6 2.7 5.3 5.6
8.0
0.0
5.0
10.0
15.0
20.0
25.0
Mar
-14
Jun-
14
Sep-
14
Dec-
14
Mar
-15
Jun-
15
Sep-
15
Dec-
15
Mar
-16
Jun-
16
Sep-
16
Dec-
16
Mar
-17
Jun-
17
Sep-
17
(%)

ITC: RESULTS REVIEW 2QFY18
Page | 5
Cigarette Performance Particulars (Rs mn) 2QFY16 3QFY16 4QFY16 1QFY17 2QFY17 3QFY17 4QFY17 1QFY18 2QFY18 Gross Revenue 79,631 81,063 85,455 82,306 85,285 82,880 89,549 87,742 45,542 YoY Gr. (%) 1.6% 5.7% 10.2% 6.4% 7.1% 2.2% 4.8% 6.6% -46.6%* Revenue Mix (%) 57.8% 58.9% 58.0% 54.8% 58.0% 58.2% 57.7% 55.5% 41.6% EBIT 29,689 29,838 30,186 30,046 32,169 30,337 32,588 32,741 32,917 YoY Gr. (%) 3.0% 3.4% 11.5% 8.0% 8.4% 1.7% 8.0% 9.0% 2.3% EBIT Mix (%) 85.9% 85.2% 86.1% 86.2% 85.9% 85.7% 86.8% 86.7% 85.6% EBIT Margin (%) 37.3% 36.8% 35.3% 36.5% 37.7% 36.6% 36.4% 37.3% 72.3% EBIT Margin Chg (bps) 161bps 171bps 286bps 54bps 44bps -21bps 107bps 81bps 3,456bps Capital Employed 52,444 50,282 52,491 51,465 49,581 47,937 55,467 44,294 39,733# RoCE (%) 226% 237% 230% 234% 260% 253% 235% 296% 331% Source: Company, HDFC sec Inst Research Note: Sales growth/margin expansion for 1QFY16 to 4QFY16 are calculated based on OLD AS * Like-to-like growth was at ~2% # Like to like expansion was ~75bps FMCG Performance Particulars (Rs mn) 2QFY16 3QFY16 4QFY16 1QFY17 2QFY17 3QFY17 4QFY17 1QFY18 2QFY18 Gross Revenue 23,580 24,849 27,108 23,852 26,717 25,693 28,858 26,009 28,041 YoY Gr. (%) 7.1% 7.1% 5.4% 9.5% 13.3% 3.4% 6.5% 9.0% 5.0%* Revenue Mix (%) 17.1% 18.1% 18.4% 15.9% 18.2% 18.0% 18.6% 16.5% 25.6% EBIT (111) 188 708 (45) (33) (197) 556 54 205 YoY Gr. (%) 7.7% 63.6% 45.9% -43.3% -70.6% -204.9% -21.5% -220.1% -728.5% EBIT Mix (%) -0.3% 0.5% 2.0% -0.1% -0.1% -0.6% 1.5% 0.1% 0.5% EBIT Margin (%) -0.5% 0.8% 2.6% -0.2% -0.1% -0.8% 1.9% 0.2% 0.7% EBIT Margin Chg (bps) 0bps 26bps 72bps 18bps 35bps -152bps -69bps 40bps 85bps Capital Employed 47,744 44,629 48,520 54,672 54,924 51,817 57,067 65,082 59,952 RoCE (%) -0.9% 1.7% 5.8% -0.3% -0.2% -1.5% 3.9% 0.3% 1.4% Source: Company, HDFC sec Inst Research Note: Sales growth/margin expansion for 1QFY16 to 4QFY16 are calculated based on OLD AS * Like-to-like growth at 10%
Cigarette <65mm had a lower impact of GST. King size cigarettes have been impacted the most FMCG biz growth of 10% was inspiring, benefitting from channel restocking
ITC: RESULTS REVIEW 2QFY18
Page | 6
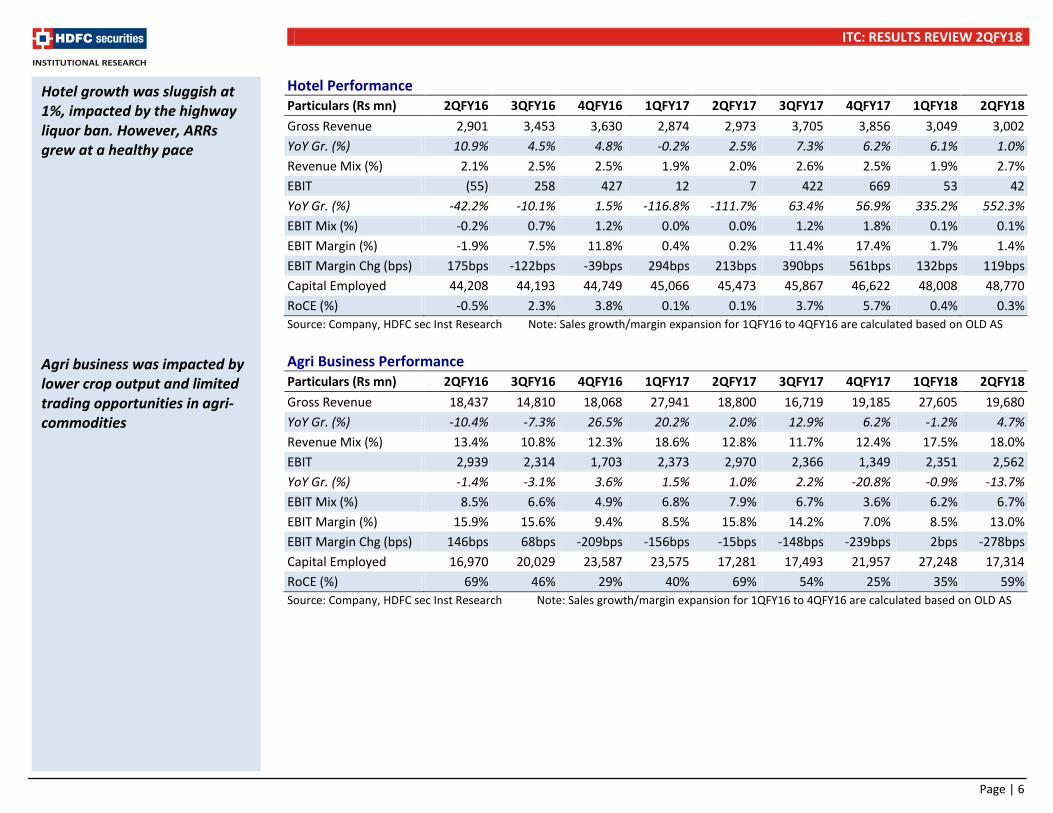
Hotel Performance Particulars (Rs mn) 2QFY16 3QFY16 4QFY16 1QFY17 2QFY17 3QFY17 4QFY17 1QFY18 2QFY18 Gross Revenue 2,901 3,453 3,630 2,874 2,973 3,705 3,856 3,049 3,002 YoY Gr. (%) 10.9% 4.5% 4.8% -0.2% 2.5% 7.3% 6.2% 6.1% 1.0% Revenue Mix (%) 2.1% 2.5% 2.5% 1.9% 2.0% 2.6% 2.5% 1.9% 2.7% EBIT (55) 258 427 12 7 422 669 53 42 YoY Gr. (%) -42.2% -10.1% 1.5% -116.8% -111.7% 63.4% 56.9% 335.2% 552.3% EBIT Mix (%) -0.2% 0.7% 1.2% 0.0% 0.0% 1.2% 1.8% 0.1% 0.1% EBIT Margin (%) -1.9% 7.5% 11.8% 0.4% 0.2% 11.4% 17.4% 1.7% 1.4% EBIT Margin Chg (bps) 175bps -122bps -39bps 294bps 213bps 390bps 561bps 132bps 119bps Capital Employed 44,208 44,193 44,749 45,066 45,473 45,867 46,622 48,008 48,770 RoCE (%) -0.5% 2.3% 3.8% 0.1% 0.1% 3.7% 5.7% 0.4% 0.3% Source: Company, HDFC sec Inst Research Note: Sales growth/margin expansion for 1QFY16 to 4QFY16 are calculated based on OLD AS Agri Business Performance Particulars (Rs mn) 2QFY16 3QFY16 4QFY16 1QFY17 2QFY17 3QFY17 4QFY17 1QFY18 2QFY18 Gross Revenue 18,437 14,810 18,068 27,941 18,800 16,719 19,185 27,605 19,680 YoY Gr. (%) -10.4% -7.3% 26.5% 20.2% 2.0% 12.9% 6.2% -1.2% 4.7% Revenue Mix (%) 13.4% 10.8% 12.3% 18.6% 12.8% 11.7% 12.4% 17.5% 18.0% EBIT 2,939 2,314 1,703 2,373 2,970 2,366 1,349 2,351 2,562 YoY Gr. (%) -1.4% -3.1% 3.6% 1.5% 1.0% 2.2% -20.8% -0.9% -13.7% EBIT Mix (%) 8.5% 6.6% 4.9% 6.8% 7.9% 6.7% 3.6% 6.2% 6.7% EBIT Margin (%) 15.9% 15.6% 9.4% 8.5% 15.8% 14.2% 7.0% 8.5% 13.0% EBIT Margin Chg (bps) 146bps 68bps -209bps -156bps -15bps -148bps -239bps 2bps -278bps Capital Employed 16,970 20,029 23,587 23,575 17,281 17,493 21,957 27,248 17,314 RoCE (%) 69% 46% 29% 40% 69% 54% 25% 35% 59% Source: Company, HDFC sec Inst Research Note: Sales growth/margin expansion for 1QFY16 to 4QFY16 are calculated based on OLD AS
Hotel growth was sluggish at 1%, impacted by the highway liquor ban. However, ARRs grew at a healthy pace Agri business was impacted by lower crop output and limited trading opportunities in agri-commodities
ITC: RESULTS REVIEW 2QFY18
Page | 7
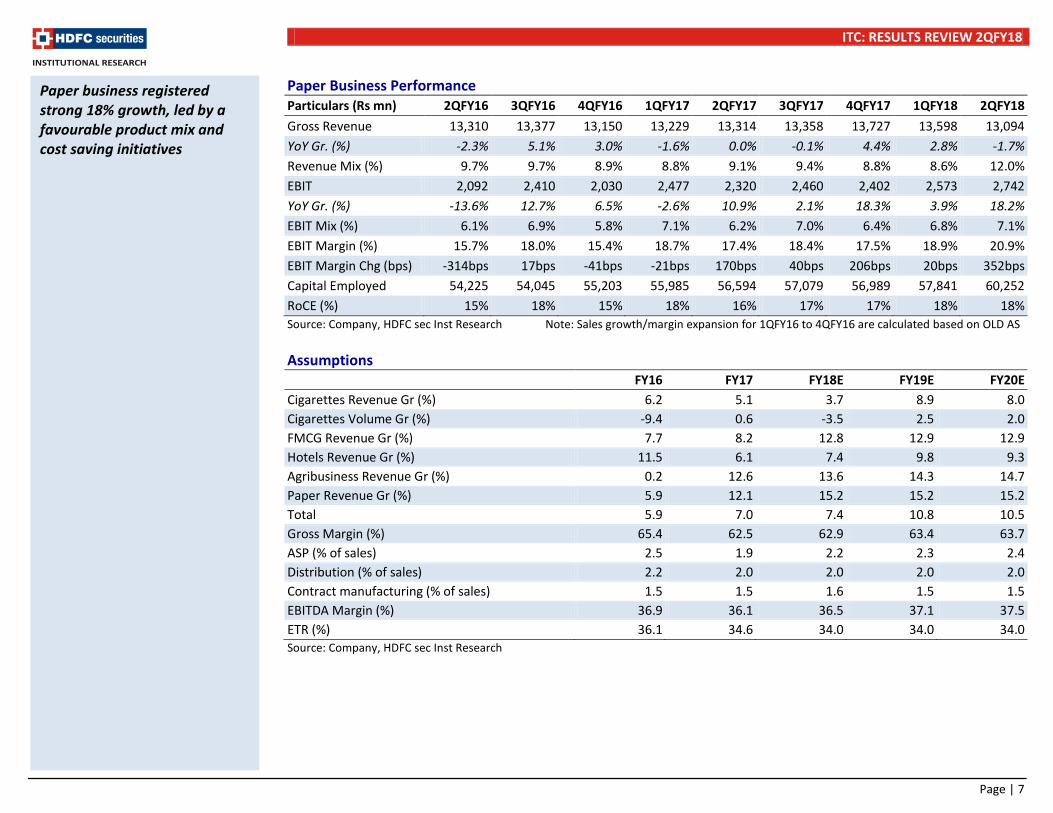
Paper Business Performance Particulars (Rs mn) 2QFY16 3QFY16 4QFY16 1QFY17 2QFY17 3QFY17 4QFY17 1QFY18 2QFY18 Gross Revenue 13,310 13,377 13,150 13,229 13,314 13,358 13,727 13,598 13,094 YoY Gr. (%) -2.3% 5.1% 3.0% -1.6% 0.0% -0.1% 4.4% 2.8% -1.7% Revenue Mix (%) 9.7% 9.7% 8.9% 8.8% 9.1% 9.4% 8.8% 8.6% 12.0% EBIT 2,092 2,410 2,030 2,477 2,320 2,460 2,402 2,573 2,742 YoY Gr. (%) -13.6% 12.7% 6.5% -2.6% 10.9% 2.1% 18.3% 3.9% 18.2% EBIT Mix (%) 6.1% 6.9% 5.8% 7.1% 6.2% 7.0% 6.4% 6.8% 7.1% EBIT Margin (%) 15.7% 18.0% 15.4% 18.7% 17.4% 18.4% 17.5% 18.9% 20.9% EBIT Margin Chg (bps) -314bps 17bps -41bps -21bps 170bps 40bps 206bps 20bps 352bps Capital Employed 54,225 54,045 55,203 55,985 56,594 57,079 56,989 57,841 60,252 RoCE (%) 15% 18% 15% 18% 16% 17% 17% 18% 18% Source: Company, HDFC sec Inst Research Note: Sales growth/margin expansion for 1QFY16 to 4QFY16 are calculated based on OLD AS Assumptions
FY16 FY17 FY18E FY19E FY20E Cigarettes Revenue Gr (%) 6.2 5.1 3.7 8.9 8.0 Cigarettes Volume Gr (%) -9.4 0.6 -3.5 2.5 2.0 FMCG Revenue Gr (%) 7.7 8.2 12.8 12.9 12.9 Hotels Revenue Gr (%) 11.5 6.1 7.4 9.8 9.3 Agribusiness Revenue Gr (%) 0.2 12.6 13.6 14.3 14.7 Paper Revenue Gr (%) 5.9 12.1 15.2 15.2 15.2 Total 5.9 7.0 7.4 10.8 10.5 Gross Margin (%) 65.4 62.5 62.9 63.4 63.7 ASP (% of sales) 2.5 1.9 2.2 2.3 2.4 Distribution (% of sales) 2.2 2.0 2.0 2.0 2.0 Contract manufacturing (% of sales) 1.5 1.5 1.6 1.5 1.5 EBITDA Margin (%) 36.9 36.1 36.5 37.1 37.5 ETR (%) 36.1 34.6 34.0 34.0 34.0 Source: Company, HDFC sec Inst Research
Paper business registered strong 18% growth, led by a favourable product mix and cost saving initiatives

ITC: RESULTS REVIEW 2QFY18
Page | 8
India’s Tobacco Consumption Tobacco Consumption Share Tax Revenue Share
Source: Company, HDFC sec Inst Research Source: Company, HDFC sec Inst Research Change In Legal Cigarette Consumption
Period
Total domestic tobacco consumption including illegal
cigarette (Mn Kgs)
Legal cigarette consumption (Mn Kgs)
% share of legal cigarette in total tobacco consumption
1981-82 406 86 21% 2009-10 499 73 15% 2014-15 562 62 11% Source: Company, HDFC sec Inst Research
India is the 4th largest illegal cigarette market in the world Illegal cigarettes contribute 20% of the market now, as compared to ~16% in 2010
Legal cigarettes
11%
Other tobacco products
89%
Legal cigarettes
87%
Other tobacco products
13%

ITC: RESULTS REVIEW 2QFY18
Page | 9
Per Capita Consumption Of Tobacco In India Per Annum
Affordability (% Of Per Capita GDP) Required To Purchase 100 Packs Of 20 Cigarettes Of Brand
Source: Company, HDFC sec Inst Research Source: Company, HDFC sec Inst Research
2,786
1,841 1,711
1,028
468 420 154 96
-
500
1,000
1,500
2,000
2,500
3,000
Russ
ian
Fede
ratio
n
Japa
n
Chin
a
USA
Paki
stan
Nep
al
Bang
lade
sh
Indi
a
(No)
1.14 1.31 1.55 1.68 2.14 2.53 2.87 3.4 3.73
10.82
0
2
4
6
8
10
12
USA
Russ
ia
Ger
man
y
Cana
da
Chin
a
Aust
ralia U
K
Mal
aysi
a
Paki
stan
Indi
a
ITC: RESULTS REVIEW 2QFY18
Page | 10
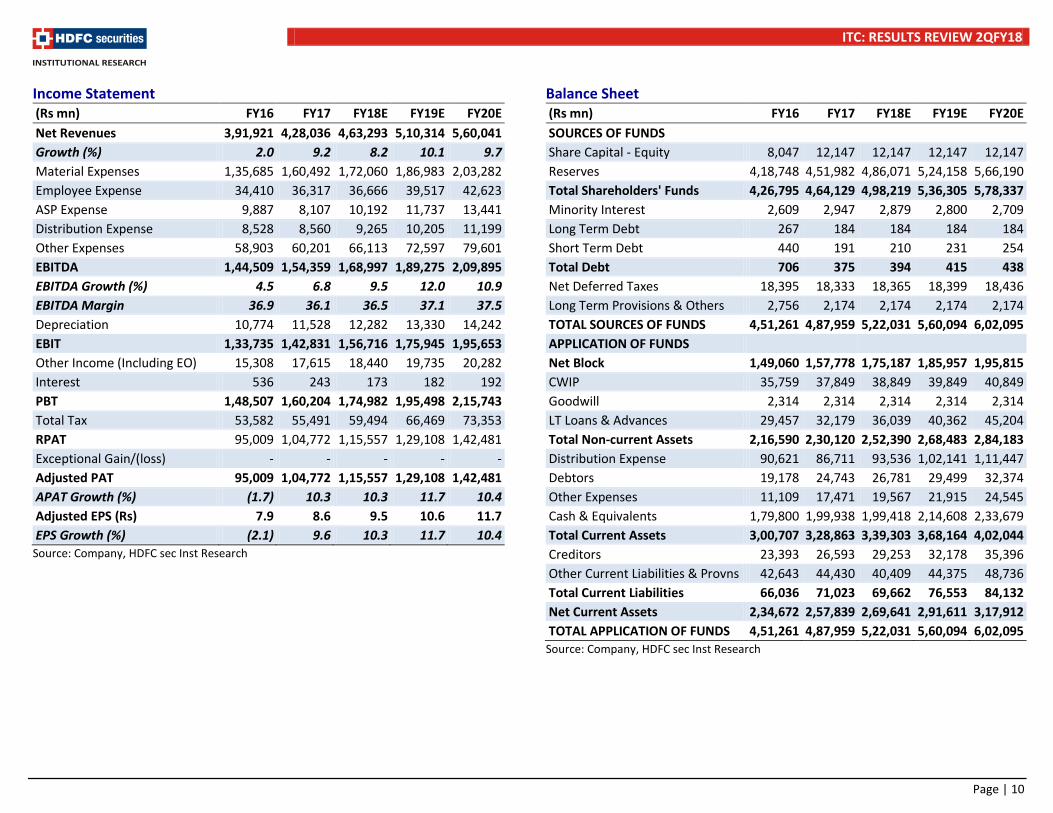
Income Statement (Rs mn) FY16 FY17 FY18E FY19E FY20E Net Revenues 3,91,921 4,28,036 4,63,293 5,10,314 5,60,041 Growth (%) 2.0 9.2 8.2 10.1 9.7 Material Expenses 1,35,685 1,60,492 1,72,060 1,86,983 2,03,282 Employee Expense 34,410 36,317 36,666 39,517 42,623 ASP Expense 9,887 8,107 10,192 11,737 13,441 Distribution Expense 8,528 8,560 9,265 10,205 11,199 Other Expenses 58,903 60,201 66,113 72,597 79,601 EBITDA 1,44,509 1,54,359 1,68,997 1,89,275 2,09,895 EBITDA Growth (%) 4.5 6.8 9.5 12.0 10.9 EBITDA Margin 36.9 36.1 36.5 37.1 37.5 Depreciation 10,774 11,528 12,282 13,330 14,242 EBIT 1,33,735 1,42,831 1,56,716 1,75,945 1,95,653 Other Income (Including EO) 15,308 17,615 18,440 19,735 20,282 Interest 536 243 173 182 192 PBT 1,48,507 1,60,204 1,74,982 1,95,498 2,15,743 Total Tax 53,582 55,491 59,494 66,469 73,353 RPAT 95,009 1,04,772 1,15,557 1,29,108 1,42,481 Exceptional Gain/(loss) - - - - - Adjusted PAT 95,009 1,04,772 1,15,557 1,29,108 1,42,481 APAT Growth (%) (1.7) 10.3 10.3 11.7 10.4 Adjusted EPS (Rs) 7.9 8.6 9.5 10.6 11.7 EPS Growth (%) (2.1) 9.6 10.3 11.7 10.4
Source: Company, HDFC sec Inst Research
Balance Sheet (Rs mn) FY16 FY17 FY18E FY19E FY20E SOURCES OF FUNDS Share Capital - Equity 8,047 12,147 12,147 12,147 12,147 Reserves 4,18,748 4,51,982 4,86,071 5,24,158 5,66,190 Total Shareholders' Funds 4,26,795 4,64,129 4,98,219 5,36,305 5,78,337 Minority Interest 2,609 2,947 2,879 2,800 2,709 Long Term Debt 267 184 184 184 184 Short Term Debt 440 191 210 231 254 Total Debt 706 375 394 415 438 Net Deferred Taxes 18,395 18,333 18,365 18,399 18,436 Long Term Provisions & Others 2,756 2,174 2,174 2,174 2,174 TOTAL SOURCES OF FUNDS 4,51,261 4,87,959 5,22,031 5,60,094 6,02,095 APPLICATION OF FUNDS Net Block 1,49,060 1,57,778 1,75,187 1,85,957 1,95,815 CWIP 35,759 37,849 38,849 39,849 40,849 Goodwill 2,314 2,314 2,314 2,314 2,314 LT Loans & Advances 29,457 32,179 36,039 40,362 45,204 Total Non-current Assets 2,16,590 2,30,120 2,52,390 2,68,483 2,84,183 Distribution Expense 90,621 86,711 93,536 1,02,141 1,11,447 Debtors 19,178 24,743 26,781 29,499 32,374 Other Expenses 11,109 17,471 19,567 21,915 24,545 Cash & Equivalents 1,79,800 1,99,938 1,99,418 2,14,608 2,33,679 Total Current Assets 3,00,707 3,28,863 3,39,303 3,68,164 4,02,044 Creditors 23,393 26,593 29,253 32,178 35,396 Other Current Liabilities & Provns 42,643 44,430 40,409 44,375 48,736 Total Current Liabilities 66,036 71,023 69,662 76,553 84,132 Net Current Assets 2,34,672 2,57,839 2,69,641 2,91,611 3,17,912 TOTAL APPLICATION OF FUNDS 4,51,261 4,87,959 5,22,031 5,60,094 6,02,095
Source: Company, HDFC sec Inst Research

ITC: RESULTS REVIEW 2QFY18
Page | 11
Cash Flow Statement (Rs mn) FY16 FY17 FY18E FY19E FY20E Reported PBT 1,54,332 1,60,204 1,74,982 1,95,498 2,15,743 Non-operating & EO Items (5,980) - - - - Interest Expenses (8,227) 243 173 182 192 Depreciation 11,134 11,528 12,282 13,330 14,242 Working Capital Change (1,666) 2,350 (16,181) (11,103) (12,073) Tax Paid (50,812) (55,462) (59,462) (66,435) (73,316) OPERATING CASH FLOW ( a ) 98,782 1,18,863 1,11,793 1,31,472 1,44,788 Capex (23,835) (31,798) (30,691) (25,100) (25,100) Free Cash Flow (FCF) 74,947 87,065 81,102 1,06,372 1,19,688 Investments (34,379) (52,788) (15,000) (15,000) (15,000) Non-operating Income 18,558 - - - - INVESTING CASH FLOW ( b ) (39,657) (84,586) (45,691) (40,100) (40,100) Debt Issuance/(Repaid) (127) (331) 19 21 23 Interest Expenses (324) (243) (173) (182) (192) FCFE 74,496 86,491 80,948 1,06,211 1,19,520 Share Capital Issuance 5,317 6,426 (0) (0) 0 Dividend (61,258) (62,863) (69,334) (77,465) (85,489) Others (1,300) (11,001) (12,133) (13,556) (14,961) FINANCING CASH FLOW ( c ) (57,692) (68,012) (81,621) (91,182) (1,00,618) NET CASH FLOW (a+b+c) 1,434 (33,735) (15,520) 190 4,070 EO Items, Others (10,267) - - - - Closing Cash & Equivalents 62,324 29,674 14,154 14,344 18,415
Source: Company, HDFC sec Inst Research
Key Ratios FY16 FY17 FY18E FY19E FY20E PROFITABILITY (%) GPM 65.4 62.5 62.9 63.4 63.7 EBITDA Margin 36.9 36.1 36.5 37.1 37.5 EBIT Margin 34.1 33.4 33.8 34.5 34.9 APAT Margin 24.2 24.5 24.9 25.3 25.4 RoE 25.5 23.5 24.0 25.0 25.6 RoIC (or Core RoCE) 40.3 36.1 36.3 37.0 38.4 RoCE 25.4 23.4 23.9 24.8 25.4 EFFICIENCY Tax Rate (%) 36.1 34.6 34.0 34.0 34.0 Fixed Asset Turnover (x) 0.6 0.6 0.6 0.6 0.6 Inventory (days) 84.4 73.9 73.7 73.1 72.6 Debtors (days) 17.9 21.1 21.1 21.1 21.1 Other Current Assets (days) 10.3 14.9 15.4 15.7 16.0 Payables (days) 21.8 22.7 23.0 23.0 23.1 Other Current Liab & Provns (days) 39.7 37.9 31.8 31.7 31.8 Cash Conversion Cycle (days) 51.1 49.4 55.3 55.1 54.9 Net D/E (x) (0.4) (0.4) (0.4) (0.4) (0.4) Interest Coverage (x) 0.0 0.0 0.0 0.0 0.0 PER SHARE DATA (Rs) EPS 7.9 8.6 9.5 10.6 11.7 CEPS 8.8 9.6 10.5 11.7 12.9 Dividend 8.5 5.2 5.7 6.4 7.0 Book Value 35.4 38.2 41.0 44.1 47.6 VALUATION P/E (x) 34.2 31.2 28.3 25.3 22.9 P/BV (x) 7.6 7.0 6.6 6.1 5.7 EV/EBITDA (x) 21.2 19.9 18.2 16.1 14.5 EV/Revenues (x) 7.8 7.2 6.6 6.0 5.4 OCF/EV (%) 3.2 3.9 3.6 4.3 4.8 FCF/EV (%) 2.4 2.8 2.6 3.5 3.9 FCFE/Mkt Cap (%) 2.3 2.6 2.5 3.3 3.7 Dividend Yield (%) 3.2 1.9 2.1 2.4 2.6
Source: Company, HDFC sec Inst Research
ITC: RESULTS REVIEW 2QFY18
Page | 12
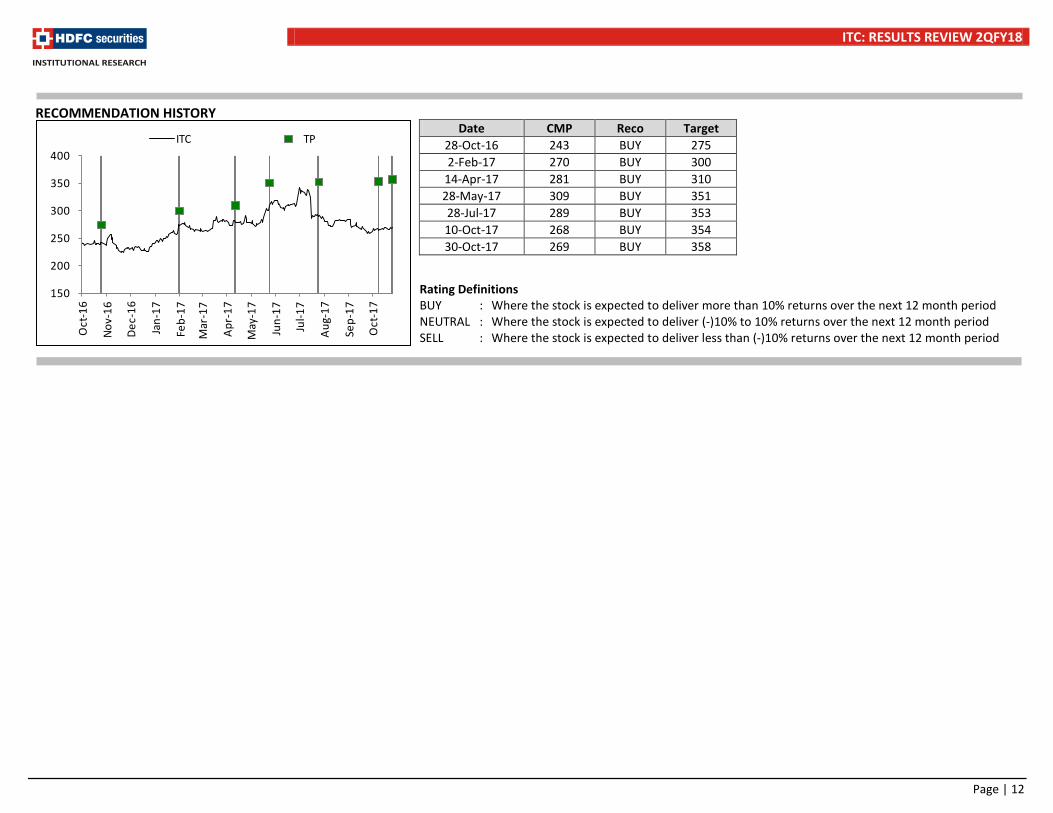
RECOMMENDATION HISTORY
Rating Definitions BUY : Where the stock is expected to deliver more than 10% returns over the next 12 month period NEUTRAL : Where the stock is expected to deliver (-)10% to 10% returns over the next 12 month period SELL : Where the stock is expected to deliver less than (-)10% returns over the next 12 month period
Date CMP Reco Target 28-Oct-16 243 BUY 275 2-Feb-17 270 BUY 300
14-Apr-17 281 BUY 310 28-May-17 309 BUY 351 28-Jul-17 289 BUY 353 10-Oct-17 268 BUY 354 30-Oct-17 269 BUY 358
150
200
250
300
350
400
Oct
-16
Nov-
16
Dec-
16
Jan-
17
Feb-
17
Mar
-17
Apr-
17
May
-17
Jun-
17
Jul-1
7
Aug-
17
Sep-
17
Oct
-17
ITC TP
ITC: RESULTS REVIEW 2QFY18
Page | 13
Disclosure: I, Naveen Trivedi, MBA, author and the name subscribed to this report, hereby certify that all of the views expressed in this research report accurately reflect our views about the subject issuer(s) or securities. HSL has no material adverse disciplinary history as on the date of publication of this report. We also certify that no part of our compensation was, is, or will be directly or indirectly related to the specific recommendation(s) or view(s) in this report. Research Analyst or his/her relative or HDFC Securities Ltd. does not have any financial interest in the subject company. Also Research Analyst or his relative or HDFC Securities Ltd. or its Associate may have beneficial ownership of 1% or more in the subject company at the end of the month immediately preceding the date of publication of the Research Report. Further Research Analyst or his relative or HDFC Securities Ltd. or its associate does not have any material conflict of interest. Any holding in stock –No HDFC Securities Limited (HSL) is a SEBI Registered Research Analyst having registration no. INH000002475. Disclaimer: This report has been prepared by HDFC Securities Ltd and is meant for sole use by the recipient and not for circulation. The information and opinions contained herein have been compiled or arrived at, based upon information obtained in good faith from sources believed to be reliable. Such information has not been independently verified and no guaranty, representation of warranty, express or implied, is made as to its accuracy, completeness or correctness. All such information and opinions are subject to change without notice. This document is for information purposes only. Descriptions of any company or companies or their securities mentioned herein are not intended to be complete and this document is not, and should not be construed as an offer or solicitation of an offer, to buy or sell any securities or other financial instruments. This report is not directed to, or intended for display, downloading, printing, reproducing or for distribution to or use by, any person or entity who is a citizen or resident or located in any locality, state, country or other jurisdiction where such distribution, publication, reproduction, availability or use would be contrary to law or regulation or what would subject HSL or its affiliates to any registration or licensing requirement within such jurisdiction. If this report is inadvertently send or has reached any individual in such country, especially, USA, the same may be ignored and brought to the attention of the sender. This document may not be reproduced, distributed or published for any purposes without prior written approval of HSL. Foreign currencies denominated securities, wherever mentioned, are subject to exchange rate fluctuations, which could have an adverse effect on their value or price, or the income derived from them. In addition, investors in securities such as ADRs, the values of which are influenced by foreign currencies effectively assume currency risk. It should not be considered to be taken as an offer to sell or a solicitation to buy any security. HSL may from time to time solicit from, or perform broking, or other services for, any company mentioned in this mail and/or its attachments. HSL and its affiliated company(ies), their directors and employees may; (a) from time to time, have a long or short position in, and buy or sell the securities of the company(ies) mentioned herein or (b) be engaged in any other transaction involving such securities and earn brokerage or other compensation or act as a market maker in the financial instruments of the company(ies) discussed herein or act as an advisor or lender/borrower to such company(ies) or may have any other potential conflict of interests with respect to any recommendation and other related information and opinions. HSL, its directors, analysts or employees do not take any responsibility, financial or otherwise, of the losses or the damages sustained due to the investments made or any action taken on basis of this report, including but not restricted to, fluctuation in the prices of shares and bonds, changes in the currency rates, diminution in the NAVs, reduction in the dividend or income, etc. HSL and other group companies, its directors, associates, employees may have various positions in any of the stocks, securities and financial instruments dealt in the report, or may make sell or purchase or other deals in these securities from time to time or may deal in other securities of the companies / organizations described in this report. HSL or its associates might have managed or co-managed public offering of securities for the subject company or might have been mandated by the subject company for any other assignment in the past twelve months. HSL or its associates might have received any compensation from the companies mentioned in the report during the period preceding twelve months from t date of this report for services in respect of managing or co-managing public offerings, corporate finance, investment banking or merchant banking, brokerage services or other advisory service in a merger or specific transaction in the normal course of business. HSL or its analysts did not receive any compensation or other benefits from the companies mentioned in the report or third party in connection with preparation of the research report. Accordingly, neither HSL nor Research Analysts have any material conflict of interest at the time of publication of this report. Compensation of our Research Analysts is not based on any specific merchant banking, investment banking or brokerage service transactions. HSL may have issued other reports that are inconsistent with and reach different conclusion from the information presented in this report. Research entity has not been engaged in market making activity for the subject company. Research analyst has not served as an officer, director or employee of the subject company. We have not received any compensation/benefits from the subject company or third party in connection with the Research Report. HDFC securities Limited, I Think Techno Campus, Building - B, "Alpha", Office Floor 8, Near Kanjurmarg Station, Opp. Crompton Greaves, Kanjurmarg (East), Mumbai 400 042 Phone: (022) 3075 3400 Fax: (022) 2496 5066 Compliance Officer: Binkle R. Oza Email: [email protected] Phone: (022) 3045 3600 HDFC Securities Limited, SEBI Reg. No.: NSE-INB/F/E 231109431, BSE-INB/F 011109437, AMFI Reg. No. ARN: 13549, PFRDA Reg. No. POP: 04102015, IRDA Corporate Agent License No.: HDF 2806925/HDF C000222657, SEBI Research Analyst Reg. No.: INH000002475, CIN - U67120MH2000PLC152193 Mutual Funds Investments are subject to market risk. Please read the offer and scheme related documents carefully before investing.
ITC: RESULTS REVIEW 2QFY18
Page | 14
HDFC securities Institutional Equities Unit No. 1602, 16th Floor, Tower A, Peninsula Business Park, Senapati Bapat Marg, Lower Parel,Mumbai - 400 013 Board : +91-22-6171 7330www.hdfcsec.com