Embed Size (px)
Citation preview

Business Value
Calculation
Sample Company, Inc. as of
December 31, 2011

Table of Contents
Calculated Values .................................................................................................................................... 1
Calculation Procedures ............................................................................................................................ 2
Approach ......................................................................................................................................................... 2
Private Company Transactions ......................................................................................................................... 2
Capitalized Cash Flow ...................................................................................................................................... 3
Excess Earnings ................................................................................................................................................ 4
Adjusted Asset Value ....................................................................................................................................... 4
Industry Rules of Thumb .................................................................................................................................. 5
Calculation Results................................................................................................................................... 5
Statement of Assumptions and Limiting Conditions ................................................................................. 6
Certifications and Representations of David E. Coffman ........................................................................... 7
Professional Qualifications of David E. Coffman ....................................................................................... 8
Summarized Earnings Data ...................................................................................................................... 9
Value Calculations ................................................................................................................................. 10
Private Company Transactions ....................................................................................................................... 10
Search Summary ........................................................................................................................................ 10
Percentage of Annual Revenue .................................................................................................................. 10
Multiple of Sellers’ Discretionary Earnings ................................................................................................. 11
Capitalized Cash Flow .................................................................................................................................... 12
Adjusted Asset Value ..................................................................................................................................... 12
Excess Earnings .............................................................................................................................................. 13
Industry Rules of Thumb ........................................................................................................................ 14

1
Calculated Values
Month 1, 2012
Ben Sample, President
Sample Company, Inc.
123 Sample Rd.
Anytown, PA 12345
We have performed a calculation engagement, as that term is defined in the Statement on Standards for
Valuation Services (SSVS) of the American Institute of Certified Public Accountants. We performed certain
calculation procedures on the Company as of December 31, 2011. The specific calculation procedures are
detailed in this report. The calculation procedures were performed solely to assist in the matter of buying or
selling the Company; the resulting calculations of value should not be used for any other purpose or by any
other party for any purpose. This calculation engagement was conducted in accordance with the SSVS. The
estimates of value that result from a calculation engagement are expressed as calculated values.
In a calculation engagement, the valuation analyst and the client agree on the specific valuation approaches and
methods to be used and the extent of valuation procedures to be performed. A calculation engagement does
not include all of the procedures required in a valuation engagement, as that term is defined in the SSVS. Had a
valuation engagement been performed, the results might have been different.
Based on our calculations, as described in this report, which are based solely on the procedures agreed upon as
referred to above, the resulting range of calculated values of the Company as of the date shown above was:
Low ($) Average ($) High ($) $82,712 $92,201 $101,689
These calculated values are subject to the Statement of Assumptions and Limiting Conditions stated in this
report. We have no obligation to update this report or the calculated values for information that comes to our
attention after the date of this report.
David E. Coffman CPA/ABV/CFF, CVA
President & CEO
Business Valuations & Strategies PC

2
Calculation Procedures
Approach
The Company’s earnings information from its federal income tax returns or financial statements is summarized
in the Summarized Earnings Data section. The net income figure agrees with the book net income as shown on
the tax returns or statements.
The vast majority of small, privately-held companies are sold on an asset-sale basis. A typical asset sale includes
the operating assets of a business – inventory; furniture, fixtures and equipment (FF&E); and all intangible assets
(goodwill). Real estate may also be included if it is owned by the company. These assets are sold free and clear
of all debt. These assets, as a group, comprise an ongoing business enterprise. The procedures described in this
report are designed to calculate the value of the operating assets of the Company.
Private Company Transactions
This method uses data from the actual sales of businesses similar to yours. We searched the BIZCOMPS database
for transactions involving businesses in the same Standard Industrial Classification (SIC) Code or North American
Industrial Classification System (NAICS) Code. We may further limit the search by type of business or annual
revenue. The search criteria and results are summarized in the Search Summary section.
BIZCOMPS contains data from approximately 8,000 transactions involving the sale of privately owned businesses
in the U.S. over the previous 10 years. This data is not publicly reported so it is obtained from business brokers
and transaction intermediaries. These sources are considered to be reliable.
BIZCOMPS transactions are structured as or converted to asset sales. The Asking Price and Sale Price from
BIZCOMPS contains only 2 components – furniture, fixtures and equipment (FF&E) and goodwill. Inventory is not
included and must be added to the results of any method using BIZCOMPS ratios. All businesses are considered
to be debt-free at closing even if the buyer is incurring new debt to finance the purchase. The seller is
responsible for paying off all debt at closing.
The Percentage of Annual Revenue
This method applies the average Sale Price to Annual Revenue ratio to your company’s most recent annual
revenue to calculate value. This method ignores differences in gross margins and operating expenses
(profitability). Therefore, this method often produces the highest or top-line value of the business.
The Multiple of Seller’s Discretionary Earnings (SDE)
This method applies the Sale Price to SDE ratio to your business’s most recent SDE to calculate value. SDE is
equal to a company’s earnings before: income taxes, non-recurring income and expenses, depreciation and
amortization, interest income or expense, non-operating (discretionary) items, and owners’ total compensation
for services (including payroll taxes and benefits).

3
This method is best suited to a business where the salary and perquisites of an owner represent a significant
portion of the total benefits generated by the business and/or an owner/manager typically runs the business.
Buyers and sellers of small businesses tend to think in terms of their potential personal compensation rather
than business profits. They look at the total discretionary earnings to see if it is sufficient to carry the debt
structure necessary to buy and/or operate the business, and provide them with adequate compensation.
The multiple of SDE method was excluded from the range of calculated values because it produced a value less
than the Adjusted Asset Value that is often considered the minimum value of a business.
Any significant difference between the SDE method and the Percentage of Annual Revenue method is due to
differences in profitability. If the SDE method is higher, your business has above average profitability. If the SDE
method is lower, your business has below average profitability.
PROS – Since BIZCOMPS is based on actual sales of similar businesses; it is the closest thing to true market value.
Data from searches containing a large number of transactions is more statistically sound.
CONS – From the amount of data collected by BIZCOMPS it is difficult to accurately assess the comparability of
any one transaction. The number of transactions involving businesses similar to yours may be rather small and
statistically insignificant.
Capitalized Cash Flow
The earning capacity of a business is a primary driver of its value. Cash flow is considered a more pure form of
earnings and therefore more accurately reflects a company’s true earning capacity. The true earning capacity of
a business must include adequate compensation for services provided by the owner(s) and real estate rent
expense based on market rates; and must exclude any non-recurring and non-operating expenses.
Cash flow to equity consists of a company’s earnings before taxes, depreciation and amortization less capital
expenditures and net debt proceeds (repayments). The CCF method using cash flow to equity calculates the
value of the total entity. Debt-free cash flow consists of a company’s earnings before interest, taxes,
depreciation and amortization less capital expenditures. . The CCF method using debt-free cash flow calculates
the value of the company’s operating assets. The appropriate type of cash flow is also adjusted for the items
mentioned above – owner’s compensation, real estate rent, and non-recurring and non-operating
(discretionary) expenses.
The capitalized cash flow (CCF) method converts a company’s average cash flow into a value using a
capitalization rate. The average cash flow is divided by the capitalization rate. The capitalization rate reflects the
risk level associated with owning the specific business. Typically, capitalization rates for small businesses range
between 20% and 30%. In this case, a capitalization rate of 25% was selected, indicating an average level of risk.
PROS – It works well when a company has a history of stable, growing, or significant cash flow; and minimal
tangible assets. It reflects the value of a business from an investment or absentee owner perspective.
CONS – Doesn’t work well when a company has marginal or unstable cash flow, and/or significant tangible
assets.

4
Adjusted Asset Value
The adjusted asset value method is often considered the bottom-line value of a business because it excludes
goodwill. It is most relevant when a business has negative cash flow or discretionary earnings, or has been
operating for less than 1 year. The adjusted asset value may also be used to allocate value, calculated using
other methods, between the physical (hard) assets and goodwill. The adjusted asset method approximates the
liquidation or minimum value of a business and is not included in the range of calculated values.
The adjusted asset value method starts with the book value (cost less accumulated depreciation) of the
company’s assets included in the sale. The book values of the Company’s assets were obtained from tax returns
or balance sheet data. Where possible the book values are adjusted to an estimate of their current market
value. For example, real estate may be adjusted based on a recent appraisal. Some assets may be adjusted to
estimates provided by the seller. The source of any market value estimates is disclosed on that schedule.
PROS – It is easy to do and understand.
CONS – It does not place any value on goodwill or other intangible assets. Any market value estimates not based
on appraisals or other independent sources may be unreliable.
Excess Earnings
The excess earnings method provides a logical approach to value a company’s intangible assets as a lump sum. It
is widely used where identifying and determining the value of specific intangible assets is impractical. The excess
earnings method computes the company’s value based on the adjusted value of tangible assets plus an
additional amount for intangible assets.
A company’s tangible assets should provide a current return to the owner. Typically, that rate is the prevailing
industry rate of return on assets (pre-tax income/total assets). Any returns produced by the company above the
rate on tangible assets are considered to arise from intangible assets. These “excess earnings” are capitalized to
estimate the value of the intangible assets.
This method uses net income before tax (pre-tax). We adjust pre-tax income for the same items discussed in the
previous section – adequate owner’s compensation, market-based real estate rent, and any non-recurring and
non-operating (discretionary) expenses to arrive at adjusted pre-tax earnings.
The capitalization rate used in the excess earnings method is derived from the capitalization rate used in the
capitalized cash flow method by adjusting the rate for the different earnings base (pre-tax income vs. cash flow).
The excess earnings capitalization rate equals pre-tax earnings divided by cash flow, then multiplied by the
capitalized cash flow method capitalization rate.
PROS – It is the best way to value the intangible assets (goodwill) of a small company as one lump sum. It
reflects the value of a business from an investment or absentee owner perspective.
CONS – It is not intended for use with businesses containing few tangible assets.

5
Industry Rules of Thumb
Some industries have formulas or rules of thumb about how businesses in their industry are valued. We use the
rules of thumb published in the Business Reference Guide from Business Brokerage Press. The Guide also
provides industry data on expenses that can be used for basic benchmark comparisons. Because the source and
quality of the data used for industry formulas is unknown, we do not calculate value using these formulas
unless no better data is available. The Industry Data & Rules of Thumb section at the end of this report is
presented for information purposes only.
PROS – Industry rules of thumb are easy to obtain and apply.
CONS – There is usually no credible evidence to support the source and quality of the data used. The rules do
not give adequate consideration to the unique factors that affect the value of a specific business.
Calculation Results
The results of the calculation procedures described in this report are summarized below. A detailed description
of each calculation is presented on the page indicated. The reasons for excluding a method are explained in that
section of the report. As explained in that section, the Adjusted Asset Value is often considered the bottom-line
value of a business. Any method that produced a value below the Adjusted Asset Value was excluded from the
range of calculated values.
Method Result ($) Range Page
Percentage of Annual Revenue 91,188 Included 10
Multiple of Seller’s Discretionary Earnings 47,573 Excluded 11
Capitalized Cash Flow 82,712 Included – Low 12
Adjusted Asset Value 59,833 Excluded 12
Excess Earnings 101,689 Included – High 13

6
Statement of Assumptions and Limiting Conditions
This calculation engagement is subject to the following assumptions and limiting conditions:
1. The calculated values arrived at herein are valid only for the stated purpose as of the date of the valuation.
2. Tax returns, financial statements and other related information provided by the Company or its
representatives, in the course of this engagement, have been accepted without any verification as fully and
correctly reflecting the enterprise’s business conditions and operating results for the respective periods,
except as specifically noted herein. I have not audited, reviewed, or compiled the financial information
provided to me and accordingly, we express no audit opinion or any other of assurance on this information.
3. Public information, and industry and statistical information have been obtained from sources considered to
be reliable. However, we make no representation as to the accuracy or completeness of such information
and have performed no procedures to corroborate the information.
4. The calculated values arrived at herein are based on the assumption that the current level of management
expertise and effectiveness would continue to be maintained, and that the character and integrity of the
enterprise through any sale, reorganization, exchange, or diminution of the owners’ participation would not
be materially or significantly changed.
5. This report and the calculated values arrived at herein are for the exclusive use of my client for the sole and
specific purposes as noted herein. They may not be used for any other purpose or by any other party for any
purpose. Furthermore the report and calculated values are not intended by the author and should not be
construed by the reader to be investment advice in any manner whatsoever.
6. Neither all nor any part of the contents of this report should be disseminated to the public through
advertising media, public relations, news media, sales media, mail, direct transmittal, or any other means of
communication without my prior written consent and approval.
7. Future services regarding the subject matter of this report, including, but not limited to testimony or
attendance in court, shall not be required of me unless previous arrangements have been made in writing.
8. We take no responsibility for any actual or potential liabilities resulting from non-compliance with any
federal, state, or local laws or regulations.
9. No change of any item in this report shall be made by anyone other than us, and we shall have no
responsibility for any such unauthorized change.
10. We have not conducted interviews with the current management of the Company.
11. Except as noted, we have relied on the representations of the owners, management, and other third parties
concerning the value and useful condition of all equipment, real estate, investments used in the business,
and any other assets or liabilities, except as specifically stated to the contrary in this report. We have not
attempted to confirm whether or not all assets of the business are free and clear of liens and encumbrances
or that the entity has good title to all assets.
12. This valuation reflects facts and conditions existing at the valuation date. Subsequent events have not been
considered, and I have no obligation to update my report for such events and conditions.
13. David E. Coffman CPA/ABV, CVA, prepared this report. He has no present or contemplated future interest in
the Company, no personal interest with respect to the parties involved, nor any other interest that might
prevent him from performing an unbiased valuation. Our compensation is not contingent on an action or
event resulting from the analyses, opinions, or conclusions in, or use of, this report.

7
Certifications and Representations of David E. Coffman
I certify that to the best of my knowledge and belief:
1. The analyses, opinions, and conclusion of value included in the valuation report are subject to the
reported scope limitations, and the assumptions and limiting conditions stated in this report, and they
are the personal analyses, opinions, and conclusion of value of the valuation analyst.
2. The economic and industry data included in the valuation report have been obtained from various
printed or electronic reference sources that the valuation analyst believes to be reliable. The valuation
analyst has not performed any corroborating procedures to substantiate that data.
3. The valuation engagement was performed in accordance with the American Institute of Certified Public
Accountants Statement on Standards for Valuation Services, the Professional Standards of the National
Association of Certified Valuation Analysts, and the Uniform Standards of Professional Appraisal
Practice.
4. The parties to which the information and use of the valuation report is restricted are identified; the
valuation report is not intended to be and should not be used by anyone other than such parties.
5. The analyst’s compensation is fee-based and is not contingent on the outcome of the valuation.
6. No one provided significant professional assistance to the person signing this report.
7. I am in compliance with the American Institute of Certified Public Accountants Accredited in Business
Valuation (ABV) and National Association of Certified Valuation Analysts (CVA) re-certification
requirements.
8. I do not have any direct or indirect, present or contemplated future interest in the Company.
9. Disclosure of the contents of this report is subject to the requirements of the National Association of
Certified Valuation Analysts, and other professional organizations of which I am a member, related to
review by their duly authorized representatives.
David E. Coffman
8
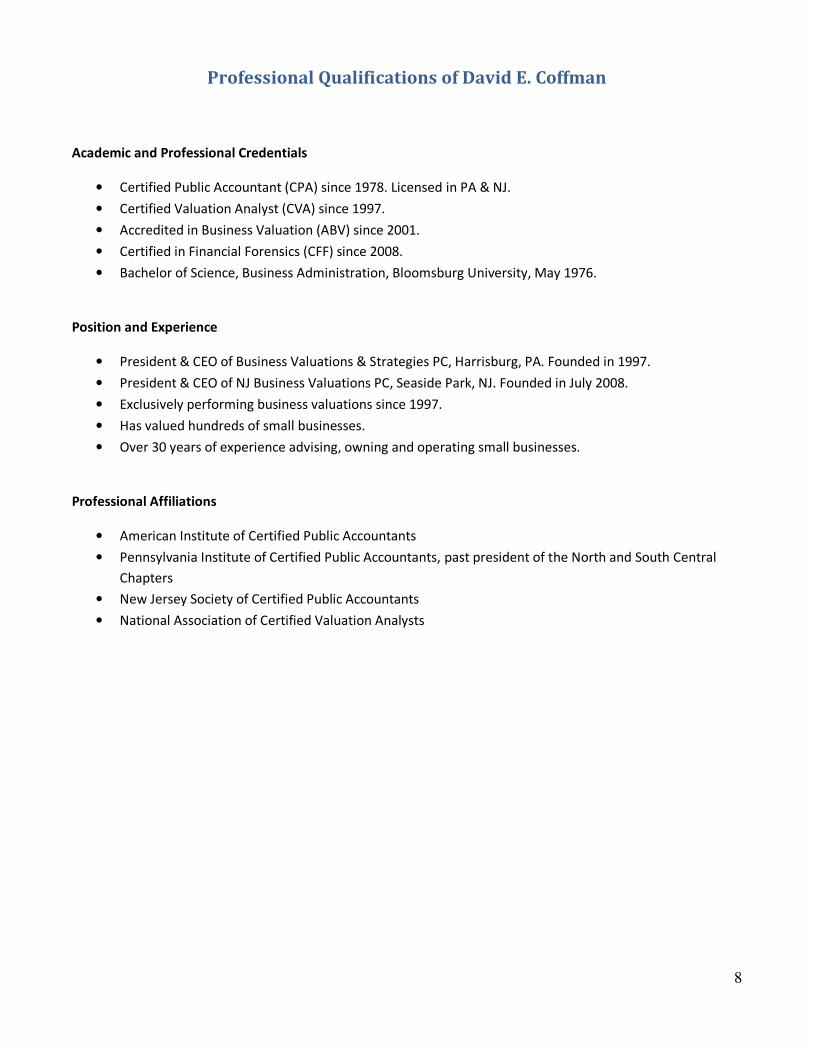
Professional Qualifications of David E. Coffman
Academic and Professional Credentials
• Certified Public Accountant (CPA) since 1978. Licensed in PA & NJ.
• Certified Valuation Analyst (CVA) since 1997.
• Accredited in Business Valuation (ABV) since 2001.
• Certified in Financial Forensics (CFF) since 2008.
• Bachelor of Science, Business Administration, Bloomsburg University, May 1976.
Position and Experience
• President & CEO of Business Valuations & Strategies PC, Harrisburg, PA. Founded in 1997.
• President & CEO of NJ Business Valuations PC, Seaside Park, NJ. Founded in July 2008.
• Exclusively performing business valuations since 1997.
• Has valued hundreds of small businesses.
• Over 30 years of experience advising, owning and operating small businesses.
Professional Affiliations
• American Institute of Certified Public Accountants
• Pennsylvania Institute of Certified Public Accountants, past president of the North and South Central
Chapters
• New Jersey Society of Certified Public Accountants
• National Association of Certified Valuation Analysts

Sample Company, Inc.Summarized Earnings Data
$ % $ % $ %
Sales 218,094 100.0% 233,555 100.0% 215,120 100.0%Cost of sales 73,994 33.9% 79597 34.1% 78046 36.3%
Gross Profit 144,100 66.1% 153,958 65.9% 137,074 63.7%
Labor/Payroll
Owner's compensation 0 0.0% 0 0.0% 0 0.0%
Other salaries & wages 46,439 21.3% 49,409 21.2% 52,776 24.5%
Payroll taxes 4,983 2.3% 5,860 2.5% 6,146 2.9%Employee benefits 0 0.0% 0 0.0% 89 0.0%
Total 51,422 23.6% 55,269 23.7% 59,011 27.4%
Occupancy
Rent 26,624 12.2% 27,120 11.6% 23,407 10.9%Utilities & telephone 12,450 5.7% 12,488 5.3% 10,174 4.7%
Total 39,074 17.9% 39,608 16.9% 33,581 15.6%
Operations
Credit card fees 2,507 1.1% 2,999 1.3% 1,748 0.8%
Vehicle expenses 0 0.0% 0 0.0% 0 0.0%
Supplies 2,263 1.0% 3,105 1.3% 6,088 2.8%
Laundry 1,574 0.7% 546 0.2% 1,001 0.5%
Royalties 13,208 6.1% 15,933 6.8% 12,912 6.0%
Insurance 3,519 1.6% 3,653 1.6% 3,041 1.4%Repairs & maintenance 945 0.4% 2,166 0.9% 1,627 0.8%
Total 24,016 10.9% 28,402 12.1% 26,417 12.3%
Sales/Marketing
Advertising & promotion 5,732 2.6% 1,108 0.5% 2,646 1.2%
General & Administrative
Interest expense 1,333 0.6% 3,600 1.5% 335 0.2%
Professional fees 1,700 0.8% 1,700 0.7% 290 0.1%
Office expenses 2,481 1.1% 5,298 2.3% 5,422 2.5%
Miscellaneous 0 0.0% 654 0.3% 1,364 0.6%
Charitable contributions 0 0.0% 196 0.1% 125 0.1%Travel & entertainment 0 0.0% 325 0.1% 68 0.0%
Total 5,514 2.5% 11,773 5.0% 7,604 3.5%
Non-Cash
Amortization 1,793 0.8% 1,793 0.8% 1,718 0.8%Depreciation 312 0.1% 312 0.1% 9,301 4.3%
Total 2,105 0.9% 2,105 0.9% 11,019 5.1%
Total expenses 127,863 58.6% 138,265 59.2% 140,278 65.2%
Operating Income 16,237 7.4% 15,693 6.7% (3,204) -1.5%
Other income 0 0.0% 0 0.0% 0 0.0%
Net income 16,237 7.4% 15,693 6.7% (3,204) -1.5%
2011 2010 2009
9
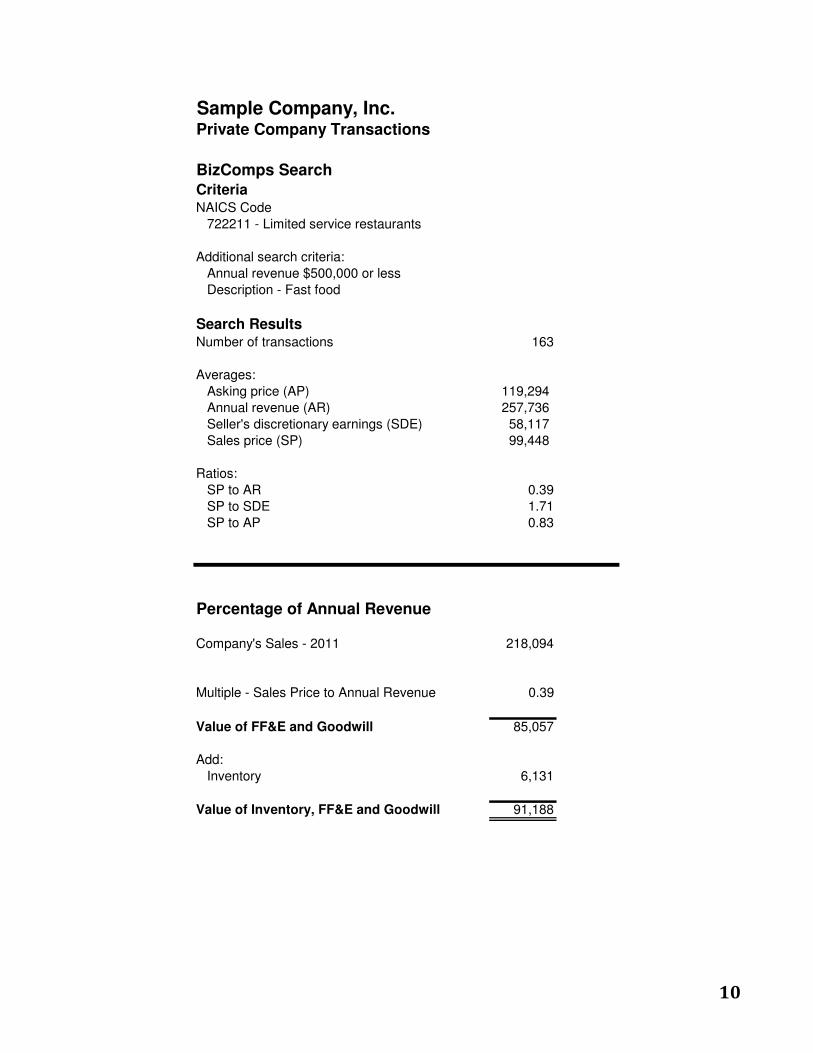
Sample Company, Inc.Private Company Transactions
BizComps SearchCriteriaNAICS Code
722211 - Limited service restaurants
Additional search criteria:
Annual revenue $500,000 or less
Description - Fast food
Search ResultsNumber of transactions 163
Averages:
Asking price (AP) 119,294
Annual revenue (AR) 257,736
Seller's discretionary earnings (SDE) 58,117
Sales price (SP) 99,448
Ratios:
SP to AR 0.39
SP to SDE 1.71
SP to AP 0.83
Percentage of Annual Revenue
Company's Sales - 2011 218,094
Multiple - Sales Price to Annual Revenue 0.39
Value of FF&E and Goodwill 85,057
Add:
Inventory 6,131
Value of Inventory, FF&E and Goodwill 91,188
10

Sample Company, Inc.Private Company Transactions
Multiple of Seller's Discretionary Earnings (SDE)
SDE Calculation
Net income 16,237
Add back:
Owner/officer:
Compensation 0
Payroll taxes (estimate) 0
Interest expense 1,333
Amortization 1,793
Depreciation 312
Discretionary expenses (non-operating):
Vehicle expenses 0
Travel & entertainment 0
Charitable contributions 0
Equipment rent - Related party 4,560
Non-recurring items 0
Total SDE 24,235
Multiple - Sales Price to SDE Ratio 1.71
Value of FF&E and Goodwill 41,442
Add:
Inventory 6,131
Value of Inventory, FF&E and Goodwill 47,573
11

Sample Company, Inc.Capitalized Cash Flow
Adjusted Cash Flow
2011 2010 2009
Net income 16,237 15,693 (3,204)
Add back:
Amortization 1,793 1,793 1,718
Depreciation 312 312 9,301
Interest expense 1,333 3,600 335
Equipment rent - Related party 4,560 4,560 3,690
Total 24,235 25,958 11,840
Average 20,678
Capitalization Rate 25%
Value of operating assets 82,712
Add:
Value of non-operating net assets 0
Value of Inventory, FF&E and Goodwill 82,712
Adjusted Asset Value
12/31/200X
Book
value
Adjusted
value
Inventory 6,131 6,131
Leaseholds & Equipment 31,202 31,202
Franchise fee 16,001 a 6,499 22,500
Organization & startup costs 4,913 b (4,913) 0
Total 58,247 1,586 59,833
Adjustments
a - Adjust franchise fee to original cost
b - Remove organization & startup costs
Adjustments
12

Sample Company, Inc.
2011 2010 2009 Average
Total Assets - BookTotal 83,624 100,735 97,369 93,909
Industry Return on Assets* 8.7% 7.2% 6.0% 7.3%
Adjusted Pre-tax Earnings
Earnings before taxes 16,237 15,693 (3,204)
Adjustments:
Equipment rent - Related party 4,560 4,560 3,690
Total 20,797 20,253 486 13,845
Capitalization Rate
Cash flow rate - mid 25.0%
Pre-tax earnings X 13,845
Cash flow / 20,678Excess earnings rate = 16.7%
Excess Earnings Method
Total assets 93,909
Industry return X 7.3%
Expected earnings = 6,855
Pre-tax earnings 13,845
Excess earnings (pre-tax less expected) 6,990
Capitalization rate / 16.7%
Value of intangible assets = 41,856
Value of tangible net assets + 59,833Value of Inventory, FF&E and Goodwill = 101,689
Footnotes
* - Source: RMA Annual Statement Studies 2006-2007, NAICS 722211, Limited Service Restaurants
Excess Earnings
13

14
Industry Rules of Thumb Pizza Shops
SIC: 5812 - NAICS: 722211
Number of Businesses / Units: 67,500
This U.S. industry comprises establishments primarily engaged in providing food services (except snack and nonalcoholic beverage bars) where patrons generally order or select items and pay before eating. Food and drink may be consumed on
premises, taken out, or delivered to the customer's location. Some establishments in this industry may provide these food
services in combination with selling alcoholic beverages.
Rules of Thumb
35 percent of annual sales plus inventory for independent shops
38 percent of annual sales plus inventory for franchised or chain pizza shops
1.5 to 2 times SDE; plus fixtures, equipment and inventory
4 times monthly sales plus inventory
General Information
"93 percent of Americans eat at least one pizza a month, says a Bolla Wines study.
3 billion pizzas are sold in the United States each year.
There are 69,000 pizzerias in the United States. 1 top pizza topping in India is pickled ginger, minced mutton and paneer. Pepperoni is still tops in this country."
Source: "Counter Service," National Restuarant News (NRN.com), October 18, 2010
Expert Ratings
Competition 2 (1=Lot of : 4= Not Much)
Amount of Risk 2 (1=Very : 4= Not Much)
Historical Profit Trend 2 (1=Down : 4= Up)
Location & Facilities 2 (1=Poor : 4= Excellent)
Marketability 2 (1=Low : 4= High)
Industry Trend 2 (1=Declining : 4= Growing)
Ease of Replication 1 (1=Easy : 4= Difficult) Pricing Tips
"Typical pricing is 20 to 24 times weekly gross sales. Industry insiders and purchasers use this barometer consistently."
"Domino’s Formula—45 percent of the first $400K in annual sales, 50 percent of the next $100K ($400 to $500K) in annual
sales, then 55 percent of the next $250K of annual sales (from $500–$750k)"
"Sole ownership in this type of business results in numbers that are hard to decipher their basis in reality. Be cautious and spend a great deal of time with the owner to truly understand the earnings of the business."

15
Benchmarks
How many units do you own?
1 79.1%
2 to 3 13.3%
4 to 10 5.1%
10 to 20 1.3%
More than 20 Units 0.6%
More than 50 Units 0.6%
What type of location do you own?
Stand-alone 47.5%
Shopping center 13.9%
Strip mall 33.5%
C-store 0.6%
Other 4.4%
What percentage of your business is delivery?
5 to 10% 10.9%
11 to 20% 10.3%
21 to 30% 14.1%
31 to 40% 15.4%
More than 40% 17.3%
Don't offer delivery 32.1%
What are the average yearly sales at each of your stores?
Less than $250,000 24.3%
$300,00 to $500,000 36.8%
$550,000 to $750,000 14.5%
$750,000 to $1 million 8.6%
$1 million to $2 million 6.6%
More than $2 million 0.7%
More than $5 million 0.0%
Decline to answer 8.6%

16
Which segment of your sales, as reported above, has seen the most growth during the last year?
Dine-in 22.4%
Takeout 35.9%
Take and bake 0.6%
Delivery 18.6%
Catering 3.2%
Buffet 1.9%
How many direct competitors do you have within a 10-mile radius?
Less than 5 30.4%
5 to 9 36.1%
10 to 15 13.3%
More than 15 20.3%
In general, are your sales increasing, decreasing or about the same compared to last year?
Increasing 51.9%
Decreasing 20.3%
Same 27.8%
Do you offer pizza by the slice?
Yes 53.8%
No 46.2%
What percentage of your budget is spent on advertising?
Less than 2% 32.9%
2% to 5% 37.5%
6% to 7% 10.5%
8% to 10% 9.2%
More than 10% 5.9%
We don't advertise 3.9%
The above is from a 2011 Survey conducted by Pizza Monthly Quarterly (PMQ,com). This is a wonderful site and should be used by anyone involved in the pizza shop business.
"The top 50 franchises/chains per-unit sales averaged $636,507 for the period June 2009 to June 2010. The average for the prior period was $642,290.
"The per-unit sales for independent stores averaged $501,314 for the same period. For the prior period the average was
$470,426, 'showing that many consumers still favor the customized service they receive at a mom-and-pop shop.'

17
"The per-unit sales for all stores averaged $558,671 for the same period.
"Independents own 58 percent of pizzerias—and control 51.66 percent of the sales.
"The top 50 chains/franchises own 42 percent of pizzerias and control 48.34 percent of the sales."
Source: Pizza Power Report 2010 published by PMQ, the pizza industry's business monthly. If you are involved in the pizza industry in any way, you have to subscribe to this publication. It is a must. Go to www.pmq.com
"Keep food costs below 30 percent, and labor, not counting manager’s salary, below 20 percent."
"Luke Bailey, owner of the two-unit Pizza Company in Davison, MI, keeps 10 to 14 days’ worth of inventory on hand and
schedules a running inventory only sporadically. ‘If I can keep 61 percent on food and payroll, I’m OK,’ he said."
Food Cost 28% to 30%
Payroll/Labor 25% to 30%
Occupancy 6% to 8%
Expenses as a Percentage of Sales
Cost Of Goods 28%
Payroll/Labor Costs 25%
Occupancy Costs 08%
Profit (pretax) 12%
Industry Trend
"What franchised segment of the restaurant business do you find the most interesting? It has to be pizza. You've got
15,000 to 16,000 outlets between four or five giant chains, and yet every day someone opens a new franchised pizza concept that goes on to make millions. Everybody says pizza is saturated, that there's no growth. But the fact is
franchisors and franchisees are making money with new pizza concepts all the time."
Source: "'Franchising guru' Kestenbaum: Businesses grow when franchises are making money consistently" by Milford Prewitt, National Restaurant News, February 18, 2008
Advantages
• "Low-priced food with appeal to all ages, genders, etc. Widening variety of product offerings to entice a larger segment
of the population."
• "Ease of operation and ease of entry"
Disadvantages
• "High-fat food content. Increasing number of franchised and independent pizzerias limit the growth potential."
• "Hard work, long hours"
Additional Resources
Trade Publications
• FranchiseTimes
• Guide to a Successful Pizza Business & Pizza Business Manual by Paul Shakarian
• Nation's Restaurant News—This is one publication you must have if you're marketing any type of food operation,
including pizza stores
• Pizza Marketing Quarterly—This is a wonderful site. If you are serious about selling pizza businesses, you have to visit
it.