Embed Size (px)
Citation preview
Business Valuation of
Erin’s Fitness Gear, Inc.
As of June 30, 2013
Prepared for:
Erin K. O’Donnell
President
Erin’s Fitness Gear
100 Erskine Plaza
South Bend, IN 46614-3244
Report Date:
July 30, 2013
Prepared by:
Patrick Keszei, CPA, CFP, CVA, EA, MBA
Manager of Business Valuation Services
Business ValueCalc
1456 Lincolnway East
South Bend, IN 46613-3249

July 30, 2013
Patrick Keszei, CPA, CFP, CVA, EA, MBA
Manager of Business Valuation Services
Business ValueCalc
1456 Lincolnway East
South Bend, IN 46613-3249
Erin K. O’Donnell
President
Erin’s Fitness Gear, Inc.
100 Erskine Plaza
South Bend, IN 46614-3244
RE: Erin’s Fitness Gear, Inc.
Dear Erin K. O’Donnell:
At your request, we have performed a valuation engagement, as defined in the Statement on Standards for
Valuation Services (SSVS) of the American Institute of Certified Public Accountants. This valuation was
performed solely to assist in the matter of establishing the fair market value of 80% of Erin’s Fitness Gear,
Inc’s non-voting common shares as of June 30, 2013. This value should not be used for any other purpose or
by any other party for any purpose. This valuation engagement was conducted in accordance with the
SSVS. The estimate of value that results from a valuation engagement is expressed as a conclusion of
value.
We have estimated the Fair Market Value on a minority interest, non-marketable basis for 80.00% of Erin’s
Fitness Gear, Inc.'s non-voting common shares as of June 30, 2013 as described within the valuation report.
Our conclusion is $1,990,000.00 or 1.31718 per share. This conclusion is subject to the Statement of
Assumptions and Limiting Conditions and the Representations presented in the following report. We have
no obligation to update this report or our conclusion of value for information that comes to our attention
after the date of this report.
In arriving at this opinion of value, we relied on a “value in use” or going-concern premise. This premise
assumes that the Company is an ongoing business enterprise with management operating in a rational way
with a goal of maximizing shareholder value.
Sincerely,
________________________
(Signature)
July 30, 2013
(Date)

— Table of Contents —
VALUATION OBJECTIVE AND SUMMARY ...................................................................................................... 1
EXTERNAL SOURCES OF INFORMATION ........................................................................................................ 3
INTERNAL SOURCES OF INFORMATION ......................................................................................................... 3
ASSUMPTIONS AND LIMITING CONDITIONS ......................................... ERROR! BOOKMARK NOT DEFINED.
COMPANY BACKGROUND ............................................................................................................................. 6
Company Identification .......................................................................................................................... 6
Nature and History of the Company ....................................................................................................... 6
Stock Classes and Ownership ................................................................................................................. 7
Management Team ................................................................................................................................. 7
Product and Service Information ............................................................................................................ 7
Market Data and Analysis/Competition ................................................................................................. 8
Governmental or Regulatory Environment ............................................................................................ 8
Key Customers and Suppliers ................................................................................................................ 8
Marketing Strategy ................................................................................................................................. 8
Business Risks ........................................................................................................................................ 8
Current Operations ................................................................................................................................. 8
Company Expectations ........................................................................................................................... 9
Other Observations ................................................................................................................................. 9
NATIONAL ECONOMIC AND INDUSTRY CONDITIONS .................................................................................. 10
General Economic Conditions and Outlook ......................................................................................... 10
Industry Conditions and Outlook ......................................................................................................... 10
HISTORICAL AND NORMALIZED FINANCIAL STATEMENTS......................................................................... 11
Summary Historical Income Statements .............................................................................................. 11
Income Statement Adjustments ............................................................................................................ 11
Normalized Historical Income Statements ........................................................................................... 12

Summary Historical Balance Sheets .................................................................................................... 12
Balance Sheet Adjustments .................................................................................................................. 13
Normalized Historical Balance Sheets ................................................................................................. 14
Summary Historical Statements of Cash Flows ................................................................................... 14
Normalized Earnings and Net Cash Flow Summary ............................................................................ 15
Normalized Earnings ..................................................................................................................... 15
Normalized Equity Net Cash Flows (FCF-Equity) ........................................................................ 15
Normalized Invested Capital Net Cash Flows (FCF-TIC) ............................................................. 16
Normalized Interim Financial Statements ............................................................................................ 16
ANALYSIS OF HISTORIC FINANCIAL STATEMENTS ..................................................................................... 18
Common-Size (Percentage) Financial Statements ............................................................................... 19
Integra Industry Data, Common-Size Statement Comparison ....................................................... 22
RMA Industry Data, Common-Size Statement Comparison ......................................................... 27
Financial Ratio Analysis....................................................................................................................... 30
Integra Industry Data, Ratio Comparison ...................................................................................... 34
RMA Industry Data, Ratio Comparison ........................................................................................ 39
Integra Industry Data, Growth Comparison ................................................................................... 41
VALUATION OF ERIN’S FITNESS GEAR, INC. ......................................................................................... 44
Overview of Valuation Approaches and Methods ............................................................................... 46
Nonoperating Assets and Liabilities ..................................................................................................... 47
Preferred Stock Valuation .................................................................................................................... 47
Income Approach ................................................................................................................................. 48
Discount & Capitalization Rate Estimates ..................................................................................... 48
Subject Company Data Used in Capitalization of Earnings and Excess Earnings Methods ......... 49
Capitalization of Earnings Method ................................................................................................ 49
Capitalization of Excess Earnings ................................................................................................. 50
Discounted Future Earnings ........................................................................................................... 52
Market Approach .................................................................................................................................. 54
Subject Company Data Used in Market Approach ........................................................................ 55
Done Deals Transactions Method .................................................................................................. 56
Equity Value Conclusions .................................................................................................................... 62
Enterprise-Level Equity Value ...................................................................................................... 62
Shareholder-Level and Per-Share Valuation .................................................................................. 64
APPENDIX — REPRESENTATIONS ............................................................................................................... 67
APPENDIX — QUALIFICATIONS .................................................................................................................. 68
APPENDIX — PROJECTIONS & ASSUMPTIONS ............................................................................................ 69
Projection Summary....................................................................................................................... 69
Summary Income Statement Projections ....................................................................................... 69
Summary Balance Sheet Projections ............................................................................................. 70
Summary Retained Earnings Projections ....................................................................................... 70
Summary Cash Flow Projections ................................................................................................... 71
Summary Sources & Uses of Funds Projections ........................................................................... 71
Overview of Projection Assumptions ............................................................................................ 71
Revenue & Expense Assumptions ................................................................................................. 72
Fixed Asset Depreciation Assumptions ......................................................................................... 72
Disposals of Existing Fixed Assets ................................................................................................ 73
Fixed Asset Purchases.................................................................................................................... 73
Existing Notes Receivable Assumptions ....................................................................................... 74
Amortization of Intangible Assets ................................................................................................. 74
Existing Notes Payable Assumptions ............................................................................................ 74
Fixed Asset Purchase Financing Assumptions .............................................................................. 74
Dividends Assumptions ................................................................................................................. 75
1
Valuation Objective and Summary
Assignment Objective
We were engaged by Erin K. O’Donnell, President of Erin’s Fitness Gear, Inc., to issue a business valuation report.
Our objective was to estimate the Fair Market Value of 80.00% of Erin’s Fitness Gear, Inc.'s non-voting common
shares as of June 30, 2013.
Company Description
Erin’s Fitness Gear, Inc. is a C-Corporation and is organized under the laws of Indiana. The Company is primarily
engaged in the business of manufacturing and wholesaling of fitness gear, supplies, clothing and equipment. The
Company is doing business as Erin’s Fitness Gear.
Qualifications of Appraiser
This report was prepared by Patrick Keszei, Manager of Business Valuation Services of Business ValueCalc.
Patrick Keszei holds the following professional designations and certifications: CPA, CFP, CVA, EA, MBA.
Please refer to the appendix – qualifications for his curriculum vitae.
Purpose of Valuation
The purpose of this valuation is to determine the fair market value of 80.00% of Erin’s Fitness Gear, Inc.’s
non-voting common shares as of June 30, 2013. This report is prepared for Erin K. O’Donnell, President, and
should not be used by others. This report is dated July 30, 2013.
Standard of Value
The standard of value used in our valuation of Erin’s Fitness Gear, Inc. is Fair Market Value. Fair Market Value is
defined in IRS Revenue Ruling 59-60 as: “The price at which the property would change hands between a willing
buyer and a willing seller when the former is not under any compulsion to buy and the latter is not under any
compulsion to sell, both parties having reasonable knowledge of relevant facts. Court decisions frequently state in
addition that the hypothetical buyer and seller are assumed to be able, as well as willing, to trade and to be well
informed about the property and concerning the market for such property.”
Premise of Value
Our opinion of value relied on a “value in use” or going-concern premise. This premise assumes that the Company
is an ongoing business enterprise with management operating in a rational way with a goal of maximizing
shareholder value.
Scope of Work
Our analysis considers those facts and circumstances present at the Company at the valuation date. Our opinion
would most likely be different if another valuation date was used. There were no restrictions or limitations in the
scope of our work or in the data available for analysis, and no hypothetical assumptions were used.
The factors we considered include the history of the business, economic outlook, financial condition of the business,
earnings and dividend paying capacity, book value of the stock and the size of the block being valued, prior sales of
2
the Company's stock, goodwill and intangible value, and the market prices for publicly traded and privately held
companies in the same or similar line of business.
Valuation Procedures
To arrive at our conclusion of value, we performed the following procedures:
Identified the nature of the business and reviewed the history of the Company since its inception.
Researched the general economic outlook and the outlook for the specific industry at the date of the valuation.
Collected the Company's relevant historic financial statements.
Analyzed the historic financial statements by calculating financial ratios and common-size financial statements
for each historic year in order to identify trends.
Compared the Company's financial ratios and common-size financial statements to industry guideline data to
identify any significant variances.
Assisted management in preparing a five year projection of the financial statements based on management's
assumptions as to the Company's future outlook.
Analyzed Goodwill and other intangible value.
Identified and analyzed prior sales of the Company's stock.
Developed risk-adjusted Capitalization and Discount Rates to apply to the Company's historic and projected
earnings, respectively.
Collected and analyzed transactional data from comparable companies within the same industry.
Adjusted historic earnings to eliminate the effects of excess and discretionary expenses, nonoperating revenues
and expenses, and non-transferable revenue streams.
In reaching the conclusion of value, we considered the asset, income, and market valuation approaches and the
following methods under each approach.
1. Asset Approach
Net Asset Value
Liquidation Value.
2. Income Approach
Capitalization of Earnings
Capitalization of Excess Earnings
Multiple of Discretionary Earnings
Discounted Future Earnings/Discounted Cash Flow.
3
3. Market Approach
Price multiples from sales of comparable businesses from the following data sources:
BIZCOMPS
IBA Database
Done Deals
Pratt's Stats
Other Data Source
FactSet Mergerstat Review
Guideline Public Company Data
Selected the most reasonable enterprise-level equity value from the range of values established in the valuation
methods
Applied any appropriate enterprise-level discounts and/or premiums to arrive at an enterprise-level equity
value.
Allocated the conclusion of enterprise-level equity value between voting and non-voting shares based on a
premium assigned to the voting shares.
Calculated the total number of shares assuming dilution from convertible preferred stock and the in-the-money
options and warrants.
Calculated the shareholder-level value of the 80.00% interest.
Applied any appropriate shareholder-level discounts and/or premiums to arrive at our conclusion of value for
the specific block of shares.
External Sources of Information
To aid us in our analysis of the Company, we searched a number of publicly available sources of information.
Numerous financial publications and databases were consulted including Business Statistics, Standard & Poor's
Industry Surveys, Ibbotson Associates' Stocks, Bonds, Bills and Inflation 200X Yearbook, Mergerstat Review, U.S.
Financial Data, Standard & Poor's Register of Corporations, Directors, and Executives, Disclosure, Inc. on-line
database, and Value Line Investment Survey. Integra Industry Data and RMA Industry Data were used for ratio
analysis and comparative industry data.
Internal Sources of Information
To aid us in our analysis of the Company, we interviewed the following personnel:
Erin K. O’Donnell: President
4
Izaak Katz: Vice President
Albert Johnson: Chief Operations Officer
Victor J. Spaniolo, CPA: Chief Financial Officer
Joey Husband: Chief Information Officer
We conducted a complete tour of the facilities and spoke with numerous company personnel.
We collected the following source data:
Five years of audited financial statements
Interim financial statements
Five years of corporate tax returns.
Company bylaws & minutes
Assumptions and Limiting Conditions
This valuation is subject to the following assumptions and limiting conditions:
1. Public, industry, statistical, and other information furnished by others, upon which all or portions of this
analysis is based, is believed to be reliable. However, we make no representation as to the accuracy or
completeness of such information and have performed no procedures to corroborate the information.
2. The Company and its representatives warranted to us that the information they supplied was complete and
accurate to the best of their knowledge and that the financial statement information reflects the Company's
results of operations and financial and business condition in accordance with generally accepted accounting
principles, unless otherwise noted. The financial statements and other related information supplied by
management has been accepted as correct without further verification. We have not audited, reviewed, or
compiled the financial information provided to us and, accordingly, we express no audit opinion or any
other form of assurance on this information.
3. This report and conclusion of value is restricted to the internal use of the management of the Company for
the sole and specific purpose as noted herein, and shall not be used to obtain credit or for any other purpose
or by any other party for any purpose. Neither our work product nor any portions thereof, including any
conclusions or the identity of our firm, any individuals signing or associated with this report, or the
professional associations or organizations with which they are affiliated, shall be disseminated to third
parties other than the Company, its financial accounting firm and attorneys, and governmental agencies by
any means without our prior written consent and approval.
4. We or any individual associated with this assignment are not required to provide future services regarding
the subject matter of this report, including but not limited to providing further consultation, providing
testimony, or appearing in court or other legal proceedings unless specific arrangements have been made.
5
5. The conclusion of value is valid only for the stated purpose as of the valuation date indicated. We take no
responsibility for changes in market conditions and assume no obligation to revise our conclusion of value
to reflect events or conditions which occur subsequent to the valuation date.
6. Full compliance by the Company with all applicable federal, state, and local zoning and use, occupancy,
environmental, and similar laws and regulations is assumed, unless otherwise stated. Furthermore, no effort
has been made to determine the possible effect, if any, on the Company due to future Federal, state, or local
legislation including any environmental or ecological matters or interpretations thereof, unless otherwise
stated.
7. This report and the conclusion of value arrived at herein are not intended by the author and should not be
construed by the reader to be investment advice in any manner whatsoever. The conclusion of value
represents the considered opinion of Business ValueCalc based on information furnished to them by the
Company and other sources.
8. We do not provide assurance on the achievability of the results forecasted by the Company because events
and circumstances frequently do not occur as expected; differences between actual and expected results
may be material; and achievement of the forecasted results is dependent on actions, plans, and assumptions
of management.
9. For the prospective financial information approved by management that was used in our engagement, we
have not examined or compiled the prospective financial information and therefore, do not express an audit
opinion or any other form of assurance on the prospective financial information or the related assumptions.
Events and circumstances frequently do not occur as expected and there will usually be differences between
prospective financial information and actual results, and those differences may be material.
10. We are not environmental consultants or auditors, and we take no responsibility for any actual or potential
environmental liabilities. Any person entitled to rely on this report, wishing to know whether such liabilities
exist, or the scope and their effect on the value of the property, is encouraged to obtain a professional
environmental assessment. We do not conduct or provide environmental assessments and have not
performed one for the subject property.
11. We have not determined independently whether the Company is subject to any present or future liability
relating to environmental matters, including but not limited to CERCLA/Superfund liability, nor the scope
of any such liabilities. Our valuation takes no such liabilities into account, except as they have been
reported to us by the Company or by an environmental consultant working for the Company, and then only
to the extent that the liability was reported to us in an actual or estimated dollar amount. Such matters, if
any, are noted in the report. To the extent such information has been reported to us, we relied on it without
verification and offer no warranty or representation as to its accuracy or completeness.
12. Except as noted, we have relied on the representations of the owners, management, and other third parties
concerning the value and useful condition of all equipment, real estate, and any other assets or liabilities,
except as specifically stated to the contrary in this report. We have not attempted to confirm whether all
assets of the business are free and clear of liens and encumbrances or that the Company has good title to all
assets.
13. Neither all nor any part of the contents of this report (including the conclusion of value, the identity of any
6
valuation specialist(s), the firm with which such valuation specialists are connected, or any reference to any
of their professional designations) should be disseminated to the public through advertising media, public
relations, news media, sales media, mail, direct transmittal, or any other means of communication without
our prior written consent and approval.
14. We have not made a specific compliance survey or analysis of the subject property to determine whether it
is subject to, or in compliance with, the American Disabilities Act of 1990, and this valuation does not
consider the effect, if any, of noncompliance.
15. No change of any item in this valuation report shall be made by anyone other than, and we shall have no
responsibility for any such unauthorized change.
16. We have conducted interviews with the current management of the Company concerning the past, present,
and future operating results of the Company.
17. This conclusion of value assumes that the Company will continue to operate as a going concern, and that the
character and integrity of the Company through any sale, reorganization, exchange, or diminution of the
owners' participation would not be materially or significantly changed. It also assumes that the current level
of management expertise and effectiveness would continue to be maintained.
Company Background
Company Identification
Erin’s Fitness Gear, Inc. is a C-Corporation organized under the laws of Indiana and is located at 100 Erskine Plaza,
South Bend, IN 46614-3244.
Nature and History of the Company
Erin’s Fitness Gear, Inc. was established in 2001 and operates under the trade name of Erin’s Fitness Gear.
The following table describes the business activities in which Erin’s Fitness Gear, Inc. is engaged and lists the
NAICS/SIC Codes for the industry associated with each business activity:
Business Activity Description NAICS SIC

7
Primary Business Activity Fitness Products Manufacturing 339920 3949
Secondary Business Activity Fitness Product Wholesale 421910 5091
Erin’s Fitness Gear, Inc. commenced operations in January of 2001. The company started with one wholesale
location and quickly grew to five outlets. In 2005, the company built a manufacturing facility. This vertical
integration enabled Erin’s to custom-design their products and control costs. The Company offers a full line of
fitness gear. Please refer to the Company’s website: www.erinsfitnessgear.com for a full listing of all their
products.
Stock Classes and Ownership
The following table lists the owners of Erin’s Fitness Gear, Inc.’s commons stock as of the valuation date, June 30,
2013. The number of shares, equity class and other details are presented for each owner.
Number Percent Equity Active in Number
Classes of Common Stock of Shares Ownership Class Business of Votes Preemptive Dividends
Izaak Katz 3,000,000 37.50% A Yes 3,000,000 0
Erin K. O’Donnell 4,000,000 50.00% A Yes 4,000,000 0
Other Shareholders 1,000,000 12.50% No 0 0
Total 8,000,000 100.00%
Management
Outlined below is a list of the Company’s managerial staff:
Erin K. O’Donnell: President
Izaak Katz: Vice President
Albert Johnson: Chief Operations Officer
Victor J. Spaniolo, CPA: Chief Financial Officer
Joey Husband: Chief Information Officer.
Product and Service Information
The Company is a manufacturer and wholesaler of fitness goods, primarily exercise equipment. The products are
of exquisite quality. Erin’s products compete with mid to high-end fitness gear manufacturers and wholesalers.
Erin’s niche is the “selective customer” who needs the best and most durable fitness equipment, supplies and gear
8
available. Please refer to Erin’s website for a full product catalog at www.erinsfitnessgear.com
Market Data and Analysis/Competition
Brunswick Corporation (Life Fitness) and Johnson Health Tech. Co., Ltd, are the major players in this industry.
Competitive rivalry in the industry is high. The existing players continuously try to maintain their market shares
and drive growth by entering new regions and introducing technologically advanced products and product
innovations. Right now, this market represents stiff competition. The players are established and the economy is
well below par and exercise equipment is not a recession proof product. In the future, as the world economy grows
and more foreign countries vie for fitness center, long-term growth potential exists.
Governmental or Regulatory Environment
Erin’s Fitness Gear, Inc. has a capable quality control, accounting, legal and human resource departments. The
Company has adhered to all governmental and regularity laws and rules. We visualize that the company will
continue its record of excellence and will continue to place a material emphasis on this topic.
Key Customers and Suppliers
The Company sells their fitness gear to numerous fitness clubs, sporting goods stores and large merchandise
retailers. It also purchases their inventory, material and supplies from numerous vendors. The company views this
diversification as a strength because it is does not rely on a few customers or a few vendors. The list of customers
and vendors would be impractical to list here. In summary, the company’s customers and vendors are diversified.
Marketing Strategy
Erin’s current marketing strategy is to develop the foreign markets. The company will concentrate their efforts on
the countries with the most growth potential, such as China and India. The domestic market is somewhat saturated
and growth lies with the developing economies of the world. All else remains the same. Erin’s will continue to
market to the mid-level to high-end customer.
Business Risks
The top business risk for Erin’s is the oversaturation of the market with physical fitness equipment. Numerous
companies manufacture and market physical fitness gear. The domestic market is mature. This can create an
abundant supply and place downward pressure on pricing, thus reducing net profit. The company’s strategy is to
maintain our domestic presence and pursue the growing foreign markets.
Current Operations
The corporate office of Erin’s Fitness Gear is headquartered in South Bend, Indiana. The company owns two
manufacturing facilities, one in South Bend and the other in Clarion, Pennsylvania. Eight retail stores are scattered
through the Midwest. The Company has an excellent logistic system. Upon product completion, the goods are
transported by truck to the various retail stores. A “just in time” inventory system is used to maintain cost controls.
The company recently passed their ISO 9000 audit. The company undergoes an annual financial statement audit by
their CPA firm each year and is in full compliance.
9
Company Expectations
The Company expects sales to grow by about three to four percent per year. Profitability is important, however,
the current plan is to invest profits into the company, reduce debt and pursue the foreign markets. The company
expects that this strategy will provide long-term growth and profitability.
Other Observations
None
10
National Economic and Industry Conditions
General Economic Conditions and Outlook
The United States economy slowed in the second quarter amid weak consumer spending, government cuts and a rise
in imports from foreign countries. As of June 30, 2013, the Gross Domestic Product (GDP) of the United States
grew at an annual rate of 1.7%, from April to June. That’s significantly down from a forty year average growth rate
of 3.23%%.
US inflation rose 1.8 percent over the last year ending June 30, 2013. The nation’s unemployment rate was slightly
down at 7.6 % for the second consecutive month, the Labor Department reported. The economic forecast is not
great and not gloomy, but rather unpredictable. The best bet is the economy will be rather stable with no extreme
ups or downs. The world’s best economists and investors predict that the upcoming twelve month period will be a
year of volatility and uncertainty for the markets and global economy, as a whole.
Industry Conditions and Outlook
The global fitness equipment industry is forecast to grow with a compound annual growth rate of 3.5% over the next
five years (2013 – 2018) and reach an approximate 10.6 billion by 2018. Rising concern and awareness for healthful
living, physical benefits and exercise are among the major drivers for fitness equipment demand around the world.
Several drivers are anticipated to fuel the market during the next five years. Among these are the rapid
modernization of economies with increasing spending capacity; the opening of new fitness centers & clubs and
expansion of existing players in emerging economies: the World Health Organizations’s physical activity
recommendations and governmental efforts to promote the benefits of exercise. The industry is expected to
expand its presence in India and China, as they possess good growth opportunities with expanding, new upper class
populations and increasing purchasing power

11
Historical and Normalized Financial Statements
A summary of the historic Income Statements, Balance Sheet, and Cash Flows for Erin’s Fitness Gear, Inc. is
presented in the following section.
Financial statement data is necessary in order to analyze the historic performance of the business and how that
performance compares to its peers in the industry. Prior revenues, expenses and earnings provide a baseline for
estimating future earnings and cash flows.
Summary Historical Income Statements
The following tables provide a summary of Erin’s Fitness Gear, Inc.'s Income Statements.
2008 2009 2010 2011 2012
Net Sales Revenue 25,302,860 26,494,580 28,043,400 29,219,270 31,541,420
Total Cost of Goods Sold 20,165,679 21,681,757 22,263,336 22,943,789 23,870,297
Gross Profit 5,137,181 4,812,823 5,780,064 6,275,481 7,671,123
Total Selling Expenses 749,750 813,180 917,500 997,500 1,316,990
Total General & Administrative Expenses 3,037,730 2,486,432 3,319,075 3,616,368 4,129,399
Income From Operations 1,349,701 1,513,211 1,543,489 1,661,613 2,224,734
Total Other Revenues and Expenses (623,774) (613,150) (563,153) (533,769) (486,062)
Income Before Taxes 725,927 900,061 980,336 1,127,844 1,738,672
Total Income Taxes 283,111 351,024 382,331 439,859 678,082
Net Income 442,816 549,037 598,005 687,985 1,060,590
Income Statement Adjustments
In order to estimate the value of Erin’s Fitness Gear, Inc., it was necessary to make certain normalization
adjustments to the Income Statements. Normalization adjustments are made to reflect the Company's true
economic earnings by eliminating excessive, nonoperating, non-recurring and/or unusual items. The following
table presents a summary of the adjustments that were made to Erin’s Fitness Gear, Inc.'s earnings.
2008 2009 2010 2011 2012
Add/(Deduct) Income Adjustments:
Nonoperating Income (20,000) (30,000) (40,000) (50,000) (60,000)
Total Income Adjustments (20,000) (30,000) (40,000) (50,000) (60,000)
Add/(Deduct) Expense Adjustments:
Officer/Owner's Compensation (50,000) (75,000) (100,000) (125,000) (150,000)
12
Office Utilities (5,000) (5,000) (10,000) (15,000) (20,000)
Less: Nonoperating Expense (10,000) (20,000) (30,000) (40,000) (50,000)
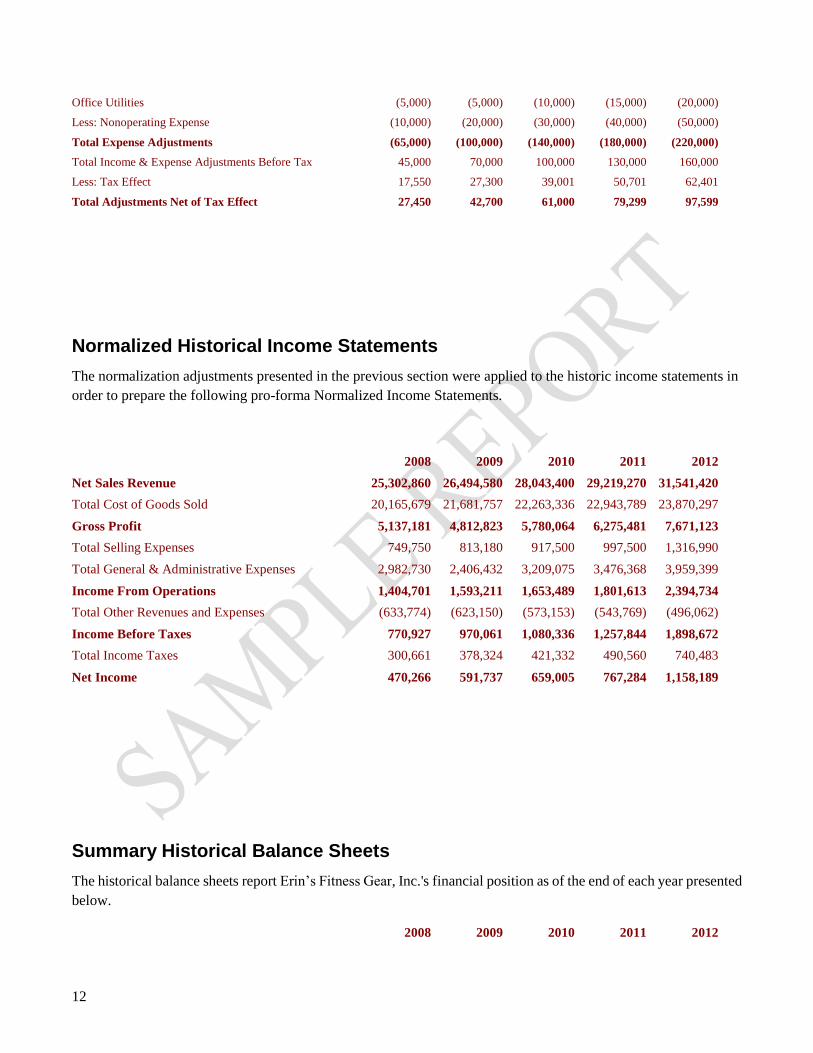
Total Expense Adjustments (65,000) (100,000) (140,000) (180,000) (220,000)
Total Income & Expense Adjustments Before Tax 45,000 70,000 100,000 130,000 160,000
Less: Tax Effect 17,550 27,300 39,001 50,701 62,401
Total Adjustments Net of Tax Effect 27,450 42,700 61,000 79,299 97,599
Normalized Historical Income Statements
The normalization adjustments presented in the previous section were applied to the historic income statements in
order to prepare the following pro-forma Normalized Income Statements.
2008 2009 2010 2011 2012
Net Sales Revenue 25,302,860 26,494,580 28,043,400 29,219,270 31,541,420
Total Cost of Goods Sold 20,165,679 21,681,757 22,263,336 22,943,789 23,870,297
Gross Profit 5,137,181 4,812,823 5,780,064 6,275,481 7,671,123
Total Selling Expenses 749,750 813,180 917,500 997,500 1,316,990
Total General & Administrative Expenses 2,982,730 2,406,432 3,209,075 3,476,368 3,959,399
Income From Operations 1,404,701 1,593,211 1,653,489 1,801,613 2,394,734
Total Other Revenues and Expenses (633,774) (623,150) (573,153) (543,769) (496,062)
Income Before Taxes 770,927 970,061 1,080,336 1,257,844 1,898,672
Total Income Taxes 300,661 378,324 421,332 490,560 740,483
Net Income 470,266 591,737 659,005 767,284 1,158,189
Summary Historical Balance Sheets
The historical balance sheets report Erin’s Fitness Gear, Inc.'s financial position as of the end of each year presented
below.
2008 2009 2010 2011 2012
13
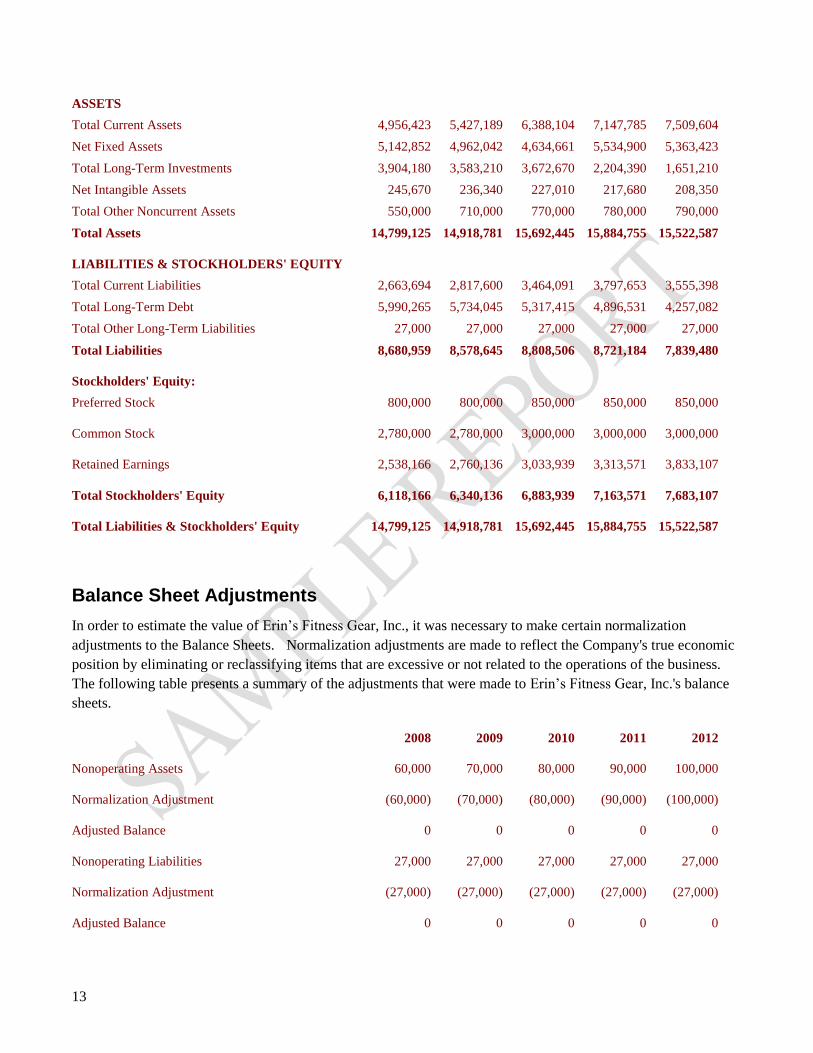
ASSETS
Total Current Assets 4,956,423 5,427,189 6,388,104 7,147,785 7,509,604
Net Fixed Assets 5,142,852 4,962,042 4,634,661 5,534,900 5,363,423
Total Long-Term Investments 3,904,180 3,583,210 3,672,670 2,204,390 1,651,210
Net Intangible Assets 245,670 236,340 227,010 217,680 208,350
Total Other Noncurrent Assets 550,000 710,000 770,000 780,000 790,000
Total Assets 14,799,125 14,918,781 15,692,445 15,884,755 15,522,587
LIABILITIES & STOCKHOLDERS' EQUITY
Total Current Liabilities 2,663,694 2,817,600 3,464,091 3,797,653 3,555,398
Total Long-Term Debt 5,990,265 5,734,045 5,317,415 4,896,531 4,257,082
Total Other Long-Term Liabilities 27,000 27,000 27,000 27,000 27,000
Total Liabilities 8,680,959 8,578,645 8,808,506 8,721,184 7,839,480
Stockholders' Equity:
Preferred Stock 800,000 800,000 850,000 850,000 850,000
Common Stock 2,780,000 2,780,000 3,000,000 3,000,000 3,000,000
Retained Earnings 2,538,166 2,760,136 3,033,939 3,313,571 3,833,107
Total Stockholders' Equity 6,118,166 6,340,136 6,883,939 7,163,571 7,683,107
Total Liabilities & Stockholders' Equity 14,799,125 14,918,781 15,692,445 15,884,755 15,522,587
Balance Sheet Adjustments
In order to estimate the value of Erin’s Fitness Gear, Inc., it was necessary to make certain normalization
adjustments to the Balance Sheets. Normalization adjustments are made to reflect the Company's true economic
position by eliminating or reclassifying items that are excessive or not related to the operations of the business.
The following table presents a summary of the adjustments that were made to Erin’s Fitness Gear, Inc.'s balance
sheets.
2008 2009 2010 2011 2012
Nonoperating Assets 60,000 70,000 80,000 90,000 100,000
Normalization Adjustment (60,000) (70,000) (80,000) (90,000) (100,000)
Adjusted Balance 0 0 0 0 0
Nonoperating Liabilities 27,000 27,000 27,000 27,000 27,000
Normalization Adjustment (27,000) (27,000) (27,000) (27,000) (27,000)
Adjusted Balance 0 0 0 0 0
14
Net Adjustments:
Asset Adjustments (60,000) (70,000) (80,000) (90,000) (100,000)
Less: Liability Adjustments (27,000) (27,000) (27,000) (27,000) (27,000)
Retained Earnings Adjustment (33,000) (43,000) (53,000) (63,000) (73,000)
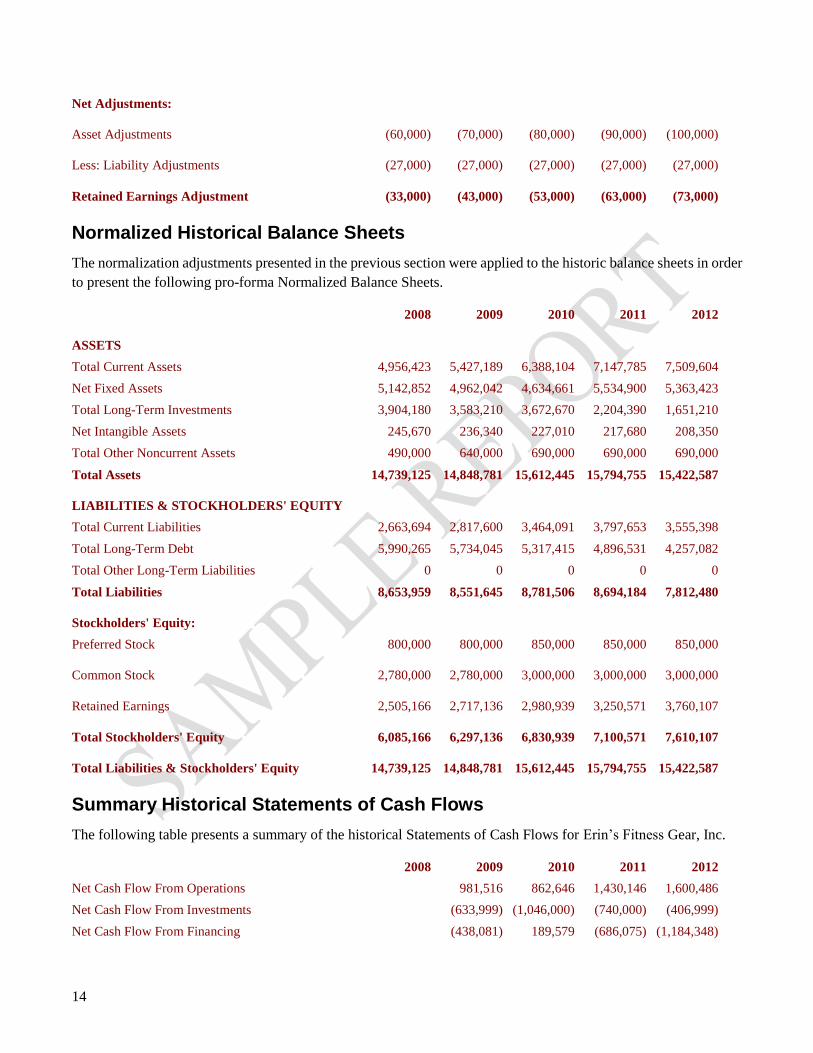
Normalized Historical Balance Sheets
The normalization adjustments presented in the previous section were applied to the historic balance sheets in order
to present the following pro-forma Normalized Balance Sheets.
2008 2009 2010 2011 2012
ASSETS
Total Current Assets 4,956,423 5,427,189 6,388,104 7,147,785 7,509,604
Net Fixed Assets 5,142,852 4,962,042 4,634,661 5,534,900 5,363,423
Total Long-Term Investments 3,904,180 3,583,210 3,672,670 2,204,390 1,651,210
Net Intangible Assets 245,670 236,340 227,010 217,680 208,350
Total Other Noncurrent Assets 490,000 640,000 690,000 690,000 690,000
Total Assets 14,739,125 14,848,781 15,612,445 15,794,755 15,422,587
LIABILITIES & STOCKHOLDERS' EQUITY
Total Current Liabilities 2,663,694 2,817,600 3,464,091 3,797,653 3,555,398
Total Long-Term Debt 5,990,265 5,734,045 5,317,415 4,896,531 4,257,082
Total Other Long-Term Liabilities 0 0 0 0 0
Total Liabilities 8,653,959 8,551,645 8,781,506 8,694,184 7,812,480
Stockholders' Equity:
Preferred Stock 800,000 800,000 850,000 850,000 850,000
Common Stock 2,780,000 2,780,000 3,000,000 3,000,000 3,000,000
Retained Earnings 2,505,166 2,717,136 2,980,939 3,250,571 3,760,107
Total Stockholders' Equity 6,085,166 6,297,136 6,830,939 7,100,571 7,610,107
Total Liabilities & Stockholders' Equity 14,739,125 14,848,781 15,612,445 15,794,755 15,422,587
Summary Historical Statements of Cash Flows
The following table presents a summary of the historical Statements of Cash Flows for Erin’s Fitness Gear, Inc.
2008 2009 2010 2011 2012
Net Cash Flow From Operations 981,516 862,646 1,430,146 1,600,486
Net Cash Flow From Investments (633,999) (1,046,000) (740,000) (406,999)
Net Cash Flow From Financing (438,081) 189,579 (686,075) (1,184,348)
15
Net Cash Flow (90,564) 6,225 4,071 9,139
Cash at Beginning of Year 313,943 223,379 229,604 233,675
Cash at End of Year 223,379 229,604 233,675 242,814
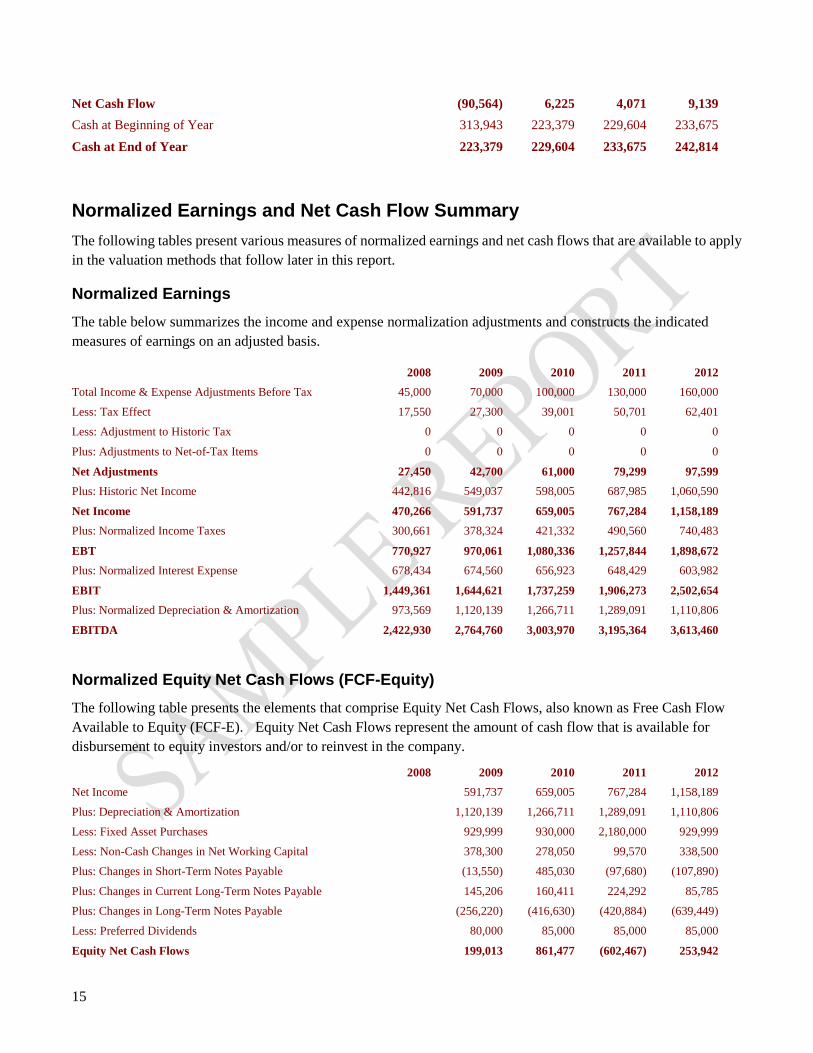
Normalized Earnings and Net Cash Flow Summary
The following tables present various measures of normalized earnings and net cash flows that are available to apply
in the valuation methods that follow later in this report.
Normalized Earnings
The table below summarizes the income and expense normalization adjustments and constructs the indicated
measures of earnings on an adjusted basis.
2008 2009 2010 2011 2012
Total Income & Expense Adjustments Before Tax 45,000 70,000 100,000 130,000 160,000
Less: Tax Effect 17,550 27,300 39,001 50,701 62,401
Less: Adjustment to Historic Tax 0 0 0 0 0
Plus: Adjustments to Net-of-Tax Items 0 0 0 0 0
Net Adjustments 27,450 42,700 61,000 79,299 97,599
Plus: Historic Net Income 442,816 549,037 598,005 687,985 1,060,590
Net Income 470,266 591,737 659,005 767,284 1,158,189
Plus: Normalized Income Taxes 300,661 378,324 421,332 490,560 740,483
EBT 770,927 970,061 1,080,336 1,257,844 1,898,672
Plus: Normalized Interest Expense 678,434 674,560 656,923 648,429 603,982
EBIT 1,449,361 1,644,621 1,737,259 1,906,273 2,502,654
Plus: Normalized Depreciation & Amortization 973,569 1,120,139 1,266,711 1,289,091 1,110,806
EBITDA 2,422,930 2,764,760 3,003,970 3,195,364 3,613,460
Normalized Equity Net Cash Flows (FCF-Equity)
The following table presents the elements that comprise Equity Net Cash Flows, also known as Free Cash Flow
Available to Equity (FCF-E). Equity Net Cash Flows represent the amount of cash flow that is available for
disbursement to equity investors and/or to reinvest in the company.
2008 2009 2010 2011 2012
Net Income 591,737 659,005 767,284 1,158,189
Plus: Depreciation & Amortization 1,120,139 1,266,711 1,289,091 1,110,806
Less: Fixed Asset Purchases 929,999 930,000 2,180,000 929,999
Less: Non-Cash Changes in Net Working Capital 378,300 278,050 99,570 338,500
Plus: Changes in Short-Term Notes Payable (13,550) 485,030 (97,680) (107,890)
Plus: Changes in Current Long-Term Notes Payable 145,206 160,411 224,292 85,785
Plus: Changes in Long-Term Notes Payable (256,220) (416,630) (420,884) (639,449)
Less: Preferred Dividends 80,000 85,000 85,000 85,000
Equity Net Cash Flows 199,013 861,477 (602,467) 253,942
16
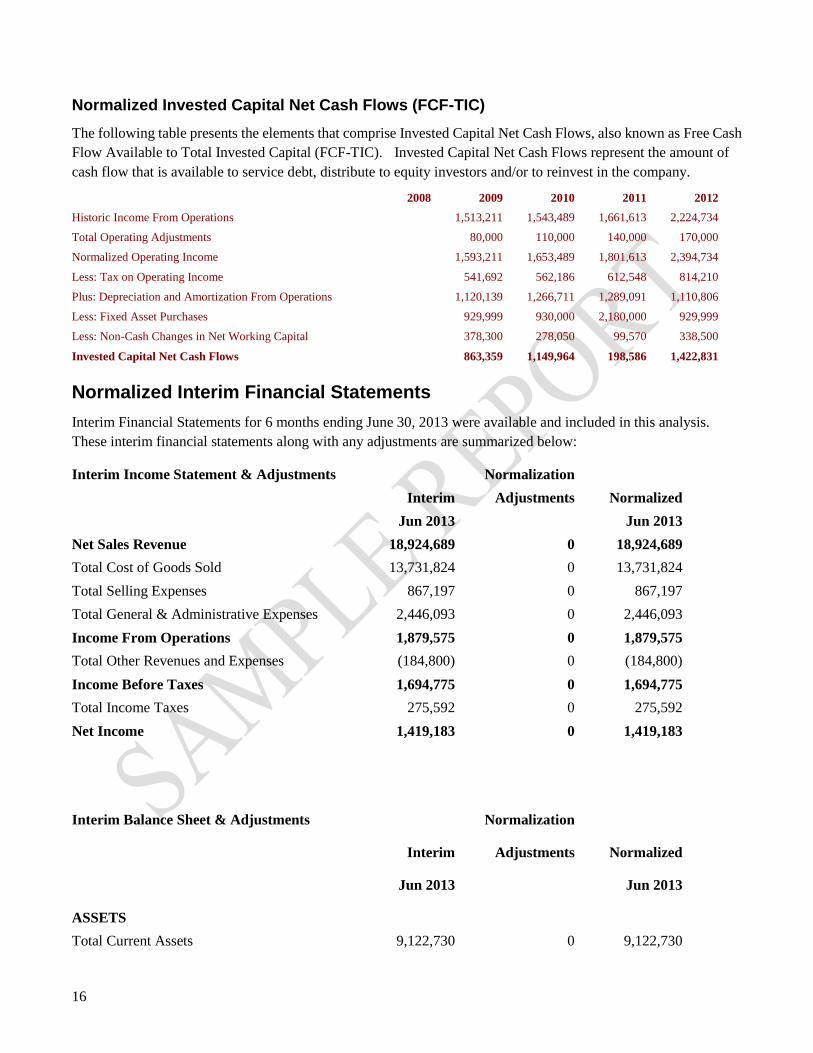
Normalized Invested Capital Net Cash Flows (FCF-TIC)
The following table presents the elements that comprise Invested Capital Net Cash Flows, also known as Free Cash
Flow Available to Total Invested Capital (FCF-TIC). Invested Capital Net Cash Flows represent the amount of
cash flow that is available to service debt, distribute to equity investors and/or to reinvest in the company.
2008 2009 2010 2011 2012
Historic Income From Operations 1,513,211 1,543,489 1,661,613 2,224,734
Total Operating Adjustments 80,000 110,000 140,000 170,000
Normalized Operating Income 1,593,211 1,653,489 1,801,613 2,394,734
Less: Tax on Operating Income 541,692 562,186 612,548 814,210
Plus: Depreciation and Amortization From Operations 1,120,139 1,266,711 1,289,091 1,110,806
Less: Fixed Asset Purchases 929,999 930,000 2,180,000 929,999
Less: Non-Cash Changes in Net Working Capital 378,300 278,050 99,570 338,500
Invested Capital Net Cash Flows 863,359 1,149,964 198,586 1,422,831
Normalized Interim Financial Statements
Interim Financial Statements for 6 months ending June 30, 2013 were available and included in this analysis.
These interim financial statements along with any adjustments are summarized below:
Interim Income Statement & Adjustments Normalization
Interim Adjustments Normalized
Jun 2013 Jun 2013
Net Sales Revenue 18,924,689 0 18,924,689
Total Cost of Goods Sold 13,731,824 0 13,731,824
Total Selling Expenses 867,197 0 867,197
Total General & Administrative Expenses 2,446,093 0 2,446,093
Income From Operations 1,879,575 0 1,879,575
Total Other Revenues and Expenses (184,800) 0 (184,800)
Income Before Taxes 1,694,775 0 1,694,775
Total Income Taxes 275,592 0 275,592
Net Income 1,419,183 0 1,419,183
Interim Balance Sheet & Adjustments Normalization
Interim Adjustments Normalized
Jun 2013 Jun 2013
ASSETS
Total Current Assets 9,122,730 0 9,122,730

17
Net Fixed Assets 4,554,828 0 4,554,828
Total Long-Term Investments 1,640,341 0 1,640,341
Net Intangible Assets 203,666 0 203,666
Total Other Noncurrent Assets 790,000 0 790,000
Total Assets 16,311,565 0 16,311,565
LIABILITIES & STOCKHOLDERS' EQUITY
Total Current Liabilities 3,303,998 0 3,303,998
Total Long-Term Debt 3,855,277 0 3,855,277
Total Other Long-Term Liabilities 50,000 0 50,000
Total Liabilities 7,209,275 0 7,209,275
Stockholders' Equity:
Preferred Stock 850,000 0 850,000
Common Stock 3,000,000 0 3,000,000
Retained Earnings 5,252,290 0 5,252,290
Total Stockholders' Equity 9,102,290 0 9,102,290
Total Liabilities & Stockholders' Equity 16,311,565 0 16,311,565
18
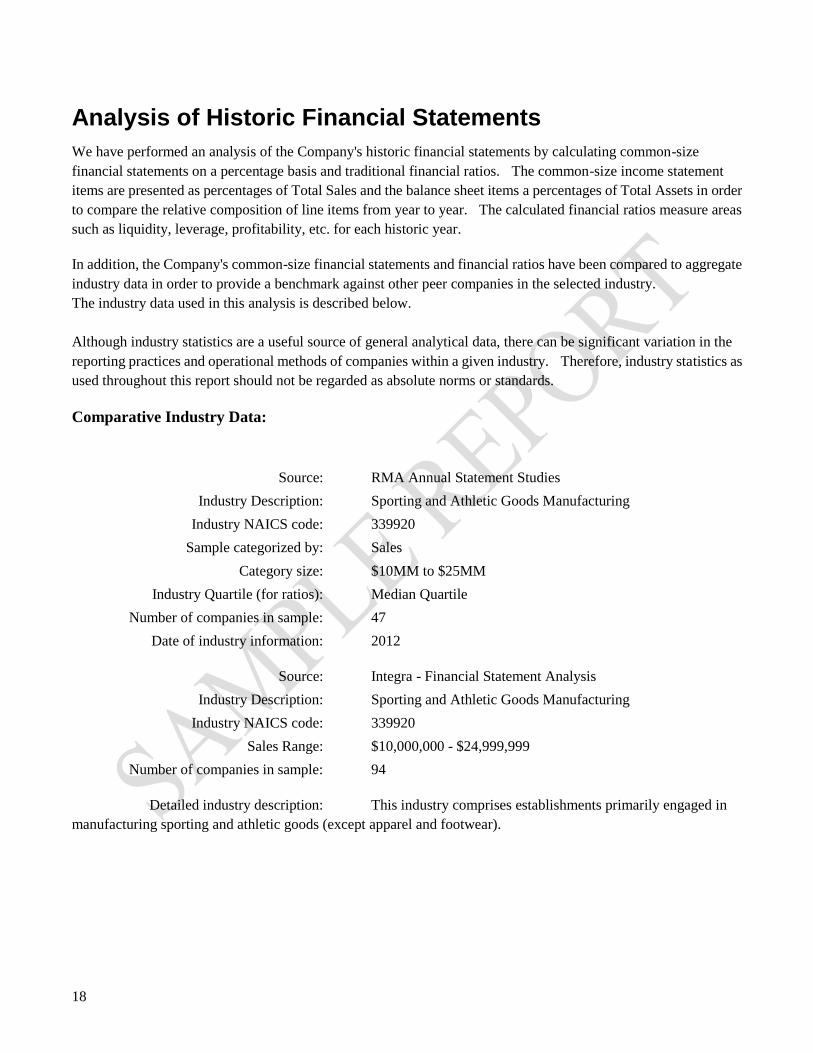
Analysis of Historic Financial Statements
We have performed an analysis of the Company's historic financial statements by calculating common-size
financial statements on a percentage basis and traditional financial ratios. The common-size income statement
items are presented as percentages of Total Sales and the balance sheet items a percentages of Total Assets in order
to compare the relative composition of line items from year to year. The calculated financial ratios measure areas
such as liquidity, leverage, profitability, etc. for each historic year.
In addition, the Company's common-size financial statements and financial ratios have been compared to aggregate
industry data in order to provide a benchmark against other peer companies in the selected industry.
The industry data used in this analysis is described below.
Although industry statistics are a useful source of general analytical data, there can be significant variation in the
reporting practices and operational methods of companies within a given industry. Therefore, industry statistics as
used throughout this report should not be regarded as absolute norms or standards.
Comparative Industry Data:
Source: RMA Annual Statement Studies
Industry Description: Sporting and Athletic Goods Manufacturing
Industry NAICS code: 339920
Sample categorized by: Sales
Category size: $10MM to $25MM
Industry Quartile (for ratios): Median Quartile
Number of companies in sample: 47
Date of industry information: 2012
Source: Integra - Financial Statement Analysis
Industry Description: Sporting and Athletic Goods Manufacturing
Industry NAICS code: 339920
Sales Range: $10,000,000 - $24,999,999
Number of companies in sample: 94
Detailed industry description: This industry comprises establishments primarily engaged in
manufacturing sporting and athletic goods (except apparel and footwear).
19
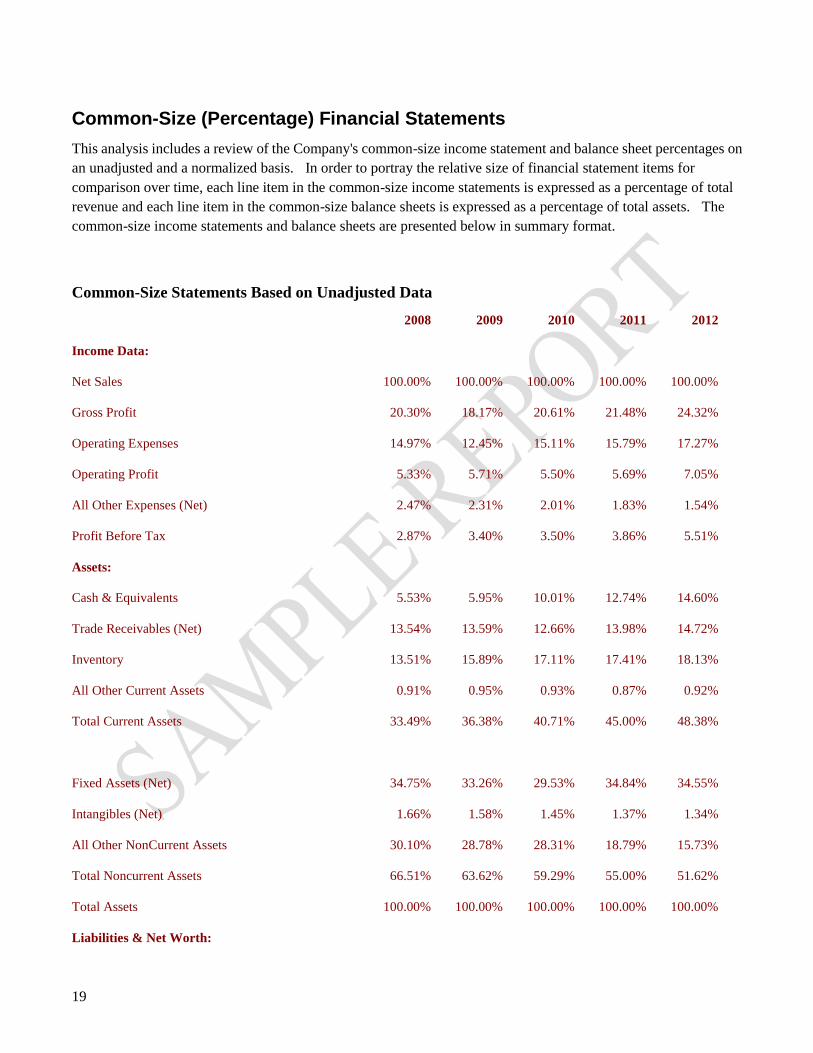
Common-Size (Percentage) Financial Statements
This analysis includes a review of the Company's common-size income statement and balance sheet percentages on
an unadjusted and a normalized basis. In order to portray the relative size of financial statement items for
comparison over time, each line item in the common-size income statements is expressed as a percentage of total
revenue and each line item in the common-size balance sheets is expressed as a percentage of total assets. The
common-size income statements and balance sheets are presented below in summary format.
Common-Size Statements Based on Unadjusted Data
2008 2009 2010 2011 2012
Income Data:
Net Sales 100.00% 100.00% 100.00% 100.00% 100.00%
Gross Profit 20.30% 18.17% 20.61% 21.48% 24.32%
Operating Expenses 14.97% 12.45% 15.11% 15.79% 17.27%
Operating Profit 5.33% 5.71% 5.50% 5.69% 7.05%
All Other Expenses (Net) 2.47% 2.31% 2.01% 1.83% 1.54%
Profit Before Tax 2.87% 3.40% 3.50% 3.86% 5.51%
Assets:
Cash & Equivalents 5.53% 5.95% 10.01% 12.74% 14.60%
Trade Receivables (Net) 13.54% 13.59% 12.66% 13.98% 14.72%
Inventory 13.51% 15.89% 17.11% 17.41% 18.13%
All Other Current Assets 0.91% 0.95% 0.93% 0.87% 0.92%
Total Current Assets 33.49% 36.38% 40.71% 45.00% 48.38%
Fixed Assets (Net) 34.75% 33.26% 29.53% 34.84% 34.55%
Intangibles (Net) 1.66% 1.58% 1.45% 1.37% 1.34%
All Other NonCurrent Assets 30.10% 28.78% 28.31% 18.79% 15.73%
Total Noncurrent Assets 66.51% 63.62% 59.29% 55.00% 51.62%
Total Assets 100.00% 100.00% 100.00% 100.00% 100.00%
Liabilities & Net Worth:

20
Notes Payable Short-Term 1.27% 1.17% 4.20% 3.54% 2.92%
Current Maturity of Long-Term Debt 3.58% 4.53% 5.33% 6.67% 7.38%
Trade Payables 8.33% 8.32% 7.83% 8.37% 8.34%
Income Taxes Payable 2.19% 2.25% 2.13% 2.45% 1.73%
All Other Current Liabilities 2.62% 2.62% 2.59% 2.88% 2.53%
Total Current Liabilities 18.00% 18.89% 22.07% 23.91% 22.90%
Long-Term Debt 40.48% 38.44% 33.89% 30.83% 27.43%
Deferred Taxes 0.00% 0.00% 0.00% 0.00% 0.00%
All Other NonCurrent Liabilities 0.18% 0.18% 0.17% 0.17% 0.17%
Net worth 41.34% 42.50% 43.87% 45.10% 49.50%
Total Liabilities & Net Worth 100.00% 100.00% 100.00% 100.00% 100.00%
Common-Size Statements Based on Normalized Data
2008 2009 2010 2011 2012
Income Data:
Net Sales 100.00% 100.00% 100.00% 100.00% 100.00%
Gross Profit 20.30% 18.17% 20.61% 21.48% 24.32%
Operating Expenses 14.75% 12.15% 14.71% 15.31% 16.73%
Operating Profit 5.55% 6.01% 5.90% 6.17% 7.59%
All Other Expenses (Net) 2.50% 2.35% 2.04% 1.86% 1.57%
Profit Before Tax 3.05% 3.66% 3.85% 4.30% 6.02%
Assets:
Cash & Equivalents 5.55% 5.98% 10.06% 12.81% 14.70%
Trade Receivables (Net) 13.60% 13.65% 12.73% 14.06% 14.82%
Inventory 13.57% 15.96% 17.20% 17.51% 18.25%
All Other Current Assets 0.91% 0.95% 0.93% 0.88% 0.92%
Total Current Assets 33.63% 36.55% 40.92% 45.25% 48.69%

21
Fixed Assets (Net) 34.89% 33.42% 29.69% 35.04% 34.78%
Intangibles (Net) 1.67% 1.59% 1.45% 1.38% 1.35%
All Other NonCurrent Assets 29.81% 28.44% 27.94% 18.33% 15.18%
Total Noncurrent Assets 66.37% 63.45% 59.08% 54.75% 51.31%
Total Assets 100.00% 100.00% 100.00% 100.00% 100.00%
Liabilities & Net Worth:
Notes Payable Short-Term 1.27% 1.17% 4.22% 3.56% 2.94%
Current Maturity of Long-Term Debt 3.60% 4.55% 5.35% 6.71% 7.43%
Trade Payables 8.37% 8.36% 7.87% 8.42% 8.39%
Income Taxes Payable 2.20% 2.26% 2.14% 2.47% 1.74%
All Other Current Liabilities 2.63% 2.64% 2.60% 2.89% 2.55%
Total Current Liabilities 18.07% 18.98% 22.19% 24.04% 23.05%
Long-Term Debt 40.64% 38.62% 34.06% 31.00% 27.60%
Deferred Taxes 0.00% 0.00% 0.00% 0.00% 0.00%
All Other NonCurrent Liabilities 0.00% 0.00% 0.00% 0.00% 0.00%
Net worth 41.29% 42.41% 43.75% 44.96% 49.34%
Total Liabilities & Net Worth 100.00% 100.00% 100.00% 100.00% 100.00%

22
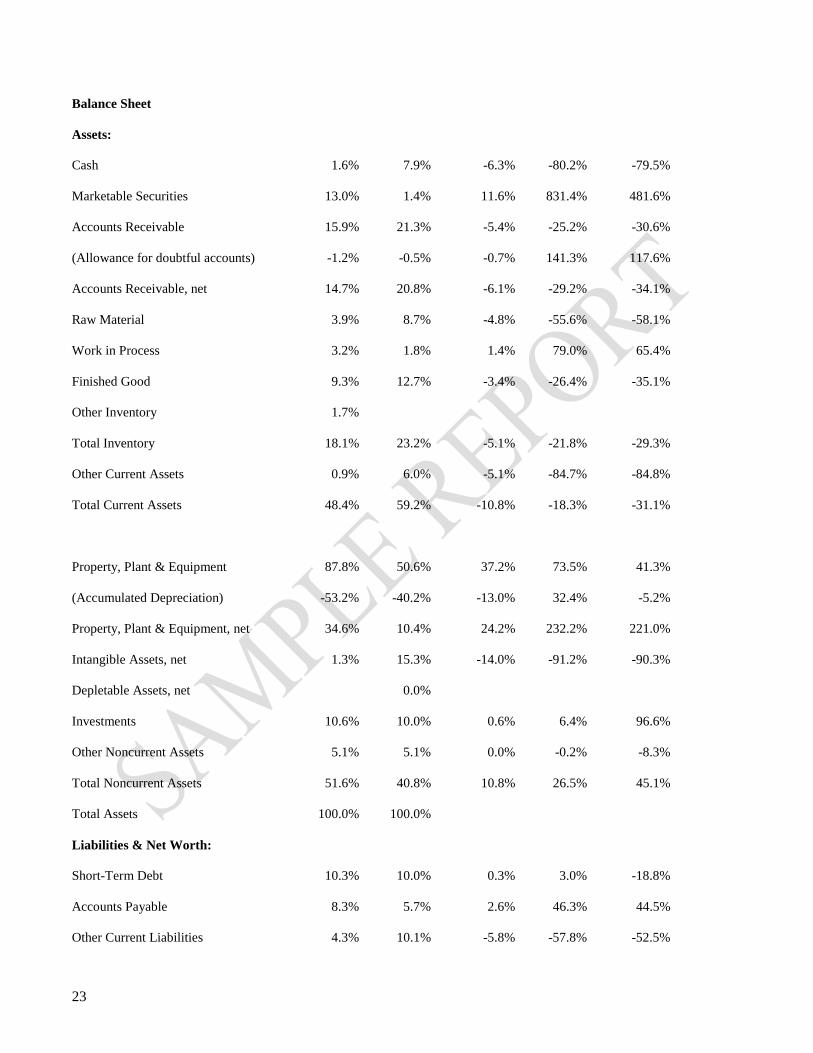
Integra Industry Data, Common-Size Statement Comparison
The Company's common-size financial statements are calculated from both the unadjusted and normalized financial
statements and compared here to the selected Integra industry data. For each line item, the business vs. industry
difference, variance and average variance are calculated and presented in the table below. A multi-year
comparison is available as an attachment to this report.
Integra Common-Size Comparison to Unadjusted Company Financials
Integra - Business vs. Industry
Common-Size Statements, Current Year 5 Yr Average
Business Industry Difference Variance Variance
2012 2011
Income Statement
Revenue 100.0% 100.0% 0.0% 0.0% 0.0%
Cost of Sales 73.1% 66.3% 6.8% 10.2% 14.6%
Gross Margin 26.9% 33.7% -6.8% -20.1% -37.8%
Selling, General & Administrative 12.0% 18.6% -6.6% -35.5% -49.3%
Officer Compensation 1.7% 2.1% -0.4% -17.0% -24.3%
Pension & Benefits 0.0% 2.1% -2.1% -100.0% -100.0%
Advertising & Sales 0.0% 1.9% -1.9% -100.0% -100.0%
Bad Debts 0.0% 0.2% -0.2% -100.0% -100.0%
Rents Paid 0.0% 2.1% -2.1% -100.0% -100.0%
Depreciation & Amortization 3.5% 3.2% 0.3% 10.1% 28.3%
Operating expenses 17.3% 30.3% -13.0% -43.0% -50.1%
Operating Income 7.1% 3.5% 3.6% 101.5% 67.4%
Interest Income 0.3% 0.1% 0.2% 242.2% 173.9%
Interest Expense -1.9% -1.0% -0.9% 91.5% 134.1%
Total Other Income (Expense) 0.0% 0.0% 0.0% 0.0% 0.0%
Pre-Tax Income 5.5% 2.5% 3.0% 120.5% 53.1%
Income Taxes 2.1% -0.9% 3.0% -338.9% -265.8%
Net Income 3.4% 1.5% 1.9% 124.2% 55.6%
23
Balance Sheet
Assets:
Cash 1.6% 7.9% -6.3% -80.2% -79.5%
Marketable Securities 13.0% 1.4% 11.6% 831.4% 481.6%
Accounts Receivable 15.9% 21.3% -5.4% -25.2% -30.6%
(Allowance for doubtful accounts) -1.2% -0.5% -0.7% 141.3% 117.6%
Accounts Receivable, net 14.7% 20.8% -6.1% -29.2% -34.1%
Raw Material 3.9% 8.7% -4.8% -55.6% -58.1%
Work in Process 3.2% 1.8% 1.4% 79.0% 65.4%
Finished Good 9.3% 12.7% -3.4% -26.4% -35.1%
Other Inventory 1.7%
Total Inventory 18.1% 23.2% -5.1% -21.8% -29.3%
Other Current Assets 0.9% 6.0% -5.1% -84.7% -84.8%
Total Current Assets 48.4% 59.2% -10.8% -18.3% -31.1%
Property, Plant & Equipment 87.8% 50.6% 37.2% 73.5% 41.3%
(Accumulated Depreciation) -53.2% -40.2% -13.0% 32.4% -5.2%
Property, Plant & Equipment, net 34.6% 10.4% 24.2% 232.2% 221.0%
Intangible Assets, net 1.3% 15.3% -14.0% -91.2% -90.3%
Depletable Assets, net 0.0%
Investments 10.6% 10.0% 0.6% 6.4% 96.6%
Other Noncurrent Assets 5.1% 5.1% 0.0% -0.2% -8.3%
Total Noncurrent Assets 51.6% 40.8% 10.8% 26.5% 45.1%
Total Assets 100.0% 100.0%
Liabilities & Net Worth:
Short-Term Debt 10.3% 10.0% 0.3% 3.0% -18.8%
Accounts Payable 8.3% 5.7% 2.6% 46.3% 44.5%
Other Current Liabilities 4.3% 10.1% -5.8% -57.8% -52.5%

24
Total Current Liabilities 22.9% 25.8% -2.9% -11.2% -18.0%
Long-Term Debt 27.4% 23.8% 3.6% 15.2% 43.7%
Loans from Shareholders 0.0% 2.5% -2.5% -100.0% -100.0%
Other Liabilities 0.2% 6.1% -5.9% -97.1% -97.1%
Total Long-Term Liabilities 50.5% 32.4% 18.1% 55.9% 60.3%
Total Liabilities 50.5% 58.2% -7.7% -13.2% -4.6%
Total Net Worth 49.5% 41.8% 7.7% 18.4% 6.4%
Total Liabilities & Net Worth 100.0% 100.0%
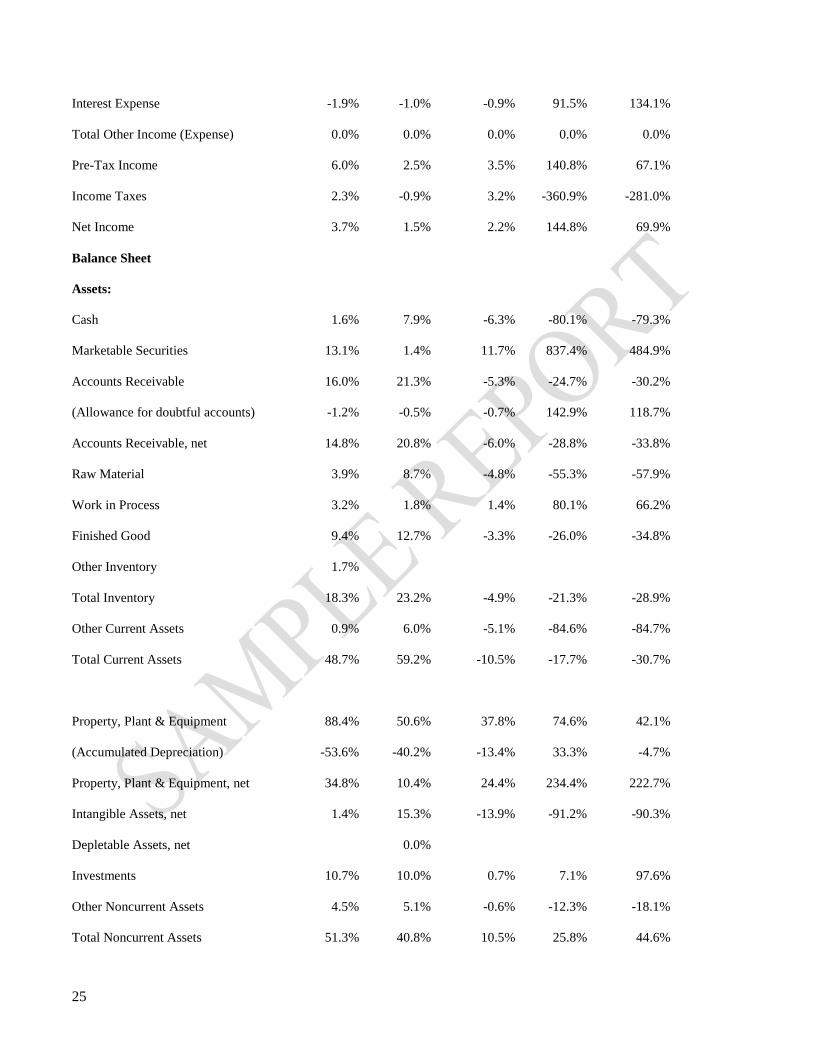
Integra Common-Size Comparison to Normalized Company Financials
Integra - Business vs. Industry
Common-Size Statements, Current Year 5 Yr Average
Business Industry Difference Variance Variance
2012 2011
Income Statement
Revenue 100.0% 100.0% 0.0% 0.0% 0.0%
Cost of Sales 73.1% 66.3% 6.8% 10.2% 14.6%
Gross Margin 26.9% 33.7% -6.8% -20.1% -37.8%
Selling, General & Administrative 11.9% 18.6% -6.7% -35.8% -49.5%
Officer Compensation 1.3% 2.1% -0.8% -39.6% -40.8%
Pension & Benefits 0.0% 2.1% -2.1% -100.0% -100.0%
Advertising & Sales 0.0% 1.9% -1.9% -100.0% -100.0%
Bad Debts 0.0% 0.2% -0.2% -100.0% -100.0%
Rents Paid 0.0% 2.1% -2.1% -100.0% -100.0%
Depreciation & Amortization 3.5% 3.2% 0.3% 10.1% 28.3%
Operating expenses 16.7% 30.3% -13.6% -44.8% -51.4%
Operating Income 7.6% 3.5% 4.1% 116.9% 78.4%
Interest Income 0.3% 0.1% 0.2% 242.2% 173.9%
25
Interest Expense -1.9% -1.0% -0.9% 91.5% 134.1%
Total Other Income (Expense) 0.0% 0.0% 0.0% 0.0% 0.0%
Pre-Tax Income 6.0% 2.5% 3.5% 140.8% 67.1%
Income Taxes 2.3% -0.9% 3.2% -360.9% -281.0%
Net Income 3.7% 1.5% 2.2% 144.8% 69.9%
Balance Sheet
Assets:
Cash 1.6% 7.9% -6.3% -80.1% -79.3%
Marketable Securities 13.1% 1.4% 11.7% 837.4% 484.9%
Accounts Receivable 16.0% 21.3% -5.3% -24.7% -30.2%
(Allowance for doubtful accounts) -1.2% -0.5% -0.7% 142.9% 118.7%
Accounts Receivable, net 14.8% 20.8% -6.0% -28.8% -33.8%
Raw Material 3.9% 8.7% -4.8% -55.3% -57.9%
Work in Process 3.2% 1.8% 1.4% 80.1% 66.2%
Finished Good 9.4% 12.7% -3.3% -26.0% -34.8%
Other Inventory 1.7%
Total Inventory 18.3% 23.2% -4.9% -21.3% -28.9%
Other Current Assets 0.9% 6.0% -5.1% -84.6% -84.7%
Total Current Assets 48.7% 59.2% -10.5% -17.7% -30.7%
Property, Plant & Equipment 88.4% 50.6% 37.8% 74.6% 42.1%
(Accumulated Depreciation) -53.6% -40.2% -13.4% 33.3% -4.7%
Property, Plant & Equipment, net 34.8% 10.4% 24.4% 234.4% 222.7%
Intangible Assets, net 1.4% 15.3% -13.9% -91.2% -90.3%
Depletable Assets, net 0.0%
Investments 10.7% 10.0% 0.7% 7.1% 97.6%
Other Noncurrent Assets 4.5% 5.1% -0.6% -12.3% -18.1%
Total Noncurrent Assets 51.3% 40.8% 10.5% 25.8% 44.6%
26
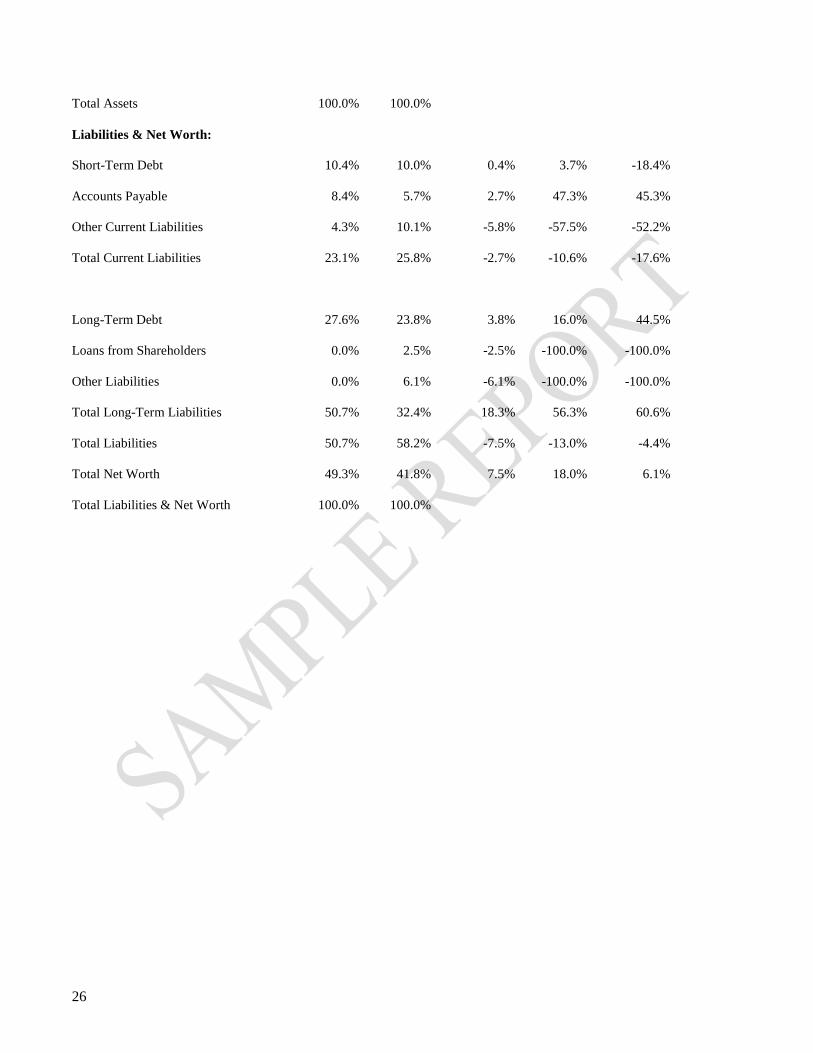
Total Assets 100.0% 100.0%
Liabilities & Net Worth:
Short-Term Debt 10.4% 10.0% 0.4% 3.7% -18.4%
Accounts Payable 8.4% 5.7% 2.7% 47.3% 45.3%
Other Current Liabilities 4.3% 10.1% -5.8% -57.5% -52.2%
Total Current Liabilities 23.1% 25.8% -2.7% -10.6% -17.6%
Long-Term Debt 27.6% 23.8% 3.8% 16.0% 44.5%
Loans from Shareholders 0.0% 2.5% -2.5% -100.0% -100.0%
Other Liabilities 0.0% 6.1% -6.1% -100.0% -100.0%
Total Long-Term Liabilities 50.7% 32.4% 18.3% 56.3% 60.6%
Total Liabilities 50.7% 58.2% -7.5% -13.0% -4.4%
Total Net Worth 49.3% 41.8% 7.5% 18.0% 6.1%
Total Liabilities & Net Worth 100.0% 100.0%
27
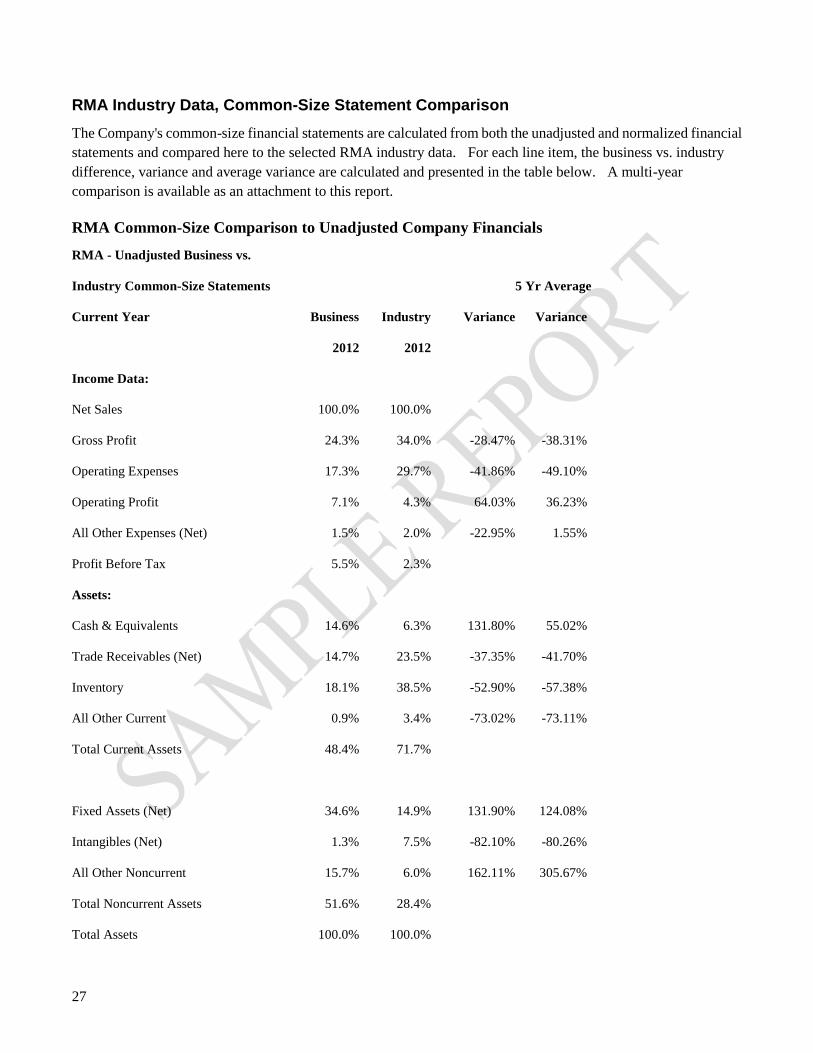
RMA Industry Data, Common-Size Statement Comparison
The Company's common-size financial statements are calculated from both the unadjusted and normalized financial
statements and compared here to the selected RMA industry data. For each line item, the business vs. industry
difference, variance and average variance are calculated and presented in the table below. A multi-year
comparison is available as an attachment to this report.
RMA Common-Size Comparison to Unadjusted Company Financials
RMA - Unadjusted Business vs.
Industry Common-Size Statements 5 Yr Average
Current Year Business Industry Variance Variance
2012 2012
Income Data:
Net Sales 100.0% 100.0%
Gross Profit 24.3% 34.0% -28.47% -38.31%
Operating Expenses 17.3% 29.7% -41.86% -49.10%
Operating Profit 7.1% 4.3% 64.03% 36.23%
All Other Expenses (Net) 1.5% 2.0% -22.95% 1.55%
Profit Before Tax 5.5% 2.3%
Assets:
Cash & Equivalents 14.6% 6.3% 131.80% 55.02%
Trade Receivables (Net) 14.7% 23.5% -37.35% -41.70%
Inventory 18.1% 38.5% -52.90% -57.38%
All Other Current 0.9% 3.4% -73.02% -73.11%
Total Current Assets 48.4% 71.7%
Fixed Assets (Net) 34.6% 14.9% 131.90% 124.08%
Intangibles (Net) 1.3% 7.5% -82.10% -80.26%
All Other Noncurrent 15.7% 6.0% 162.11% 305.67%
Total Noncurrent Assets 51.6% 28.4%
Total Assets 100.0% 100.0%

28
Liabilities:
Notes Payable Short-Term 2.9% 13.2% -77.86% -80.16%
Current Maturity Of Long-Term Debt 7.4% 1.9% 288.52% 189.38%
Trade Payables 8.3% 15.0% -44.40% -45.08%
Income Taxes Payable 1.7% 0.3% 475.29% 616.91%
All Other Current Liabilities 2.5% 12.0% -78.88% -77.92%
Total Current Liabilities 22.9% 42.4%
Long-Term Debt 27.4% 10.1% 168.87% 235.39%
Deferred Taxes 0.0% 0.4% -100.00% -100.00%
All Other NonCurrent Liabilities 0.2% 6.6% -97.36% -97.34%
Net Worth 49.5% 40.5% 22.21% 9.78%
Total Liabilities & Net Worth 100.0% 100.0%
RMA Common-Size Comparison to Normalized Company Financials
RMA - Normalized Business vs.
Industry Common-Size Statements 5 Yr Average
Current Year Business Industry Variance Variance
2012 2012
Income Data:
Net Sales 100.0% 100.0%
Gross Profit 24.3% 34.0% -28.47% -38.31%
Operating Expenses 16.7% 29.7% -43.68% -50.40%
Operating Profit 7.6% 4.3% 76.57% 45.21%
All Other Expenses (Net) 1.6% 2.0% -21.36% 3.34%
Profit Before Tax 6.0% 2.3%
Assets:
Cash & Equivalents 14.7% 6.3% 133.30% 55.87%
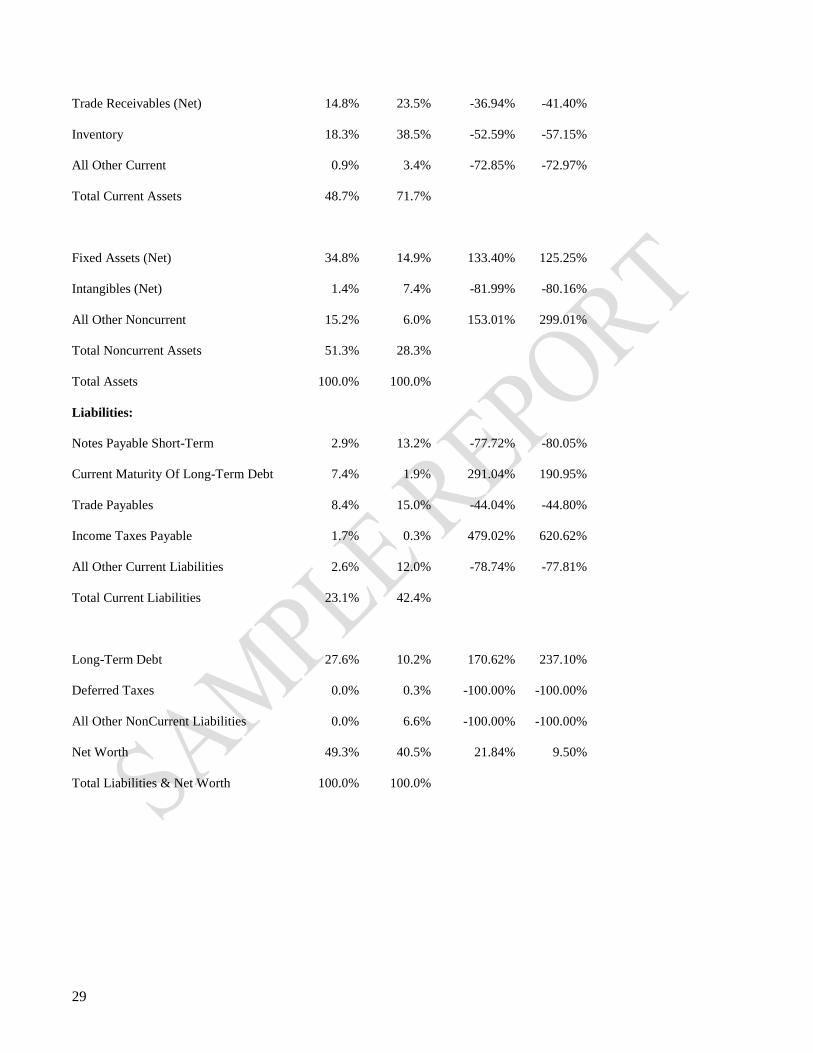
29
Trade Receivables (Net) 14.8% 23.5% -36.94% -41.40%
Inventory 18.3% 38.5% -52.59% -57.15%
All Other Current 0.9% 3.4% -72.85% -72.97%
Total Current Assets 48.7% 71.7%
Fixed Assets (Net) 34.8% 14.9% 133.40% 125.25%
Intangibles (Net) 1.4% 7.4% -81.99% -80.16%
All Other Noncurrent 15.2% 6.0% 153.01% 299.01%
Total Noncurrent Assets 51.3% 28.3%
Total Assets 100.0% 100.0%
Liabilities:
Notes Payable Short-Term 2.9% 13.2% -77.72% -80.05%
Current Maturity Of Long-Term Debt 7.4% 1.9% 291.04% 190.95%
Trade Payables 8.4% 15.0% -44.04% -44.80%
Income Taxes Payable 1.7% 0.3% 479.02% 620.62%
All Other Current Liabilities 2.6% 12.0% -78.74% -77.81%
Total Current Liabilities 23.1% 42.4%
Long-Term Debt 27.6% 10.2% 170.62% 237.10%
Deferred Taxes 0.0% 0.3% -100.00% -100.00%
All Other NonCurrent Liabilities 0.0% 6.6% -100.00% -100.00%
Net Worth 49.3% 40.5% 21.84% 9.50%
Total Liabilities & Net Worth 100.0% 100.0%
30
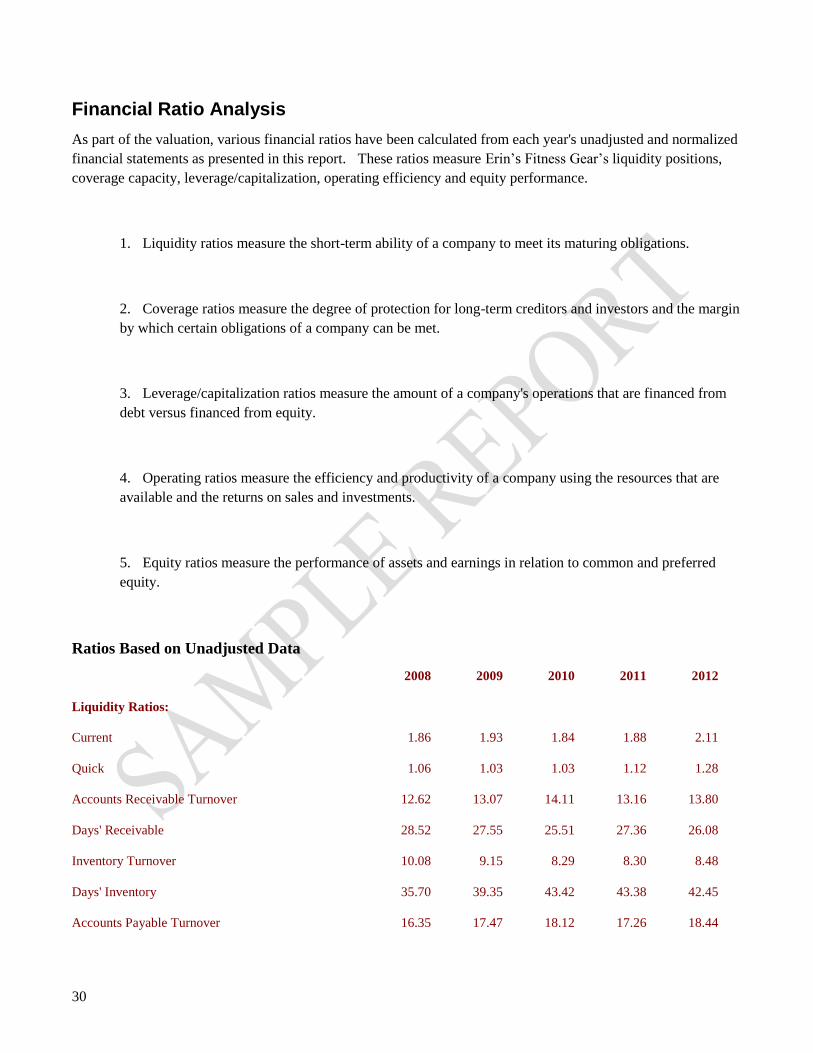
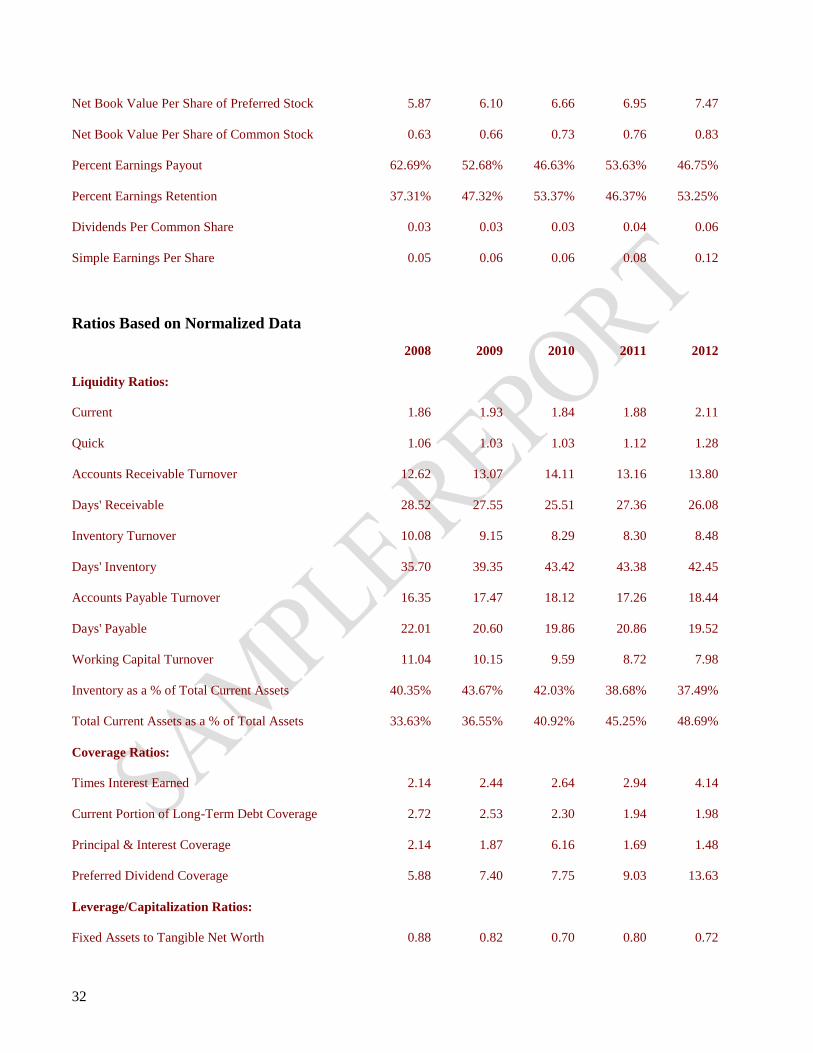
Financial Ratio Analysis
As part of the valuation, various financial ratios have been calculated from each year's unadjusted and normalized
financial statements as presented in this report. These ratios measure Erin’s Fitness Gear’s liquidity positions,
coverage capacity, leverage/capitalization, operating efficiency and equity performance.
1. Liquidity ratios measure the short-term ability of a company to meet its maturing obligations.
2. Coverage ratios measure the degree of protection for long-term creditors and investors and the margin
by which certain obligations of a company can be met.
3. Leverage/capitalization ratios measure the amount of a company's operations that are financed from
debt versus financed from equity.
4. Operating ratios measure the efficiency and productivity of a company using the resources that are
available and the returns on sales and investments.
5. Equity ratios measure the performance of assets and earnings in relation to common and preferred
equity.
Ratios Based on Unadjusted Data
2008 2009 2010 2011 2012
Liquidity Ratios:
Current 1.86 1.93 1.84 1.88 2.11
Quick 1.06 1.03 1.03 1.12 1.28
Accounts Receivable Turnover 12.62 13.07 14.11 13.16 13.80
Days' Receivable 28.52 27.55 25.51 27.36 26.08
Inventory Turnover 10.08 9.15 8.29 8.30 8.48
Days' Inventory 35.70 39.35 43.42 43.38 42.45
Accounts Payable Turnover 16.35 17.47 18.12 17.26 18.44
31
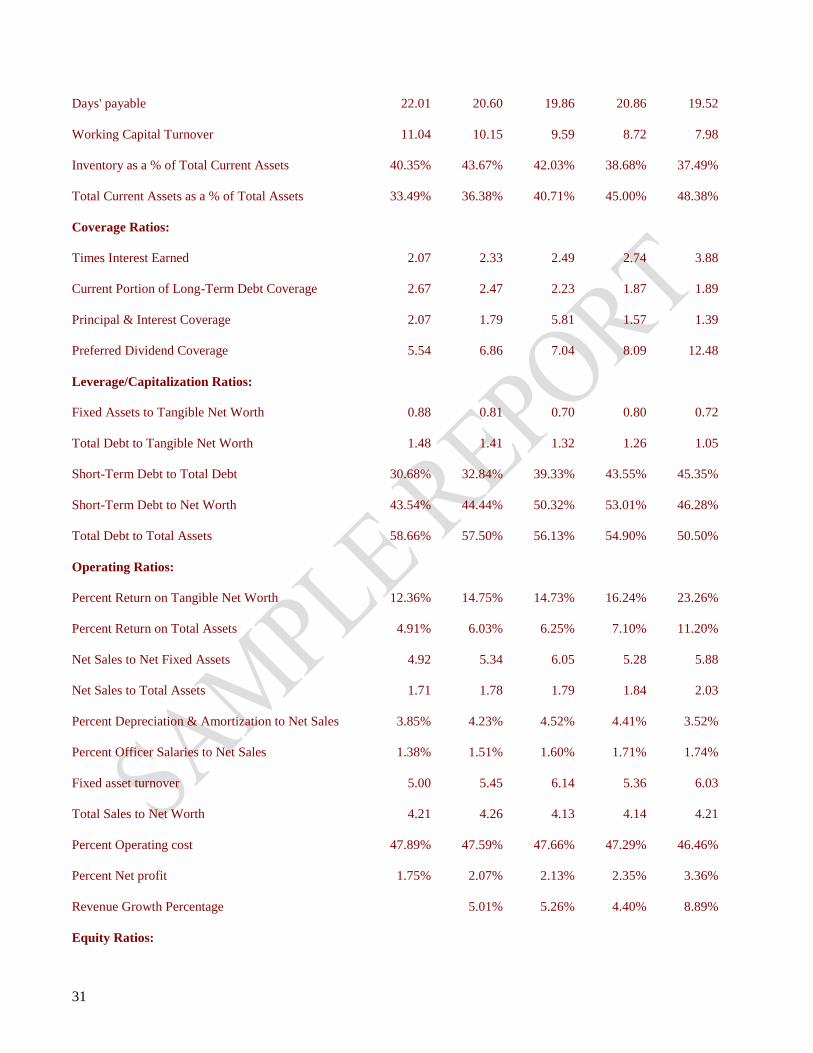
Days' payable 22.01 20.60 19.86 20.86 19.52
Working Capital Turnover 11.04 10.15 9.59 8.72 7.98
Inventory as a % of Total Current Assets 40.35% 43.67% 42.03% 38.68% 37.49%
Total Current Assets as a % of Total Assets 33.49% 36.38% 40.71% 45.00% 48.38%
Coverage Ratios:
Times Interest Earned 2.07 2.33 2.49 2.74 3.88
Current Portion of Long-Term Debt Coverage 2.67 2.47 2.23 1.87 1.89
Principal & Interest Coverage 2.07 1.79 5.81 1.57 1.39
Preferred Dividend Coverage 5.54 6.86 7.04 8.09 12.48
Leverage/Capitalization Ratios:
Fixed Assets to Tangible Net Worth 0.88 0.81 0.70 0.80 0.72
Total Debt to Tangible Net Worth 1.48 1.41 1.32 1.26 1.05
Short-Term Debt to Total Debt 30.68% 32.84% 39.33% 43.55% 45.35%
Short-Term Debt to Net Worth 43.54% 44.44% 50.32% 53.01% 46.28%
Total Debt to Total Assets 58.66% 57.50% 56.13% 54.90% 50.50%
Operating Ratios:
Percent Return on Tangible Net Worth 12.36% 14.75% 14.73% 16.24% 23.26%
Percent Return on Total Assets 4.91% 6.03% 6.25% 7.10% 11.20%
Net Sales to Net Fixed Assets 4.92 5.34 6.05 5.28 5.88
Net Sales to Total Assets 1.71 1.78 1.79 1.84 2.03
Percent Depreciation & Amortization to Net Sales 3.85% 4.23% 4.52% 4.41% 3.52%
Percent Officer Salaries to Net Sales 1.38% 1.51% 1.60% 1.71% 1.74%
Fixed asset turnover 5.00 5.45 6.14 5.36 6.03
Total Sales to Net Worth 4.21 4.26 4.13 4.14 4.21
Percent Operating cost 47.89% 47.59% 47.66% 47.29% 46.46%
Percent Net profit 1.75% 2.07% 2.13% 2.35% 3.36%
Revenue Growth Percentage 5.01% 5.26% 4.40% 8.89%
Equity Ratios:
32
Net Book Value Per Share of Preferred Stock 5.87 6.10 6.66 6.95 7.47
Net Book Value Per Share of Common Stock 0.63 0.66 0.73 0.76 0.83
Percent Earnings Payout 62.69% 52.68% 46.63% 53.63% 46.75%
Percent Earnings Retention 37.31% 47.32% 53.37% 46.37% 53.25%
Dividends Per Common Share 0.03 0.03 0.03 0.04 0.06
Simple Earnings Per Share 0.05 0.06 0.06 0.08 0.12
Ratios Based on Normalized Data
2008 2009 2010 2011 2012
Liquidity Ratios:
Current 1.86 1.93 1.84 1.88 2.11
Quick 1.06 1.03 1.03 1.12 1.28
Accounts Receivable Turnover 12.62 13.07 14.11 13.16 13.80
Days' Receivable 28.52 27.55 25.51 27.36 26.08
Inventory Turnover 10.08 9.15 8.29 8.30 8.48
Days' Inventory 35.70 39.35 43.42 43.38 42.45
Accounts Payable Turnover 16.35 17.47 18.12 17.26 18.44
Days' Payable 22.01 20.60 19.86 20.86 19.52
Working Capital Turnover 11.04 10.15 9.59 8.72 7.98
Inventory as a % of Total Current Assets 40.35% 43.67% 42.03% 38.68% 37.49%
Total Current Assets as a % of Total Assets 33.63% 36.55% 40.92% 45.25% 48.69%
Coverage Ratios:
Times Interest Earned 2.14 2.44 2.64 2.94 4.14
Current Portion of Long-Term Debt Coverage 2.72 2.53 2.30 1.94 1.98
Principal & Interest Coverage 2.14 1.87 6.16 1.69 1.48
Preferred Dividend Coverage 5.88 7.40 7.75 9.03 13.63
Leverage/Capitalization Ratios:
Fixed Assets to Tangible Net Worth 0.88 0.82 0.70 0.80 0.72
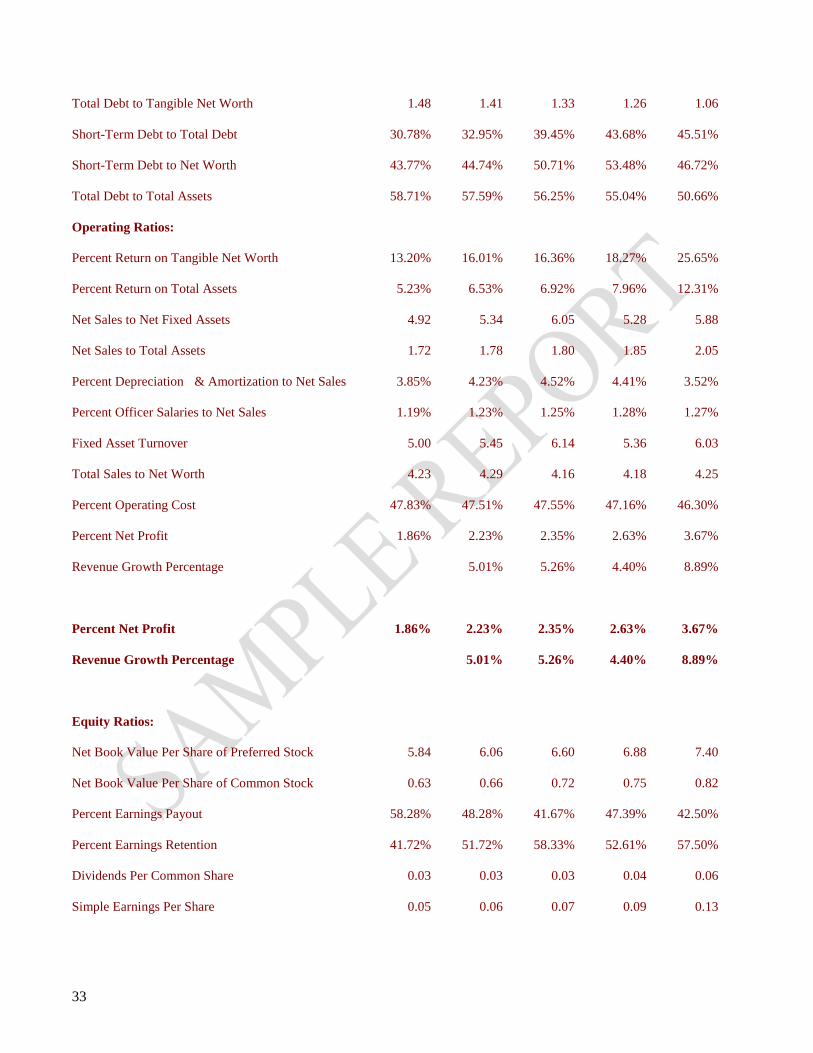
33
Total Debt to Tangible Net Worth 1.48 1.41 1.33 1.26 1.06
Short-Term Debt to Total Debt 30.78% 32.95% 39.45% 43.68% 45.51%
Short-Term Debt to Net Worth 43.77% 44.74% 50.71% 53.48% 46.72%
Total Debt to Total Assets 58.71% 57.59% 56.25% 55.04% 50.66%
Operating Ratios:
Percent Return on Tangible Net Worth 13.20% 16.01% 16.36% 18.27% 25.65%
Percent Return on Total Assets 5.23% 6.53% 6.92% 7.96% 12.31%
Net Sales to Net Fixed Assets 4.92 5.34 6.05 5.28 5.88
Net Sales to Total Assets 1.72 1.78 1.80 1.85 2.05
Percent Depreciation & Amortization to Net Sales 3.85% 4.23% 4.52% 4.41% 3.52%
Percent Officer Salaries to Net Sales 1.19% 1.23% 1.25% 1.28% 1.27%
Fixed Asset Turnover 5.00 5.45 6.14 5.36 6.03
Total Sales to Net Worth 4.23 4.29 4.16 4.18 4.25
Percent Operating Cost 47.83% 47.51% 47.55% 47.16% 46.30%
Percent Net Profit 1.86% 2.23% 2.35% 2.63% 3.67%
Revenue Growth Percentage 5.01% 5.26% 4.40% 8.89%
Percent Net Profit 1.86% 2.23% 2.35% 2.63% 3.67%
Revenue Growth Percentage 5.01% 5.26% 4.40% 8.89%
Equity Ratios:
Net Book Value Per Share of Preferred Stock 5.84 6.06 6.60 6.88 7.40
Net Book Value Per Share of Common Stock 0.63 0.66 0.72 0.75 0.82
Percent Earnings Payout 58.28% 48.28% 41.67% 47.39% 42.50%
Percent Earnings Retention 41.72% 51.72% 58.33% 52.61% 57.50%
Dividends Per Common Share 0.03 0.03 0.03 0.04 0.06
Simple Earnings Per Share 0.05 0.06 0.07 0.09 0.13
34
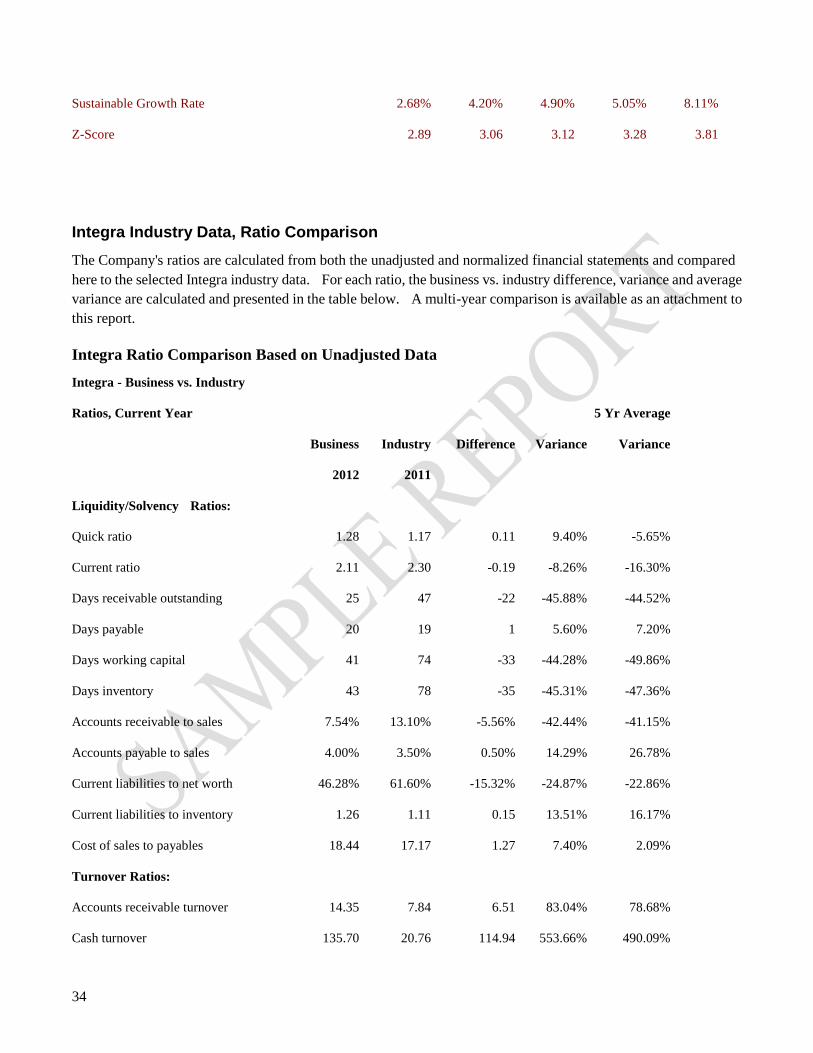
Sustainable Growth Rate 2.68% 4.20% 4.90% 5.05% 8.11%
Z-Score 2.89 3.06 3.12 3.28 3.81
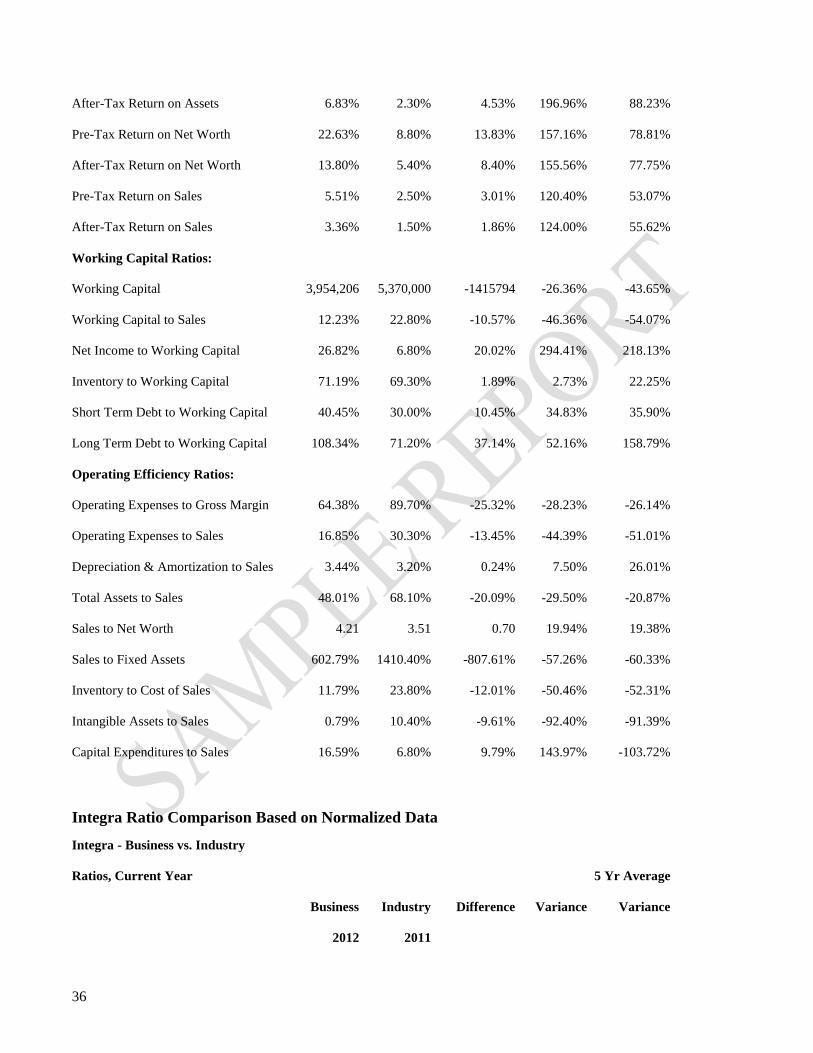
Integra Industry Data, Ratio Comparison
The Company's ratios are calculated from both the unadjusted and normalized financial statements and compared
here to the selected Integra industry data. For each ratio, the business vs. industry difference, variance and average
variance are calculated and presented in the table below. A multi-year comparison is available as an attachment to
this report.
Integra Ratio Comparison Based on Unadjusted Data
Integra - Business vs. Industry
Ratios, Current Year 5 Yr Average
Business Industry Difference Variance Variance
2012 2011
Liquidity/Solvency Ratios:
Quick ratio 1.28 1.17 0.11 9.40% -5.65%
Current ratio 2.11 2.30 -0.19 -8.26% -16.30%
Days receivable outstanding 25 47 -22 -45.88% -44.52%
Days payable 20 19 1 5.60% 7.20%
Days working capital 41 74 -33 -44.28% -49.86%
Days inventory 43 78 -35 -45.31% -47.36%
Accounts receivable to sales 7.54% 13.10% -5.56% -42.44% -41.15%
Accounts payable to sales 4.00% 3.50% 0.50% 14.29% 26.78%
Current liabilities to net worth 46.28% 61.60% -15.32% -24.87% -22.86%
Current liabilities to inventory 1.26 1.11 0.15 13.51% 16.17%
Cost of sales to payables 18.44 17.17 1.27 7.40% 2.09%
Turnover Ratios:
Accounts receivable turnover 14.35 7.84 6.51 83.04% 78.68%
Cash turnover 135.70 20.76 114.94 553.66% 490.09%
35
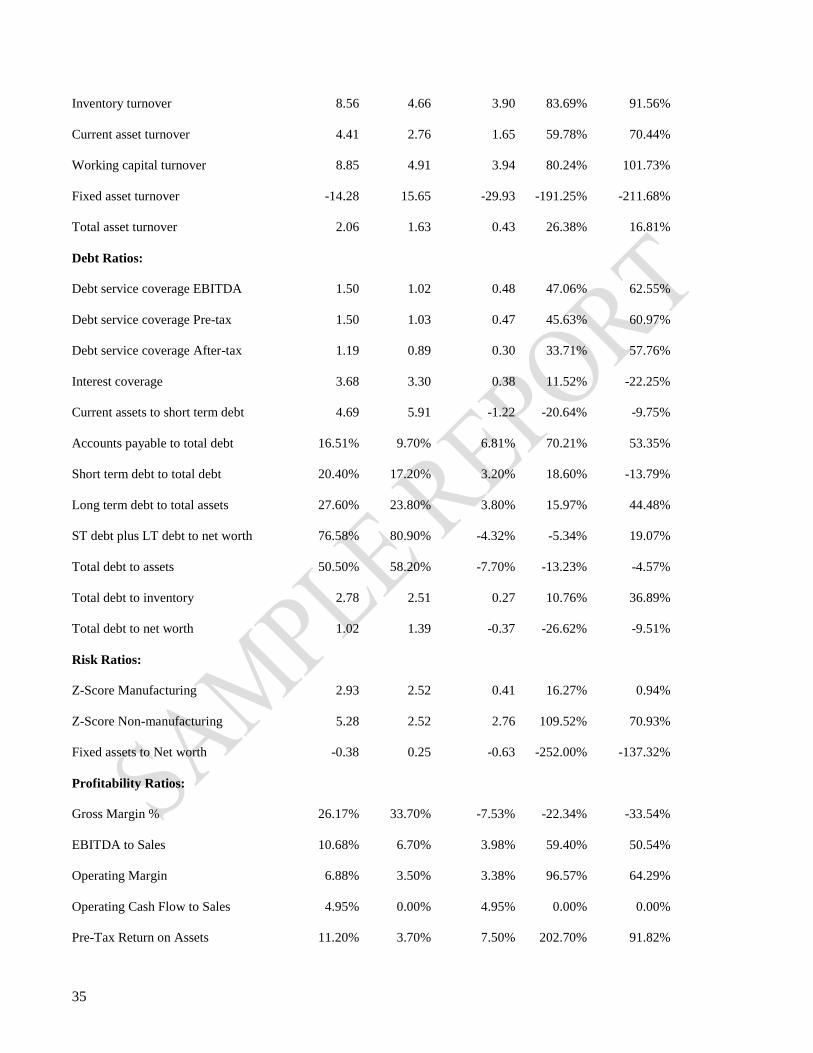
Inventory turnover 8.56 4.66 3.90 83.69% 91.56%
Current asset turnover 4.41 2.76 1.65 59.78% 70.44%
Working capital turnover 8.85 4.91 3.94 80.24% 101.73%
Fixed asset turnover -14.28 15.65 -29.93 -191.25% -211.68%
Total asset turnover 2.06 1.63 0.43 26.38% 16.81%
Debt Ratios:
Debt service coverage EBITDA 1.50 1.02 0.48 47.06% 62.55%
Debt service coverage Pre-tax 1.50 1.03 0.47 45.63% 60.97%
Debt service coverage After-tax 1.19 0.89 0.30 33.71% 57.76%
Interest coverage 3.68 3.30 0.38 11.52% -22.25%
Current assets to short term debt 4.69 5.91 -1.22 -20.64% -9.75%
Accounts payable to total debt 16.51% 9.70% 6.81% 70.21% 53.35%
Short term debt to total debt 20.40% 17.20% 3.20% 18.60% -13.79%
Long term debt to total assets 27.60% 23.80% 3.80% 15.97% 44.48%
ST debt plus LT debt to net worth 76.58% 80.90% -4.32% -5.34% 19.07%
Total debt to assets 50.50% 58.20% -7.70% -13.23% -4.57%
Total debt to inventory 2.78 2.51 0.27 10.76% 36.89%
Total debt to net worth 1.02 1.39 -0.37 -26.62% -9.51%
Risk Ratios:
Z-Score Manufacturing 2.93 2.52 0.41 16.27% 0.94%
Z-Score Non-manufacturing 5.28 2.52 2.76 109.52% 70.93%
Fixed assets to Net worth -0.38 0.25 -0.63 -252.00% -137.32%
Profitability Ratios:
Gross Margin % 26.17% 33.70% -7.53% -22.34% -33.54%
EBITDA to Sales 10.68% 6.70% 3.98% 59.40% 50.54%
Operating Margin 6.88% 3.50% 3.38% 96.57% 64.29%
Operating Cash Flow to Sales 4.95% 0.00% 4.95% 0.00% 0.00%
Pre-Tax Return on Assets 11.20% 3.70% 7.50% 202.70% 91.82%
36
After-Tax Return on Assets 6.83% 2.30% 4.53% 196.96% 88.23%
Pre-Tax Return on Net Worth 22.63% 8.80% 13.83% 157.16% 78.81%
After-Tax Return on Net Worth 13.80% 5.40% 8.40% 155.56% 77.75%
Pre-Tax Return on Sales 5.51% 2.50% 3.01% 120.40% 53.07%
After-Tax Return on Sales 3.36% 1.50% 1.86% 124.00% 55.62%
Working Capital Ratios:
Working Capital 3,954,206 5,370,000 -1415794 -26.36% -43.65%
Working Capital to Sales 12.23% 22.80% -10.57% -46.36% -54.07%
Net Income to Working Capital 26.82% 6.80% 20.02% 294.41% 218.13%
Inventory to Working Capital 71.19% 69.30% 1.89% 2.73% 22.25%
Short Term Debt to Working Capital 40.45% 30.00% 10.45% 34.83% 35.90%
Long Term Debt to Working Capital 108.34% 71.20% 37.14% 52.16% 158.79%
Operating Efficiency Ratios:
Operating Expenses to Gross Margin 64.38% 89.70% -25.32% -28.23% -26.14%
Operating Expenses to Sales 16.85% 30.30% -13.45% -44.39% -51.01%
Depreciation & Amortization to Sales 3.44% 3.20% 0.24% 7.50% 26.01%
Total Assets to Sales 48.01% 68.10% -20.09% -29.50% -20.87%
Sales to Net Worth 4.21 3.51 0.70 19.94% 19.38%
Sales to Fixed Assets 602.79% 1410.40% -807.61% -57.26% -60.33%
Inventory to Cost of Sales 11.79% 23.80% -12.01% -50.46% -52.31%
Intangible Assets to Sales 0.79% 10.40% -9.61% -92.40% -91.39%
Capital Expenditures to Sales 16.59% 6.80% 9.79% 143.97% -103.72%
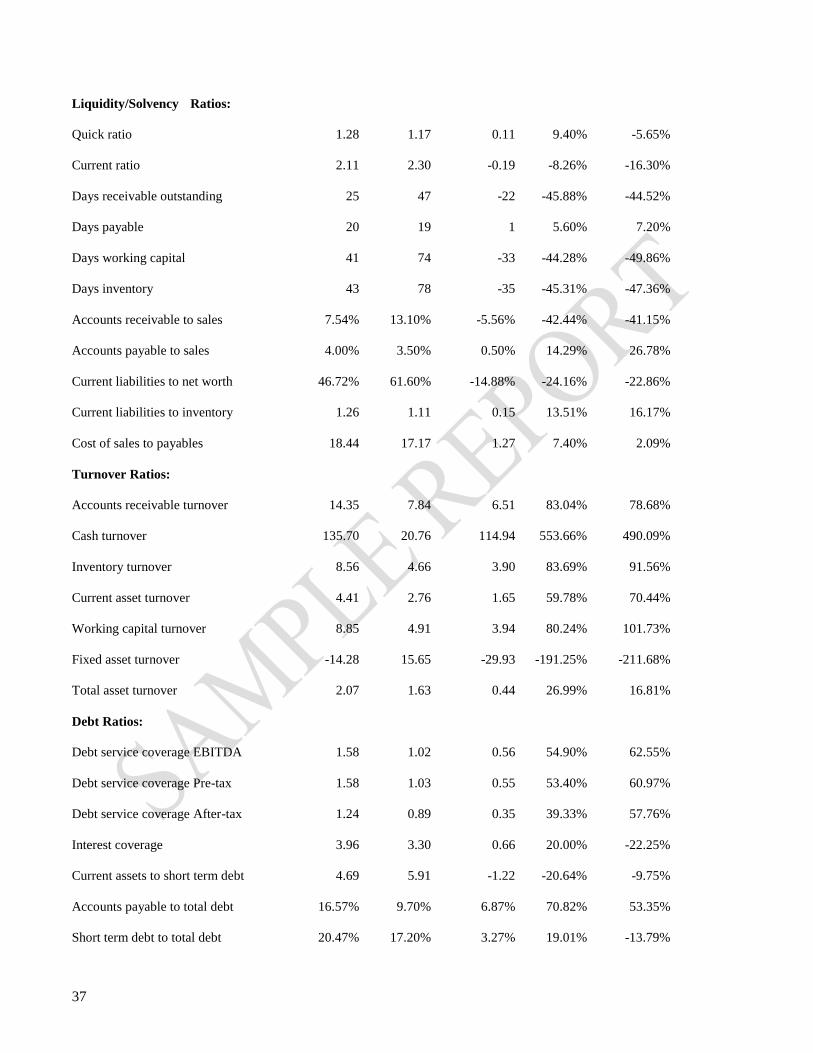
Integra Ratio Comparison Based on Normalized Data
Integra - Business vs. Industry
Ratios, Current Year 5 Yr Average
Business Industry Difference Variance Variance
2012 2011
37
Liquidity/Solvency Ratios:
Quick ratio 1.28 1.17 0.11 9.40% -5.65%
Current ratio 2.11 2.30 -0.19 -8.26% -16.30%
Days receivable outstanding 25 47 -22 -45.88% -44.52%
Days payable 20 19 1 5.60% 7.20%
Days working capital 41 74 -33 -44.28% -49.86%
Days inventory 43 78 -35 -45.31% -47.36%
Accounts receivable to sales 7.54% 13.10% -5.56% -42.44% -41.15%
Accounts payable to sales 4.00% 3.50% 0.50% 14.29% 26.78%
Current liabilities to net worth 46.72% 61.60% -14.88% -24.16% -22.86%
Current liabilities to inventory 1.26 1.11 0.15 13.51% 16.17%
Cost of sales to payables 18.44 17.17 1.27 7.40% 2.09%
Turnover Ratios:
Accounts receivable turnover 14.35 7.84 6.51 83.04% 78.68%
Cash turnover 135.70 20.76 114.94 553.66% 490.09%
Inventory turnover 8.56 4.66 3.90 83.69% 91.56%
Current asset turnover 4.41 2.76 1.65 59.78% 70.44%
Working capital turnover 8.85 4.91 3.94 80.24% 101.73%
Fixed asset turnover -14.28 15.65 -29.93 -191.25% -211.68%
Total asset turnover 2.07 1.63 0.44 26.99% 16.81%
Debt Ratios:
Debt service coverage EBITDA 1.58 1.02 0.56 54.90% 62.55%
Debt service coverage Pre-tax 1.58 1.03 0.55 53.40% 60.97%
Debt service coverage After-tax 1.24 0.89 0.35 39.33% 57.76%
Interest coverage 3.96 3.30 0.66 20.00% -22.25%
Current assets to short term debt 4.69 5.91 -1.22 -20.64% -9.75%
Accounts payable to total debt 16.57% 9.70% 6.87% 70.82% 53.35%
Short term debt to total debt 20.47% 17.20% 3.27% 19.01% -13.79%
38
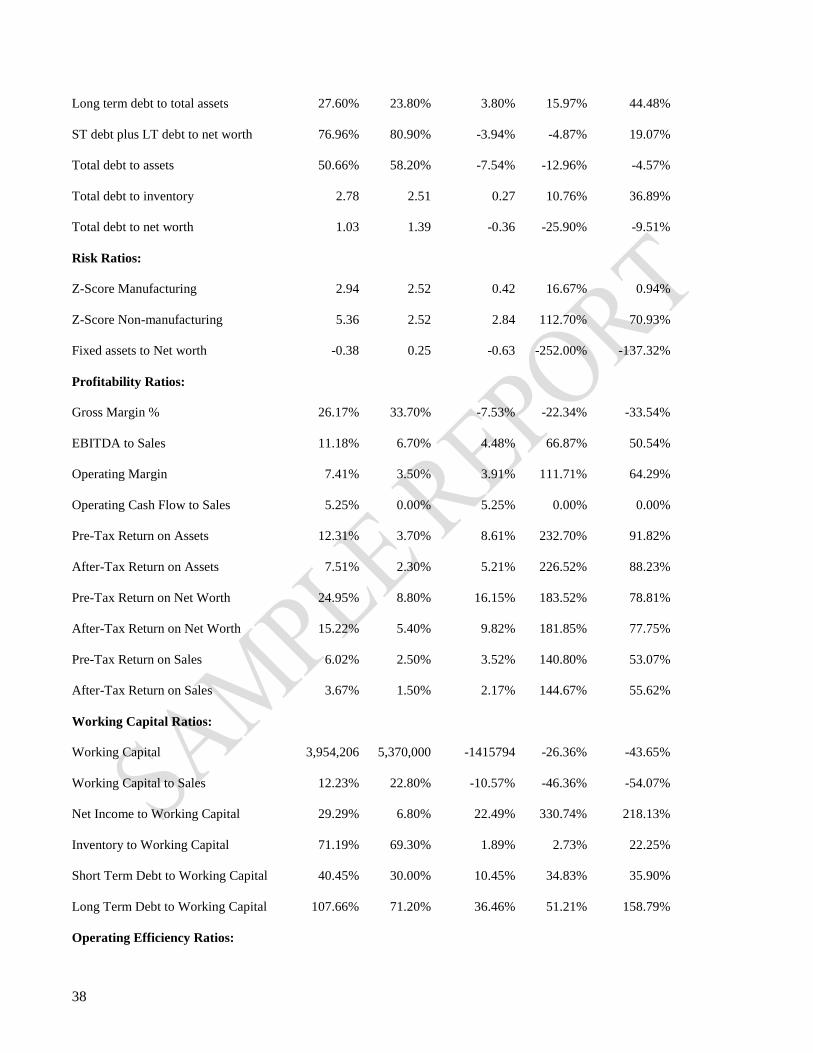
Long term debt to total assets 27.60% 23.80% 3.80% 15.97% 44.48%
ST debt plus LT debt to net worth 76.96% 80.90% -3.94% -4.87% 19.07%
Total debt to assets 50.66% 58.20% -7.54% -12.96% -4.57%
Total debt to inventory 2.78 2.51 0.27 10.76% 36.89%
Total debt to net worth 1.03 1.39 -0.36 -25.90% -9.51%
Risk Ratios:
Z-Score Manufacturing 2.94 2.52 0.42 16.67% 0.94%
Z-Score Non-manufacturing 5.36 2.52 2.84 112.70% 70.93%
Fixed assets to Net worth -0.38 0.25 -0.63 -252.00% -137.32%
Profitability Ratios:
Gross Margin % 26.17% 33.70% -7.53% -22.34% -33.54%
EBITDA to Sales 11.18% 6.70% 4.48% 66.87% 50.54%
Operating Margin 7.41% 3.50% 3.91% 111.71% 64.29%
Operating Cash Flow to Sales 5.25% 0.00% 5.25% 0.00% 0.00%
Pre-Tax Return on Assets 12.31% 3.70% 8.61% 232.70% 91.82%
After-Tax Return on Assets 7.51% 2.30% 5.21% 226.52% 88.23%
Pre-Tax Return on Net Worth 24.95% 8.80% 16.15% 183.52% 78.81%
After-Tax Return on Net Worth 15.22% 5.40% 9.82% 181.85% 77.75%
Pre-Tax Return on Sales 6.02% 2.50% 3.52% 140.80% 53.07%
After-Tax Return on Sales 3.67% 1.50% 2.17% 144.67% 55.62%
Working Capital Ratios:
Working Capital 3,954,206 5,370,000 -1415794 -26.36% -43.65%
Working Capital to Sales 12.23% 22.80% -10.57% -46.36% -54.07%
Net Income to Working Capital 29.29% 6.80% 22.49% 330.74% 218.13%
Inventory to Working Capital 71.19% 69.30% 1.89% 2.73% 22.25%
Short Term Debt to Working Capital 40.45% 30.00% 10.45% 34.83% 35.90%
Long Term Debt to Working Capital 107.66% 71.20% 36.46% 51.21% 158.79%
Operating Efficiency Ratios:
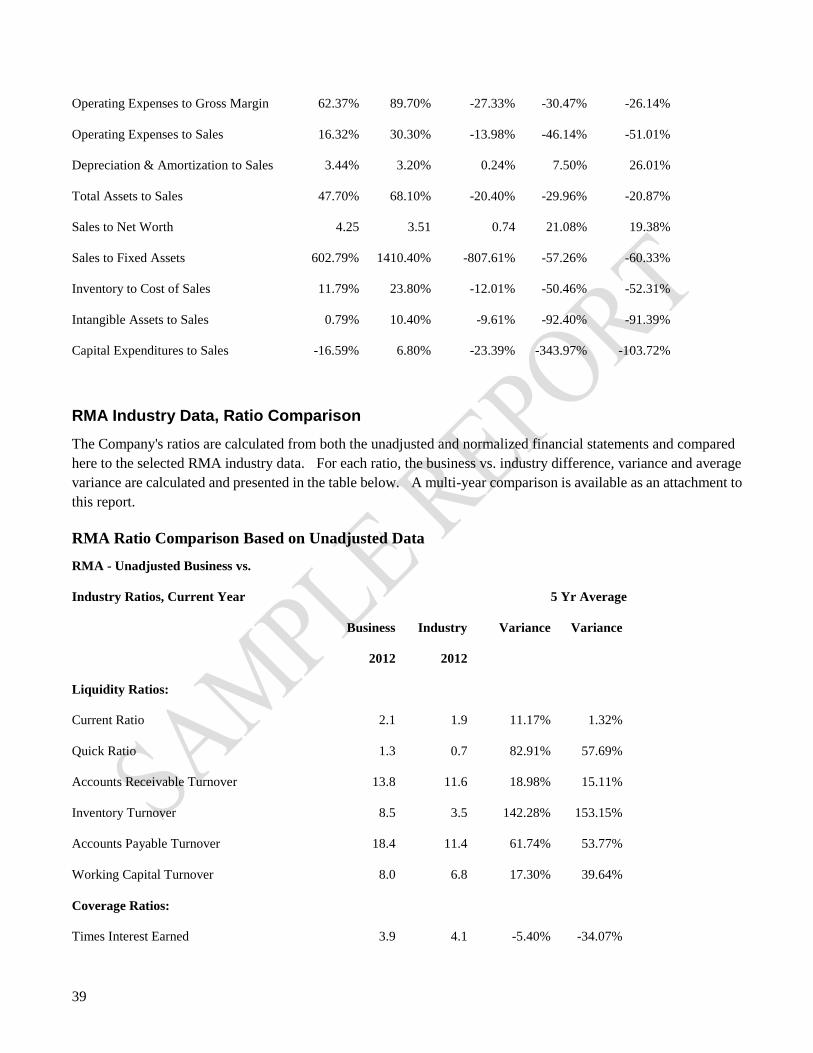
39
Operating Expenses to Gross Margin 62.37% 89.70% -27.33% -30.47% -26.14%
Operating Expenses to Sales 16.32% 30.30% -13.98% -46.14% -51.01%
Depreciation & Amortization to Sales 3.44% 3.20% 0.24% 7.50% 26.01%
Total Assets to Sales 47.70% 68.10% -20.40% -29.96% -20.87%
Sales to Net Worth 4.25 3.51 0.74 21.08% 19.38%
Sales to Fixed Assets 602.79% 1410.40% -807.61% -57.26% -60.33%
Inventory to Cost of Sales 11.79% 23.80% -12.01% -50.46% -52.31%
Intangible Assets to Sales 0.79% 10.40% -9.61% -92.40% -91.39%
Capital Expenditures to Sales -16.59% 6.80% -23.39% -343.97% -103.72%
RMA Industry Data, Ratio Comparison
The Company's ratios are calculated from both the unadjusted and normalized financial statements and compared
here to the selected RMA industry data. For each ratio, the business vs. industry difference, variance and average
variance are calculated and presented in the table below. A multi-year comparison is available as an attachment to
this report.
RMA Ratio Comparison Based on Unadjusted Data
RMA - Unadjusted Business vs.
Industry Ratios, Current Year 5 Yr Average
Business Industry Variance Variance
2012 2012
Liquidity Ratios:
Current Ratio 2.1 1.9 11.17% 1.32%
Quick Ratio 1.3 0.7 82.91% 57.69%
Accounts Receivable Turnover 13.8 11.6 18.98% 15.11%
Inventory Turnover 8.5 3.5 142.28% 153.15%
Accounts Payable Turnover 18.4 11.4 61.74% 53.77%
Working Capital Turnover 8.0 6.8 17.30% 39.64%
Coverage Ratios:
Times Interest Earned 3.9 4.1 -5.40% -34.07%
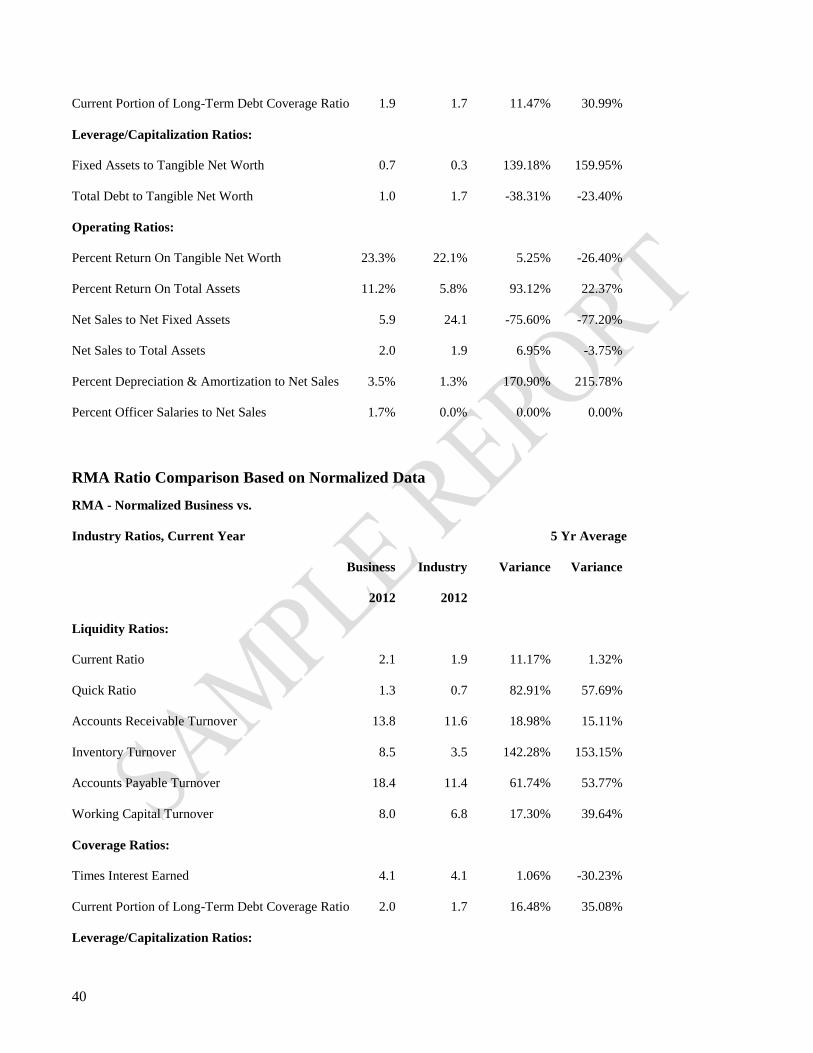
40
Current Portion of Long-Term Debt Coverage Ratio 1.9 1.7 11.47% 30.99%
Leverage/Capitalization Ratios:
Fixed Assets to Tangible Net Worth 0.7 0.3 139.18% 159.95%
Total Debt to Tangible Net Worth 1.0 1.7 -38.31% -23.40%
Operating Ratios:
Percent Return On Tangible Net Worth 23.3% 22.1% 5.25% -26.40%
Percent Return On Total Assets 11.2% 5.8% 93.12% 22.37%
Net Sales to Net Fixed Assets 5.9 24.1 -75.60% -77.20%
Net Sales to Total Assets 2.0 1.9 6.95% -3.75%
Percent Depreciation & Amortization to Net Sales 3.5% 1.3% 170.90% 215.78%
Percent Officer Salaries to Net Sales 1.7% 0.0% 0.00% 0.00%
RMA Ratio Comparison Based on Normalized Data
RMA - Normalized Business vs.
Industry Ratios, Current Year 5 Yr Average
Business Industry Variance Variance
2012 2012
Liquidity Ratios:
Current Ratio 2.1 1.9 11.17% 1.32%
Quick Ratio 1.3 0.7 82.91% 57.69%
Accounts Receivable Turnover 13.8 11.6 18.98% 15.11%
Inventory Turnover 8.5 3.5 142.28% 153.15%
Accounts Payable Turnover 18.4 11.4 61.74% 53.77%
Working Capital Turnover 8.0 6.8 17.30% 39.64%
Coverage Ratios:
Times Interest Earned 4.1 4.1 1.06% -30.23%
Current Portion of Long-Term Debt Coverage Ratio 2.0 1.7 16.48% 35.08%
Leverage/Capitalization Ratios:

41
Fixed Assets to Tangible Net Worth 0.7 0.3 141.54% 162.00%
Total Debt to Tangible Net Worth 1.1 1.7 -37.91% -23.04%
Operating Ratios:
Percent Return On Tangible Net Worth 25.7% 22.1% 16.07% -19.01%
Percent Return On Total Assets 12.3% 5.8% 112.26% 34.34%
Net Sales to Net Fixed Assets 5.9 24.1 -75.60% -77.20%
Net Sales to Total Assets 2.0 1.9 7.64% -3.24%
Percent Depreciation & Amortization to Net Sales 3.5% 1.3% 170.90% 215.78%
Percent Officer Salaries to Net Sales 1.3% 0.0% 0.00% 0.00%
Integra Industry Data, Growth Comparison
Key year-to-year growth and compound annual growth metrics are calculated from both the unadjusted and
normalized financial statements and compared here to the selected Integra industry data. For each key financial
statement item in the following table, the calculated business growth and the Integra industry growth data are
presented along with the business versus industry difference.
Integra Growth Comparison Based on Unadjusted Data
Integra - Business vs. Industry
Growth, Multi Year
2007 2008 2009 2010 2011
Annual Growth
Revenue - Business 4.71% 5.85% 4.19%
Industry -1.60% -18.20% 2.40% 25.00%
Difference from industry 22.91% 3.45% -20.81%
EBITDA - Business 13.35% 6.72% 5.00%
Industry -1.50% -17.80% 2.10% 25.80%
Difference from industry 31.15% 4.62% -20.80%
Pre-Tax Income - Business 23.99% 8.92% 15.05%
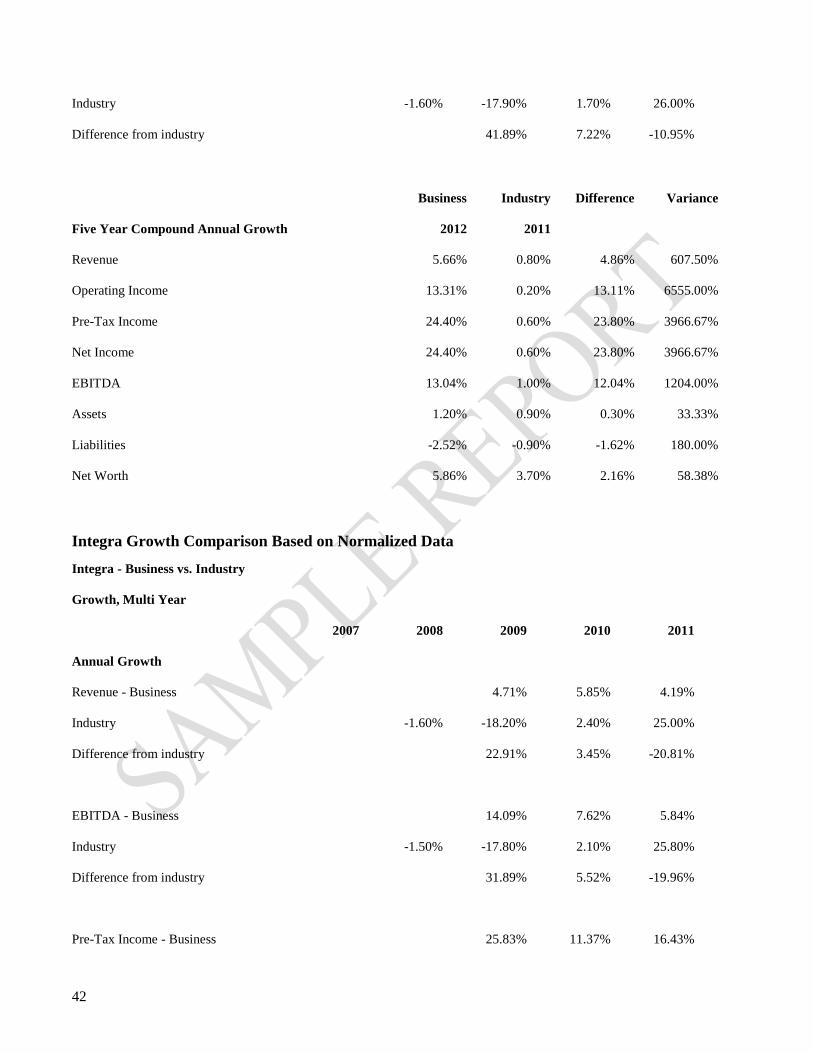
42
Industry -1.60% -17.90% 1.70% 26.00%
Difference from industry 41.89% 7.22% -10.95%
Business Industry Difference Variance
Five Year Compound Annual Growth 2012 2011
Revenue 5.66% 0.80% 4.86% 607.50%
Operating Income 13.31% 0.20% 13.11% 6555.00%
Pre-Tax Income 24.40% 0.60% 23.80% 3966.67%
Net Income 24.40% 0.60% 23.80% 3966.67%
EBITDA 13.04% 1.00% 12.04% 1204.00%
Assets 1.20% 0.90% 0.30% 33.33%
Liabilities -2.52% -0.90% -1.62% 180.00%
Net Worth 5.86% 3.70% 2.16% 58.38%
Integra Growth Comparison Based on Normalized Data
Integra - Business vs. Industry
Growth, Multi Year
2007 2008 2009 2010 2011
Annual Growth
Revenue - Business 4.71% 5.85% 4.19%
Industry -1.60% -18.20% 2.40% 25.00%
Difference from industry 22.91% 3.45% -20.81%
EBITDA - Business 14.09% 7.62% 5.84%
Industry -1.50% -17.80% 2.10% 25.80%
Difference from industry 31.89% 5.52% -19.96%
Pre-Tax Income - Business 25.83% 11.37% 16.43%
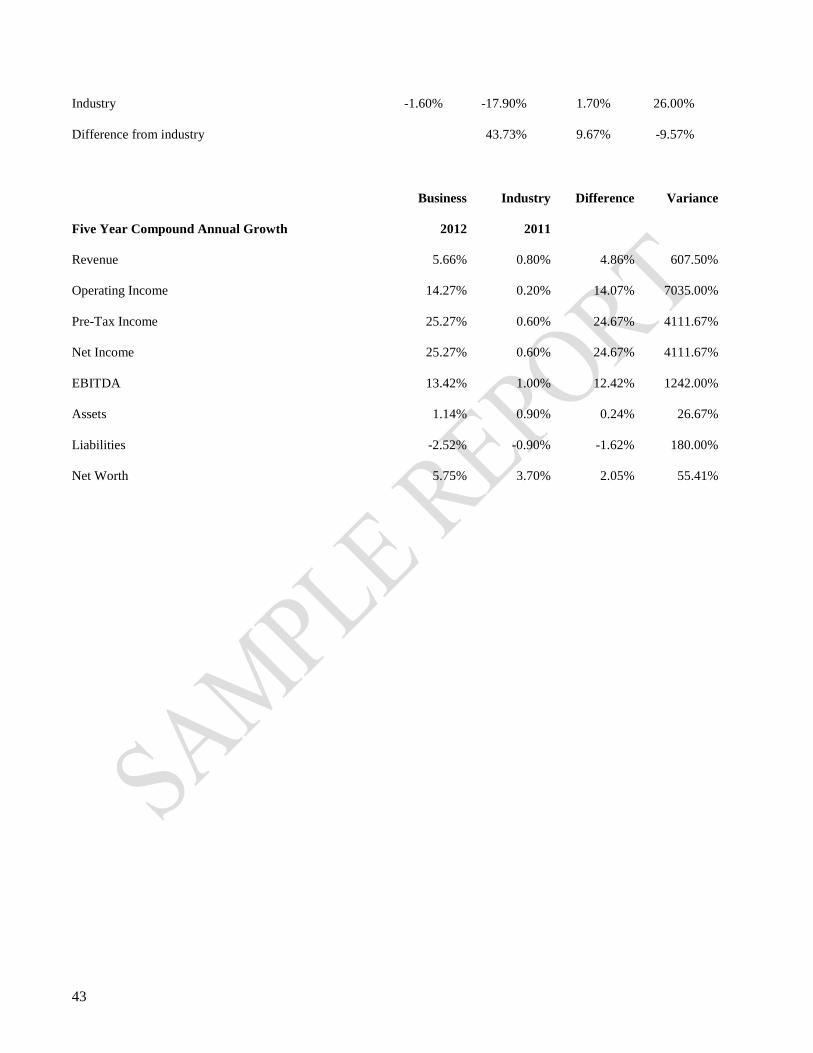
43
Industry -1.60% -17.90% 1.70% 26.00%
Difference from industry 43.73% 9.67% -9.57%
Business Industry Difference Variance
Five Year Compound Annual Growth 2012 2011
Revenue 5.66% 0.80% 4.86% 607.50%
Operating Income 14.27% 0.20% 14.07% 7035.00%
Pre-Tax Income 25.27% 0.60% 24.67% 4111.67%
Net Income 25.27% 0.60% 24.67% 4111.67%
EBITDA 13.42% 1.00% 12.42% 1242.00%
Assets 1.14% 0.90% 0.24% 26.67%
Liabilities -2.52% -0.90% -1.62% 180.00%
Net Worth 5.75% 3.70% 2.05% 55.41%
44
Valuation of Erin’s Fitness Gear, Inc.
We were engaged by Erin K. O’Donnell, President of Erin’s Fitness Gear, Inc. to issue a detailed report. Our
objective was to estimate the Fair Market Value of 80.00% of Erin’s Fitness Gear’s, Inc.'s non-voting common
shares as of June 30, 2013.
The standard of value used in our valuation of Erin’s, Inc. is Fair Market Value. Fair Market Value is defined in
IRS Revenue Ruling 59-60 as: “The price at which the property would change hands between a willing buyer and a
willing seller when the former is not under any compulsion to buy and the latter is not under any compulsion to sell,
both parties having reasonable knowledge of relevant facts. Court decisions frequently state in addition that the
hypothetical buyer and seller are assumed to be able, as well as willing, to trade and to be well informed about the
property and concerning the market for such property.”
The purpose of this valuation is to estimate the Fair Market Value of 80% of Erin’s Fitness Gear’s, Inc.’s non-voting
common shares as of June 30, 2013. This report is prepared for Erin K. O’Donnell, President of Erin’s Fitness
Gear, Inc. and should not be used by others. This report is dated July 30, 2013.
There are a large number of factors to consider when estimating the common stock value of any business entity.
These factors vary for each valuation depending on the unique circumstances of the business enterprise and general
economic conditions that exist at the effective date of the valuation. However, fundamental guidelines of the
factors to consider in any valuation have been established. The most commonly used valuation guidelines are
derived from the Internal Revenue Service's Revenue Ruling 59-60. Revenue Ruling 59-60 states that in the
valuation of the stock of closely held businesses, the following factors, although not all inclusive, are fundamental
and require careful consideration in each case:
a) The nature of the business and the history of the enterprise from its inception.
b) The economic outlook in general and the condition and outlook of the specific industry in particular.
c) The book value of the stock and the financial condition of the business.
d) The earning capacity of the company.
e) The dividend-paying capacity.
f) Whether or not the enterprise has goodwill or other intangible value.
g) Sales of the stock and the size of the block of stock to be valued.
h) The market price of stocks of corporations engaged in the same or a similar line of business having their
stocks actively traded in a free and open market, either on an exchange or over-the-counter.
Based on circumstances unique to Erin’s Fitness Gear, Inc’s as of June 30, 2013, additional factors have been
considered.
45
In addition to providing general valuation guidelines, Revenue Ruling 59-60 outlines other considerations and
techniques for valuing the stock of closely held businesses. The techniques are commonly divided into general
approaches, i.e., the Asset, Income and Market approaches. Specific methods are then used to estimate the value of
the total business entity under each approach. Our conclusion of Fair Market Value is determined based on the
results of these methods and the specific circumstances surrounding the interest being valued.

46
Overview of Valuation Approaches and Methods
As previously specified, various approaches have been used to value Erin’s Fitness Gear, Inc. These approaches,
described below, are the: 1) Asset Approach, 2) Income Approach, and 3) Market Approach.
Asset Approach
The Asset Approach is generally considered to yield the minimum benchmark of value for an operating enterprise.
The most common methods within this approach are Net Asset Value and Liquidation Value. Net Asset Value
represents net equity of the business after assets and liabilities have been adjusted to their fair market values. The
Liquidation Value of the business represents the present value of the estimated net proceeds from liquidating the
Company's assets and paying off its liabilities.
Income Approach
The Income Approach serves to estimate value by considering the income (benefits) generated by the asset over a
period of time. This approach is based on the fundamental valuation principle that the value of a business is equal
to the present worth of the future benefits of ownership. The term income does not necessarily refer to income in
the accounting sense but to future benefits accruing to the owner.
The most common methods under this approach are Capitalization of Earnings and Discounted Future Earnings.
Under the Capitalization of Earnings method, normalized historic earnings are capitalized at a rate that reflects the
risk inherent in the expected future growth in those earnings. The Discounted Future Earnings method discounts
projected future earnings back to present value at a rate that reflects the risk inherent in the projected earnings.
Additional methods under the Income Approach are Capitalization of Excess Earnings and Multiple of
Discretionary Earnings. Commonly referred to as the “formula method,” the Capitalization of Excess Earnings
method determines the value of tangible and intangible assets separately and combines these component values for
an indication of total entity value. Under the Multiple of Discretionary Earnings method, the entity is valued based
on a multiple of “discretionary earnings,” i.e., earnings available to the owner who is also a manager. Both of these
methods are normally used to value small businesses and professional practices.
Market Approach
The Market Approach compares the subject company to the prices of similar companies operating in the same
industry. Comparable companies can be privately owned or publicly traded where the valuation multiples are
determined from the purchase/sale price for the company. A common problem for privately owned businesses is a
lack of publicly available comparable data. Comparable companies can also be publicly traded where the
valuation multiples are derived from the trading price for the public companies stock as of the date of the valuation.
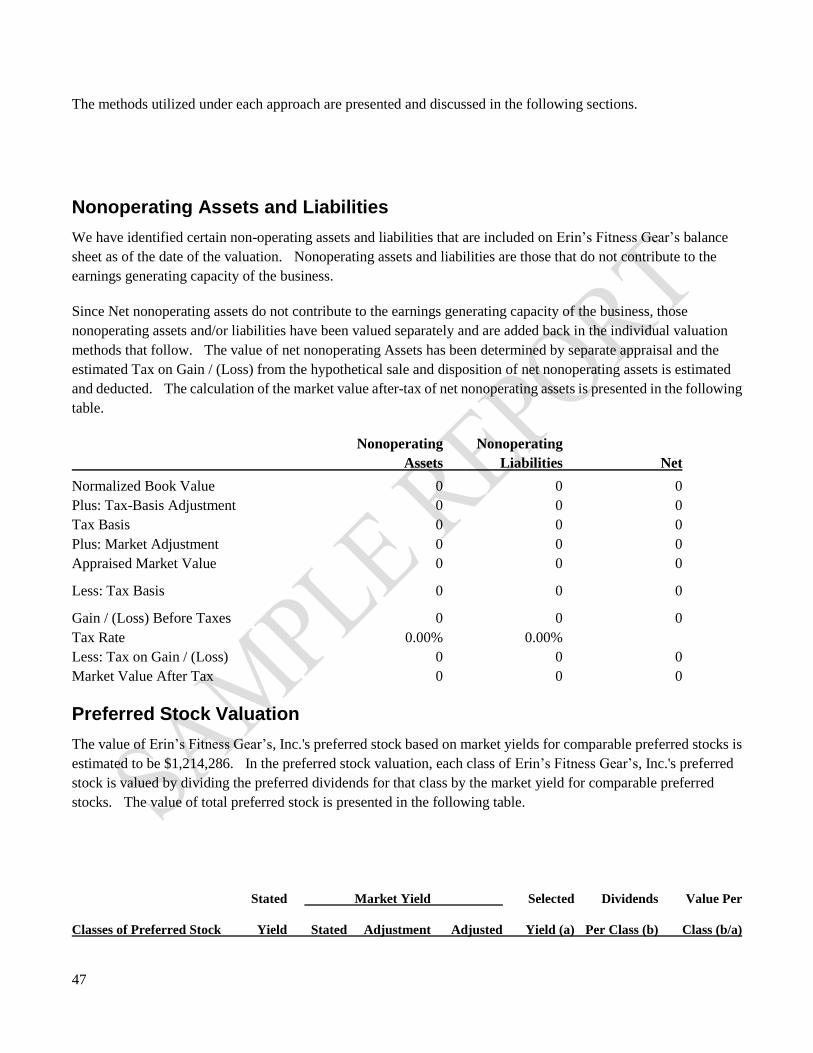
47
The methods utilized under each approach are presented and discussed in the following sections.
Nonoperating Assets and Liabilities
We have identified certain non-operating assets and liabilities that are included on Erin’s Fitness Gear’s balance
sheet as of the date of the valuation. Nonoperating assets and liabilities are those that do not contribute to the
earnings generating capacity of the business.
Since Net nonoperating assets do not contribute to the earnings generating capacity of the business, those
nonoperating assets and/or liabilities have been valued separately and are added back in the individual valuation
methods that follow. The value of net nonoperating Assets has been determined by separate appraisal and the
estimated Tax on Gain / (Loss) from the hypothetical sale and disposition of net nonoperating assets is estimated
and deducted. The calculation of the market value after-tax of net nonoperating assets is presented in the following
table.
Nonoperating Nonoperating
Assets Liabilities Net
Normalized Book Value 0 0 0
Plus: Tax-Basis Adjustment 0 0 0
Tax Basis 0 0 0
Plus: Market Adjustment 0 0 0
Appraised Market Value 0 0 0
Less: Tax Basis 0 0 0
Gain / (Loss) Before Taxes 0 0 0
Tax Rate 0.00% 0.00%
Less: Tax on Gain / (Loss) 0 0 0
Market Value After Tax 0 0 0
Preferred Stock Valuation
The value of Erin’s Fitness Gear’s, Inc.'s preferred stock based on market yields for comparable preferred stocks is
estimated to be $1,214,286. In the preferred stock valuation, each class of Erin’s Fitness Gear’s, Inc.'s preferred
stock is valued by dividing the preferred dividends for that class by the market yield for comparable preferred
stocks. The value of total preferred stock is presented in the following table.
Stated Market Yield Selected Dividends Value Per
Classes of Preferred Stock Yield Stated Adjustment Adjusted Yield (a) Per Class (b) Class (b/a)
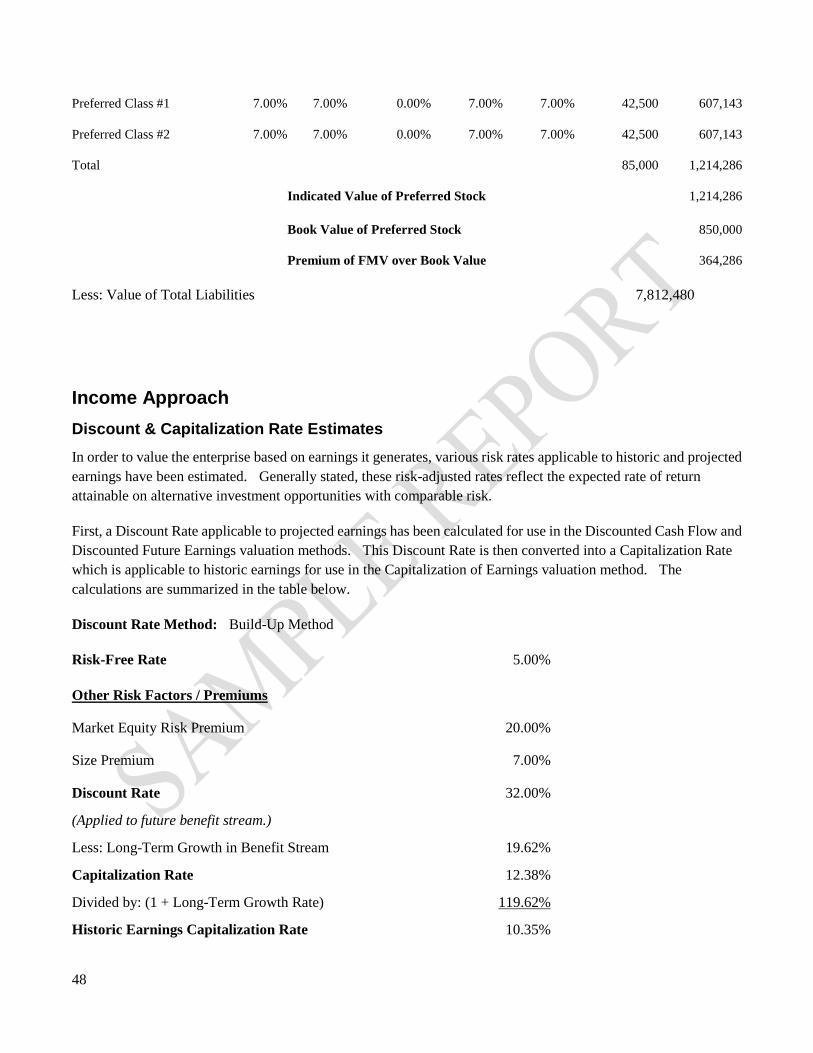
48
Preferred Class #1 7.00% 7.00% 0.00% 7.00% 7.00% 42,500 607,143
Preferred Class #2 7.00% 7.00% 0.00% 7.00% 7.00% 42,500 607,143
Total 85,000 1,214,286
Indicated Value of Preferred Stock 1,214,286
Book Value of Preferred Stock 850,000
Premium of FMV over Book Value 364,286
Less: Value of Total Liabilities 7,812,480
Income Approach
Discount & Capitalization Rate Estimates
In order to value the enterprise based on earnings it generates, various risk rates applicable to historic and projected
earnings have been estimated. Generally stated, these risk-adjusted rates reflect the expected rate of return
attainable on alternative investment opportunities with comparable risk.
First, a Discount Rate applicable to projected earnings has been calculated for use in the Discounted Cash Flow and
Discounted Future Earnings valuation methods. This Discount Rate is then converted into a Capitalization Rate
which is applicable to historic earnings for use in the Capitalization of Earnings valuation method. The
calculations are summarized in the table below.
Discount Rate Method: Build-Up Method
Risk-Free Rate 5.00%
Other Risk Factors / Premiums
Market Equity Risk Premium 20.00%
Size Premium 7.00%
Discount Rate 32.00%
(Applied to future benefit stream.)
Less: Long-Term Growth in Benefit Stream 19.62%
Capitalization Rate 12.38%
Divided by: (1 + Long-Term Growth Rate) 119.62%
Historic Earnings Capitalization Rate 10.35%
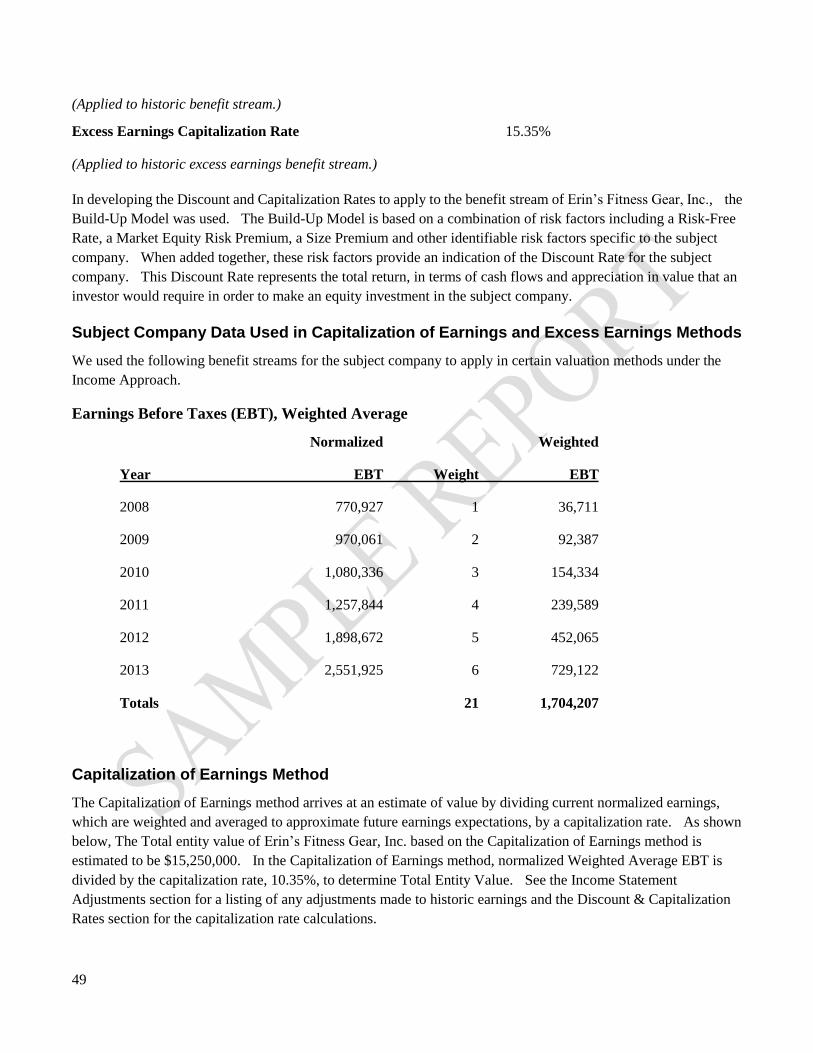
49
(Applied to historic benefit stream.)
Excess Earnings Capitalization Rate 15.35%
(Applied to historic excess earnings benefit stream.)
In developing the Discount and Capitalization Rates to apply to the benefit stream of Erin’s Fitness Gear, Inc., the
Build-Up Model was used. The Build-Up Model is based on a combination of risk factors including a Risk-Free
Rate, a Market Equity Risk Premium, a Size Premium and other identifiable risk factors specific to the subject
company. When added together, these risk factors provide an indication of the Discount Rate for the subject
company. This Discount Rate represents the total return, in terms of cash flows and appreciation in value that an
investor would require in order to make an equity investment in the subject company.
Subject Company Data Used in Capitalization of Earnings and Excess Earnings Methods
We used the following benefit streams for the subject company to apply in certain valuation methods under the
Income Approach.
Earnings Before Taxes (EBT), Weighted Average
Normalized Weighted
Year EBT Weight EBT
2008 770,927 1 36,711
2009 970,061 2 92,387
2010 1,080,336 3 154,334
2011 1,257,844 4 239,589
2012 1,898,672 5 452,065
2013 2,551,925 6 729,122
Totals 21 1,704,207
Capitalization of Earnings Method
The Capitalization of Earnings method arrives at an estimate of value by dividing current normalized earnings,
which are weighted and averaged to approximate future earnings expectations, by a capitalization rate. As shown
below, The Total entity value of Erin’s Fitness Gear, Inc. based on the Capitalization of Earnings method is
estimated to be $15,250,000. In the Capitalization of Earnings method, normalized Weighted Average EBT is
divided by the capitalization rate, 10.35%, to determine Total Entity Value. See the Income Statement
Adjustments section for a listing of any adjustments made to historic earnings and the Discount & Capitalization
Rates section for the capitalization rate calculations.

50
Capitalization of Earnings Normalized Weighting Weighted
EBT Factor Earnings
Fiscal Year End 2008 770,927 1.0 770,927
Fiscal Year End 2009 970,061 2.0 1,940,122
Fiscal Year End 2010 1,080,336 3.0 3,241,008
Fiscal Year End 2011 1,257,844 4.0 5,031,376
Fiscal Year End 2012 1,898,672 5.0 9,493,360
Projected 2013 2,551,925 6.0 15,311,553
Sum of Weighted Earnings 35,788,346
Divided by: Sum of Weighting Factors 21.0
Weighted Average EBT 1,704,207
Divided by: Historic Capitalization Rate 10.35%
Total Entity Value 16,465,768
Less: Fair Market Value of Preferred Stock 1,214,286
Calculated Equity Value 15,251,482
Indicated Equity Value 15,250,000
Capitalization of Excess Earnings
Usually, intangible assets are not reported on the balance sheet unless purchased. However, the existence of and
the value for any intangible assets should be considered. A number of methodologies have been developed to
estimate intangible assets of a business. One commonly used method is the excess earnings method. The excess
earnings method was developed by the U.S. Treasury Department in 1920 in Appeals and Review Memorandum 34
(ARM34). Its current version is found in Revenue Ruling 68-609. The excess earnings method is commonly used
in valuing small businesses and professional practices. The Internal Revenue Service suggests that it is to be used
only when no better basis exists for separately estimating the value of the intangible assets.
The model for the excess earnings method computes the company's equity value based on the "appraised" value of
tangible assets plus an additional amount for intangible assets. A company's tangible assets should provide a
current return to the owner. Since there are risks associated with owning the company's assets, the rate of return on
those assets should be commensurate with the risks involved. That rate of return should be either the prevailing
industry rate of return required to attract capital to that industry or an appropriate rate above the risk-free rate. Any
returns produced by the company above the rate on tangible assets are considered to arise from intangible assets.
Accordingly, the weighted average capitalization rate for tangible assets and intangible assets should be equivalent
to the capitalization rate of the entire company.
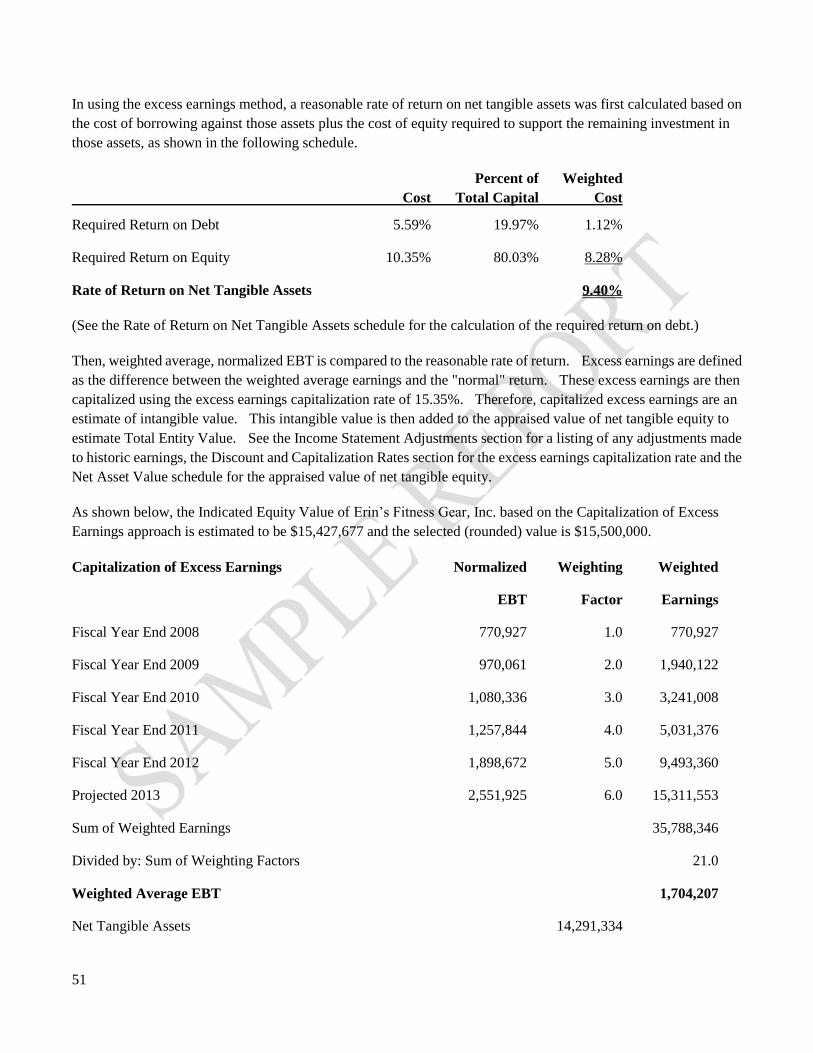
51
In using the excess earnings method, a reasonable rate of return on net tangible assets was first calculated based on
the cost of borrowing against those assets plus the cost of equity required to support the remaining investment in
those assets, as shown in the following schedule.
Percent of Weighted
Cost Total Capital Cost
Required Return on Debt 5.59% 19.97% 1.12%
Required Return on Equity 10.35% 80.03% 8.28%
Rate of Return on Net Tangible Assets 9.40%
(See the Rate of Return on Net Tangible Assets schedule for the calculation of the required return on debt.)
Then, weighted average, normalized EBT is compared to the reasonable rate of return. Excess earnings are defined
as the difference between the weighted average earnings and the "normal" return. These excess earnings are then
capitalized using the excess earnings capitalization rate of 15.35%. Therefore, capitalized excess earnings are an
estimate of intangible value. This intangible value is then added to the appraised value of net tangible equity to
estimate Total Entity Value. See the Income Statement Adjustments section for a listing of any adjustments made
to historic earnings, the Discount and Capitalization Rates section for the excess earnings capitalization rate and the
Net Asset Value schedule for the appraised value of net tangible equity.
As shown below, the Indicated Equity Value of Erin’s Fitness Gear, Inc. based on the Capitalization of Excess
Earnings approach is estimated to be $15,427,677 and the selected (rounded) value is $15,500,000.
Capitalization of Excess Earnings Normalized Weighting Weighted
EBT Factor Earnings
Fiscal Year End 2008 770,927 1.0 770,927
Fiscal Year End 2009 970,061 2.0 1,940,122
Fiscal Year End 2010 1,080,336 3.0 3,241,008
Fiscal Year End 2011 1,257,844 4.0 5,031,376
Fiscal Year End 2012 1,898,672 5.0 9,493,360
Projected 2013 2,551,925 6.0 15,311,553
Sum of Weighted Earnings 35,788,346
Divided by: Sum of Weighting Factors 21.0
Weighted Average EBT 1,704,207
Net Tangible Assets 14,291,334

52
Multiplied by: Rate of Return on Net Tangible Assets 9.40%
Normal Return On Net Tangible Assets 1,343,385
Weighted Average EBT 1,704,207
Less: Normal Return on Net Tangible Assets 1,343,385
Excess Earnings 360,822
Divided by: Excess Earnings Capitalization Rate 15.35%
Intangible Value 2,350,629
Plus: Net Tangible Assets 14,291,334
Total Entity Value 16,641,963
Less: Fair Market Value of Preferred Stock 1,214,286
Calculated Equity Value 15,427,677
Indicated Equity Value 15,500,000
Discounted Future Earnings
The underlying premise for this valuation method is the basic valuation principle that an investment in a business is
worth the present value of all the future benefits it will produce for its owner(s), with each expected future benefit
discounted back to present value at a discount rate that reflects the risk (degree of uncertainty) that those benefits
may not be realized. Therefore, the application of this method requires a determination of the present value of an
expected future benefit stream that the business generates for that owner.
To determine the expected future income stream, we assisted management in preparing projections of the financial
statements for the first 5 years after the valuation date. A summary of the projections and the underlying
assumptions are presented in an appendix to this report.
Discounted Future Earnings Value Calculations
The selected Equity Value based on the Discounted Future Earnings method is $18,250,000 as presented below.
The underlying theory of the Discounted Future Earnings method states that the business is worth the present value,
at the valuation date, of all expected future benefits that the business will generate and are available to the owner(s).
To estimate the expected future benefits, we projected Erin’s Fitness Gear, Inc.'s EBT for 5 years and then
discounted each year's benefit back to present value using an annual Discount Rate of 32.00% that reflects the risk
inherent in realizing the projected benefit stream. Please see the Discount and Capitalization Rates section of this
report for a description of the risk-adjusted Discount Rate.
Because we assume that the business will continue as a going concern beyond the term of the projections, we
estimated a Terminal Value (also referred to as residual value) based on EBT from projected year 5. In
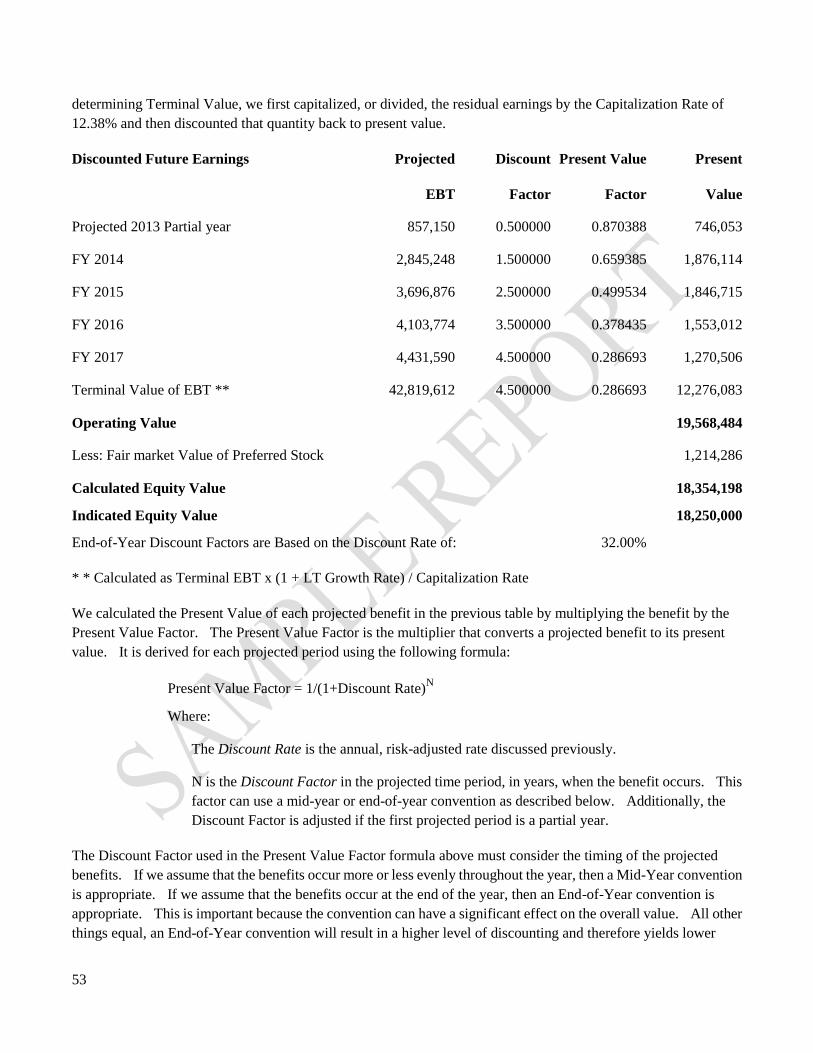
53
determining Terminal Value, we first capitalized, or divided, the residual earnings by the Capitalization Rate of
12.38% and then discounted that quantity back to present value.
Discounted Future Earnings Projected Discount Present Value Present
EBT Factor Factor Value
Projected 2013 Partial year 857,150 0.500000 0.870388 746,053
FY 2014 2,845,248 1.500000 0.659385 1,876,114
FY 2015 3,696,876 2.500000 0.499534 1,846,715
FY 2016 4,103,774 3.500000 0.378435 1,553,012
FY 2017 4,431,590 4.500000 0.286693 1,270,506
Terminal Value of EBT ** 42,819,612 4.500000 0.286693 12,276,083
Operating Value 19,568,484
Less: Fair market Value of Preferred Stock 1,214,286
Calculated Equity Value 18,354,198
Indicated Equity Value 18,250,000
End-of-Year Discount Factors are Based on the Discount Rate of: 32.00%
* * Calculated as Terminal EBT x (1 + LT Growth Rate) / Capitalization Rate
We calculated the Present Value of each projected benefit in the previous table by multiplying the benefit by the
Present Value Factor. The Present Value Factor is the multiplier that converts a projected benefit to its present
value. It is derived for each projected period using the following formula:
Present Value Factor = 1/(1+Discount Rate)N
Where:
The Discount Rate is the annual, risk-adjusted rate discussed previously.
N is the Discount Factor in the projected time period, in years, when the benefit occurs. This
factor can use a mid-year or end-of-year convention as described below. Additionally, the
Discount Factor is adjusted if the first projected period is a partial year.
The Discount Factor used in the Present Value Factor formula above must consider the timing of the projected
benefits. If we assume that the benefits occur more or less evenly throughout the year, then a Mid-Year convention
is appropriate. If we assume that the benefits occur at the end of the year, then an End-of-Year convention is
appropriate. This is important because the convention can have a significant effect on the overall value. All other
things equal, an End-of-Year convention will result in a higher level of discounting and therefore yields lower
54
present values.
When end-of-year discounting is used, the Discount Factor for the first projected year is 1, for the second projected
year is 2, etc. When mid-year discounting is used, the Discount Factor for the first projected year is .5, for the
second projected year is 1.5, etc. We have selected End of Year discounting as the most appropriate convention to
apply to Erin’s Fitness Gear, Inc.'s estimated future benefit stream.
In this case, the first projected period is for a partial year starting at the date of the interim financial statements and
extending until the end of the first projected year. Only the projected partial year benefits are included in present
value calculations for the first projected period. We have excluded the historical portion of the year's benefits
because the Discounted Future Earnings valuation method only considers projected benefits, not historical benefits
that have already been realized.
Since the first projected period is for a partial year, we adjusted the Discount Factor accordingly based on the
partial-year fraction. The partial-year fraction is the number of months contained in the partial-year projection
divided by 12.
So for the first projected period, the Discount Factor equals the partial-year fraction, or if using mid-year
discounting, equals the partial-year fraction times .5. The Discount Factor for the partial year is 0.500000.
In all subsequent years, the Discount Factor for end-of-year discounting equals the partial-year fraction plus (N - 1);
and for mid-year discounting equals the partial-year fraction plus (N - 1.5); where N is the number of the projected
year, 2, 3, 4 etc.
Market Approach
The Market Approach utilizes market prices of comparable companies to approximate the value of the subject
company. Companies that are considered comparable are in the same or similar line of business as the subject
company and are a similar size in terms of profitability and financial position as the subject company. Market price
information can be gathered from the stock trading prices of guideline public companies and/or from the prices paid
in purchase or sale transactions for publicly traded and privately held companies.
Under the Market Approach, the price for a comparable company is expressed as a multiple of various measures of
profitability and financial position. The price multiple from the comparable company is then applied to the
respective measures of profitability and/or financial position of the subject company to determine the value of the
subject company.
Transaction-By-Transaction Method
The Transaction-by-Transaction method is most appropriately utilized when detailed information is available for
each comparable company transaction. Transactions are identified for companies in the same or similar line of
business as the subject company and each transaction is analyzed individually. The transaction price and financial
metrics are adjusted, if necessary, so that the purchase price and the financial metrics are calculated the same way
for each comparable company transaction. Then the price multiples derived from each transaction are analyzed
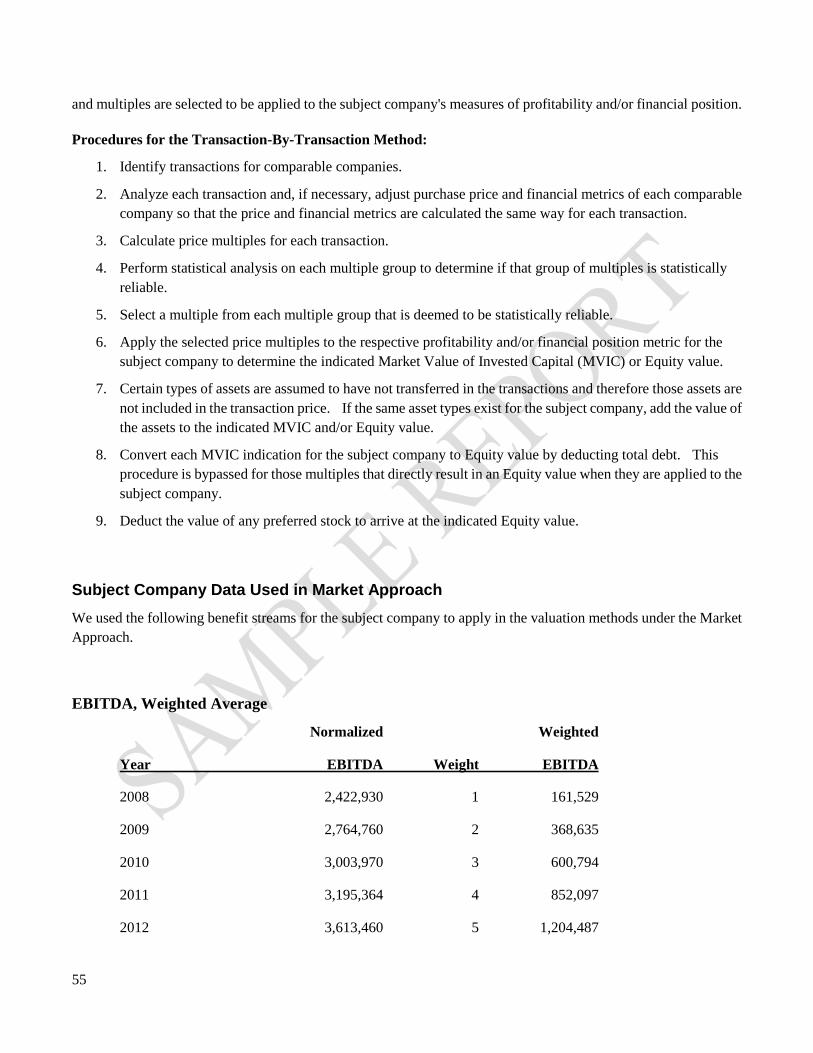
55
and multiples are selected to be applied to the subject company's measures of profitability and/or financial position.
Procedures for the Transaction-By-Transaction Method:
1. Identify transactions for comparable companies.
2. Analyze each transaction and, if necessary, adjust purchase price and financial metrics of each comparable
company so that the price and financial metrics are calculated the same way for each transaction.
3. Calculate price multiples for each transaction.
4. Perform statistical analysis on each multiple group to determine if that group of multiples is statistically
reliable.
5. Select a multiple from each multiple group that is deemed to be statistically reliable.
6. Apply the selected price multiples to the respective profitability and/or financial position metric for the
subject company to determine the indicated Market Value of Invested Capital (MVIC) or Equity value.
7. Certain types of assets are assumed to have not transferred in the transactions and therefore those assets are
not included in the transaction price. If the same asset types exist for the subject company, add the value of
the assets to the indicated MVIC and/or Equity value.
8. Convert each MVIC indication for the subject company to Equity value by deducting total debt. This
procedure is bypassed for those multiples that directly result in an Equity value when they are applied to the
subject company.
9. Deduct the value of any preferred stock to arrive at the indicated Equity value.
Subject Company Data Used in Market Approach
We used the following benefit streams for the subject company to apply in the valuation methods under the Market
Approach.
EBITDA, Weighted Average
Normalized Weighted
Year EBITDA Weight EBITDA
2008 2,422,930 1 161,529
2009 2,764,760 2 368,635
2010 3,003,970 3 600,794
2011 3,195,364 4 852,097
2012 3,613,460 5 1,204,487
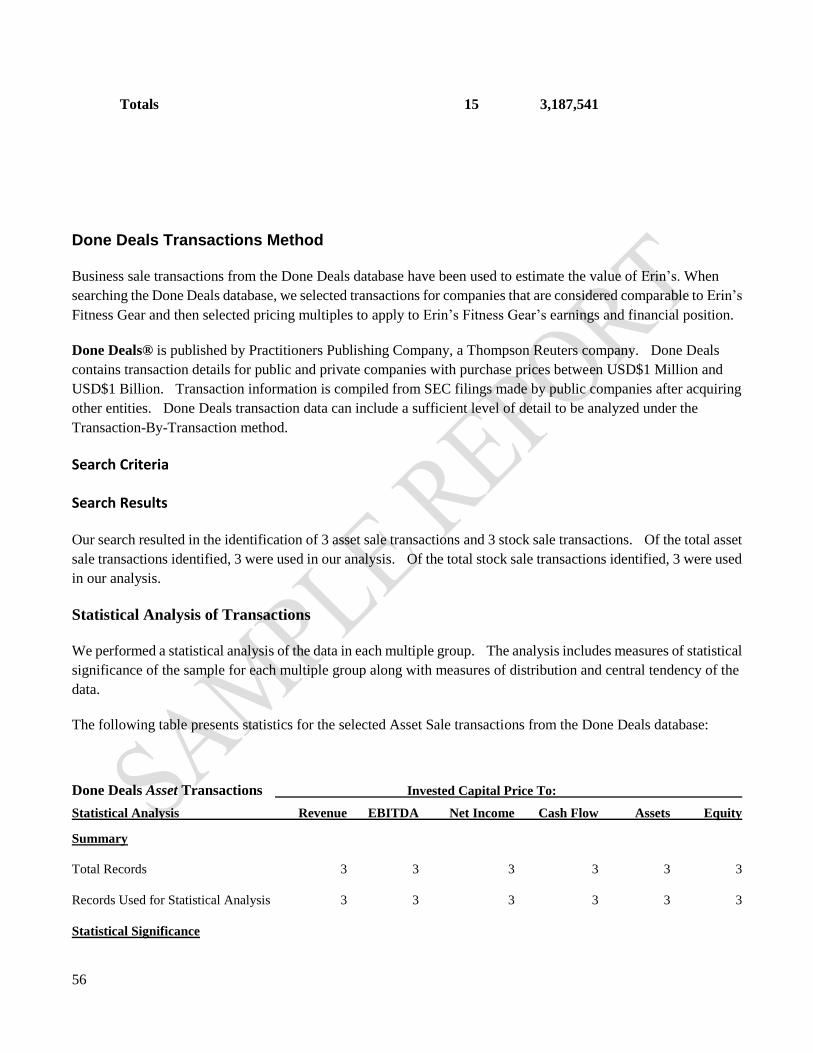
56
Totals 15 3,187,541
Done Deals Transactions Method
Business sale transactions from the Done Deals database have been used to estimate the value of Erin’s. When
searching the Done Deals database, we selected transactions for companies that are considered comparable to Erin’s
Fitness Gear and then selected pricing multiples to apply to Erin’s Fitness Gear’s earnings and financial position.
Done Deals® is published by Practitioners Publishing Company, a Thompson Reuters company. Done Deals
contains transaction details for public and private companies with purchase prices between USD$1 Million and
USD$1 Billion. Transaction information is compiled from SEC filings made by public companies after acquiring
other entities. Done Deals transaction data can include a sufficient level of detail to be analyzed under the
Transaction-By-Transaction method.
Search Criteria
Search Results
Our search resulted in the identification of 3 asset sale transactions and 3 stock sale transactions. Of the total asset
sale transactions identified, 3 were used in our analysis. Of the total stock sale transactions identified, 3 were used
in our analysis.
Statistical Analysis of Transactions
We performed a statistical analysis of the data in each multiple group. The analysis includes measures of statistical
significance of the sample for each multiple group along with measures of distribution and central tendency of the
data.
The following table presents statistics for the selected Asset Sale transactions from the Done Deals database:
Done Deals Asset Transactions Invested Capital Price To:
Statistical Analysis Revenue EBITDA Net Income Cash Flow Assets Equity
Summary
Total Records 3 3 3 3 3 3
Records Used for Statistical Analysis 3 3 3 3 3 3
Statistical Significance
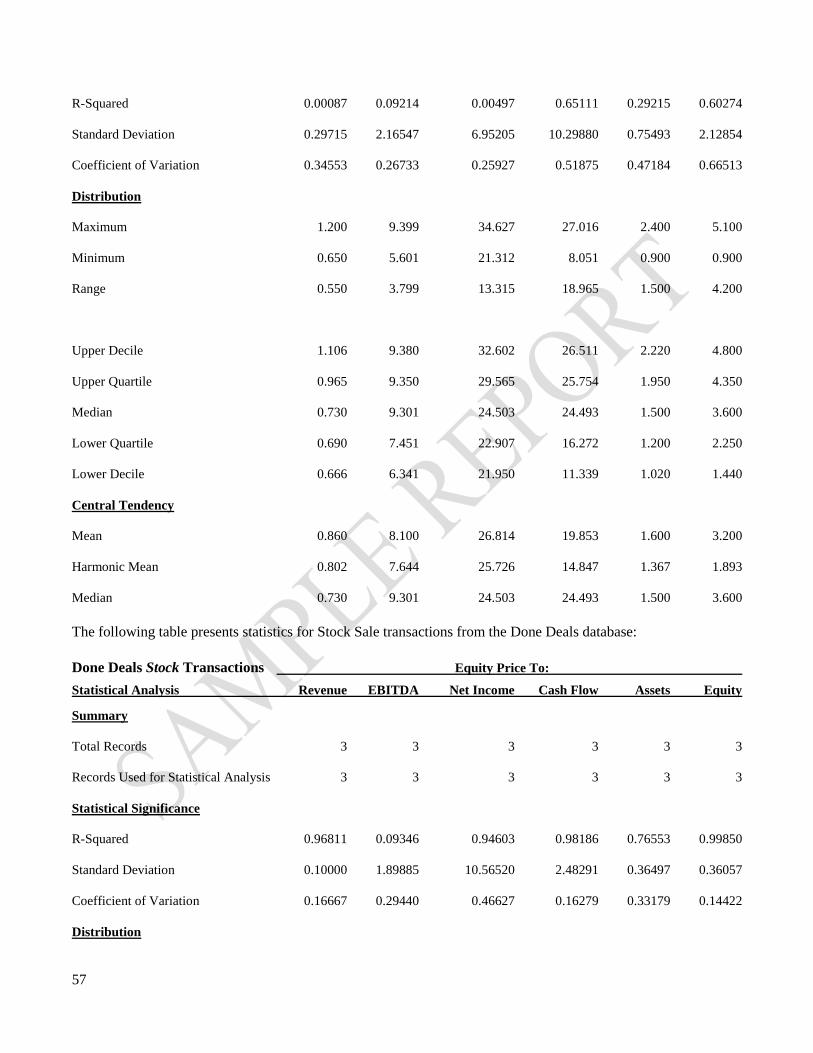
57
R-Squared 0.00087 0.09214 0.00497 0.65111 0.29215 0.60274
Standard Deviation 0.29715 2.16547 6.95205 10.29880 0.75493 2.12854
Coefficient of Variation 0.34553 0.26733 0.25927 0.51875 0.47184 0.66513
Distribution
Maximum 1.200 9.399 34.627 27.016 2.400 5.100
Minimum 0.650 5.601 21.312 8.051 0.900 0.900
Range 0.550 3.799 13.315 18.965 1.500 4.200
Upper Decile 1.106 9.380 32.602 26.511 2.220 4.800
Upper Quartile 0.965 9.350 29.565 25.754 1.950 4.350
Median 0.730 9.301 24.503 24.493 1.500 3.600
Lower Quartile 0.690 7.451 22.907 16.272 1.200 2.250
Lower Decile 0.666 6.341 21.950 11.339 1.020 1.440
Central Tendency
Mean 0.860 8.100 26.814 19.853 1.600 3.200
Harmonic Mean 0.802 7.644 25.726 14.847 1.367 1.893
Median 0.730 9.301 24.503 24.493 1.500 3.600
The following table presents statistics for Stock Sale transactions from the Done Deals database:
Done Deals Stock Transactions Equity Price To:
Statistical Analysis Revenue EBITDA Net Income Cash Flow Assets Equity
Summary
Total Records 3 3 3 3 3 3
Records Used for Statistical Analysis 3 3 3 3 3 3
Statistical Significance
R-Squared 0.96811 0.09346 0.94603 0.98186 0.76553 0.99850
Standard Deviation 0.10000 1.89885 10.56520 2.48291 0.36497 0.36057
Coefficient of Variation 0.16667 0.29440 0.46627 0.16279 0.33179 0.14422
Distribution

58
Maximum 0.700 7.900 34.830 17.806 1.340 2.900
Minimum 0.500 4.300 15.852 12.847 0.680 2.200
Range 0.200 3.599 18.978 4.959 0.660 0.700
Upper Decile 0.680 7.750 31.323 17.265 1.328 2.800
Upper Quartile 0.650 7.525 26.063 16.455 1.310 2.650
Median 0.600 7.150 17.295 15.103 1.280 2.400
Lower Quartile 0.550 5.725 16.574 13.975 0.980 2.300
Lower Decile 0.520 4.870 16.141 13.298 0.800 2.240
Central Tendency
Mean 0.600 6.450 22.659 15.252 1.100 2.500
Harmonic Mean 0.589 6.012 20.052 14.984 1.001 2.467
Median 0.600 7.150 17.295 15.103 1.280 2.400
Multiple Selection
Based on our analysis of the transaction data, we have selected the following multiples to be applied to Erin’s
Fitness Gear’s profitability and financial position metrics.
Asset Transactions / Multiple of Selected
Invested Capital Price to: Mean Median Multiple
Total Revenue 0.860 0.730 0.860
EBITDA 8.100 9.301 8.100
Net Income 26.814 24.503 26.800
Cash Flow from Operations 19.853 24.493 19.850
Total Assets 1.600 1.500 1.600
Total Equity 3.200 3.600 3.200
Stock Transactions / Multiple of Selected
Equity Price to: Mean Median Multiple
Total Revenue 0.600 0.600 0.600
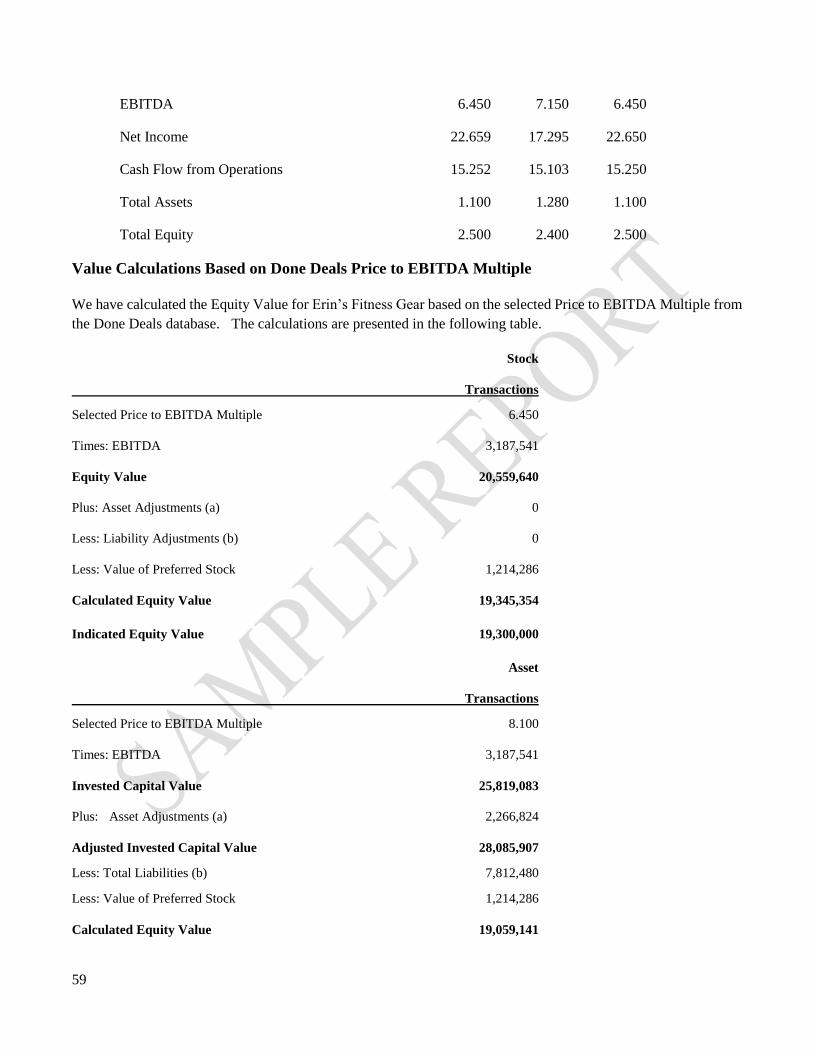
59
EBITDA 6.450 7.150 6.450
Net Income 22.659 17.295 22.650
Cash Flow from Operations 15.252 15.103 15.250
Total Assets 1.100 1.280 1.100
Total Equity 2.500 2.400 2.500
Value Calculations Based on Done Deals Price to EBITDA Multiple
We have calculated the Equity Value for Erin’s Fitness Gear based on the selected Price to EBITDA Multiple from
the Done Deals database. The calculations are presented in the following table.
Stock
Transactions
Selected Price to EBITDA Multiple 6.450
Times: EBITDA 3,187,541
Equity Value 20,559,640
Plus: Asset Adjustments (a) 0
Less: Liability Adjustments (b) 0
Less: Value of Preferred Stock 1,214,286
Calculated Equity Value 19,345,354
Indicated Equity Value 19,300,000
Asset
Transactions
Selected Price to EBITDA Multiple 8.100
Times: EBITDA 3,187,541
Invested Capital Value 25,819,083
Plus: Asset Adjustments (a) 2,266,824
Adjusted Invested Capital Value 28,085,907
Less: Total Liabilities (b) 7,812,480
Less: Value of Preferred Stock 1,214,286
Calculated Equity Value 19,059,141

60
Indicated Equity Value 19,000,000

61
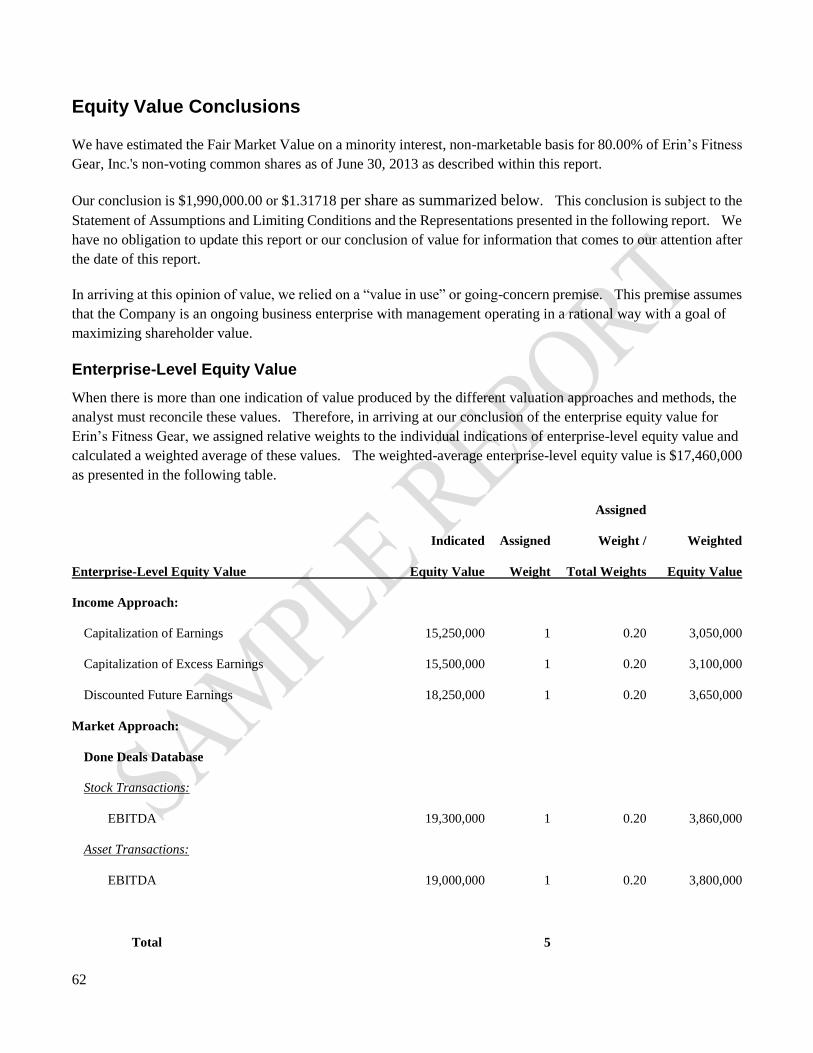
62
Equity Value Conclusions
We have estimated the Fair Market Value on a minority interest, non-marketable basis for 80.00% of Erin’s Fitness
Gear, Inc.'s non-voting common shares as of June 30, 2013 as described within this report.
Our conclusion is $1,990,000.00 or $1.31718 per share as summarized below. This conclusion is subject to the
Statement of Assumptions and Limiting Conditions and the Representations presented in the following report. We
have no obligation to update this report or our conclusion of value for information that comes to our attention after
the date of this report.
In arriving at this opinion of value, we relied on a “value in use” or going-concern premise. This premise assumes
that the Company is an ongoing business enterprise with management operating in a rational way with a goal of
maximizing shareholder value.
Enterprise-Level Equity Value
When there is more than one indication of value produced by the different valuation approaches and methods, the
analyst must reconcile these values. Therefore, in arriving at our conclusion of the enterprise equity value for
Erin’s Fitness Gear, we assigned relative weights to the individual indications of enterprise-level equity value and
calculated a weighted average of these values. The weighted-average enterprise-level equity value is $17,460,000
as presented in the following table.
Assigned
Indicated Assigned Weight / Weighted
Enterprise-Level Equity Value Equity Value Weight Total Weights Equity Value
Income Approach:
Capitalization of Earnings 15,250,000 1 0.20 3,050,000
Capitalization of Excess Earnings 15,500,000 1 0.20 3,100,000
Discounted Future Earnings 18,250,000 1 0.20 3,650,000
Market Approach:
Done Deals Database
Stock Transactions:
EBITDA 19,300,000 1 0.20 3,860,000
Asset Transactions:
EBITDA 19,000,000 1 0.20 3,800,000
Total 5
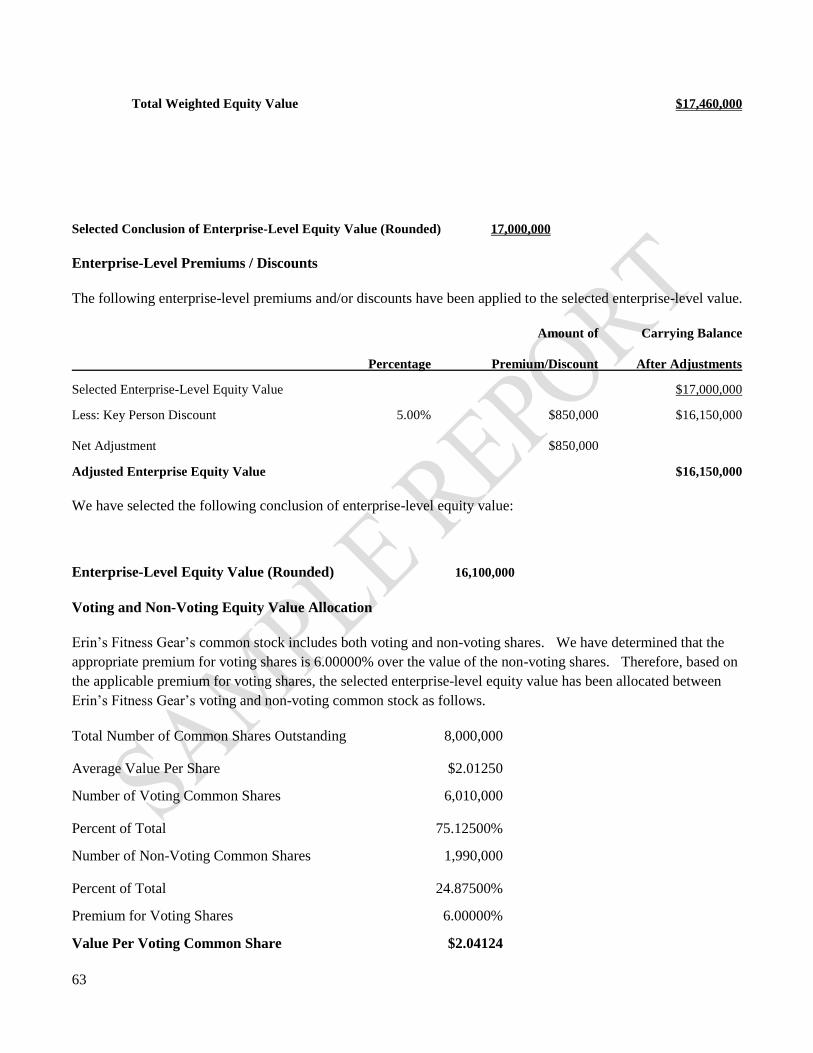
63
Total Weighted Equity Value $17,460,000
Selected Conclusion of Enterprise-Level Equity Value (Rounded) 17,000,000
Enterprise-Level Premiums / Discounts
The following enterprise-level premiums and/or discounts have been applied to the selected enterprise-level value.
Amount of Carrying Balance
Percentage Premium/Discount After Adjustments
Selected Enterprise-Level Equity Value $17,000,000
Less: Key Person Discount 5.00% $850,000 $16,150,000
Net Adjustment $850,000
Adjusted Enterprise Equity Value $16,150,000
We have selected the following conclusion of enterprise-level equity value:
Enterprise-Level Equity Value (Rounded) 16,100,000
Voting and Non-Voting Equity Value Allocation
Erin’s Fitness Gear’s common stock includes both voting and non-voting shares. We have determined that the
appropriate premium for voting shares is 6.00000% over the value of the non-voting shares. Therefore, based on
the applicable premium for voting shares, the selected enterprise-level equity value has been allocated between
Erin’s Fitness Gear’s voting and non-voting common stock as follows.
Total Number of Common Shares Outstanding 8,000,000
Average Value Per Share $2.01250
Number of Voting Common Shares 6,010,000
Percent of Total 75.12500%
Number of Non-Voting Common Shares 1,990,000
Percent of Total 24.87500%
Premium for Voting Shares 6.00000%
Value Per Voting Common Share $2.04124
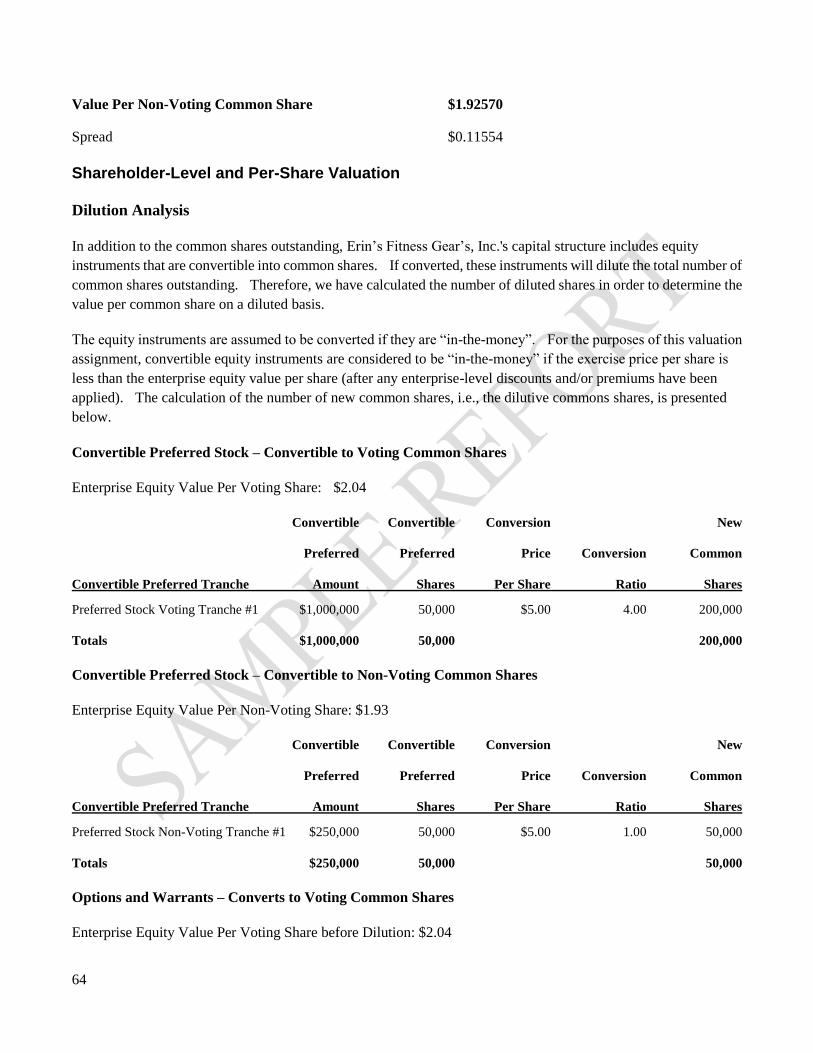
64
Value Per Non-Voting Common Share $1.92570
Spread $0.11554
Shareholder-Level and Per-Share Valuation
Dilution Analysis
In addition to the common shares outstanding, Erin’s Fitness Gear’s, Inc.'s capital structure includes equity
instruments that are convertible into common shares. If converted, these instruments will dilute the total number of
common shares outstanding. Therefore, we have calculated the number of diluted shares in order to determine the
value per common share on a diluted basis.
The equity instruments are assumed to be converted if they are “in-the-money”. For the purposes of this valuation
assignment, convertible equity instruments are considered to be “in-the-money” if the exercise price per share is
less than the enterprise equity value per share (after any enterprise-level discounts and/or premiums have been
applied). The calculation of the number of new common shares, i.e., the dilutive commons shares, is presented
below.
Convertible Preferred Stock – Convertible to Voting Common Shares
Enterprise Equity Value Per Voting Share: $2.04
Convertible Convertible Conversion New
Preferred Preferred Price Conversion Common
Convertible Preferred Tranche Amount Shares Per Share Ratio Shares
Preferred Stock Voting Tranche #1 $1,000,000 50,000 $5.00 4.00 200,000
Totals $1,000,000 50,000 200,000
Convertible Preferred Stock – Convertible to Non-Voting Common Shares
Enterprise Equity Value Per Non-Voting Share: $1.93
Convertible Convertible Conversion New
Preferred Preferred Price Conversion Common
Convertible Preferred Tranche Amount Shares Per Share Ratio Shares
Preferred Stock Non-Voting Tranche #1 $250,000 50,000 $5.00 1.00 50,000
Totals $250,000 50,000 50,000
Options and Warrants – Converts to Voting Common Shares
Enterprise Equity Value Per Voting Share before Dilution: $2.04
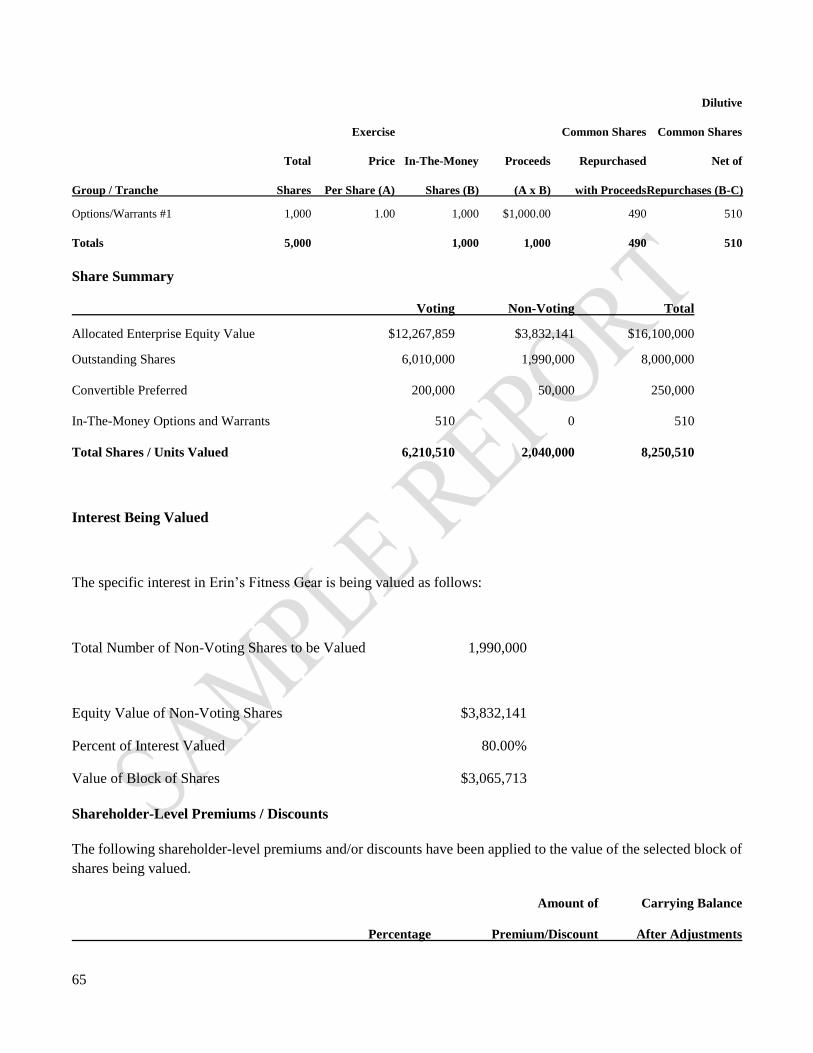
65
Dilutive
Exercise Common Shares Common Shares
Total Price In-The-Money Proceeds Repurchased Net of
Group / Tranche Shares Per Share (A) Shares (B) (A x B) with ProceedsRepurchases (B-C)
Options/Warrants #1 1,000 1.00 1,000 $1,000.00 490 510
Totals 5,000 1,000 1,000 490 510
Share Summary
Voting Non-Voting Total
Allocated Enterprise Equity Value $12,267,859 $3,832,141 $16,100,000
Outstanding Shares 6,010,000 1,990,000 8,000,000
Convertible Preferred 200,000 50,000 250,000
In-The-Money Options and Warrants 510 0 510
Total Shares / Units Valued 6,210,510 2,040,000 8,250,510
Interest Being Valued
The specific interest in Erin’s Fitness Gear is being valued as follows:
Total Number of Non-Voting Shares to be Valued 1,990,000
Equity Value of Non-Voting Shares $3,832,141
Percent of Interest Valued 80.00%
Value of Block of Shares $3,065,713
Shareholder-Level Premiums / Discounts
The following shareholder-level premiums and/or discounts have been applied to the value of the selected block of
shares being valued.
Amount of Carrying Balance
Percentage Premium/Discount After Adjustments
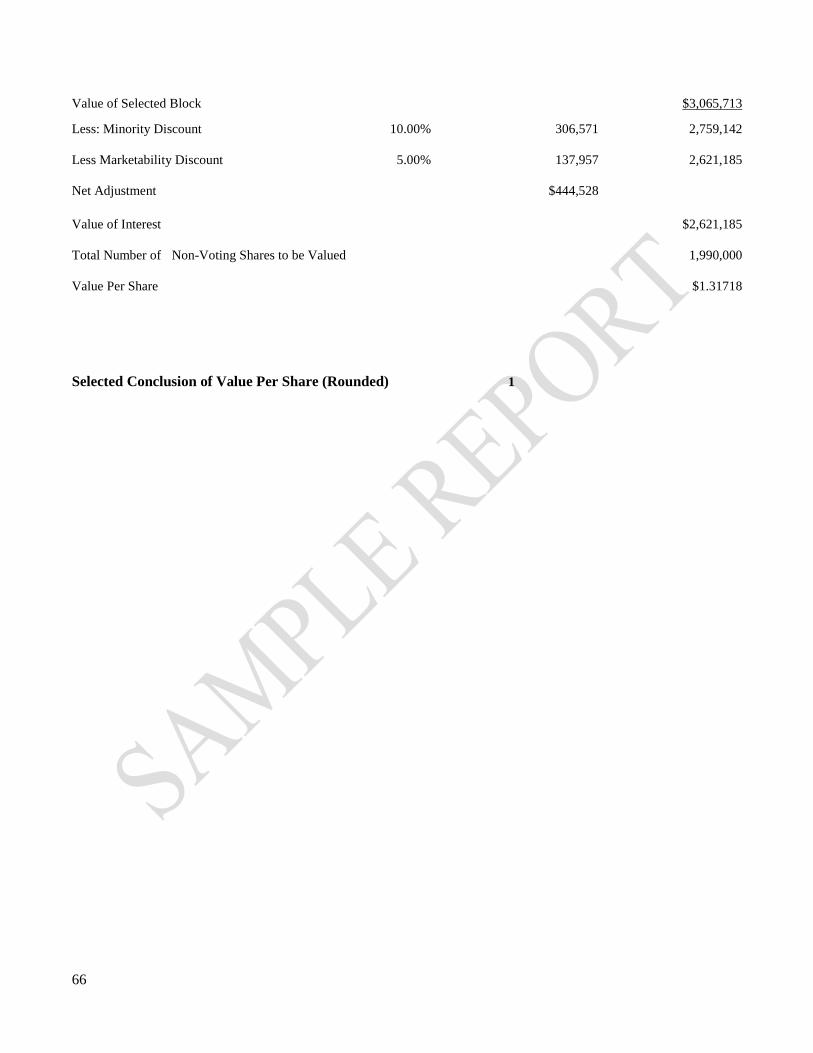
66
Value of Selected Block $3,065,713
Less: Minority Discount 10.00% 306,571 2,759,142
Less Marketability Discount 5.00% 137,957 2,621,185
Net Adjustment $444,528
Value of Interest $2,621,185
Total Number of Non-Voting Shares to be Valued 1,990,000
Value Per Share $1.31718
Selected Conclusion of Value Per Share (Rounded) 1
67
Appendix — Representations
The following factors guided our work during this engagement:
The analyses, opinions, and conclusions of value included in this report are subject to the assumptions and
limiting conditions specified previously in this report, and they are our personal analyses, opinions, and
conclusion of value.
The economic and industry data included in this report were obtained from sources that we believed to be
reliable. We have not performed any corroborating procedures to substantiate that data.
This engagement was performed in accordance with the American Institute of Certified Public Accountants
Statement on Standards for Valuation Services.
We have previously identified the parties for whom this information and report have been prepared. This
valuation report is not intended to be, and should not be, used by anyone other than those parties.
Our compensation for this engagement is not contingent on the outcome of this valuation.
In connection with the excess earnings method, the Equitable Value Real Estate & Equipment Appraisal
Company was used to estimate the fair market value of the Company's real estate and equipment.
Although Equitable Value’s employees are licensed equipment appraisers, we assume no responsibility for
their work.
We have no obligation to update this report or our opinion of value for information that comes to our
attention after the report date.
Patrick Keszei, CPA, CFP, CVA, EA, MBA July 30, 2013
Signature Date

68
Appendix — Qualifications
This report was prepared by Patrick Keszei, Manager of Business Valuation Services of Business ValueCalc.
Patrick Keszei holds the following professional designations and certifications: CPA, CFP, CVA, EA, MBA
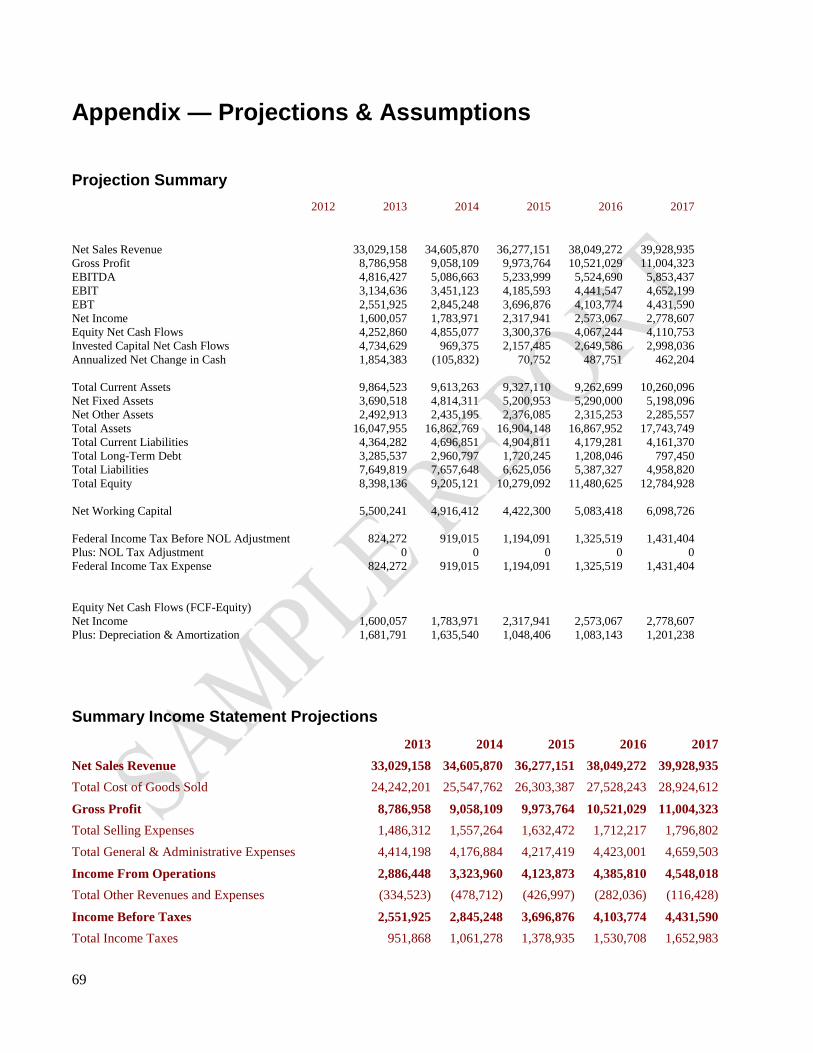
69
Appendix — Projections & Assumptions
Projection Summary
2012 2013 2014 2015 2016 2017
Net Sales Revenue 33,029,158 34,605,870 36,277,151 38,049,272 39,928,935
Gross Profit 8,786,958 9,058,109 9,973,764 10,521,029 11,004,323
EBITDA 4,816,427 5,086,663 5,233,999 5,524,690 5,853,437
EBIT 3,134,636 3,451,123 4,185,593 4,441,547 4,652,199
EBT 2,551,925 2,845,248 3,696,876 4,103,774 4,431,590
Net Income 1,600,057 1,783,971 2,317,941 2,573,067 2,778,607
Equity Net Cash Flows 4,252,860 4,855,077 3,300,376 4,067,244 4,110,753
Invested Capital Net Cash Flows 4,734,629 969,375 2,157,485 2,649,586 2,998,036
Annualized Net Change in Cash 1,854,383 (105,832) 70,752 487,751 462,204
Total Current Assets 9,864,523 9,613,263 9,327,110 9,262,699 10,260,096
Net Fixed Assets 3,690,518 4,814,311 5,200,953 5,290,000 5,198,096
Net Other Assets 2,492,913 2,435,195 2,376,085 2,315,253 2,285,557
Total Assets 16,047,955 16,862,769 16,904,148 16,867,952 17,743,749
Total Current Liabilities 4,364,282 4,696,851 4,904,811 4,179,281 4,161,370
Total Long-Term Debt 3,285,537 2,960,797 1,720,245 1,208,046 797,450
Total Liabilities 7,649,819 7,657,648 6,625,056 5,387,327 4,958,820
Total Equity 8,398,136 9,205,121 10,279,092 11,480,625 12,784,928
Net Working Capital 5,500,241 4,916,412 4,422,300 5,083,418 6,098,726
Federal Income Tax Before NOL Adjustment 824,272 919,015 1,194,091 1,325,519 1,431,404
Plus: NOL Tax Adjustment 0 0 0 0 0
Federal Income Tax Expense 824,272 919,015 1,194,091 1,325,519 1,431,404
Equity Net Cash Flows (FCF-Equity)
Net Income 1,600,057 1,783,971 2,317,941 2,573,067 2,778,607
Plus: Depreciation & Amortization 1,681,791 1,635,540 1,048,406 1,083,143 1,201,238
Summary Income Statement Projections
2013 2014 2015 2016 2017
Net Sales Revenue 33,029,158 34,605,870 36,277,151 38,049,272 39,928,935
Total Cost of Goods Sold 24,242,201 25,547,762 26,303,387 27,528,243 28,924,612
Gross Profit 8,786,958 9,058,109 9,973,764 10,521,029 11,004,323
Total Selling Expenses 1,486,312 1,557,264 1,632,472 1,712,217 1,796,802
Total General & Administrative Expenses 4,414,198 4,176,884 4,217,419 4,423,001 4,659,503
Income From Operations 2,886,448 3,323,960 4,123,873 4,385,810 4,548,018
Total Other Revenues and Expenses (334,523) (478,712) (426,997) (282,036) (116,428)
Income Before Taxes 2,551,925 2,845,248 3,696,876 4,103,774 4,431,590
Total Income Taxes 951,868 1,061,278 1,378,935 1,530,708 1,652,983
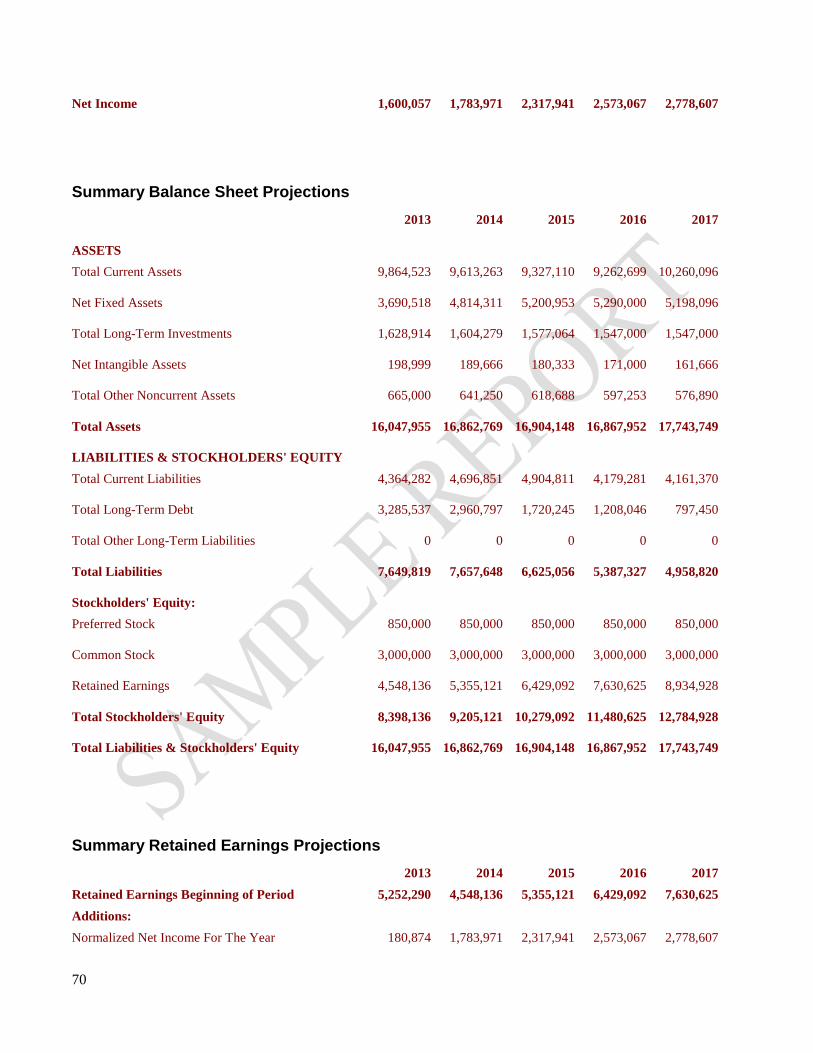
70
Net Income 1,600,057 1,783,971 2,317,941 2,573,067 2,778,607
Summary Balance Sheet Projections
2013 2014 2015 2016 2017
ASSETS
Total Current Assets 9,864,523 9,613,263 9,327,110 9,262,699 10,260,096
Net Fixed Assets 3,690,518 4,814,311 5,200,953 5,290,000 5,198,096
Total Long-Term Investments 1,628,914 1,604,279 1,577,064 1,547,000 1,547,000
Net Intangible Assets 198,999 189,666 180,333 171,000 161,666
Total Other Noncurrent Assets 665,000 641,250 618,688 597,253 576,890
Total Assets 16,047,955 16,862,769 16,904,148 16,867,952 17,743,749
LIABILITIES & STOCKHOLDERS' EQUITY
Total Current Liabilities 4,364,282 4,696,851 4,904,811 4,179,281 4,161,370
Total Long-Term Debt 3,285,537 2,960,797 1,720,245 1,208,046 797,450
Total Other Long-Term Liabilities 0 0 0 0 0
Total Liabilities 7,649,819 7,657,648 6,625,056 5,387,327 4,958,820
Stockholders' Equity:
Preferred Stock 850,000 850,000 850,000 850,000 850,000
Common Stock 3,000,000 3,000,000 3,000,000 3,000,000 3,000,000
Retained Earnings 4,548,136 5,355,121 6,429,092 7,630,625 8,934,928
Total Stockholders' Equity 8,398,136 9,205,121 10,279,092 11,480,625 12,784,928
Total Liabilities & Stockholders' Equity 16,047,955 16,862,769 16,904,148 16,867,952 17,743,749
Summary Retained Earnings Projections
2013 2014 2015 2016 2017
Retained Earnings Beginning of Period 5,252,290 4,548,136 5,355,121 6,429,092 7,630,625
Additions:
Normalized Net Income For The Year 180,874 1,783,971 2,317,941 2,573,067 2,778,607
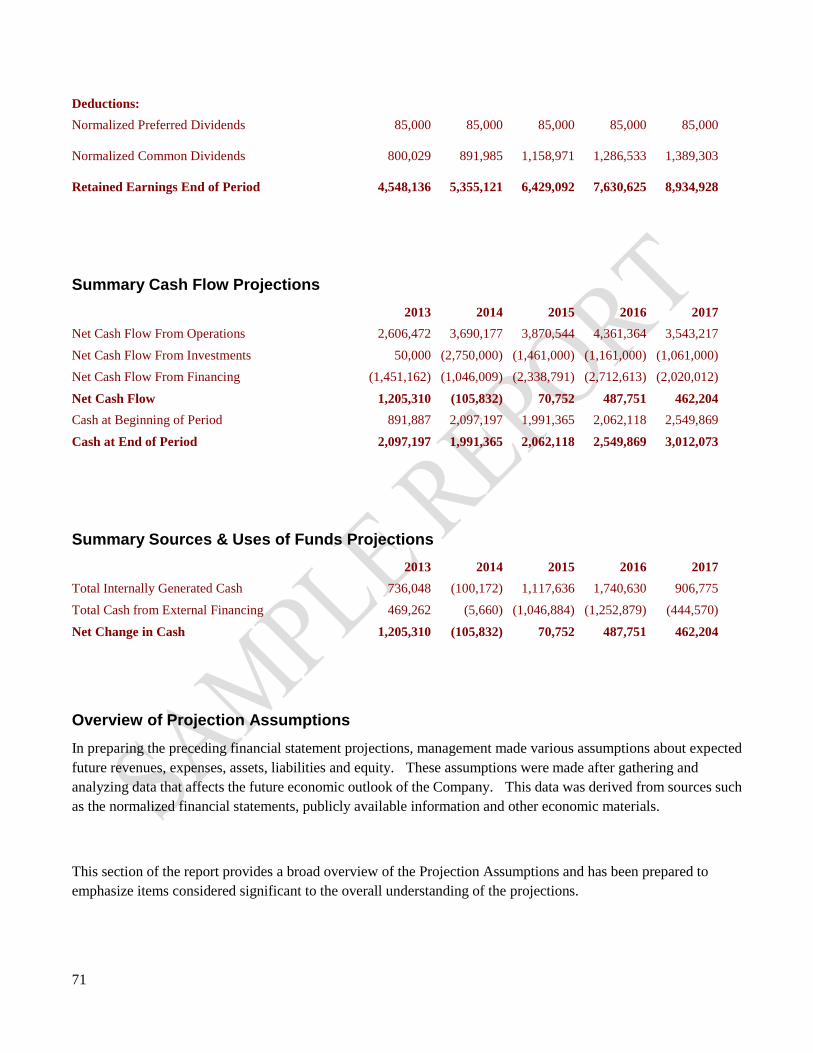
71
Deductions:
Normalized Preferred Dividends 85,000 85,000 85,000 85,000 85,000
Normalized Common Dividends 800,029 891,985 1,158,971 1,286,533 1,389,303
Retained Earnings End of Period 4,548,136 5,355,121 6,429,092 7,630,625 8,934,928
Summary Cash Flow Projections
2013 2014 2015 2016 2017
Net Cash Flow From Operations 2,606,472 3,690,177 3,870,544 4,361,364 3,543,217
Net Cash Flow From Investments 50,000 (2,750,000) (1,461,000) (1,161,000) (1,061,000)
Net Cash Flow From Financing (1,451,162) (1,046,009) (2,338,791) (2,712,613) (2,020,012)
Net Cash Flow 1,205,310 (105,832) 70,752 487,751 462,204
Cash at Beginning of Period 891,887 2,097,197 1,991,365 2,062,118 2,549,869
Cash at End of Period 2,097,197 1,991,365 2,062,118 2,549,869 3,012,073
Summary Sources & Uses of Funds Projections
2013 2014 2015 2016 2017
Total Internally Generated Cash 736,048 (100,172) 1,117,636 1,740,630 906,775
Total Cash from External Financing 469,262 (5,660) (1,046,884) (1,252,879) (444,570)
Net Change in Cash 1,205,310 (105,832) 70,752 487,751 462,204
Overview of Projection Assumptions
In preparing the preceding financial statement projections, management made various assumptions about expected
future revenues, expenses, assets, liabilities and equity. These assumptions were made after gathering and
analyzing data that affects the future economic outlook of the Company. This data was derived from sources such
as the normalized financial statements, publicly available information and other economic materials.
This section of the report provides a broad overview of the Projection Assumptions and has been prepared to
emphasize items considered significant to the overall understanding of the projections.
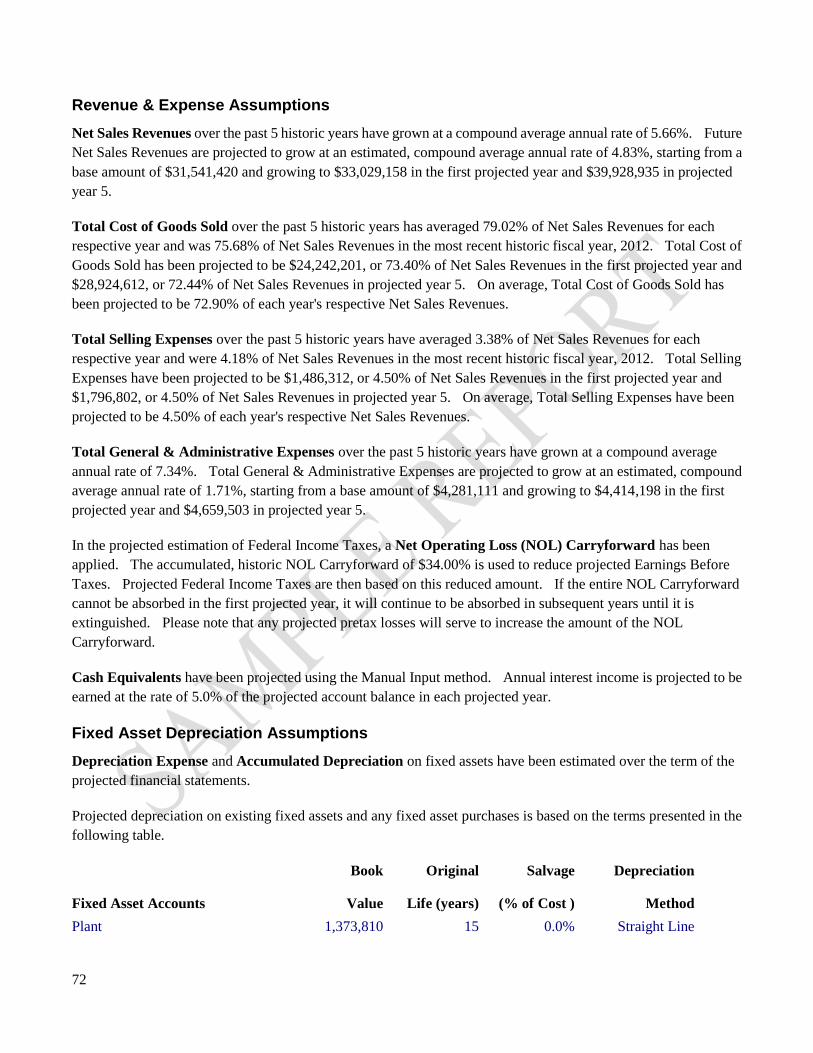
72
Revenue & Expense Assumptions
Net Sales Revenues over the past 5 historic years have grown at a compound average annual rate of 5.66%. Future
Net Sales Revenues are projected to grow at an estimated, compound average annual rate of 4.83%, starting from a
base amount of $31,541,420 and growing to $33,029,158 in the first projected year and $39,928,935 in projected
year 5.
Total Cost of Goods Sold over the past 5 historic years has averaged 79.02% of Net Sales Revenues for each
respective year and was 75.68% of Net Sales Revenues in the most recent historic fiscal year, 2012. Total Cost of
Goods Sold has been projected to be $24,242,201, or 73.40% of Net Sales Revenues in the first projected year and
$28,924,612, or 72.44% of Net Sales Revenues in projected year 5. On average, Total Cost of Goods Sold has
been projected to be 72.90% of each year's respective Net Sales Revenues.
Total Selling Expenses over the past 5 historic years have averaged 3.38% of Net Sales Revenues for each
respective year and were 4.18% of Net Sales Revenues in the most recent historic fiscal year, 2012. Total Selling
Expenses have been projected to be $1,486,312, or 4.50% of Net Sales Revenues in the first projected year and
$1,796,802, or 4.50% of Net Sales Revenues in projected year 5. On average, Total Selling Expenses have been
projected to be 4.50% of each year's respective Net Sales Revenues.
Total General & Administrative Expenses over the past 5 historic years have grown at a compound average
annual rate of 7.34%. Total General & Administrative Expenses are projected to grow at an estimated, compound
average annual rate of 1.71%, starting from a base amount of $4,281,111 and growing to $4,414,198 in the first
projected year and $4,659,503 in projected year 5.
In the projected estimation of Federal Income Taxes, a Net Operating Loss (NOL) Carryforward has been
applied. The accumulated, historic NOL Carryforward of $34.00% is used to reduce projected Earnings Before
Taxes. Projected Federal Income Taxes are then based on this reduced amount. If the entire NOL Carryforward
cannot be absorbed in the first projected year, it will continue to be absorbed in subsequent years until it is
extinguished. Please note that any projected pretax losses will serve to increase the amount of the NOL
Carryforward.
Cash Equivalents have been projected using the Manual Input method. Annual interest income is projected to be
earned at the rate of 5.0% of the projected account balance in each projected year.
Fixed Asset Depreciation Assumptions
Depreciation Expense and Accumulated Depreciation on fixed assets have been estimated over the term of the
projected financial statements.
Projected depreciation on existing fixed assets and any fixed asset purchases is based on the terms presented in the
following table.
Book Original Salvage Depreciation
Fixed Asset Accounts Value Life (years) (% of Cost ) Method
Plant 1,373,810 15 0.0% Straight Line
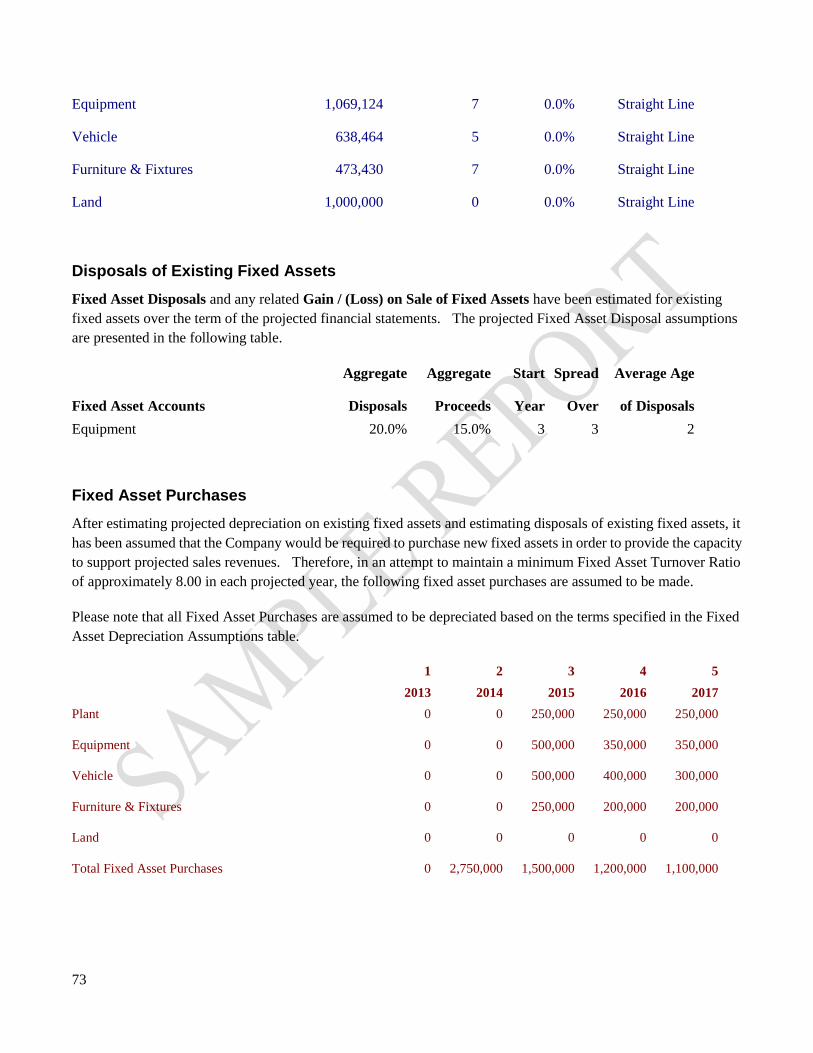
73
Equipment 1,069,124 7 0.0% Straight Line
Vehicle 638,464 5 0.0% Straight Line
Furniture & Fixtures 473,430 7 0.0% Straight Line
Land 1,000,000 0 0.0% Straight Line
Disposals of Existing Fixed Assets
Fixed Asset Disposals and any related Gain / (Loss) on Sale of Fixed Assets have been estimated for existing
fixed assets over the term of the projected financial statements. The projected Fixed Asset Disposal assumptions
are presented in the following table.
Aggregate Aggregate Start Spread Average Age
Fixed Asset Accounts Disposals Proceeds Year Over of Disposals
Equipment 20.0% 15.0% 3 3 2
Fixed Asset Purchases
After estimating projected depreciation on existing fixed assets and estimating disposals of existing fixed assets, it
has been assumed that the Company would be required to purchase new fixed assets in order to provide the capacity
to support projected sales revenues. Therefore, in an attempt to maintain a minimum Fixed Asset Turnover Ratio
of approximately 8.00 in each projected year, the following fixed asset purchases are assumed to be made.
Please note that all Fixed Asset Purchases are assumed to be depreciated based on the terms specified in the Fixed
Asset Depreciation Assumptions table.
1 2 3 4 5
2013 2014 2015 2016 2017
Plant 0 0 250,000 250,000 250,000
Equipment 0 0 500,000 350,000 350,000
Vehicle 0 0 500,000 400,000 300,000
Furniture & Fixtures 0 0 250,000 200,000 200,000
Land 0 0 0 0 0
Total Fixed Asset Purchases 0 2,750,000 1,500,000 1,200,000 1,100,000
74
Existing Notes Receivable Assumptions
Note Receivable in the amount of $114,558 with an interest rate of 10.0% has 54 monthly installment payments
remaining.The installments consist of equal payments where the principal and interest portions of the payment vary
with each installment.
Amortization of Intangible Assets
Goodwill is assumed to be amortized to Amortization Expense over a period of 30 projected years.
Intangibles are assumed to be amortized to Amortization Expense over a period of 15 projected years.
Existing Notes Payable Assumptions
Payable to MoneyBank in the amount of $114,558 with an interest rate of 10.0% has 54 monthly installment
payments remaining. The installments consist of equal payments where the principal and interest portions of the
payment vary with each installment.
Payable to MoneyBank in the amount of $280,964 with an interest rate of 10.0% has 30 monthly installment
payments remaining. The installments consist of equal payments where the principal and interest portions of the
payment vary with each installment.
Payable to MoneyBank in the amount of $2,974,214 with an interest rate of 12.0% has 42 monthly installment
payments remaining. The installments consist of equal payments where the principal and interest portions of the
payment vary with each installment.
Payable to MoneyBank in the amount of $921,087 with an interest rate of 12.0% has 78 monthly installment
payments remaining. The installments consist of equal principal payments with monthly interest charged on the
outstanding balance.
Payable to InsolventBank in the amount of $1,017,149 with an interest rate of 10.0% has 54 monthly installment
payments remaining. The installments consist of equal payments where the principal and interest portions of the
payment vary with each installment.
Fixed Asset Purchase Financing Assumptions
In projected year 3, 40.0% of total fixed asset purchases ($1,500,000) would be financed. A new loan in the
amount of $600,000 would be added in that year. This loan would have an interest rate of 10.0% and would be
repaid in 60 monthly installments. The installments consist of equal payments where the principal and interest
portions of the payment vary with each installment.
In projected year 4, 40.0% of total fixed asset purchases ($1,200,000) would be financed. A new loan in the
amount of $480,000 would be added in that year. This loan would have an interest rate of 10.0% and would be
75
repaid in 60 monthly installments. The installments consist of equal payments where the principal and interest
portions of the payment vary with each installment.
In projected year 5, 40.0% of total fixed asset purchases ($1,100,000) would be financed. A new loan in the
amount of $440,000 would be added in that year. This loan would have an interest rate of 10.0% and would be
repaid in 60 monthly installments.The installments consist of equal payments where the principal and interest
portions of the payment vary with each installment.
Dividends Assumptions
Preferred Stock Dividends are assumed to be paid at the rate of 10.0% of the preferred stock balance in each
projected year.
Common Stock Dividends are assumed to be paid at the rate of 50.0% of net income in each projected year.

76