Embed Size (px)
Citation preview
Business transformation at TNTHenk van Dalen, CFO12 December 2007

2
Business transformation at TNT
TNT today & history ‘’Focus on Networks’’ strategy TNT 2005 - 2007 What is a network Towards a differentiating strategy
o Phase 1o Phase 2
Finance function Return to stakeholders

3
express74,590 Employees (69,482 FTE)
200 Countries of operation
2,431 Depots/hubs
217 million consignments*3
4,7 million tonnes carried*3
44 Aircraft
84,739 Employees (41,496 FTE)
8 Countries of operation
476 Mail depots (inc 11 sorting centres)*3
Mail NL Addressed Volume 4,918 million*3
Addressed items delivered outside NL (EMN) 894 million*3
TNT today
*1. Including intercompany of € 16 million*2. Including non-allocated costs of € 65 million and €7 million other depreciation*3. As per 31 December 2006
Revenue 2006: € 10,060 million*1
EBITDA 2006: € 1,594 million*2
EBIT 2006: € 1,276 million*2
-- Mail: € 4,065 million
-- Express: € 6,011 million
-- Mail: € 896 million
-- Express: € 756 million
-- Mail: € 761 million
-- Express: € 580 million
post

4
TNT, a history of transformation
Risk Management & Internal controlDisposal Logistics & Freight ManagementPortfolio growth Express and MailCapital structure / Share Buy BackDutch State sells final stake
2006/2007
1998-2005
KPN listing on Amsterdam Stock ExchangeKPN acquires TNTTPG separate listing AEX
199419961998
Dutch State PostThomas Nationwide Transport (TNT) in Australia
17521946
Build Contract LogisticsGrow and Build ExpressOptimise Mail NLBuild Mail in Europe
Public Company
TNT Brand
2008-2012 • Grow and Build Value
Focuson Networks
5
‘’Focus on Networks’’
Slides as announced on 6 December 2005

6
TNT has conducted a thorough strategic review of its business and performance
Best Postal operator; fast growing
European Mail Networks (EMN)
Express leader in Europe, on track
for 10% operating margin
Excellent growth opportunities
in Asia/China
Good track record of acquisitions
in Mail and Express
Logistics non-network based
Consolidation in industry continues
Evaluation of TNT
Slide of6 Dec. 2005

7
Network-based business is intrinsically attractive0 EBIT margin trend
Median for sector, 4 years average
Logistics
Express
Same trendfor ROIC
10%
8%
9%
7%
6%
5%
4%
3%
2%
1%
0%
Same trendFor ROIC
Slide of6 Dec. 2005

8
Today’s announcement is aimed at driving shareholder value at TNT
Exit Logistics
Optimise capital structure
Focus on Networks
Slide of6 Dec. 2005

9
What is a Network? Dataflow management is
essential – people and IT systems & processes
Infrastructure for collection, transport, sortation and handling, warehousing and delivery
Ability to process large numbers of transactions to achieve operational leverage
Express Road Network
Mail collection and delivery network
SC
SC
SC
SCSC
SC
SC
DepotDepotDepotDepotDepotDepot
DepotDepotDepotDepotDepotDepot
DepotDepotDepotDepotDepotDepot
Collection
Delivery= sorting
centre
LTLT
FIFISESE RURUNONO
EEEELVLV
DKDK
ICIC
TRTR
ATAT
PLPL
CHCH
BGBG
ROROHUHU
SISI
CZCZSKSK
HRHR
ALALMKMKGRGR
YUYU
UAUA
BYBY
BABA
MDMD
ITITESESPTPT
FRFR
GBGBIEIE
MARMAR
DEDENLNL
LULUBEBE
MADMAD
NXHNXH
GNQGNQ DNGDNGDFTDFT
MILMIL
VIEVIE
BZQBZQ HNJHNJ
HLBHLB
TKUTKU
QARQAR
LGGLGG
CASCAS

10
Quality, predictable volume growth
Increased drop density andmore itemsper drop
Improved transit
times and lower costs
Higheroverall margin
by improving mix
Networks intrinsic economics
Volume / Drop density
More volume leads to lower costs per unit
Combination of networks leads to further cost reduction per unit
More items
per drop
International network
Domestic network
Pick-up anddelivery costs/shipment

11
Different types of products have different operators
Documents Parcels Full Loads
1 kg 30 kg 1,000 kg
Same day
Time certain
Day certain (1-3 days)
Day certain (3-5 days)
Day uncertain
250 kg
Bulk
20,000 kg
Pallets
IntegratorsMail1st class
Standardparcel operators
Market size ~€ 1,100 billion
Couriers
Mailother
Freightforwarders
Seacarriers
Trucking companies
Def
err
ed
Adjacent service and infrastructure operators
Freight

12
Complementary Mail and Express networks
Network• Depots• Linehaul
• IT
• Back-
office
• F&A
• HRM
Marketing & Sales
Last mile delivery
Shared support
functions
Express offers Mail platform for
international growth
Mail offers Express B2C delivery capabilities
EMN shares infrastructure with domestic
express
European express
road network
European airnetwork
B2C/C2C B2B
Mail customers Express customers

13
Focus on Networks – two phases
6 December 2005-
6 December 20076 December 2007
Focus on Networks
Phase 2Phase 1
Transforming the Foundations
Grow and Build Value

14
Focus 2005 /2007; ‘’transforming the foundations’’ Businesso Carve outo Clean up and complyo Grow the coreo Develop new growth platforms
Financialo Risk management, internal control, Integrity and
complianceo Carve out & Deal makingo Value processeso Sustainably optimise FLAT structure

15
Exit Logistics & FM
Optimisecapital structure
Focus on Networks
• Significant Cash returned to shareholders via buybacks and dividends
• Successful sale of non-core businesses
TNT’s strategy has delivered!
Target 6 Dec 2005
CAGR*
Express growth
10-15% 13%
Mail growth ~3% 3%EMN growth
18% 30%
* Period defined as Q4 2006-Q3 2007 compared with Full Year 2005

16
Delivered against strategic priorities
Int’lExpressEurope
AsiaPacific
Strategic Focus
GrowInvest
BuildFast
Explore& Build
ActivelyMaintain
Dom. ExpressEurope
SpecialServices
EMN Parcels
ExpressEurope
White spots
Rest ofWorld
FinancialFocus
CashGeneratio
n
Growth & Cash
ValueCreation
Value Creation Growing to WACC
VSP next week
delivery
Hoau (Chin
a)
747s
Asia Road
Network
Various expansio
ns
Strong growth EMNTG+
(Spain)
Expansion
European
network
Speedage (India)
Mail NL & other
New Master plan
initiatives
2011 EU liberalisati
on
Sale Logistics and FM
Mercúrio
Middle East Road
Network

17
• Drive business performance
• Maintain financial flexibility• Support growth;
Capex and M&A
• Keep balance sheet efficient• Target credit
rating around BBB+
• Effective Risk Management, Internal Control and Compliance
• Aligned legal, funding and tax structure
• Shareholder returns
SOx compliant over 2006
EBITDA up 13% EBIT up 13% Revenue up 14% Effective tax rate
down 17% EPS from
continuing operations up 34%
> € 3 billion of dividends and SBB from 6 December 2005
Financial strategy Key components Results Q4-05 – Q3-07*
*Period defined as Q4 2006-Q3 2007 compared with Q4 2004-Q3 2005, from continuing
operations
Performance “Transforming the Foundations”

18
Phase 2 Focus on Networks “Grow and Build Value”
2008 – 2012
Grow and Build Value
• Strengthen the core
• Grow profitable emerging platforms
• Maintain focus on shareholder value

19
TNT has a differentiating strategy…
Focus on Networks Focus on European Mail Networks
Focus on Domestic and Intra-regional
Rather than Inter-continentalNo LogisticsNo Freight Forwarding
An opportunitynot a threat
20
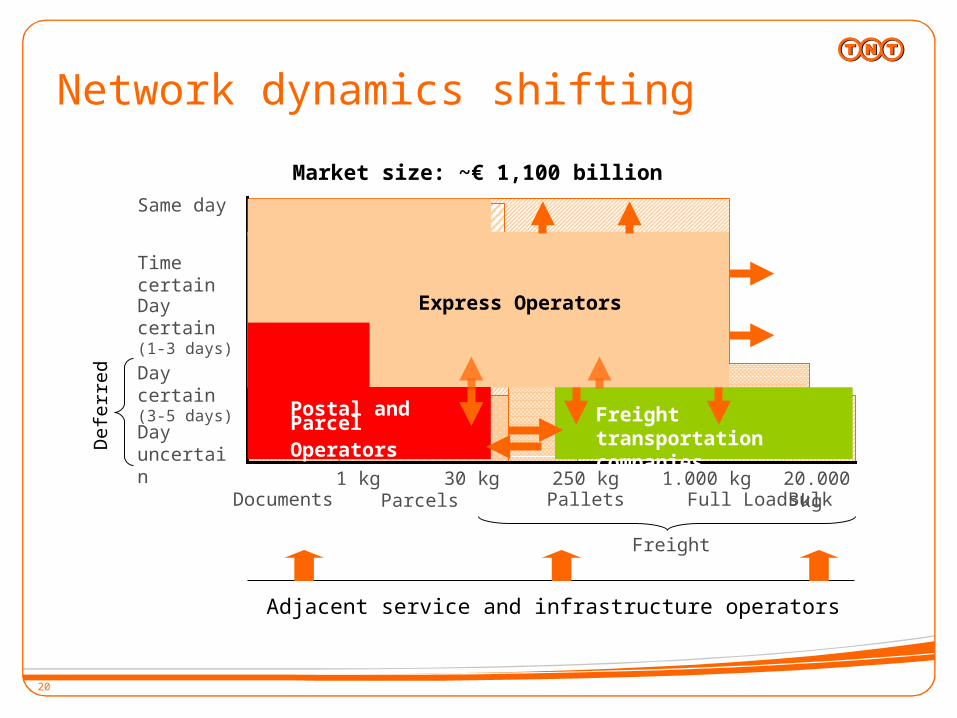
Market size: ~€ 1,100 billion
1 kg 30 kg 1.000 kg250 kg 20.000 kg
Network dynamics shifting
Same day
Time certain
Day certain (1-3 days)
Day certain (3-5 days)
Day uncertain
Def
err
ed
Documents Parcels Full Loads BulkPallets
Freight
Adjacent service and infrastructure operators
Express Operators
Postal and ParcelOperators
Freight transportation companies

21
Focus on creating value through running
delivery networks responsibly
Express MailGroup
• Expand lead in established business
• Optimise Network
• Strong below the line financial management
• Remain fittest domestic Mail carrier
Strengthen the core
• Aspire to lead in largest economies, China, India, Brazil and other emerging markets
• Explore new network growth opportunities
• Successfully benefit from liberalisation in Europe [where allowed]
Grow profitable emerging platforms
• Revenue and EBIT growth• Strong cash flow development• DELIVER SHAREHOLDER VALUE
• Maintain leading position in CSR [Quality, Planet Me, WFP]Strong focus on Value Based performance
22
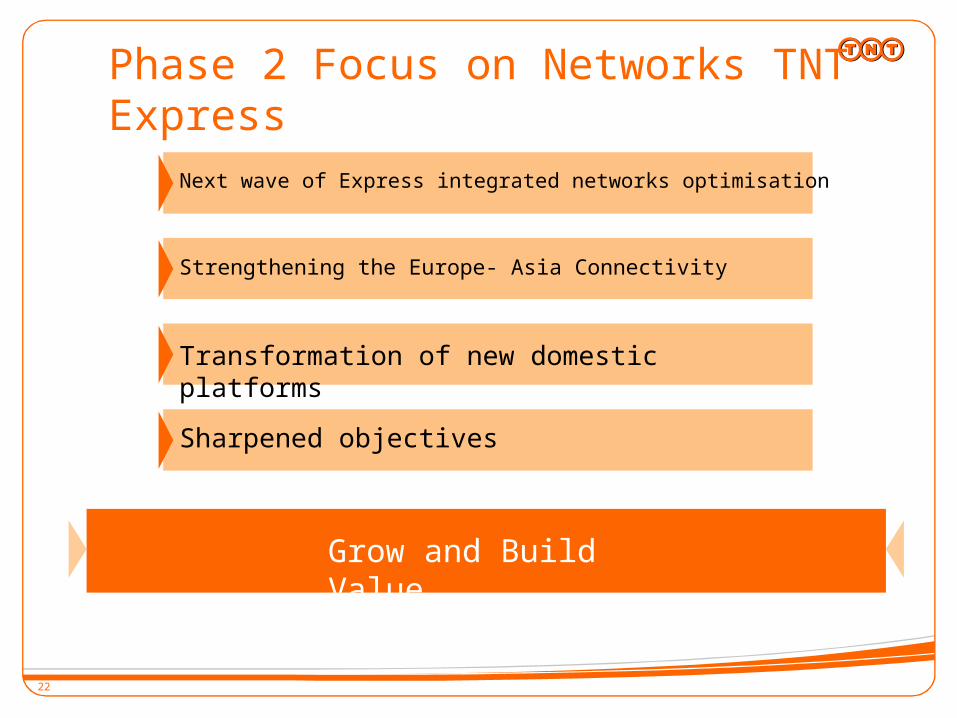
Phase 2 Focus on Networks TNT Express
Next wave of Express integrated networks optimisation
Strengthening the Europe- Asia Connectivity
Sharpened objectives
Grow and Build Value
Transformation of new domestic platforms

23
Domestic
Intra-regionalIntercontinen
tal
Customers
Emerging platforms
• In Europe, our platforms are fully integrated• Outside of Europe, we have built seamless connectivity
to our European distribution networks • In key emerging markets, we are building new domestic
platforms
…using a differentiating growth model for TNT Express

24
Pick-Up DeliveryAir or Road Linehaul
30,000 vehicles 836 depots
30,000 vehicles 836 depots
45 aircraft connect 25 countries3,900 trucks / week connect 34
countriesLatest collection Earliest deliveryFastest Transit
Most Reliable Service
Facilities& fleet
Objective
Technology
State of art information technology
Global track & trace systems
Cost Effective Service
Afternoon Overnight Morning
… Facilities, road and air linehaul connections, PUD …
The Next Wave of Express Networks Optimisation targets…

25
NetworksHub
infrastructureCountry / Depotinfrastructure
Integrated Network & Infrastructure Approach
PUD
Operations Infrastructure Planning & Optimisation
TNT - Global Optimisation (GO) ProgrammeDesign, Development and Implementation
2007 2017
Our new wave network optimisation is based on TNT Express strategy and continuity planning

26
Project Planning
1. Closure IMC
2. Rationalisation education
3. Rationalisation ICT
4. Repositioning SU Transport
5. Remodeling Delivery
6. Remodeling Collection
7. Remodeling of security mail
8. Optimalisation network structure
9. Marketing & Sales rationalisation
10. Retail rationalisation
Mail NL new Master plan overview cost measures of € 300 million
OperationsCompensation
& Benefits
Optimise sorting, transport, delivery and overheads
Steps towards market conformity of labour conditions
Marketing & Sales Overhead
Marketing & Sales rationalisation
Business Service change
Retail rationalisation
HR, F&A and ICT chain optimisation
Examples of projects of total of 60

27
Frequency/Speed
Daily 24h and 48hTwice a weekOnce a week
next week
Strategic proposition in addressed Dutch mail market
Other providers
Budget
Economy
‘A’-brand
The same week
Priceper piece
Mail NL: Introduction of economy product and budget mail

28
Build profitable emerging platforms !
~ € 2.5 billion
~ € 5.2 billion2012
Revenue growth ~100% *
Uncertainty EMN Germany
Low single digit
Mid single digit2012 ROS increase
~ € 60 million
~ € 600 millionUp to 2012
Including start-up losses 2008 / 2009 per year
Capex requirement
M&A smaller bolt-on acquisitions
“Investments”
Emerging platforms include EMN, Parcels and Express emerging businesses*Period defined as 2012 compared with 2007 excluding acquisitions

29
Integration overriding issues: Networks linking Systems interfacing Product offering restructuring
Estimated main sources of synergies: Revenues enhancement Sub-contracting efficiency and cost savings
Growing via transforming these companies into schedulednetworks
AcquiredTNT
All TNT Express acquisitions so far are providing a complementary network to the international set-up

30
Total revenues€ 1.7 – 2.0
billion
Addressed revenues
€ 1.3 – 1.5 billion
Operating margin 10% - 8%
0
500
1,000
1,500
2,000
2004 2005 2006 2007 2008 2009 2010 2011 2012
Revenues€ million
Unaddressed
Addressed mail +related services
Target 2012
Excluding parcels UK, Italy & Belgium
EMN ambition adjusted: on track for 2012
CAGR 16%-22%

31
Present Position and Expansion Routes in Parcels
B2C parcels
GreenfieldDominant postal operators
Large Mail Order Deliverer
ExpressLeverage infrastructure
B2B Parcels
Small local B2B players
Large European B2B players
Autonomous
Country by country
European Entry
Easy European entry not available
A focused country by country approach is required
€ 400 million
Focused growth
per country
Broker model forinternational flows
ItUKBNL
Domestic
Cross Border
Opportunistic growth strategy in two
dimensions
European positionfor
B2B/B2C parcels

32
Stand alone niche markets, with a network feeder component
32
Total pharmacy market in The Netherlands is € 4.5 billion and grows 6% annually
The submarket of repeat prescriptions has a value of € 3.5 billion
Dutch internet pharmacy market (for repeat prescriptions) is expected to grow substantially*
Initiative TNT Post : Nationale-Apotheek.nl focuses on repeat prescriptions via internet
TNT Post leverages its brand and excellent operational skills
- TNT Post is trusted
- Delivery with Track & Trace
2008 20102015*
*
Dutch internet pharmacy market
€10m€100
m€750
m
Market share TNT Post initiative
60% 50% 40%* Germany: Internet pharmacy Doc Morris has built up €100m revenue in three years; USA: Mail order pharmacy has already a 19% share of total pharmacy market** The Netherlands: Internet pharmacy is expected to have an 11% share in 2015
Market

33
Growth e-billing
Direct marketing services
Transaction mail
services
Market size (€ million) 759 162
Market share (%) 14% 19%
3,000
4,000
5,000
2006 2007 2008 2009 2010 2011 2012
Off line
On lineEmergence of on line direct marketing
0%
50%
100%
2005 2006 2007
TNT has a 14% market share in the off line marketing services market (printing, database management, call centres)
TNT also has a 19% market share in the transaction mail services market
TNT Post traditional portfolio can be leveraged to capture e-opportunities
Growth on line media spendTraditional portfolio
Post
Post + on line
On line
Emergence of e-billing
Stand alone niche markets, based on customer demand and channel optimisation

34
Finance function Tap the underpinnings that ultimately determine business performance
Business model-based financial management
“The Soul”
• Focus on numbers• Creation of transparency, reporting approach to performance management• Budget control key instrument
• Focus on value drivers• Performance management based on Shareholder value metrics• Focus on business controls / risks
• Focus on strategic assumptions• Deep understanding of business• Developing performance concepts
Value-oriented financial management
“The Brain”
Reporting focused financial management
“The Heart”

35
Incidental returns
General
Medium term view on excess cash operations
“Investment-grade rating” of around BBB+
Balance short, medium and
long term stakeholder
returns
Maintaining financial flexibility
Grow and Build Value; Financial Balance
Dividend
Growth potential on
basis of financial results
Dividend guideline on normalised net income
Growth
Primarily organic growth
SelectiveM&A
Proceeds from
divestments
Incidental shareholder
returns
Investment capacity from
cash flow financial status

36
Finance agenda 2008-2012
1. Strategy, budgeting, profit and growth drivers and
performance killers
2. Optimize sustainable ‘’FLAT’’ structure
3. Enhanced focus on Cash
4. Quality and standardization of processes
5. Alignment in control, integrity and risk management
6. HR in Finance

37
Structure Risk management, internal control, integrity, compliance Optimise financial standing around BBB+ investment grade Further ETR decrease to a level of around 25-26% by 2010 Dividend (per share) up, barring unforeseen circumstances Further external business transparency
Operational Capex as % of revenues 4-6%, including smaller acquisitions Specific business objectives on Revenue and ROS Restructuring charge in Mail € 125-175 million in phases up
to 2009 Grow Free Cash Flow of the Group
Medium term view on Free Cash Flow allocation
1. Strategic profitable growth steps and dividends2. Incidental return to shareholders
Focused Financial Strategy 2008 – 2012

38
M&A appraisal
s
Explicit and detailed evaluation of stand alone and synergy value
Post merger “100 day” and “1 year” reviews
Pay for performan
ce
Management incentive system explicitly linked to EP
Investment /
appraisals
Separate review of growth and replacement investments
Focus on capacity utilisation, asset light alternatives, fast cash payback
Post investment reviews
Budgetingand
Performance
Business unit budgets assessed based on year-on-year EP growth
Value drivers Focus on cash optimisation
Strategy Strategic options reviewed on the basis of EP, next to top and bottom line growth
Economic Profit (EP)
Economic Profit to measure and drive performance
EBIT
+ Add back interest operating leases
Adjusted pre-tax EBIT
- Tax charge- Capital charge for net
working capital- Capital charge for
fixed assets- Capital charge
operating leases
Economic Profit
EP definition at TNT Application of EP at BU level

39
SUN project: “driving value below the line”Significant unrecognised tax losses High effective tax rate
Loans in tax loss countries
Emerging markets balancesCash balancesInternal chargesGroup legal structure
Cash flow focus / Trade working capital
Legal
Accounting
Fiscal
Treasury
BusinessValue

4040
Regionalteams
Corporate legal structure
SUN key initiatives
Continuous country scan
Financingcompany
Emerging countries

41
Key performance indicators 2007 – 2012Outlook 2007 regrouped
RevenuesOrganic revenue
growthReturn on Sales
2007E 2007ECAGR ’08-’12
2007E2012
Target
Express segment
International & Domestic ~5,450 ~7% 8-10% ~11% 12-13%
Emerging platforms(Apac, India, China, LAM, MEA, Russia, Turkey)
~1,100 ~12% 15-20%Around break-even
Mid single digit
Mail segment
Mail total ~4,200 3-4% 4-6% ~17.5%Mid
teens
Emerging Mail + Parcels ~1,350 ~25% 12-15%Mid
single digit
High single digit
Emerging Mail + Parcels (excluding EMN Germany)
~1,100 ~23% 9-11%Mid
single digit
High single digit
Other Networks
Non allocated
Group total~11,00
0~6% ~10% ~12% ~12%
All figures 2007 are rounded and regrouped for indication purposes only based on the outlook as confirmed excluding the effect of any provisions related to the new Master plan initiatives
€ million

42
Stakeholder returns since 2005

43
We focus on delivering the best Customer Experience in creating a customer focused organisation
43
• Customer Experience is a newly created role focusing on making all customer touch points outstanding

44
Which resulted in our Clients rating our customerservice above our competitors´…Theme Attribute
TNT Expres
sDHL FedEx UPS
Customer Service
Ease of contacting required person (02) 3.48 3.33 3.28 3.24Ability of CS staff to answer all questions (27) 3.53 3.43 3.36 3.35Level of personalised service offered (26) 3.52 3.35 3.35 3.36Ability of sales rep to understand your business (31)
3.54 3.38 3.33 3.40
Adequacy of information provided (phone, e-mail etc) (36)
3.57 3.41 3.40 3.49
Problem handling
Timely notification of delivery problems (18) 3.36 3.15 3.28 3.29Availability of suitable solutions to problems (21) 3.33 3.26 3.31 3.22Speed of complaint resolution (38) 3.24 3.19 3.20 3.15
Driver Assistance
Ability of drivers to offer assistance (33) 3.71 3.56 3.62 3.68
Ease of use of Internet services
Ease of use of Internet services (12) 3.51 3.49 3.52 3.61
Operations
On time delivery of shipments sent (16) 3.62 3.57 3.61 3.66Ability to fulfill its commitments (37) 3.60 3.53 3.50 3.57Suitability of transportation services (4/5/6) 3.60 3.48 3.46 3.60Capability to handle all your shipments (07) 3.68 3.51 3.51 3.55Suitability of shipment collection times (10) 3.67 3.65 3.58 3.68
Source: RI customer research 2007 and CMI analysisCountries participated: Germany, UK, Italy, France, Netherlands, Belgium, Australia, Switzerland, Romania, Brazil

45
Since Dec 2005, TNT has outperformedmost of its competitors…
Share price development since December 2005
192123252729313335
1-Dec 1-Feb 1-Apr 1-Jun 1-Aug 1-Oct 1-Dec 1-Feb 1-Apr 1-Jun 1-Aug 1-Oct 1-Dec
TNT AEX DPWN FDX UPS OP
192123252729313335
1-Dec 1-Feb 1-Apr 1-Jun 1-Aug 1-Oct 1-Dec 1-Feb 1-Apr 1-Jun 1-Aug 1-Oct 1-Dec
TNT AEX DPWN FDX UPS OP
192123252729313335
1-Dec 1-Feb 1-Apr 1-Jun 1-Aug 1-Oct 1-Dec 1-Feb 1-Apr 1-Jun 1-Aug 1-Oct 1-Dec
TNT AEX DPWN FDX UPS OP
192123252729313335
1-Dec 1-Feb 1-Apr 1-Jun 1-Aug 1-Oct 1-Dec 1-Feb 1-Apr 1-Jun 1-Aug 1-Oct 1-Dec
TNT AEX DPWN FDX UPS OP
TNT AEX DPWN FDX UPS OP

46
Significant cash shareholder returns
> € 3 billion of Dividends and SBB from 6 December 2005 to 6 December 2007
Dividend in cash Cash Returns to Shareholders
237268
282298
5763
73
20 2226
30 30
0
50
100
150
200
250
300
350
2004 2005 2006 2007 YTD
0
10
20
30
40
50
60
70
80
Dividend paid in the year (€ million)
Dividend per share over the year (€ cent)
Interim dividend per share in the year (€ cent)
CAGR dividend per share 14%
New € 500 million SBB programme Current tranche € 200 million implemented

47
Convincing development shareholder value parameters
Earnings per share* (€ cents)
0
50
100
150
200
250
CAGR EPS 17%
FY-05 H2-05 /H1-06
Q4-05 /Q3-06
FY-06 H2-06 /H1-07
Q4-06 /Q3-07
0%
10%
20%
30%
40%
50%
60%
70%
FY-05 H2-05 /H1-06
Q4-05 /Q3-06
FY-06 H2-06 /H1-07
Q4-06 /Q3-07
CAGR RoE 36%
Return on Equity*
* From continuing operations

48
Highest score in Dow Jones Sustainability Index 2007
11 Highest score in all 3 dimensions
- Economic (94%)
- Environmental (95%)
- Social (90%) SAM Research: “TNT has
consistently improved not only its sustainability reporting, but also its sustainability performance”
12 Akzo Nobel3 Australia &
New Zealand Banks Group
4 Novo Nordisk5 Philips
91%88%87%
83%82%

49
Dividend pay out to 40% of normalised net income by
2010
Additional € 100 million tranche of € 500 million SBB
“Regular” incidental SBB from excess cash
49
Focus on Shareholder returns short term
50
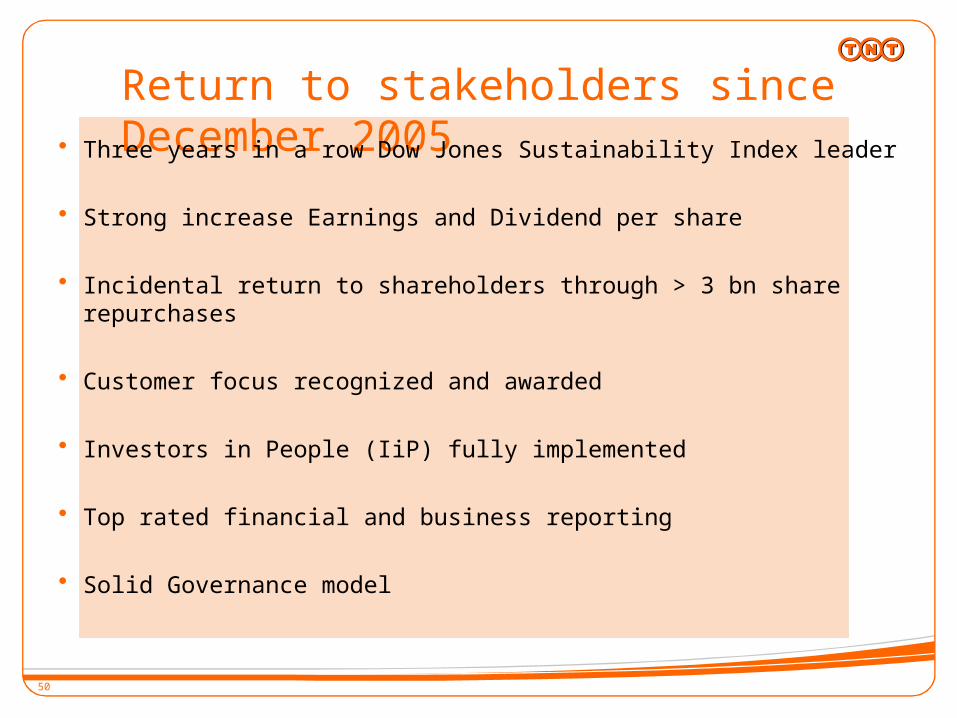
Return to stakeholders since December 2005 Three years in a row Dow Jones Sustainability Index leader
Strong increase Earnings and Dividend per share
Incidental return to shareholders through > 3 bn share repurchases
Customer focus recognized and awarded
Investors in People (IiP) fully implemented
Top rated financial and business reporting
Solid Governance model

51
Warning about forward looking statements
Some statements in this presentation are “forward-looking statements”. By their nature, forward-looking statements involve risk and uncertainty because they relate to events that depend on circumstances that will occur in the future. These forward-looking statements are based on current expectations, estimates, forecasts, analyses and projections about the industries in which we operate and management’s beliefs and assumptions about future events. You are cautioned not to put undue reliance on these forward-looking statements, which only speak as of the date of this presentation and are neither predictions nor guarantees of future events or circumstances. We do not undertake any obligation to release publicly any revisions to these forward-looking statements to reflect events or circumstances after the date of this presentation or to reflect the occurrence of unanticipated events, except as may be required under applicable securities laws.

52
Focus On Networks
52