Embed Size (px)
Citation preview
Business Survey 2017
RESEARCH REPORT
December 2017
Page Foreword 1 Objectives 2
Summary of main findings 3
Results
Section 1 – Profile of responding businesses 16 Section 2 – Travel, and the free movement of EU residents 26 Section 3 – Attitudes toward and perceptions of the impact of Brexit 37 Section 4 – Understanding of Brexit and requirements for additional information 60
Appendices Data preparation and processing
Statistical reliability and bias
Methodology
Sample structure and FTE’s represented
1
Foreword
Following the UK’s decision to leave the EU in June 2016, the Ministry of External Relations has been
coordinating the Government of Jersey’s response to Brexit: safeguarding Islanders’ interests and
working hard to ensure that Jersey is in a position to take advantage of the opportunities that arise.
When setting our priorities, we need a clear understanding of the potential impact of Brexit on Island
businesses, across both the financial services and non-finance sectors. As well as providing an
awareness of the unique challenges presented by Brexit, the responses to this Business Survey have
helped us to identify potential opportunities and assess how the government can assist industry in
accessing them.
This is the second survey carried out by the Ministry of External Relations, and complements the findings
of the Brexit Residents’ Survey. I am grateful to all business leaders who have taken the time to provide
this invaluable information.
This report, as well as providing clarity on the most pressing concerns for Island businesses, will inform
the development of government policy. There is an understandable concern over the future of the Island’s
trading relationships with the UK and EU, and we have developed a distinct workstream on Customs
Union and Trade matters to ensure that the Jersey is in the best possible position once Brexit has taken
place.
It is also clear that Island industries value the contribution made by employees from the United Kingdom
and the European Union. We are committed to ensuring that the position of EU citizens living in the Island
is resolved as soon as possible. We are equally committed to ensuring that businesses are able to access
essential travel links which are necessary for building global trading relationships.
As the Brexit negotiations progress, the Government of Jersey will continue to engage Islanders through
the Let’s Talk Brexit campaign. Drawing on your feedback we will also be providing additional details on
the gov.je website, and producing a regular electronic newsletter – ensuring that Islanders are provided
with the most timely and relevant Brexit information, in the most convenient format.
Thank you again to all who have contributed so constructively to the campaign, and whose views are
expressed in this report.
Senator Sir Philip Bailhache
Minister for External Relations

2
Objectives
The broad objectives of the research were as follows:
Identify the challenges and opportunities for Island industries as a direct result of Brexit
Determine the profile of the businesses responding; their industry sector, employee numbers,
geographic locations and the value of their imports and exports by market
Determine the importance of visa-free travel, the rights of EU nationals to live and work in the
Island and the reasons to recruit staff from off-Island
Examine perceptions of EU regulation and legislation and any barriers that currently restrict
business growth
Investigate attitudes toward and perceptions of the potential impact of Brexit on businesses in
Jersey and identify potential opportunities
Determine whether Brexit may result in businesses considering relocation or reduced levels of
staffing and investment in Jersey
Assess the level of understanding of Brexit, whether additional information should be distributed
and the best channels of communication
3
Summary of main findings Profile of responding businesses
Who responded?
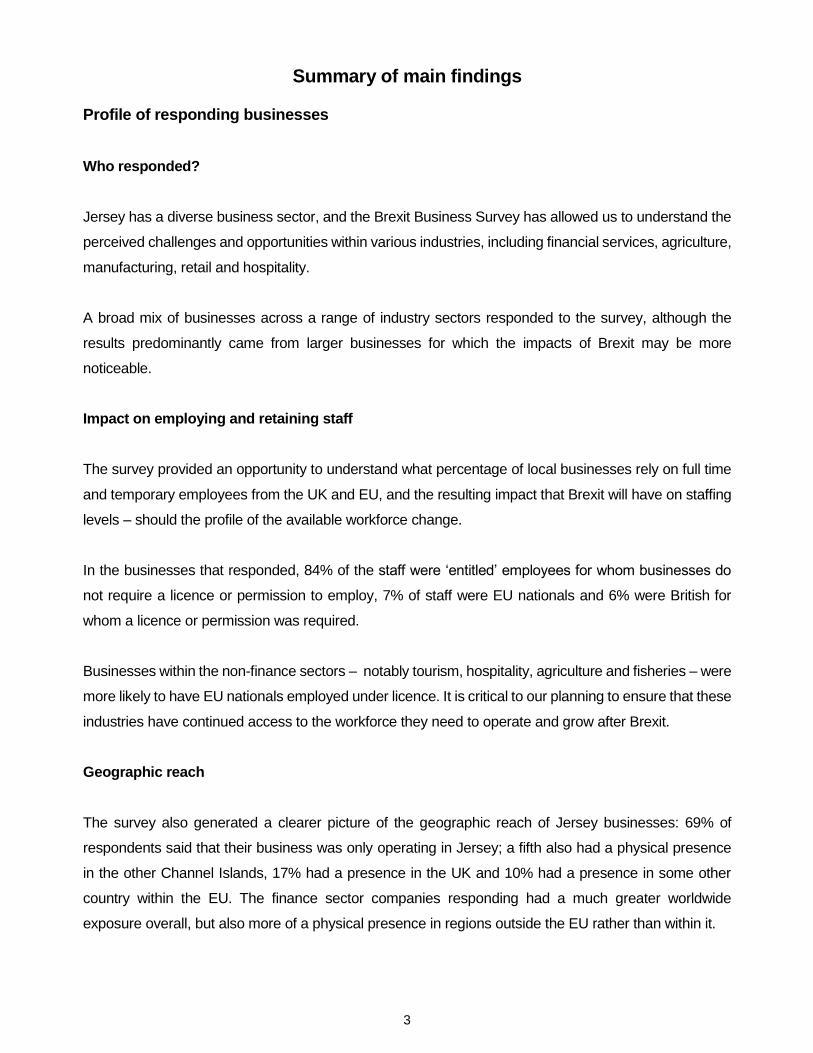
Jersey has a diverse business sector, and the Brexit Business Survey has allowed us to understand the
perceived challenges and opportunities within various industries, including financial services, agriculture,
manufacturing, retail and hospitality.
A broad mix of businesses across a range of industry sectors responded to the survey, although the
results predominantly came from larger businesses for which the impacts of Brexit may be more
noticeable.
Impact on employing and retaining staff
The survey provided an opportunity to understand what percentage of local businesses rely on full time
and temporary employees from the UK and EU, and the resulting impact that Brexit will have on staffing
levels – should the profile of the available workforce change.
In the businesses that responded, 84% of the staff were ‘entitled’ employees for whom businesses do
not require a licence or permission to employ, 7% of staff were EU nationals and 6% were British for
whom a licence or permission was required.
Businesses within the non-finance sectors – notably tourism, hospitality, agriculture and fisheries – were
more likely to have EU nationals employed under licence. It is critical to our planning to ensure that these
industries have continued access to the workforce they need to operate and grow after Brexit.
Geographic reach
The survey also generated a clearer picture of the geographic reach of Jersey businesses: 69% of
respondents said that their business was only operating in Jersey; a fifth also had a physical presence
in the other Channel Islands, 17% had a presence in the UK and 10% had a presence in some other
country within the EU. The finance sector companies responding had a much greater worldwide
exposure overall, but also more of a physical presence in regions outside the EU rather than within it.
4
As a government, we will work to ensure that the necessary regulatory and legal measures are in place
post-Brexit to ensure that Island businesses can continue to operate, and grow, in EU countries and
globally.
Impact on imports and exports
Looking to the Island’s existing trading relationships, the United Kingdom is clearly shown as our most
important partner.
42% of businesses responding to our survey said that they had exported products or services in 2016,
with the mean value of exports being £7.5 million. For those businesses that do export, 38% of their sales
are to Jersey, 29% to the UK and 12% to other EU countries.
57% of the businesses responding said that they imported products into Jersey, with the mean value of
imports being £2.5 million. Imports are of particular importance to businesses within the fishing,
wholesale and retail, manufacturing and utilities sectors.
For those businesses that declared that they had made any imports during 2016, 79% of direct imports
were from the UK and 13% from other countries within the EU.
It is our priority to ensure that agreements are in place to guarantee uninterrupted trade, both with the
United Kingdom and EU, to ensure that Jersey businesses can continue to export goods and services,
and to benefit from those produced off-Island.
5
Government of Jersey response
Accessing the EU workforce
1. Economically, socially and culturally, Jersey benefits greatly from the contribution of the
approximately 20,000 non-British EU citizens resident in the Island, many of whom work on
a ‘licence’ basis.
2. The Government of Jersey has made clear to the UK Government the need for any new
restrictions on EU immigration to take into account the particular requirements of the Island’s
economy, ensuring that Jersey retains access to vital labour markets.
Securing future trading relationships
3. Jersey is an outward-looking country that will continue to trade with all parts of the world. The
Government of Jersey will work to mitigate any negative impact and to take advantage of new
opportunities presented by Brexit.
4. Our objective is to continue the benefits of our trading relationship with the EU. We wish to
continue to access the EU goods markets on terms no less favourable than the UK, and to
access EU markets for financial services through meeting requirements of equivalence,
mutual recognition or regimes for ‘third countries’.
5. We also want to ensure Jersey has the right agreements and international relationships to
benefit from global opportunities. This includes pursuing the extension of the UK’s
membership of the WTO to Jersey, while also ensuring that the Island is able to participate
in any future Free Trade Agreement between the UK and EU.
6. As the UK seeks to develop its trading relationships with the rest of the world, we are actively
developing relationships through our Global Markets team (in particular in Africa, Asia and
the Middle East), an expanded network of international agreements; and entrustment to
negotiate bilateral investment treaties between Jersey and key trading partners.
6
7. The first meeting with the UK Government on Customs took place in January 2017, where
the Government of Jersey outlined its key priorities. Discussions on these matters continued
in the second meeting, which took place on 3 July 2017. Subsequently, officials from the
Department for International Trade visited the Island on 24 August 2017 to discuss
international trade commitments once the UK leaves the EU. In the same week, officials
from the UK Department for the Environment, Food and Rural Affairs visited the Jersey to
discuss Agriculture and Fisheries matters with colleagues at the Department of the
Environment.
7
Travel and the free movement of EU residents The results of the Brexit Business Survey have emphasised the importance that local industries place
on the ability of staff to travel for meetings, training and business development.
Business travel
Overall, half of all business trips are made to the UK and Ireland, a quarter to the other Channel Islands
and 8% to other countries within the EU. Businesses within the finance industry make more than twice
as many business trips to other EU countries as those in the non-finance sectors.
Almost 60% of respondents received client visits from off-Island contacts in an average year. Excluding
some outlying results from those in the tourism sector, the mean number of annual client visits is 44 and
60% of those are from the UK.
Reflecting the above, businesses consider visa-free travel to the UK and Ireland to be relatively more
important than to other countries within the EU and EEA. However, a majority (56%) still rate visa-free
travel to the EU and EEA as important.
This aligns with the government’s priority to ensure that our membership of the CTA is maintained, and
that we avoid the imposition of routine immigration controls – particularly between the Island and the UK.
Recruitment of EU staff
The results from the Survey reflect the views of government; highly valuing the contribution made to the
Island by the 20,000 EU citizens living and working in Jersey.
Overall, the main reason given for the recruitment of EU staff under licence was the difficulty in finding
staff locally, followed by access to a more skilled, specialised or experienced workforce. The latter was
the main reason for businesses in the finance industry. For non-finance businesses, another major
reason to recruit off-Island was that local staff do not readily apply for work in their industry. Only three
respondents said that their primary reason was for access to cheaper labour.
With regard to the rights of EU nationals to live and work in Jersey, the most prominent suggestion was
to keep the status quo as far as possible, with the continued free movement of EU nationals subject to
Jersey’s own control of work and housing system. Rather than restricting numbers, the preference was
for increased access to EU staff, but perhaps with greater vetting of those coming into the Island and
introducing time-limited work permits or visas.
8
Government of Jersey response
Travel
1. Our priority is to continue with the fundamentals of Jersey’s existing relationship with the
United Kingdom, particularly in relation to the freedom of movement between the Channel
Islands and the UK.
2. Jersey, along with the UK, Republic of Ireland, Guernsey and the Isle of Man, forms part
of the Common Travel Area (CTA), within which British and Irish Nationals can travel
freely. Maintaining the CTA and avoiding the imposition of routine immigration controls –
particularly between the Island and the UK – is a key priority for the Government of Jersey.
3. We have received a number of assurances from the UK Government regarding its
understanding of the importance of preserving Islanders’ ability to travel freely within the
CTA zone.
4. A meeting to discuss transport issues was held between the UK Government and the
Crown Dependencies (including Jersey) on 3 April 2017. A further meeting took place on
6 November 2017. The topic was also considered at the quarterly meeting between Robin
Walker MP, Parliamentary Under-Secretary of State for Exiting the European Union, and
the three Chief Ministers of the Crown Dependencies in November 2017.
5. While Brexit raises some complex issues, the overarching view of both Jersey and the UK
in relation to transport is that there is a broad alignment of interests. We have agreed to
maintain a regular dialogue throughout the exit negotiations in order to avoid the
imposition of unplanned barriers to transport.
Access to skilled staff
6. We understand that many Island businesses, especially those in the non-finance sectors,
value the ability to recruit EU staff under licence, having experienced difficulty in securing
staff locally. Equally, the financial services sector values the ability to recruit employees
from the EU to meet the requirements of certain skills or specialisation.
9
7. When the UK leaves the EU and shapes its own immigration policy for EU citizens, it has
the potential to impact upon Jersey, due to the extension of the UK’s Immigration Act to
the Island. The Government of Jersey has made clear to the UK Government the need
for any new restrictions on EU immigration to take into account the particular requirements
of the Island’s economy, ensuring that Jersey retains access to vital labour markets, and
continues to hold, and can enhance where possible, its freedom to determine its
immigration requirements.
8. The first immigration meeting with the UK Government took place on 3 November 2016,
a second on 7 February 2017, and the most recent on 20 July 2017. Immigration matters
were also considered at the quarterly meeting between Robin Walker MP and the Chief
Ministers of the Crown Dependencies, and also during the Minister’s visit to the Island on
7 August 2017.
9. The Chief Minister’s Department has clearly explained its intention to enhance our
migration controls and to reduce migration, while also supporting our economy. We have
ensured that the officials developing this policy are fully aware of the concerns raised and
suggestions made by the respondents in the Brexit Residents’ Survey.
10
Attitudes toward and perceptions of the impact of Brexit
A result of Brexit will be an end to the direct applicability of EU legislation in the Island. The Law Officers
Department is undertaking a substantive task to ensure the legislation that is required for the proper
operation of Jersey business is converted into domestic legislation. The results of the survey have been
shared with the Law Officers Department to assist in their work – ensuring that those businesses which
rely on particular aspects of EU law can continue to do so post-Brexit.
EU regulation
Overall, a higher proportion of businesses felt that current EU regulation and legislation was positive
rather than negative for their business. Businesses outside of the finance industry were generally more
positive about the impact of current EU regulation and legislation.
By far the most positive aspect of current EU legislation concerns the free movement of people and
labour within the EU, notably from those sectors that employ a large number of EU nationals, but also
across most other industry sectors. The second most cited benefit concerns the single market, free trade
and access to EU markets for exports.
Risks and opportunities for Jersey businesses
The main barriers to growth into markets outside of the EU were related to company focus or strategy,
as well as the higher risk and resources required for expansion beyond the EU.
When shown a list of potential impacts of Brexit on the Island, the primary concerns related in some way
to potentially higher costs to businesses following Brexit, as well as the impacts on travel. This was
followed by concerns about access to and availability of skilled and experienced staff, access to the EU
for financial services, and the overall impact on Jersey’s economy, its competitiveness and the number
of businesses in the Island.
It is a priority of government to mitigate these risks by ensuring continued access to visa-free travel, a
skilled workforce and comprehensive trade agreements.
The main perceived opportunities presented by Brexit were growth in visitors to Jersey as a result of the
weakness of sterling, and improved freedom to trade elsewhere or to set up direct trade deals.
11
Two-thirds of respondents thought that the overall impact of Brexit on their business would be neither
positive nor negative. Businesses in the non-finance sectors were more negative about the impact of
Brexit on their business.
Before the referendum vote, 29% saw the EU as a potential area of growth, but this reduced to 19% post
referendum. Perceptions of potential growth for all other regions have barely changed as a result of the
referendum.
Only 6% said that the end result of Brexit would be likely to cause their business to consider moving any
of its operations out of Jersey, but for those that did, France was the main country under consideration.
A higher proportion of respondents also thought that the impact of Brexit would reduce rather than
increase their business’s staffing levels in Jersey, but again 90% felt that there would be no change.
Only one in five respondents said that their business was actively planning for Brexit. For those that were,
the main ways they were preparing was by keeping a watching brief on events and potential implications
and opportunities, as well as scenario planning and reviewing supply chains in the event of a need to
change.
Business priorities
28% of businesses said that they had noticed changes that were directly attributable to the referendum
vote. These mainly related to the impact on sterling and the knock-on impact on import prices and
subsequent costs. Finance companies had observed a slowdown due to the current uncertainties in the
market. On the positive side, the weakness of sterling has led to increased visitors to Jersey since the
referendum vote.
During the negotiations, the main priority for both finance and non-finance businesses is for Jersey to
maintain its current relationship with the UK, followed by securing a new trade arrangement with the EU.
These priorities align with those of Government of Jersey and have formed the basis of our engagement
with the UK government and EU Member States.
The most desired outcome from the negotiations is either no change, or to maintain the status quo as far
as possible. Other than this, the main desired outcome is for the free movement of people and continued
access to EU labour alongside a workable immigration strategy for Jersey. Securing a new trade
arrangement that maintains access and free trade with the EU, and achieving clarity and certainty as
soon as possible are also seen as primary desirable outcomes.
12
Government of Jersey response
Legislative changes
1. It is crucial that the Government of Jersey is equipped to make all the necessary
corrections to Jersey Law before the UK leaves the EU, in order to ensure an orderly
transition for the Island
2. Like the UK, a consequence of Brexit is that Jersey will need to repeal its European Union
(Jersey) Law 1973, which gives effect to the treaties governing Jersey’s relationship with
the EU. Like the UK, Jersey is also looking at how much EU law it may need to retain by
converting it into Jersey law, and at the extent to which amendments are required to
domestic law that implements EU law.
3. Unlike the UK, where EU law is directly applicable in a wide range of contexts, in Jersey,
EU law is directly applicable in a more limited range of circumstances. In particular, EU
law is directly applicable in relation to customs matters and rules relating to trade in
agricultural products, including the products of fisheries.
4. On 19 October 2017 the Minister for External Relations issued Ministerial Decision MD-
ER-2017-0042 instructing the Law Draftsman to draft the European Union (Repeal and
Amendment) (Jersey) Law 201-. It is anticipated that the Draft Law will be debated in the
States Assembly in March 2017.
Business priorities
5. We note that the main priority for both finance and non-finance businesses is for the Island
to maintain its current relationship with the UK, followed by securing a new trade
arrangement with the EU. These priorities align directly with those of the Government of
Jersey, which were published directly following the referendum result in June 2016, and
most recently in the R.87 Brexit Information Report that was debated in the States
Assembly on 1 November 2017.
13
6. It is critical to the Government of Jersey that we ensure that the Island remains able to
actively trade with the United Kingdom and European Union, and we have made this clear
in our engagement with the UK Government. Equally, The Government of Jersey has made
clear to the UK Government the need for any new restrictions on EU immigration to take
into account the particular requirements of the Island’s economy, ensuring that Jersey
retains access to vital labour markets.
7. The information provided within this section of the Business Survey has been shared with
the Economic Policy Committee, and will provide a useful basis for the ongoing
development of the Island’s economic policy.
14
Understanding of Brexit and requirements for additional information
Overall, just under half of the businesses responding felt that they already had a sufficient understanding
of the issues associated with Brexit, and three-quarters said that they would find further information
useful.
The most useful information concerned how Brexit would or could impact Jersey specifically, including
impacts on specific industries within the Island. There was also a request for more ongoing information
and updates on how Jersey is involved within the negotiations.
The most preferred communication channel was online, either through a dedicated government website
or from subscription to an e-newsletter. There was also demand for printed information booklets/leaflets
(particularly from non-finance businesses), regular coverage in the local media and public briefings with
Q&A sessions (particularly from the finance industry businesses).
15
Government of Jersey response
Stakeholder engagement
Our priority is to ensure effective engagement with the UK government throughout
the withdrawal process, as well as consistent local engagement with the whole of
the Government of Jersey, States Members, Jersey residents and businesses.
1. The ‘Let’s Talk Brexit’ stakeholder engagement campaign was launched on 8 March
2017, to allow the public and businesses to share thoughts and concerns about Brexit
with the government and one another in a structured and accessible way.
2. The campaign aims to ensure that accurate information is made available to the Public
on Jersey’s constitutional position, on the process for the UK’s exit from the EU, and on
the work that the Government of Jersey is undertaking both in Jersey and with the UK
Government. From the outset, it was considered particularly important to communicate
using formats, language and tone suited to different stakeholder groups with diverse
interests in Brexit, ranging from EU citizens resident in Jersey, to Jersey residents
concerned about (for example) travel in Europe, to international businesses operating in
Jersey, and to local businesses.
3. Following the results of this survey, a series of further engagement is planned with Island
businesses to examine the impact of Brexit on individual industries.
4. The Government of Jersey will continue to develop the Let’s Talk Brexit campaign, and
publish in accessible formats the outcome of public engagement, surveys, industry focus
groups and online discussions. In line with the suggestions made in this survey, an
electronic and paper-based newsletter will also be developed to more regularly inform
members of the public on Brexit developments.

16
Section 1 – Profile of responding businesses
The first section of the questionnaire examined the profile of businesses responding to the survey to
check that the results would represent a broad selection of Jersey’s private sector businesses, and also
to allow for the results later in the survey to be cross-tabulated by differing industry sector sub-samples.
The breakdown of the sample by industry sector can be seen within the sample structure earlier in this
report, which also shows the size of businesses responding by numbers of FTE staff. The survey actually
asked for the number of staff to be broken down by differing types, with the overall results shown in the
graph below:
Breakdown of staff within the businesses responding
Sample size: 235 businesses representing 9,415 staff
N.B. Some respondents just declared the total number of staff rather than breaking them down into the
above categories. These have been excluded from the graph above.
‘Other’ categories mentioned were mainly ‘registered’ with no further breakdown of their nationality.
The June 2016 Jersey Labour Market report showed that 85.6% of Jersey’s private sector headcount
consisted of staff who have been classified as either ‘entitled’ or ‘entitled to work’, which is similar to the
overall sample total of 83.5% shown above. The Labour Market report does not provide a breakdown of
staff by nationality.
Within the survey sample, a slightly higher proportion of staff (7.4%) were EU nationals for whom a
licence or permission to employ was required compared to UK nationals (5.8%) requiring a licence or
permission.
Across the full sample of 246 businesses, the mean number of staff employed was 45. The most recent
Jersey Labour Market report showed that the mean number of staff employed within the private sector
was just over 7, so the sample who responded to the survey is more representative of larger businesses
for whom Brexit may be more relevant.
83.5%
5.8%
7.4%2.5% 0.8%
Entitled' employees who do not require a licence or permission to employ
British nationals who require a license or permission to employ
EU nationals who require a license or permission to employ
Nationals from other countries who require a licence or permission to employ
Other categories
17
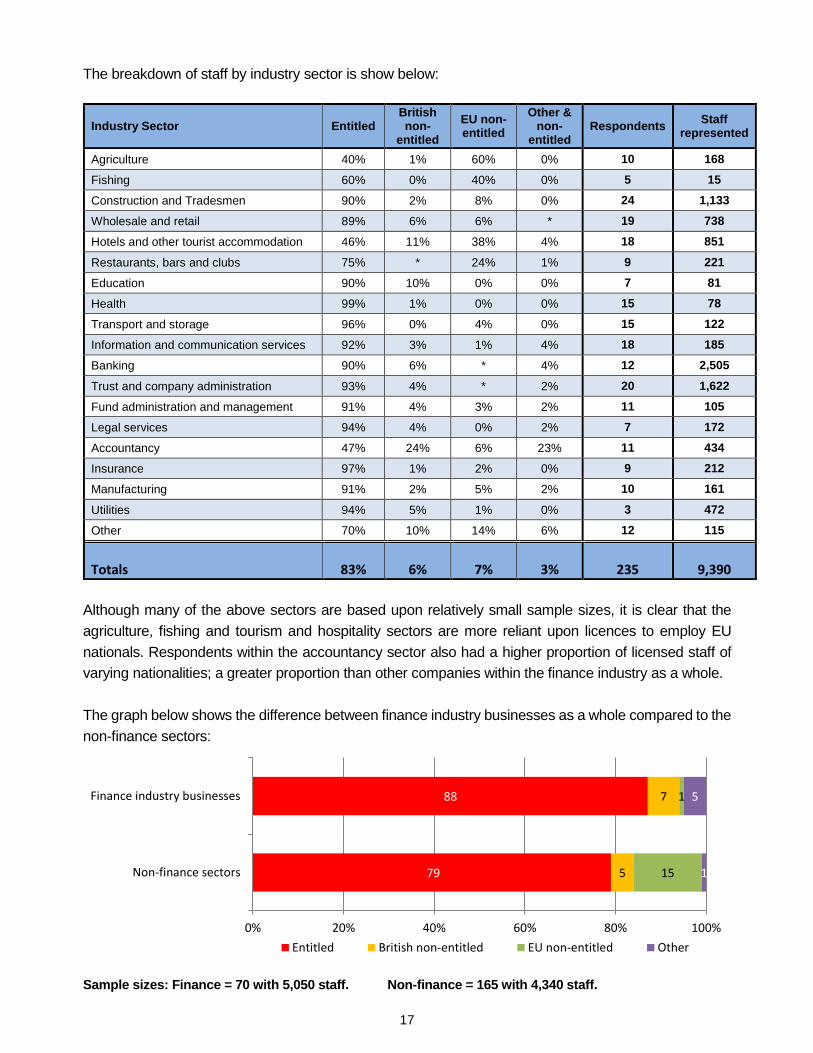
The breakdown of staff by industry sector is show below:
Industry Sector Entitled British non-
entitled
EU non-entitled
Other & non-
entitled Respondents
Staff represented
Agriculture 40% 1% 60% 0% 10 168
Fishing 60% 0% 40% 0% 5 15
Construction and Tradesmen 90% 2% 8% 0% 24 1,133
Wholesale and retail 89% 6% 6% * 19 738
Hotels and other tourist accommodation 46% 11% 38% 4% 18 851
Restaurants, bars and clubs 75% * 24% 1% 9 221
Education 90% 10% 0% 0% 7 81
Health 99% 1% 0% 0% 15 78
Transport and storage 96% 0% 4% 0% 15 122
Information and communication services 92% 3% 1% 4% 18 185
Banking 90% 6% * 4% 12 2,505
Trust and company administration 93% 4% * 2% 20 1,622
Fund administration and management 91% 4% 3% 2% 11 105
Legal services 94% 4% 0% 2% 7 172
Accountancy 47% 24% 6% 23% 11 434
Insurance 97% 1% 2% 0% 9 212
Manufacturing 91% 2% 5% 2% 10 161
Utilities 94% 5% 1% 0% 3 472
Other 70% 10% 14% 6% 12 115
Totals 83% 6% 7% 3% 235 9,390
Although many of the above sectors are based upon relatively small sample sizes, it is clear that the
agriculture, fishing and tourism and hospitality sectors are more reliant upon licences to employ EU
nationals. Respondents within the accountancy sector also had a higher proportion of licensed staff of
varying nationalities; a greater proportion than other companies within the finance industry as a whole.
The graph below shows the difference between finance industry businesses as a whole compared to the
non-finance sectors:
Sample sizes: Finance = 70 with 5,050 staff. Non-finance = 165 with 4,340 staff.
79
88
5
7
15
1
1
5
Non-finance sectors
Finance industry businesses
0% 20% 40% 60% 80% 100%
Entitled British non-entitled EU non-entitled Other
18
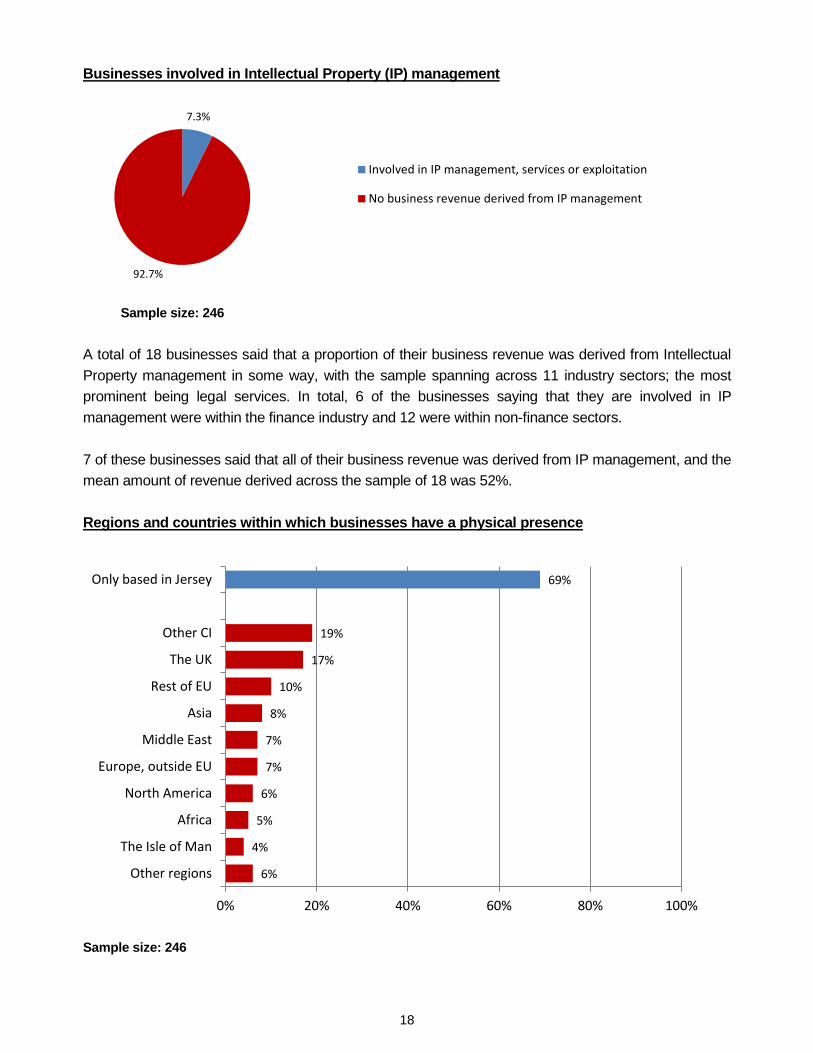
Businesses involved in Intellectual Property (IP) management
Sample size: 246
A total of 18 businesses said that a proportion of their business revenue was derived from Intellectual
Property management in some way, with the sample spanning across 11 industry sectors; the most
prominent being legal services. In total, 6 of the businesses saying that they are involved in IP
management were within the finance industry and 12 were within non-finance sectors.
7 of these businesses said that all of their business revenue was derived from IP management, and the
mean amount of revenue derived across the sample of 18 was 52%.
Regions and countries within which businesses have a physical presence
Sample size: 246
7.3%
92.7%
Involved in IP management, services or exploitation
No business revenue derived from IP management
6%
4%
5%
6%
7%
7%
8%
10%
17%
19%
69%
0% 20% 40% 60% 80% 100%
Other regions
The Isle of Man
Africa
North America
Europe, outside EU
Middle East
Asia
Rest of EU
The UK
Other CI
Only based in Jersey
19
Other regions stated included Australia/New Zealand (5 respondents), Caribbean (5) and Central/Latin
America (2). 2 respondents also mentioned that they are a global business with a presence across the
World.
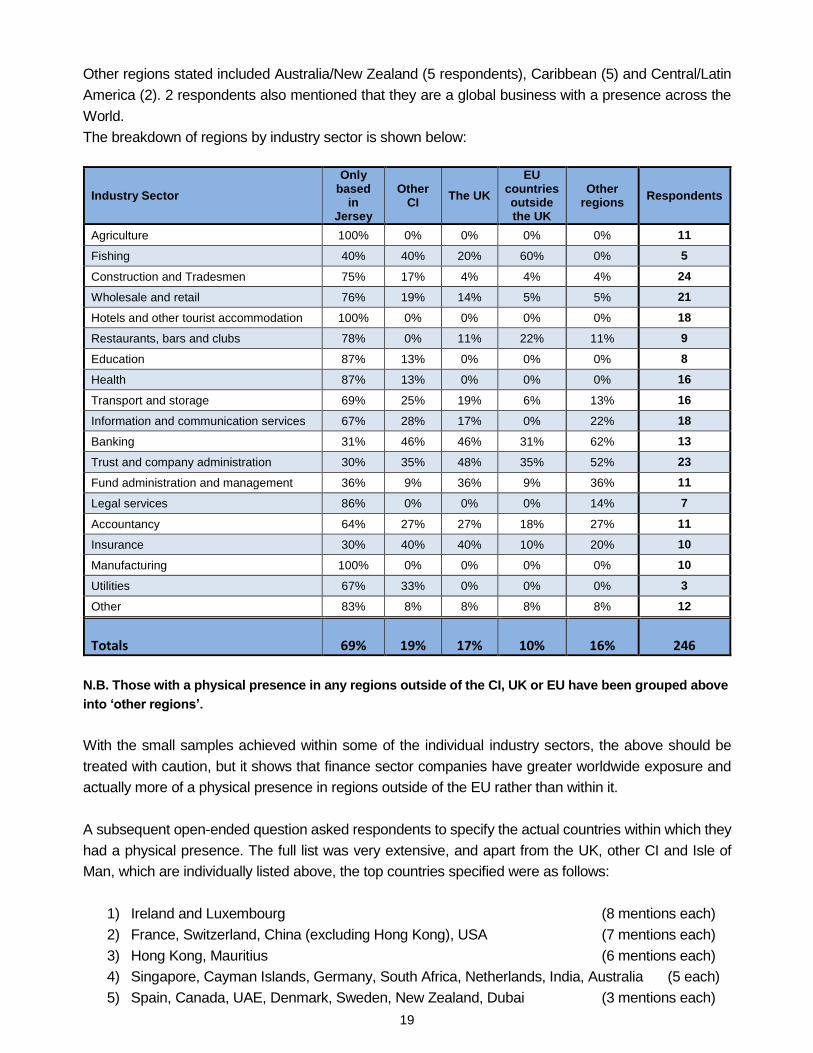
The breakdown of regions by industry sector is shown below:
Industry Sector
Only based
in Jersey
Other CI
The UK
EU countries outside the UK
Other regions
Respondents
Agriculture 100% 0% 0% 0% 0% 11
Fishing 40% 40% 20% 60% 0% 5
Construction and Tradesmen 75% 17% 4% 4% 4% 24
Wholesale and retail 76% 19% 14% 5% 5% 21
Hotels and other tourist accommodation 100% 0% 0% 0% 0% 18
Restaurants, bars and clubs 78% 0% 11% 22% 11% 9
Education 87% 13% 0% 0% 0% 8
Health 87% 13% 0% 0% 0% 16
Transport and storage 69% 25% 19% 6% 13% 16
Information and communication services 67% 28% 17% 0% 22% 18
Banking 31% 46% 46% 31% 62% 13
Trust and company administration 30% 35% 48% 35% 52% 23
Fund administration and management 36% 9% 36% 9% 36% 11
Legal services 86% 0% 0% 0% 14% 7
Accountancy 64% 27% 27% 18% 27% 11
Insurance 30% 40% 40% 10% 20% 10
Manufacturing 100% 0% 0% 0% 0% 10
Utilities 67% 33% 0% 0% 0% 3
Other 83% 8% 8% 8% 8% 12
Totals 69% 19% 17% 10% 16% 246
N.B. Those with a physical presence in any regions outside of the CI, UK or EU have been grouped above
into ‘other regions’.
With the small samples achieved within some of the individual industry sectors, the above should be
treated with caution, but it shows that finance sector companies have greater worldwide exposure and
actually more of a physical presence in regions outside of the EU rather than within it.
A subsequent open-ended question asked respondents to specify the actual countries within which they
had a physical presence. The full list was very extensive, and apart from the UK, other CI and Isle of
Man, which are individually listed above, the top countries specified were as follows:
1) Ireland and Luxembourg (8 mentions each)
2) France, Switzerland, China (excluding Hong Kong), USA (7 mentions each)
3) Hong Kong, Mauritius (6 mentions each)
4) Singapore, Cayman Islands, Germany, South Africa, Netherlands, India, Australia (5 each)
5) Spain, Canada, UAE, Denmark, Sweden, New Zealand, Dubai (3 mentions each)

20
Companies with the most numerous offices around the world were in the trust and company
administration, as well as banking sectors.

21
Trade – Exports of products and/or services from Jersey in 2016
Sample size: 239
71 businesses provided a total value of their exports of products and/or services and these ranged from
a minimum value of £100 up to a maximum value of £72.1 million. The total value declared across all
who responded was almost £540 million, although this is an underestimate as 29% of the exporters did
not declare a total value. The mean value for those who responded was £7.5 million.
The proportion of exporters by industry sector is shown below:
Industry Sector % exporting any
products/services in 2016 Respondents
Agriculture 9% 11
Fishing 100% 5
Construction and Tradesmen 21% 24
Wholesale and retail 40% 20
Hotels and other tourist accommodation 33% 18
Restaurants, bars and clubs 25% 8
Education 38% 8
Health 13% 16
Transport and storage 44% 16
Information and communication services 56% 18
Banking 67% 12
Trust and company administration 67% 21
Fund administration and management 45% 11
Legal services 86% 7
Accountancy 36% 11
Insurance 56% 9
Manufacturing 40% 10
Utilities 0% 3
Other 45% 11
Totals 42% 239 N.B. Due to the even smaller sample sizes for those who do export, it is not possible to show a mean value broken down by industry sector.
41.8%
58.2%
Exported any products/services in 2016
Did not export from Jersey in 2016
22
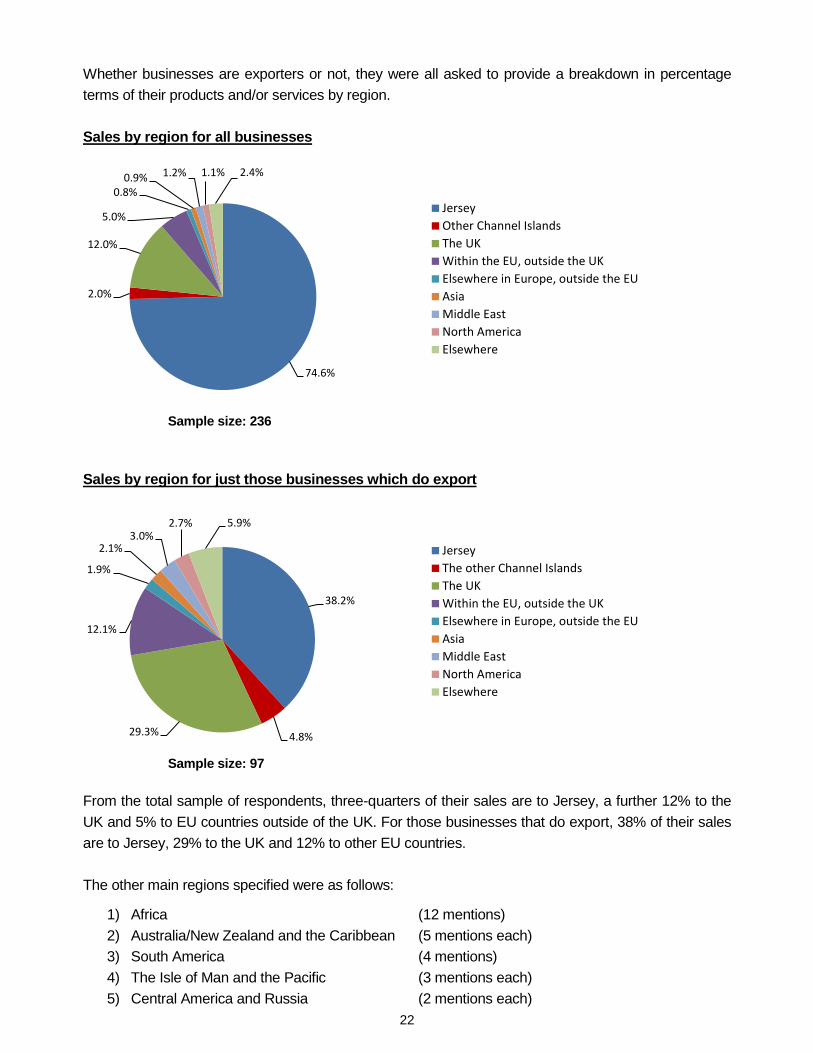
Whether businesses are exporters or not, they were all asked to provide a breakdown in percentage
terms of their products and/or services by region.
Sales by region for all businesses
Sample size: 236
Sales by region for just those businesses which do export
Sample size: 97
From the total sample of respondents, three-quarters of their sales are to Jersey, a further 12% to the
UK and 5% to EU countries outside of the UK. For those businesses that do export, 38% of their sales
are to Jersey, 29% to the UK and 12% to other EU countries.
The other main regions specified were as follows:
1) Africa (12 mentions)
2) Australia/New Zealand and the Caribbean (5 mentions each)
3) South America (4 mentions)
4) The Isle of Man and the Pacific (3 mentions each)
5) Central America and Russia (2 mentions each)
74.6%
2.0%
12.0%
5.0%
0.8%0.9% 1.2% 1.1% 2.4%
Jersey
Other Channel Islands
The UK
Within the EU, outside the UK
Elsewhere in Europe, outside the EU
Asia
Middle East
North America
Elsewhere
38.2%
4.8%29.3%
12.1%
1.9%
2.1%3.0%
2.7% 5.9%
Jersey
The other Channel Islands
The UK
Within the EU, outside the UK
Elsewhere in Europe, outside the EU
Asia
Middle East
North America
Elsewhere
23
A subsequent open-ended question asked respondents to specify the actual countries within which their
products and/or services are sold. Many businesses responded by saying that their sales are global
rather than specifying the individual countries; particularly those in the banking and trust sectors. Apart
from those who specified that their sales are global, an additional 80 individual countries were specified.
Excluding the UK and other Channel Islands, which were individually listed in the previous question, the
top countries mentioned for exports are as follows:
1) France (27 mentions)
2) The USA (19 mentions)
3) Germany (15 mentions)
4) Ireland and Switzerland (11 mentions each)
5) Hong Kong (10 mentions)
6) Canada (8 mentions)
7) Netherlands, South Africa, UAE, Spain, China (7 mentions each)
8) Japan, Australia, Isle of Man (6 mentions each)
9) Singapore, Luxembourg, Dubai, India (5 mentions each)
10) Belgium, Kenya, Italy (4 mentions each)
Apart from the UK and Other CI, EU countries had a total of 118 mentions, compared to 154 for non-EU
countries, showing that Jersey’s export sales of good and services are widespread and global.
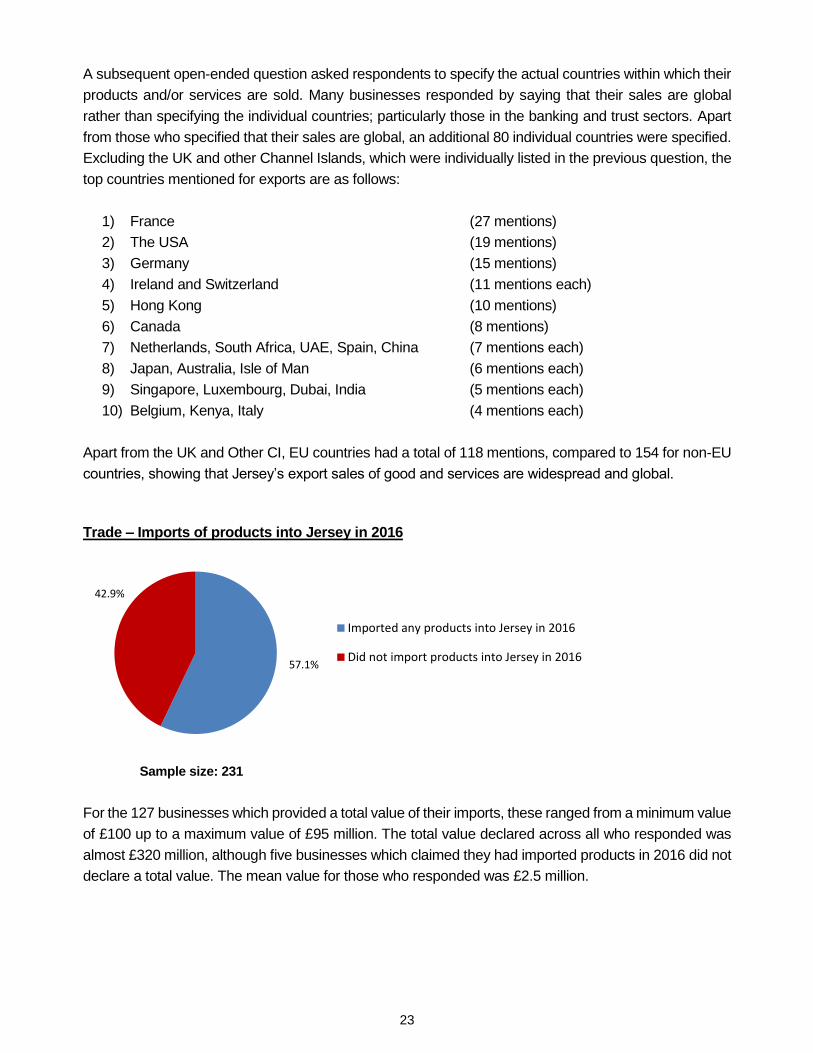
Trade – Imports of products into Jersey in 2016
Sample size: 231
For the 127 businesses which provided a total value of their imports, these ranged from a minimum value
of £100 up to a maximum value of £95 million. The total value declared across all who responded was
almost £320 million, although five businesses which claimed they had imported products in 2016 did not
declare a total value. The mean value for those who responded was £2.5 million.
57.1%
42.9%
Imported any products into Jersey in 2016
Did not import products into Jersey in 2016
24
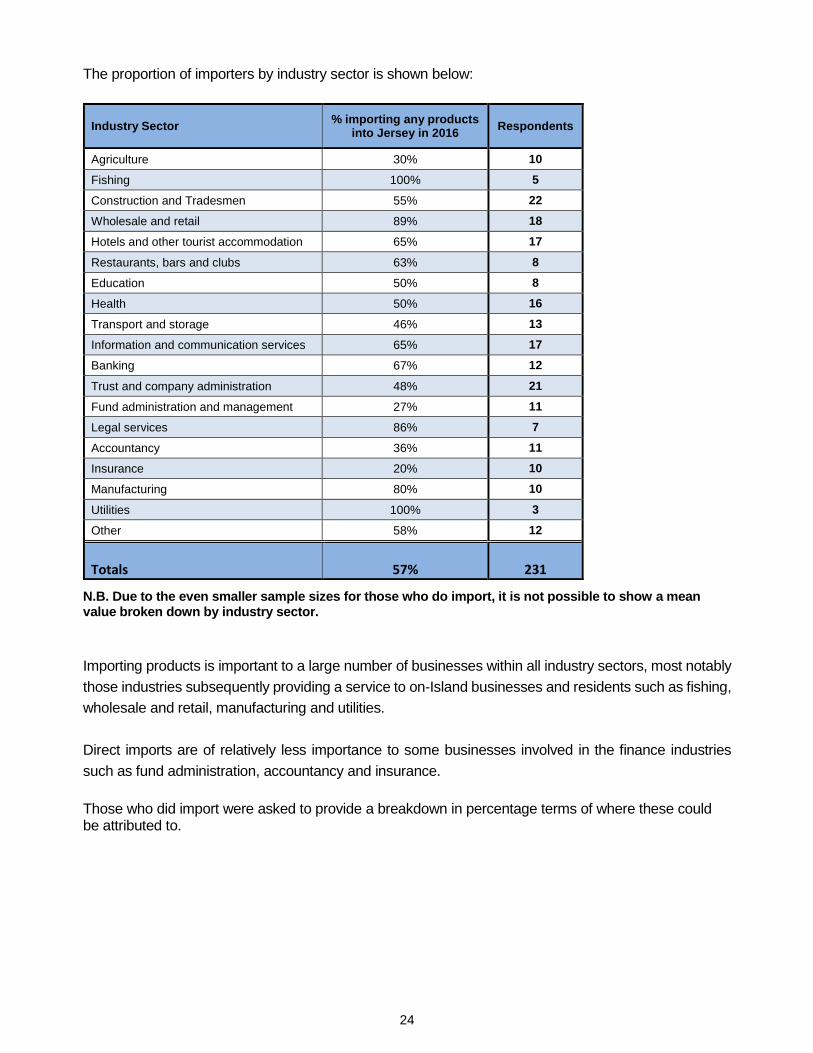
The proportion of importers by industry sector is shown below:
Industry Sector % importing any products
into Jersey in 2016 Respondents
Agriculture 30% 10
Fishing 100% 5
Construction and Tradesmen 55% 22
Wholesale and retail 89% 18
Hotels and other tourist accommodation 65% 17
Restaurants, bars and clubs 63% 8
Education 50% 8
Health 50% 16
Transport and storage 46% 13
Information and communication services 65% 17
Banking 67% 12
Trust and company administration 48% 21
Fund administration and management 27% 11
Legal services 86% 7
Accountancy 36% 11
Insurance 20% 10
Manufacturing 80% 10
Utilities 100% 3
Other 58% 12
Totals 57% 231 N.B. Due to the even smaller sample sizes for those who do import, it is not possible to show a mean value broken down by industry sector.
Importing products is important to a large number of businesses within all industry sectors, most notably
those industries subsequently providing a service to on-Island businesses and residents such as fishing,
wholesale and retail, manufacturing and utilities.
Direct imports are of relatively less importance to some businesses involved in the finance industries
such as fund administration, accountancy and insurance.
Those who did import were asked to provide a breakdown in percentage terms of where these could be attributed to.
25
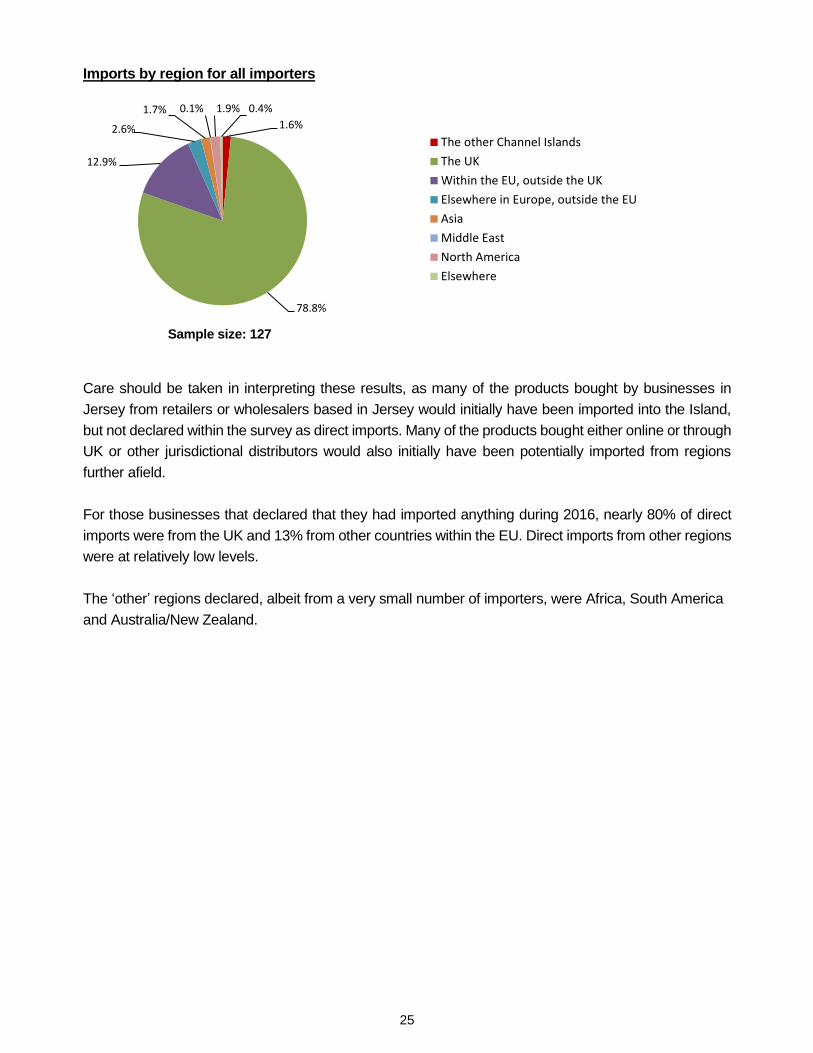
Imports by region for all importers
Sample size: 127
Care should be taken in interpreting these results, as many of the products bought by businesses in
Jersey from retailers or wholesalers based in Jersey would initially have been imported into the Island,
but not declared within the survey as direct imports. Many of the products bought either online or through
UK or other jurisdictional distributors would also initially have been potentially imported from regions
further afield.
For those businesses that declared that they had imported anything during 2016, nearly 80% of direct
imports were from the UK and 13% from other countries within the EU. Direct imports from other regions
were at relatively low levels.
The ‘other’ regions declared, albeit from a very small number of importers, were Africa, South America
and Australia/New Zealand.
1.6%
78.8%
12.9%
2.6%
1.7% 0.1% 1.9% 0.4%
The other Channel Islands
The UK
Within the EU, outside the UK
Elsewhere in Europe, outside the EU
Asia
Middle East
North America
Elsewhere
26
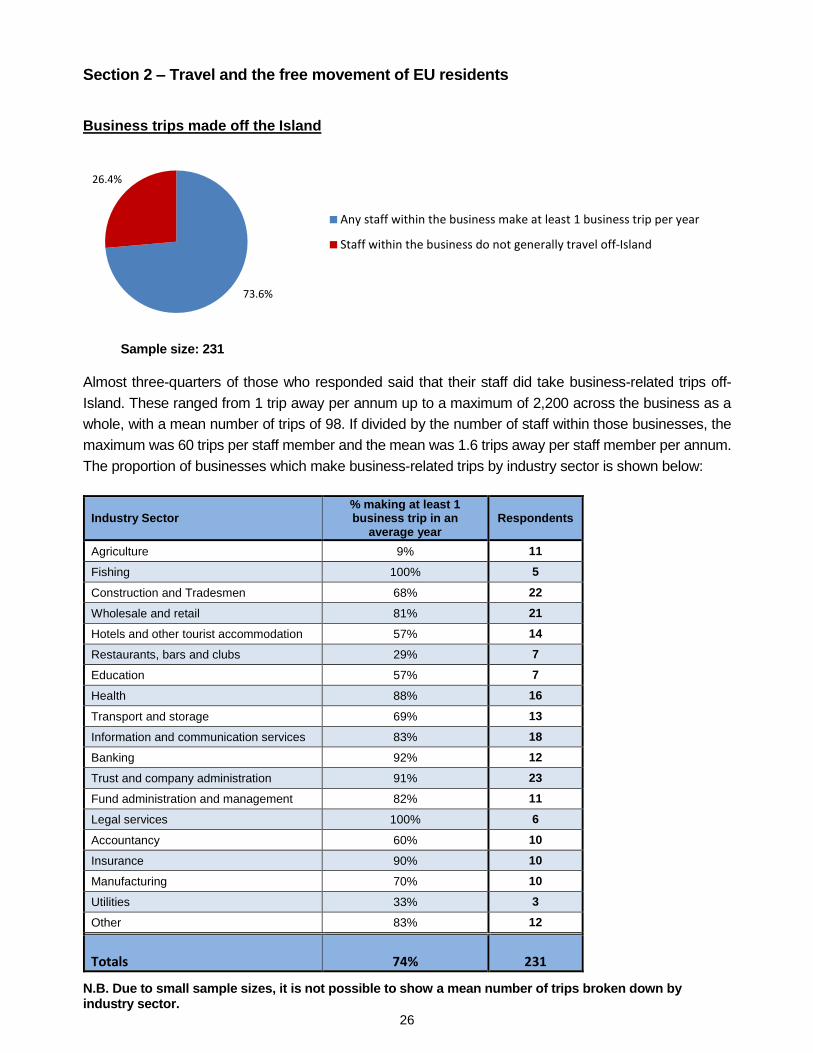
Section 2 – Travel and the free movement of EU residents Business trips made off the Island
Sample size: 231
Almost three-quarters of those who responded said that their staff did take business-related trips off-
Island. These ranged from 1 trip away per annum up to a maximum of 2,200 across the business as a
whole, with a mean number of trips of 98. If divided by the number of staff within those businesses, the
maximum was 60 trips per staff member and the mean was 1.6 trips away per staff member per annum.
The proportion of businesses which make business-related trips by industry sector is shown below:
Industry Sector % making at least 1 business trip in an
average year Respondents
Agriculture 9% 11
Fishing 100% 5
Construction and Tradesmen 68% 22
Wholesale and retail 81% 21
Hotels and other tourist accommodation 57% 14
Restaurants, bars and clubs 29% 7
Education 57% 7
Health 88% 16
Transport and storage 69% 13
Information and communication services 83% 18
Banking 92% 12
Trust and company administration 91% 23
Fund administration and management 82% 11
Legal services 100% 6
Accountancy 60% 10
Insurance 90% 10
Manufacturing 70% 10
Utilities 33% 3
Other 83% 12
Totals 74% 231 N.B. Due to small sample sizes, it is not possible to show a mean number of trips broken down by industry sector.
73.6%
26.4%
Any staff within the business make at least 1 business trip per year
Staff within the business do not generally travel off-Island
27
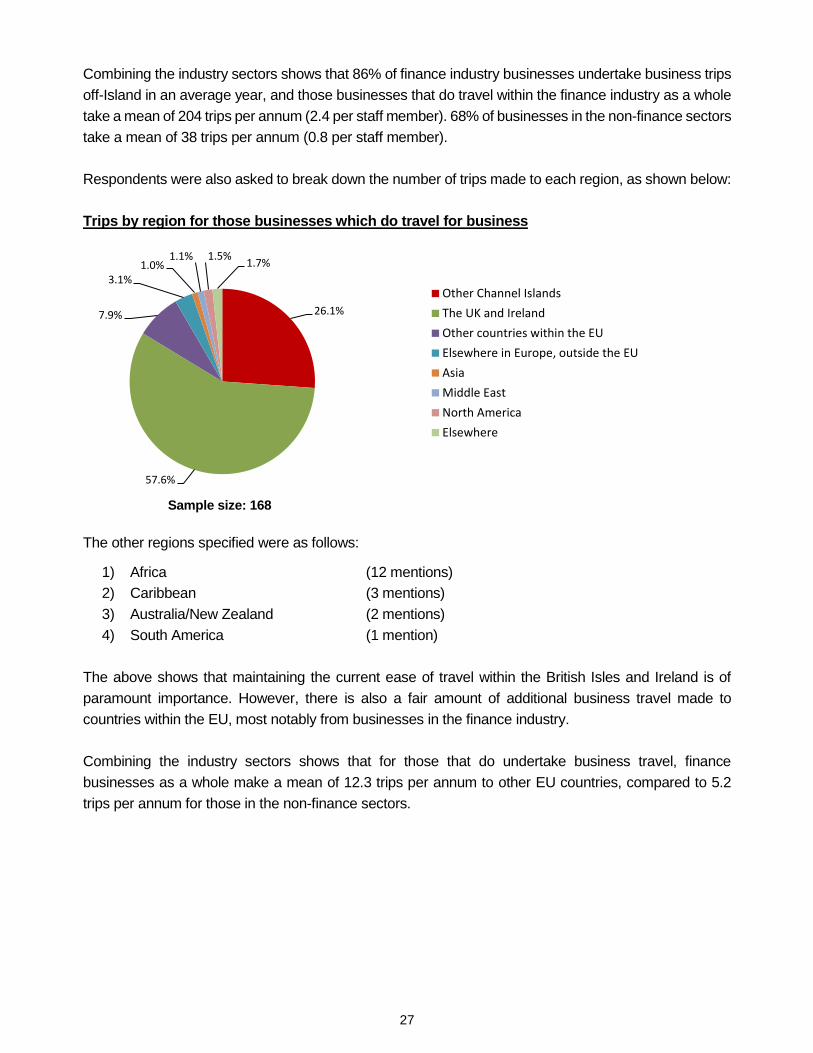
Combining the industry sectors shows that 86% of finance industry businesses undertake business trips
off-Island in an average year, and those businesses that do travel within the finance industry as a whole
take a mean of 204 trips per annum (2.4 per staff member). 68% of businesses in the non-finance sectors
take a mean of 38 trips per annum (0.8 per staff member).
Respondents were also asked to break down the number of trips made to each region, as shown below:
Trips by region for those businesses which do travel for business
Sample size: 168
The other regions specified were as follows:
1) Africa (12 mentions)
2) Caribbean (3 mentions)
3) Australia/New Zealand (2 mentions)
4) South America (1 mention)
The above shows that maintaining the current ease of travel within the British Isles and Ireland is of
paramount importance. However, there is also a fair amount of additional business travel made to
countries within the EU, most notably from businesses in the finance industry.
Combining the industry sectors shows that for those that do undertake business travel, finance
businesses as a whole make a mean of 12.3 trips per annum to other EU countries, compared to 5.2
trips per annum for those in the non-finance sectors.
26.1%
57.6%
7.9%
3.1%1.0%
1.1% 1.5%1.7%
Other Channel Islands
The UK and Ireland
Other countries within the EU
Elsewhere in Europe, outside the EU
Asia
Middle East
North America
Elsewhere
28
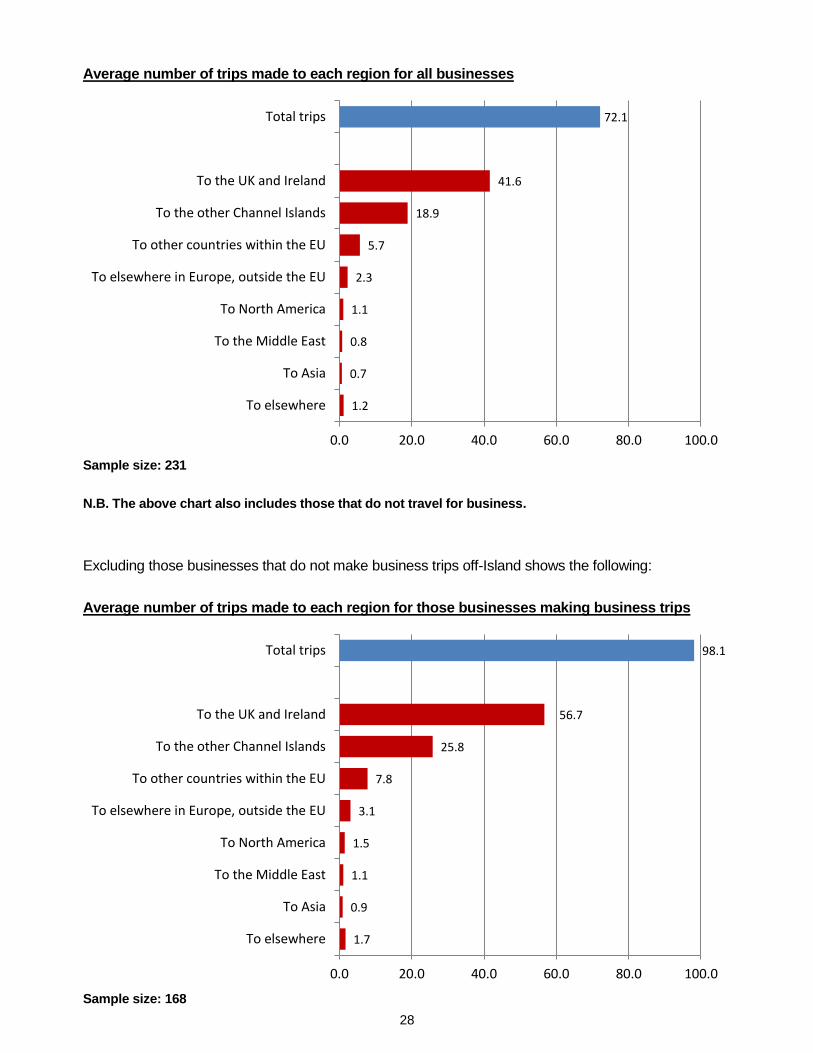
Average number of trips made to each region for all businesses
Sample size: 231
N.B. The above chart also includes those that do not travel for business.
Excluding those businesses that do not make business trips off-Island shows the following:
Average number of trips made to each region for those businesses making business trips
Sample size: 168
1.2
0.7
0.8
1.1
2.3
5.7
18.9
41.6
72.1
0.0 20.0 40.0 60.0 80.0 100.0
To elsewhere
To Asia
To the Middle East
To North America
To elsewhere in Europe, outside the EU
To other countries within the EU
To the other Channel Islands
To the UK and Ireland
Total trips
1.7
0.9
1.1
1.5
3.1
7.8
25.8
56.7
98.1
0.0 20.0 40.0 60.0 80.0 100.0
To elsewhere
To Asia
To the Middle East
To North America
To elsewhere in Europe, outside the EU
To other countries within the EU
To the other Channel Islands
To the UK and Ireland
Total trips
29
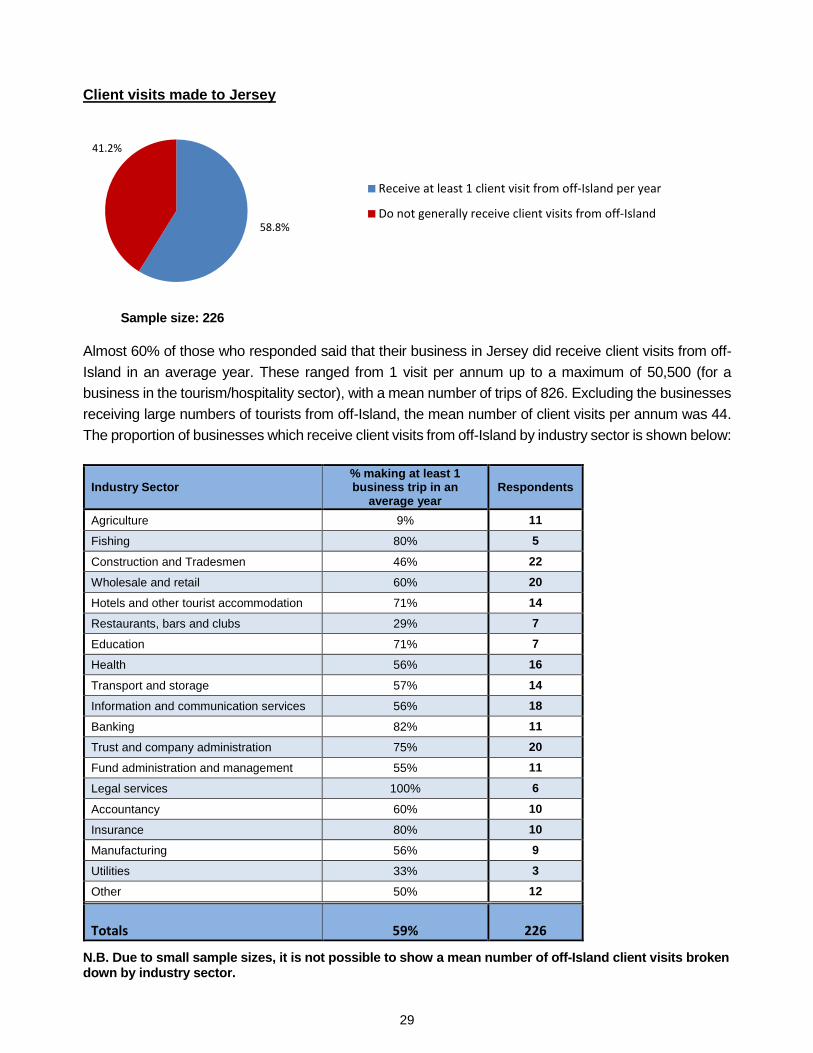
Client visits made to Jersey
Sample size: 226
Almost 60% of those who responded said that their business in Jersey did receive client visits from off-
Island in an average year. These ranged from 1 visit per annum up to a maximum of 50,500 (for a
business in the tourism/hospitality sector), with a mean number of trips of 826. Excluding the businesses
receiving large numbers of tourists from off-Island, the mean number of client visits per annum was 44.
The proportion of businesses which receive client visits from off-Island by industry sector is shown below:
Industry Sector % making at least 1 business trip in an
average year Respondents
Agriculture 9% 11
Fishing 80% 5
Construction and Tradesmen 46% 22
Wholesale and retail 60% 20
Hotels and other tourist accommodation 71% 14
Restaurants, bars and clubs 29% 7
Education 71% 7
Health 56% 16
Transport and storage 57% 14
Information and communication services 56% 18
Banking 82% 11
Trust and company administration 75% 20
Fund administration and management 55% 11
Legal services 100% 6
Accountancy 60% 10
Insurance 80% 10
Manufacturing 56% 9
Utilities 33% 3
Other 50% 12
Totals 59% 226 N.B. Due to small sample sizes, it is not possible to show a mean number of off-Island client visits broken down by industry sector.
58.8%
41.2%
Receive at least 1 client visit from off-Island per year
Do not generally receive client visits from off-Island
30
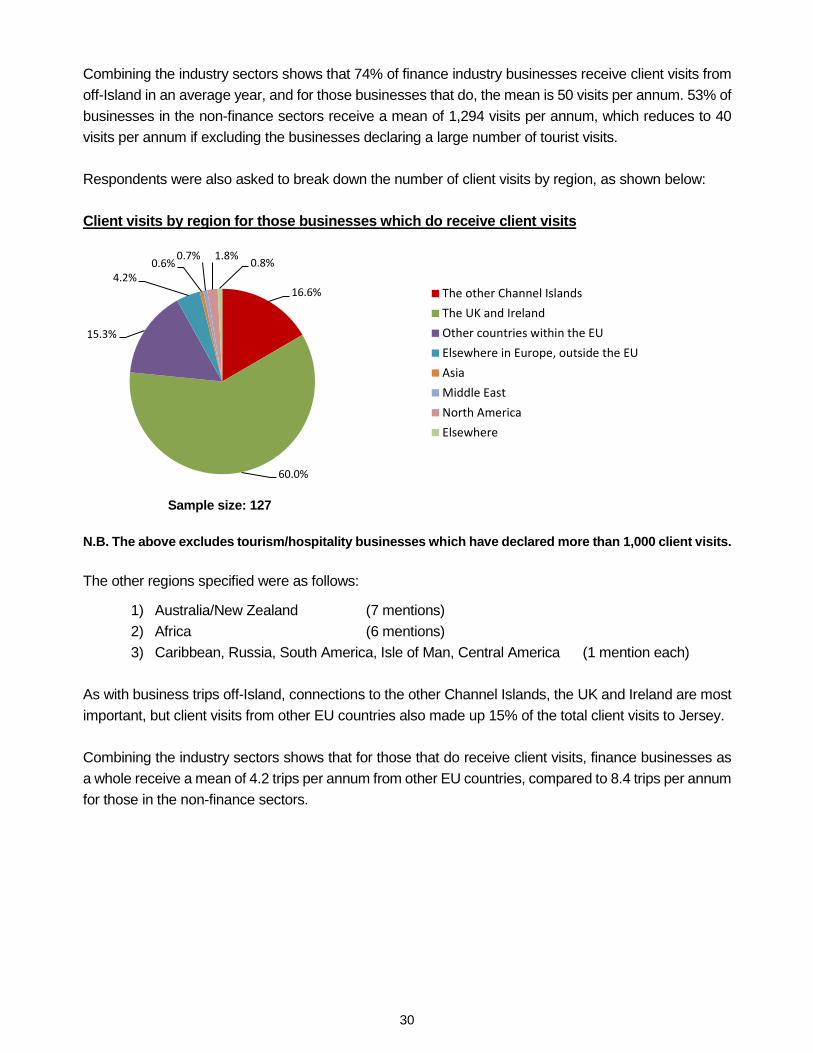
Combining the industry sectors shows that 74% of finance industry businesses receive client visits from
off-Island in an average year, and for those businesses that do, the mean is 50 visits per annum. 53% of
businesses in the non-finance sectors receive a mean of 1,294 visits per annum, which reduces to 40
visits per annum if excluding the businesses declaring a large number of tourist visits.
Respondents were also asked to break down the number of client visits by region, as shown below:
Client visits by region for those businesses which do receive client visits
Sample size: 127
N.B. The above excludes tourism/hospitality businesses which have declared more than 1,000 client visits.
The other regions specified were as follows:
1) Australia/New Zealand (7 mentions)
2) Africa (6 mentions)
3) Caribbean, Russia, South America, Isle of Man, Central America (1 mention each)
As with business trips off-Island, connections to the other Channel Islands, the UK and Ireland are most
important, but client visits from other EU countries also made up 15% of the total client visits to Jersey.
Combining the industry sectors shows that for those that do receive client visits, finance businesses as
a whole receive a mean of 4.2 trips per annum from other EU countries, compared to 8.4 trips per annum
for those in the non-finance sectors.
16.6%
60.0%
15.3%
4.2%0.6%
0.7% 1.8%0.8%
The other Channel Islands
The UK and Ireland
Other countries within the EU
Elsewhere in Europe, outside the EU
Asia
Middle East
North America
Elsewhere
31
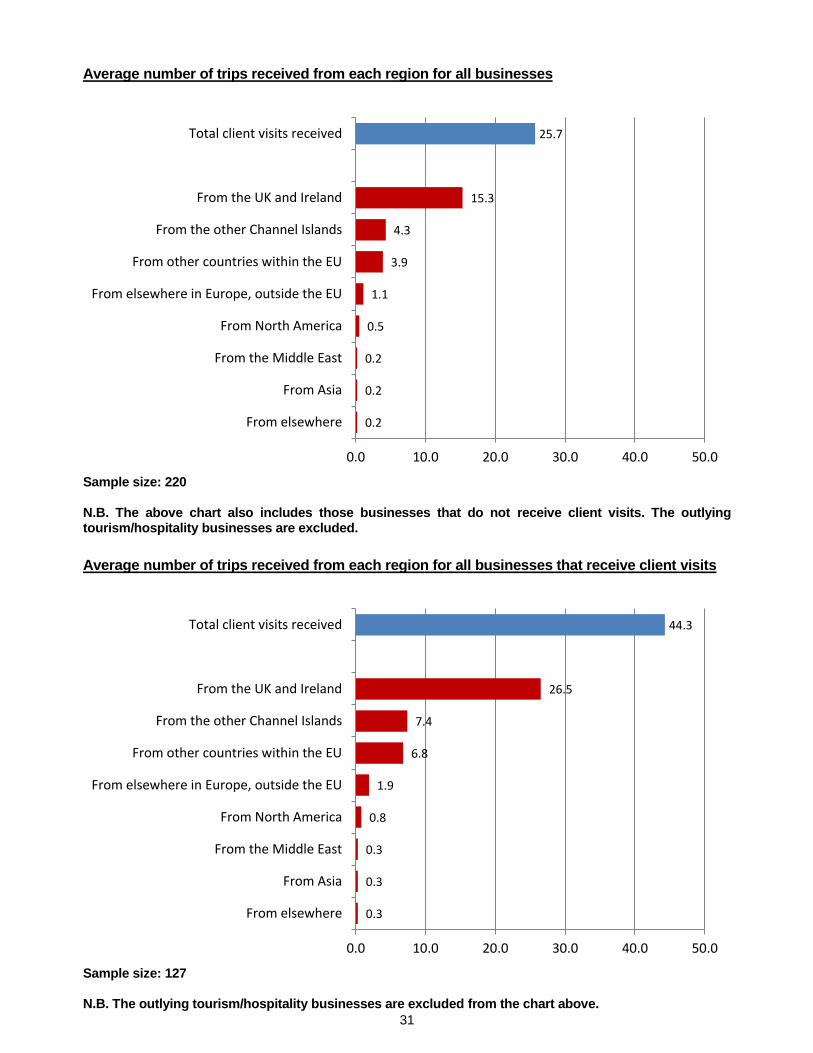
Average number of trips received from each region for all businesses
Sample size: 220 N.B. The above chart also includes those businesses that do not receive client visits. The outlying tourism/hospitality businesses are excluded.
Average number of trips received from each region for all businesses that receive client visits
Sample size: 127 N.B. The outlying tourism/hospitality businesses are excluded from the chart above.
0.2
0.2
0.2
0.5
1.1
3.9
4.3
15.3
25.7
0.0 10.0 20.0 30.0 40.0 50.0
From elsewhere
From Asia
From the Middle East
From North America
From elsewhere in Europe, outside the EU
From other countries within the EU
From the other Channel Islands
From the UK and Ireland
Total client visits received
0.3
0.3
0.3
0.8
1.9
6.8
7.4
26.5
44.3
0.0 10.0 20.0 30.0 40.0 50.0
From elsewhere
From Asia
From the Middle East
From North America
From elsewhere in Europe, outside the EU
From other countries within the EU
From the other Channel Islands
From the UK and Ireland
Total client visits received
32
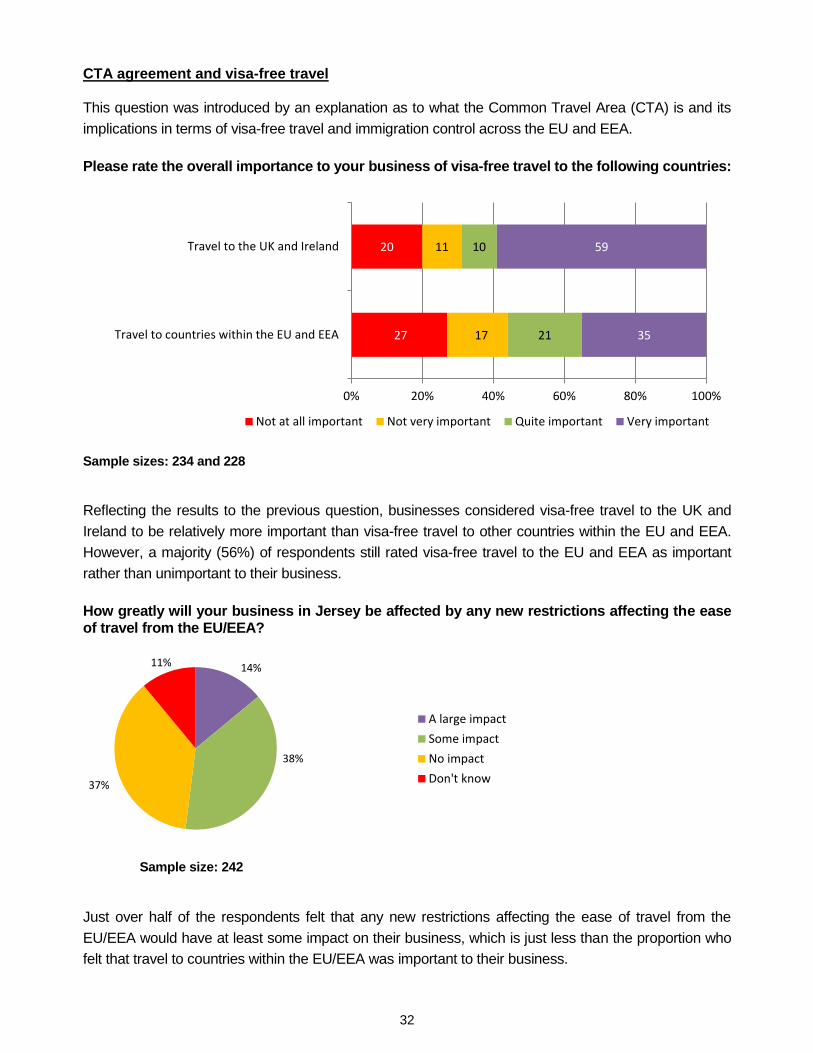
CTA agreement and visa-free travel This question was introduced by an explanation as to what the Common Travel Area (CTA) is and its
implications in terms of visa-free travel and immigration control across the EU and EEA.
Please rate the overall importance to your business of visa-free travel to the following countries:
Sample sizes: 234 and 228
Reflecting the results to the previous question, businesses considered visa-free travel to the UK and
Ireland to be relatively more important than visa-free travel to other countries within the EU and EEA.
However, a majority (56%) of respondents still rated visa-free travel to the EU and EEA as important
rather than unimportant to their business.
How greatly will your business in Jersey be affected by any new restrictions affecting the ease of travel from the EU/EEA?
Sample size: 242
Just over half of the respondents felt that any new restrictions affecting the ease of travel from the
EU/EEA would have at least some impact on their business, which is just less than the proportion who
felt that travel to countries within the EU/EEA was important to their business.
27
20
17
11
21
10
35
59
Travel to countries within the EU and EEA
Travel to the UK and Ireland
0% 20% 40% 60% 80% 100%
Not at all important Not very important Quite important Very important
14%
38%
37%
11%
A large impact
Some impact
No impact
Don't know
33
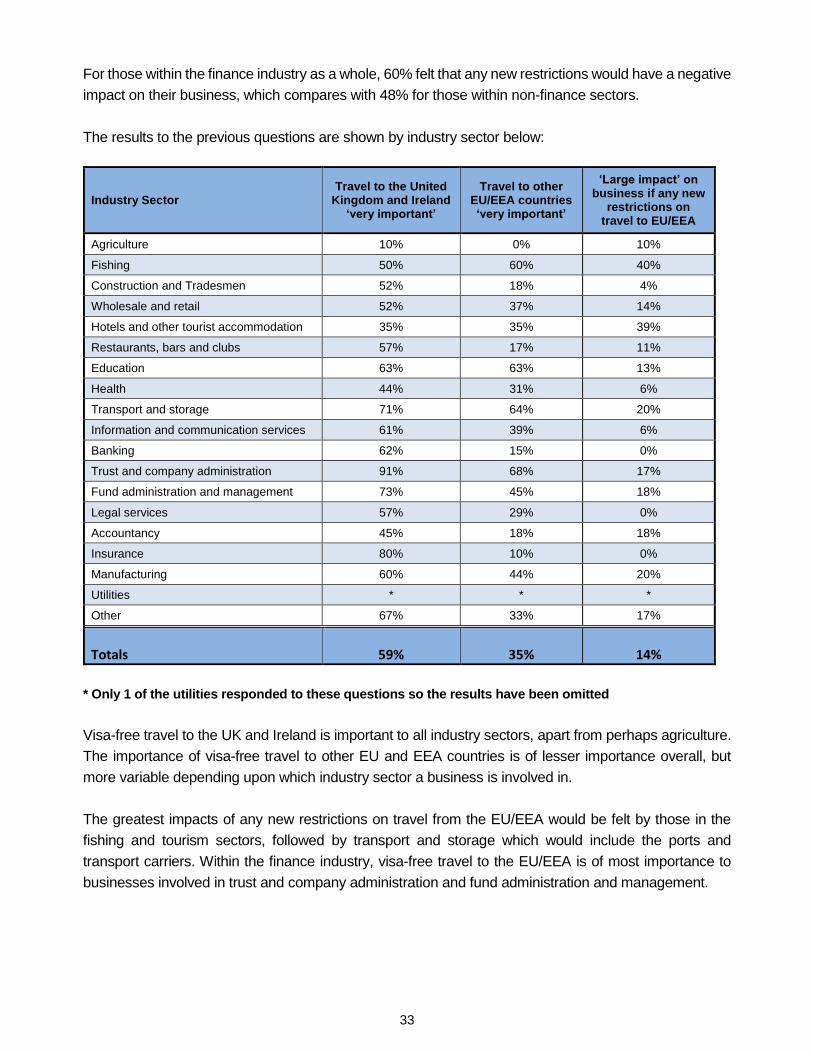
For those within the finance industry as a whole, 60% felt that any new restrictions would have a negative
impact on their business, which compares with 48% for those within non-finance sectors.
The results to the previous questions are shown by industry sector below:
Industry Sector Travel to the United
Kingdom and Ireland ‘very important’
Travel to other EU/EEA countries ‘very important’
‘Large impact’ on business if any new
restrictions on travel to EU/EEA
Agriculture 10% 0% 10%
Fishing 50% 60% 40%
Construction and Tradesmen 52% 18% 4%
Wholesale and retail 52% 37% 14%
Hotels and other tourist accommodation 35% 35% 39%
Restaurants, bars and clubs 57% 17% 11%
Education 63% 63% 13%
Health 44% 31% 6%
Transport and storage 71% 64% 20%
Information and communication services 61% 39% 6%
Banking 62% 15% 0%
Trust and company administration 91% 68% 17%
Fund administration and management 73% 45% 18%
Legal services 57% 29% 0%
Accountancy 45% 18% 18%
Insurance 80% 10% 0%
Manufacturing 60% 44% 20%
Utilities * * *
Other 67% 33% 17%
Totals 59% 35% 14%
* Only 1 of the utilities responded to these questions so the results have been omitted
Visa-free travel to the UK and Ireland is important to all industry sectors, apart from perhaps agriculture.
The importance of visa-free travel to other EU and EEA countries is of lesser importance overall, but
more variable depending upon which industry sector a business is involved in.
The greatest impacts of any new restrictions on travel from the EU/EEA would be felt by those in the
fishing and tourism sectors, followed by transport and storage which would include the ports and
transport carriers. Within the finance industry, visa-free travel to the EU/EEA is of most importance to
businesses involved in trust and company administration and fund administration and management.
34
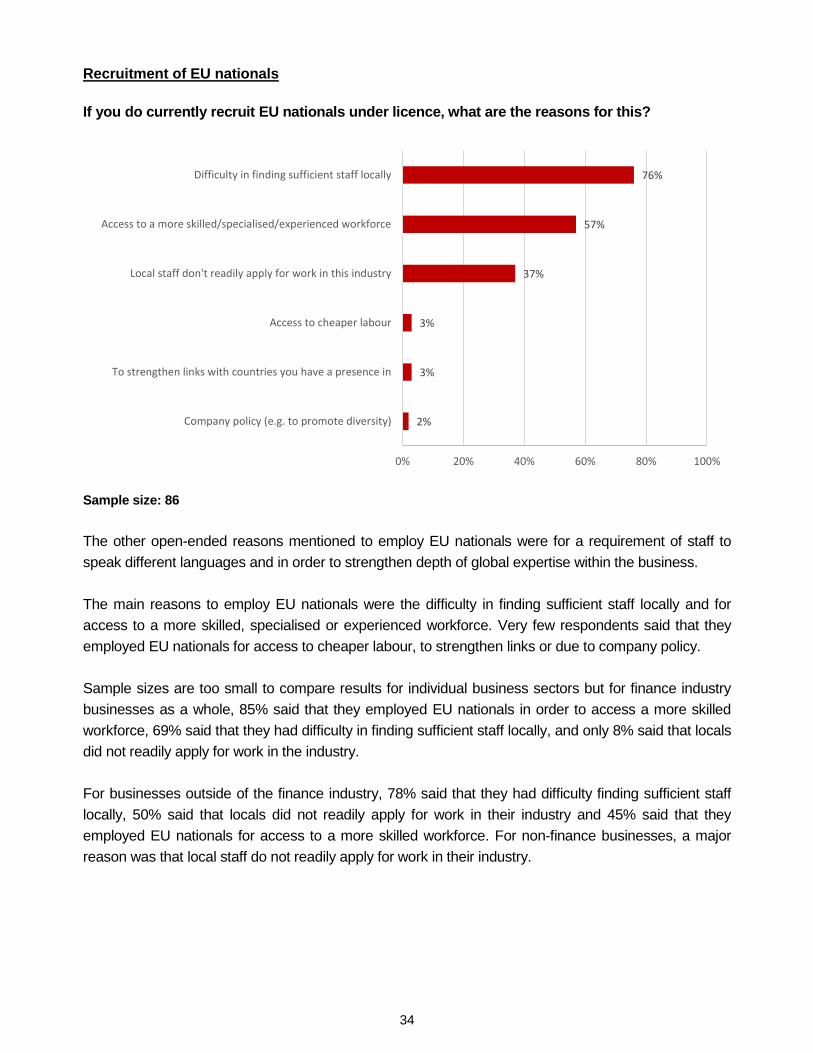
Recruitment of EU nationals
If you do currently recruit EU nationals under licence, what are the reasons for this?
Sample size: 86
The other open-ended reasons mentioned to employ EU nationals were for a requirement of staff to
speak different languages and in order to strengthen depth of global expertise within the business.
The main reasons to employ EU nationals were the difficulty in finding sufficient staff locally and for
access to a more skilled, specialised or experienced workforce. Very few respondents said that they
employed EU nationals for access to cheaper labour, to strengthen links or due to company policy.
Sample sizes are too small to compare results for individual business sectors but for finance industry
businesses as a whole, 85% said that they employed EU nationals in order to access a more skilled
workforce, 69% said that they had difficulty in finding sufficient staff locally, and only 8% said that locals
did not readily apply for work in the industry.
For businesses outside of the finance industry, 78% said that they had difficulty finding sufficient staff
locally, 50% said that locals did not readily apply for work in their industry and 45% said that they
employed EU nationals for access to a more skilled workforce. For non-finance businesses, a major
reason was that local staff do not readily apply for work in their industry.
2%
3%
3%
37%
57%
76%
0% 20% 40% 60% 80% 100%
Company policy (e.g. to promote diversity)
To strengthen links with countries you have a presence in
Access to cheaper labour
Local staff don't readily apply for work in this industry
Access to a more skilled/specialised/experienced workforce
Difficulty in finding sufficient staff locally
35
Rights of EU Nationals to live and work in Jersey At the moment, as a result of the application of Protocol 3, EU nationals have freedom of movement when travelling to and from the Island, but their right to live and work in Jersey is subject to Jersey’s licensing of housing and employment. Looking forward, do you have any thoughts or suggestions as to the direction Jersey might follow with regard to the rights of EU nationals to live and work in the Island?
Reiterating the results to the previous question, many respondents, particularly in the tourism and
hospitality sectors took the opportunity to state how essential it was for their business to continue to
employ staff from EU countries due to the current lack of local residents looking to work in their industry.
The most prominent suggestion by far was to keep the status quo as far as possible, with the continued
free movement of EU nationals subject to Jersey’s own licensing system. While there was recognition of
the strains brought about by an expanding population, there was a far greater number of respondents
asking for increased access to EU staff rather than imposing greater restrictions or controls over
immigration. Rather than restricting numbers, the preference was for greater vetting of those coming into
the Island and introducing time-limited work permits or visas.
The main, categorised comments and suggestions put forward in order of prevalence were as follows: 1) As far as possible, no change from Jersey’s current system; continue to allow free movement of EU
nationals into Jersey subject to licensing provisions and avoid any further restrictions.
2) Don’t allow entry to the Island without a licence or work permit/working visa and consider limiting
these permits to ‘seasonal’ or for a specified time period.
3) Facilitate further access to EU nationals where required and allow businesses to employ staff that
they need.
4) Introduce a points system similar to Australia based upon Jerseys’ employment requirements, skill
sets, health and criminal records etc.
5) Introduce tighter controls over immigration.
6) Allow EU nationals already resident in Jersey to remain, with their rights maintained.
7) Adopt whatever is agreed by the UK and apply to Jersey.
8) Allow EU citizens the same rights as Jersey residents to live and work abroad.
9) Encourage and educate local residents to fill the roles currently filled by EU nationals.
10) Adopt licensing provisions that are business sector specific.
Any further comments with regard to the potential future impacts on travel arrangements as a
result of Brexit, and how these might impact upon your business operations:
The majority of the comments related to potential travel restrictions having either little or no impact on
businesses, with links to the UK being cited as being more of a priority than transport links to the EU.
This was not the case for those respondents from the tourism and hospitality sectors who expressed
concerns about the impact on the number of EU visitors to the Island and this subsequently having a
negative impact on their overall business levels, despite the UK being the main source market. There
was also a large number of comments expressing concern about potentially reduced ease or
convenience of travel, subsequently adversely impacting upon business and investment levels.

36
Concerns were also expressed about a further negative impact on the ability to recruit staff from off-
Island if travel became more difficult and expensive.
37
Section 3 – Attitudes toward and perceptions of the impact of Brexit
EU regulation and legislation
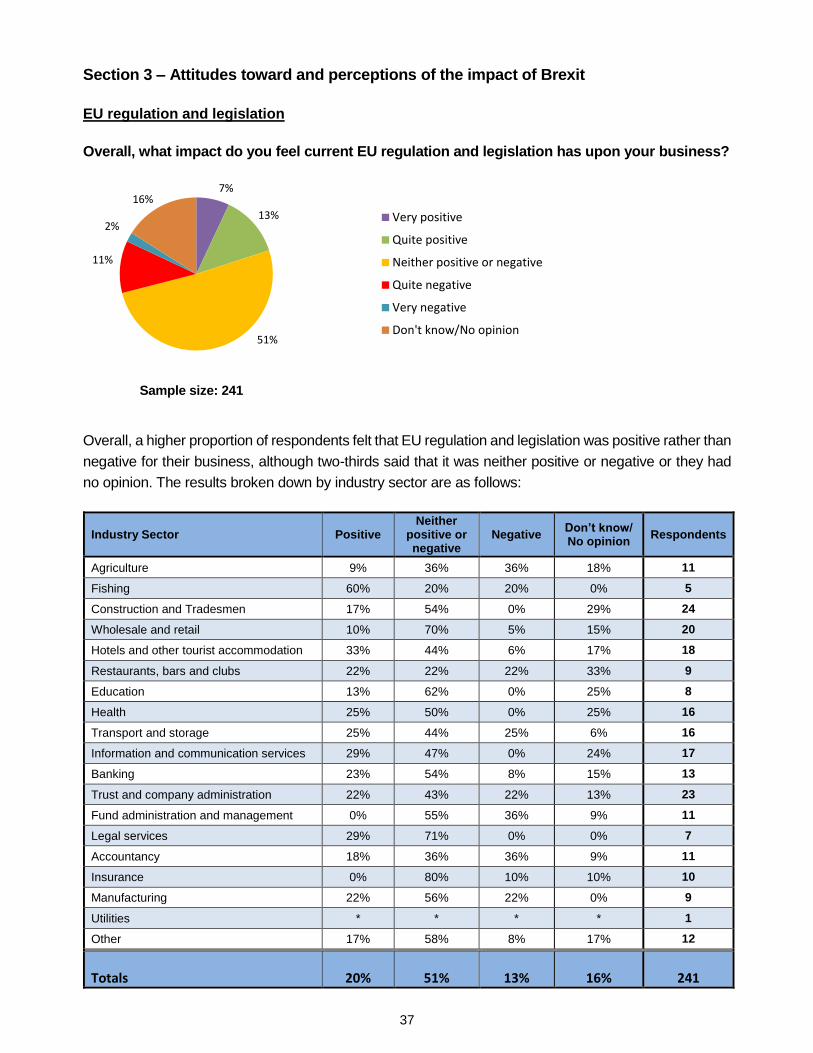
Overall, what impact do you feel current EU regulation and legislation has upon your business?
Sample size: 241
Overall, a higher proportion of respondents felt that EU regulation and legislation was positive rather than
negative for their business, although two-thirds said that it was neither positive or negative or they had
no opinion. The results broken down by industry sector are as follows:
Industry Sector Positive Neither
positive or negative
Negative Don’t know/ No opinion
Respondents
Agriculture 9% 36% 36% 18% 11
Fishing 60% 20% 20% 0% 5
Construction and Tradesmen 17% 54% 0% 29% 24
Wholesale and retail 10% 70% 5% 15% 20
Hotels and other tourist accommodation 33% 44% 6% 17% 18
Restaurants, bars and clubs 22% 22% 22% 33% 9
Education 13% 62% 0% 25% 8
Health 25% 50% 0% 25% 16
Transport and storage 25% 44% 25% 6% 16
Information and communication services 29% 47% 0% 24% 17
Banking 23% 54% 8% 15% 13
Trust and company administration 22% 43% 22% 13% 23
Fund administration and management 0% 55% 36% 9% 11
Legal services 29% 71% 0% 0% 7
Accountancy 18% 36% 36% 9% 11
Insurance 0% 80% 10% 10% 10
Manufacturing 22% 56% 22% 0% 9
Utilities * * * * 1
Other 17% 58% 8% 17% 12
Totals 20% 51% 13% 16% 241
7%
13%
51%
11%
2%
16%
Very positive
Quite positive
Neither positive or negative
Quite negative
Very negative
Don't know/No opinion
38
* Only 1 of the utilities responded to this question so the results have been omitted
For businesses in the finance industry as a whole, 16% felt that current EU regulation and legislation has
a positive impact on their business, compared to 20% that felt it has a negative impact. For those
businesses outside of the finance industry, 22% felt that current EU regulation and legislation is positive
and 10% felt that it is negative for their business.
Although based upon small sample sizes, the most positive business sectors with regard to current EU
legislation were fishing, hotels and tourist accommodation, information and communication services,
legal services and private health. The most negative business sectors were fund administration,
agriculture and accountancy.
Which elements of current EU regulation and legislation, if any, are positive for your business? Current EU regulation and legislation would appear to contain many elements which impact on Jersey
either directly or indirectly, with Jersey choosing to adopt standards and requirements either at the same
level or similar to those required by the EU. This achieves a harmonisation and consistency which at
times can be onerous, but provides clarity on the required standards and helps the Island to maintain its
reputation and ability to trade effectively; particularly for the financial services sector, but also across
other types of business, particularly if they are involved in exporting.
Again reflecting responses within the previous section, by far the most positive legislation for Jersey
businesses concerned the free movement of people and labour within the EU, notably within those
sectors that employ a large number of EU nationals, but also across most other industry sectors.
The main, categorised benefits in order of prevalence were as follows: 1) Free movement of people/labour and the ability to employ EU nationals.
2) Customs Union, the single market, free trade and access to EU markets for exports.
3) General regulations ensuring conformity, consistency, common standards and quality assurances
which are good for the Island’s reputation and credibility.
4) AML standards and the 4th AML Directive for the finance industry.
5) ‘Passporting’ within the finance industry.
6) Fund regulation and AIFMD within the finance industry.
7) Regulation regarding food safety and hygiene standards.
8) Data regulation and GDPR.
9) Health and safety regulations.
10) Telecoms regulation and roaming charges.
11) Competition laws.
The following all had single mentions: Capital Markets Directive, Solvency II Directive, Insurance Mediation Directive, Markets in Financial
Instruments Directive, Undertaking Collective Investment Scheme Directive, Biosecurity, Community
Design Right, EU patents laws, Product certification, PDO protection scheme, Common agricultural and
fisheries policy, Airline regulations, EU package holiday directives, Human rights laws, Common
Reporting Standards.
39
Which elements of current EU regulation and legislation, if any, are negative for your business? There were fewer responses to this open-ended question than the previous question asking about
positive EU legislation, and there was no specific aspect that came out as obviously the most negative.
The main, categorised negatives in order of prevalence were as follows: 1) Generally too much regulation / red tape.
2) Any barriers and regulations impacting upon imports, including taxes.
3) Data regulation, including the new GDPR.
4) Regulation surrounding AIFMD for the finance industry.
5) Employment legislation.
6) General propensity of financial services regulation (quantity and complexity).
7) AML Directive and Moneyval monitoring of AML.
8) MIFID II Markets in Financial Instruments Directive.
9) Quota allocations (for fishing industry).
10) Fishing regulations generally.
11) QROPS and pensions legislation.
12) Fund passporting legislation.
13) Common Reporting Standards.
The following all had single mentions: Mandatory audit firm rotation, food specifications, CRD IV (Capital Requirements Directive), Working
Time Directive, tax regulation, BEPS (Base Erosion and Profit Shifting), health and safety regulation,
waste recycling legislation, artists resale rights, legislation on the movement of antique ivory, legislation
on roaming prices, legislation impacting being able to pass on card charges, Article 50 itself.
Are there any barriers currently restricting your business’s growth into EU markets and, if so, what are they?
The vast majority of the respondents replied to this question saying that there were no barriers. For those
that considered there to be barriers, some of these related to Island policies and structures rather than
restrictive EU legislation. The main barriers, categorised in order of prevalence were as follows: 1) Attitudes toward and negative reputation of Jersey for some countries (tax haven / blacklisting).
2) Restrictions on passporting of funds under AIFMD.
3) Lack of transport links and unreliable ferry services.
4) Transport costs from Jersey for exporting.
5) French bureaucracy and customs regulation/practices.
6) Company or group strategy preventing expansion into EU markets.
7) The currency exchange rate.
8) Lack of EU tax treaty/agreements.
9) Local employment laws and staff licensing.
40
The following all had single mentions: Lack of double taxation treaties, uncertainties regarding tax structures in Jersey, more acceptance of
trusts, conduits for investment sales to UK nationals living in the EU, lack of common currency, GST,
MIFID II, language barriers, European employment law.
Are there any barriers currently restricting your business’s growth into markets outside of the EU and, if so, what are they?
Again, the majority of the respondents replied to this question saying that there were no barriers for
expanding beyond the EU, with many of the same barriers for expansion into the EU also being relevant
to expansion elsewhere. The main barriers were actually related to company policy and risk rather than
external factors.
The main barriers, categorised in order of prevalence were as follows: 1) Company focus, strategy or policy.
2) The higher risk and compliance resource required for expansion beyond the EU.
3) Cross border legislation and regulatory requirements.
4) Lack of direct transport links and associated travel time.
5) Local employment legislation in Jersey and staff licensing.
6) Transport costs.
7) Visa restrictions.
8) Currency and exchange rate fluctuations.
9) Global economic and political issues.
The following all had single mentions: The cost of doing business in Jersey, Jersey’s position with regard to DEFRA, Jersey’s reputation as a
tax haven, AQSIQ approval for exports to China, lack of international tax treaties, UK’s exclusion to
Schengen Agreement, individual country laws surrounding protection and inheritance of assets.
41
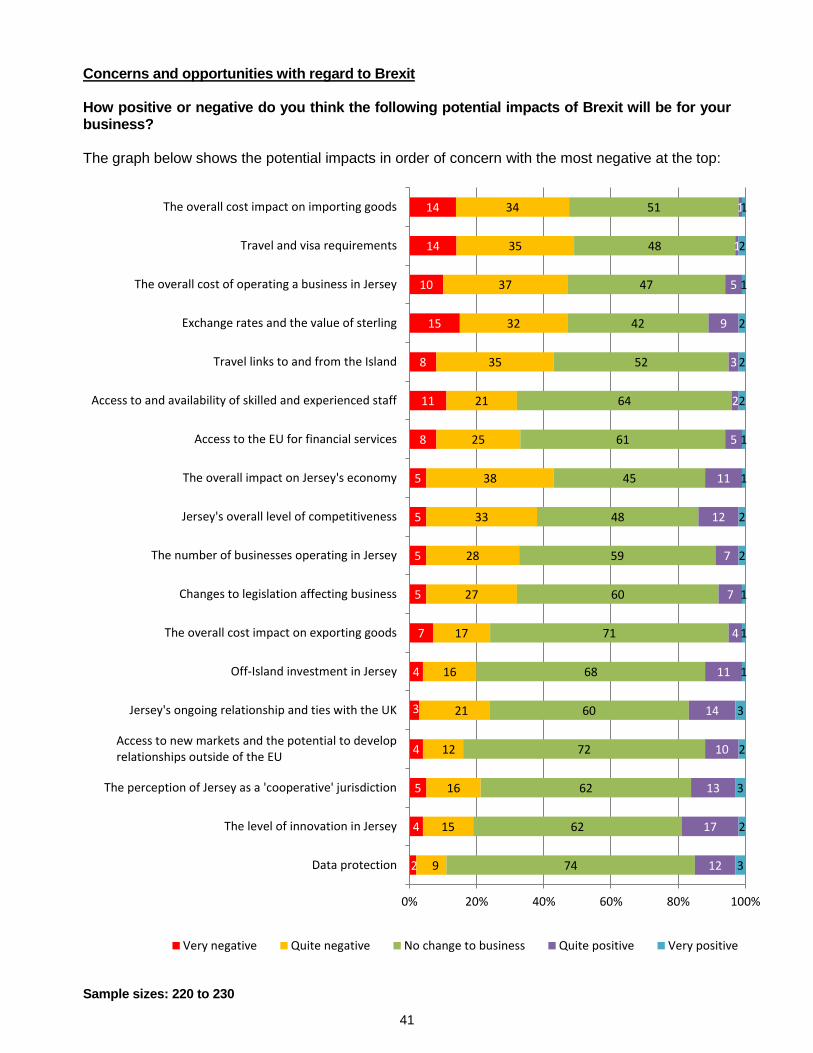
Concerns and opportunities with regard to Brexit How positive or negative do you think the following potential impacts of Brexit will be for your business? The graph below shows the potential impacts in order of concern with the most negative at the top:
Sample sizes: 220 to 230
2
4
5
4
3
4
7
5
5
5
5
8
11
8
15
10
14
14
9
15
16
12
21
16
17
27
28
33
38
25
21
35
32
37
35
34
74
62
62
72
60
68
71
60
59
48
45
61
64
52
42
47
48
51
12
17
13
10
14
11
4
7
7
12
11
5
2
3
9
5
1
1
3
2
3
2
3
1
1
1
2
2
1
1
2
2
2
1
2
1
Data protection
The level of innovation in Jersey
The perception of Jersey as a 'cooperative' jurisdiction
Access to new markets and the potential to developrelationships outside of the EU
Jersey's ongoing relationship and ties with the UK
Off-Island investment in Jersey
The overall cost impact on exporting goods
Changes to legislation affecting business
The number of businesses operating in Jersey
Jersey's overall level of competitiveness
The overall impact on Jersey's economy
Access to the EU for financial services
Access to and availability of skilled and experienced staff
Travel links to and from the Island
Exchange rates and the value of sterling
The overall cost of operating a business in Jersey
Travel and visa requirements
The overall cost impact on importing goods
0% 20% 40% 60% 80% 100%
Very negative Quite negative No change to business Quite positive Very positive
42
For all of the above, apart from data protection at the bottom of the graph, there was a higher proportion
of respondents who believed there would be a negative rather than positive impact of Brexit for their
business.
The primary concerns relate in some way to potentially higher costs to businesses following Brexit, as
well as the impacts on travel. At the next level, the concerns relate to access to and availability of skilled
and experienced staff, access to the EU for financial services and the overall impact on Jersey’s
economy, its competitiveness and the number of businesses in the Island.
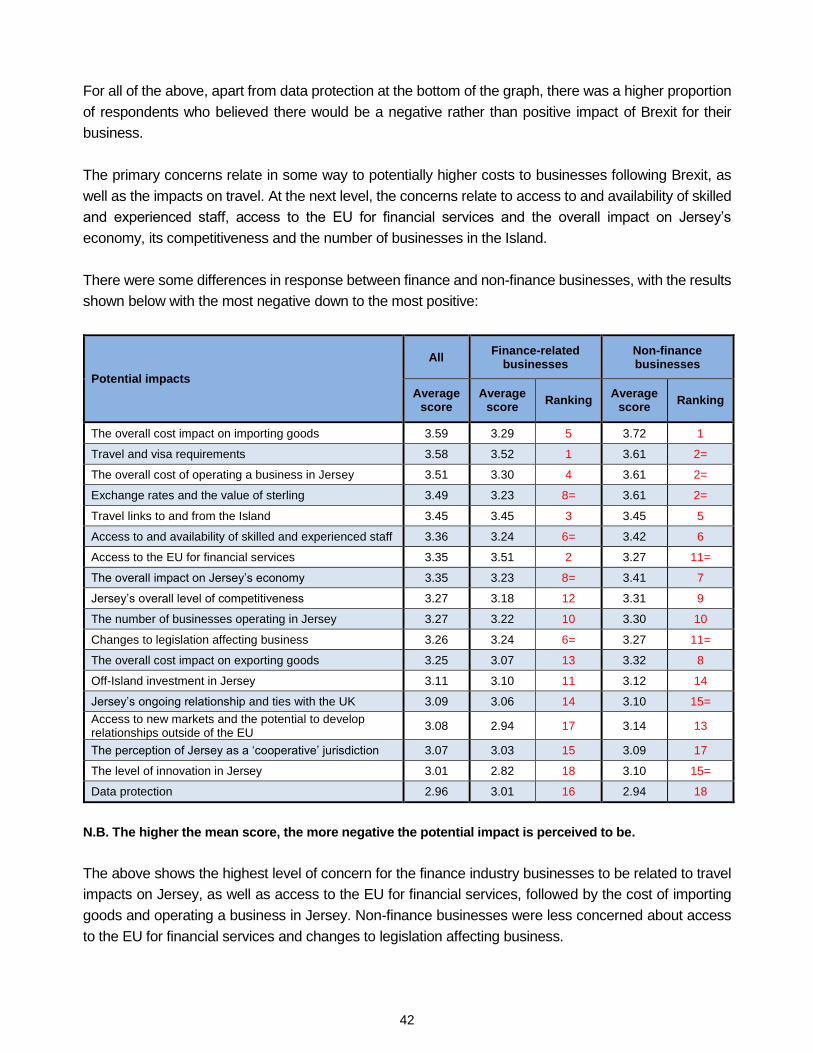
There were some differences in response between finance and non-finance businesses, with the results
shown below with the most negative down to the most positive:
Potential impacts
All Finance-related
businesses Non-finance businesses
Average score
Average score
Ranking Average
score Ranking
The overall cost impact on importing goods 3.59 3.29 5 3.72 1
Travel and visa requirements 3.58 3.52 1 3.61 2=
The overall cost of operating a business in Jersey 3.51 3.30 4 3.61 2=
Exchange rates and the value of sterling 3.49 3.23 8= 3.61 2=
Travel links to and from the Island 3.45 3.45 3 3.45 5
Access to and availability of skilled and experienced staff 3.36 3.24 6= 3.42 6
Access to the EU for financial services 3.35 3.51 2 3.27 11=
The overall impact on Jersey’s economy 3.35 3.23 8= 3.41 7
Jersey’s overall level of competitiveness 3.27 3.18 12 3.31 9
The number of businesses operating in Jersey 3.27 3.22 10 3.30 10
Changes to legislation affecting business 3.26 3.24 6= 3.27 11=
The overall cost impact on exporting goods 3.25 3.07 13 3.32 8
Off-Island investment in Jersey 3.11 3.10 11 3.12 14
Jersey’s ongoing relationship and ties with the UK 3.09 3.06 14 3.10 15=
Access to new markets and the potential to develop relationships outside of the EU
3.08 2.94 17 3.14 13
The perception of Jersey as a ‘cooperative’ jurisdiction 3.07 3.03 15 3.09 17
The level of innovation in Jersey 3.01 2.82 18 3.10 15=
Data protection 2.96 3.01 16 2.94 18
N.B. The higher the mean score, the more negative the potential impact is perceived to be.
The above shows the highest level of concern for the finance industry businesses to be related to travel
impacts on Jersey, as well as access to the EU for financial services, followed by the cost of importing
goods and operating a business in Jersey. Non-finance businesses were less concerned about access
to the EU for financial services and changes to legislation affecting business.

43
What other concerns do you have with regard to the potential negative implications of Brexit on your business?
Many of the concerns expressed in response to this subsequent open-ended question reiterated
concerns put forward in the previous pre-coded question, particularly relating to the impact on costs and
subsequent price increases.
The main additional concerns expressed in order of importance were as follows: 1) Currency devaluation and Brexit impacting upon cost of imports and general price increases.
2) Fall in business confidence due to ongoing uncertainty and status of Jersey.
3) Availability and cost of labour, again related to the fall in sterling making Jersey less attractive.
4) Resultant impact on UK and Jersey economies leading to potential fall in demand and stagnation.
5) Potential export regulations introduced – trade and tariff barriers.
6) Impact on offshore jurisdictions with blacklisting potential after Brexit.
7) Loss of freedom of movement having an impact on visitors to Jersey.
8) Impacts on the ease and cost of travel.
9) The threat of the UK or City of London becoming a competitor to Jersey in terms of tax and duties.
10) General concern about the value of the pound and exchange rates.
11) The movement of financial services out of the City of London having a knock-on impact on Jersey.
12) A general impact on importing and subsequently having to buy British.
The following all had single mentions: Erosion of Jersey’s niche in various markets, anti-British sentiment within the EU, import taxes being
introduced for fishing, loss of access to fishing grounds, potential blocking of fish exports, telecoms
interworking difficulties, impact on trade relationships, changes to fund regulations, Jersey becoming a
bargaining chip and forced to change corporate tax system, decline in quality standards, the impact on
GDPR, detrimental impact on Jersey’s relationship with the UK.
What other opportunities do you think Brexit could present for your business in Jersey? There were far fewer responses to this open-ended question, with a large number of respondents
replying ‘none’. The main additional perceived opportunities, in order of mentions, were as follows:
1) More visitors to Jersey both from the UK and the EU due to both the weakness of sterling and the
image of Jersey (not being perceived as UK or Europe / ‘Staycation’).
2) Improved freedom to trade elsewhere and set up direct trade deals, together with reviews of
business strategy could expose new opportunities and growth markets.
3) More wealthy individuals, businesses and hedge funds may move to Jersey from the UK.
4) The potential to enhance connections with the EU and capture business from London.
5) Improvements for the fishing industry – fishing rights and higher stock levels.
6) The exchange rate making imports more expensive could lead to greater local purchasing.
7) The low value of sterling making exports from Jersey more attractive.
44
The following all had single mentions:
Access to the EU while sitting outside the EU, increase in clients coming for advice due to Brexit,
restructuring opportunities, removal of customs tariff for imported World goods, digital and internet-based
businesses less restricted by borders, potential success of financial services will have a knock-on impact
for other sectors, closer association with the EU rather than follow the UK, opportunities for offshore fund
management, stress-related illness associated with Brexit will increase demand for private health
services, legislation could become more flexible and dynamic, more flexible relationship with the UK,
strengthened ties with the UK, opportunity to promote Jersey’s political and legal stability.
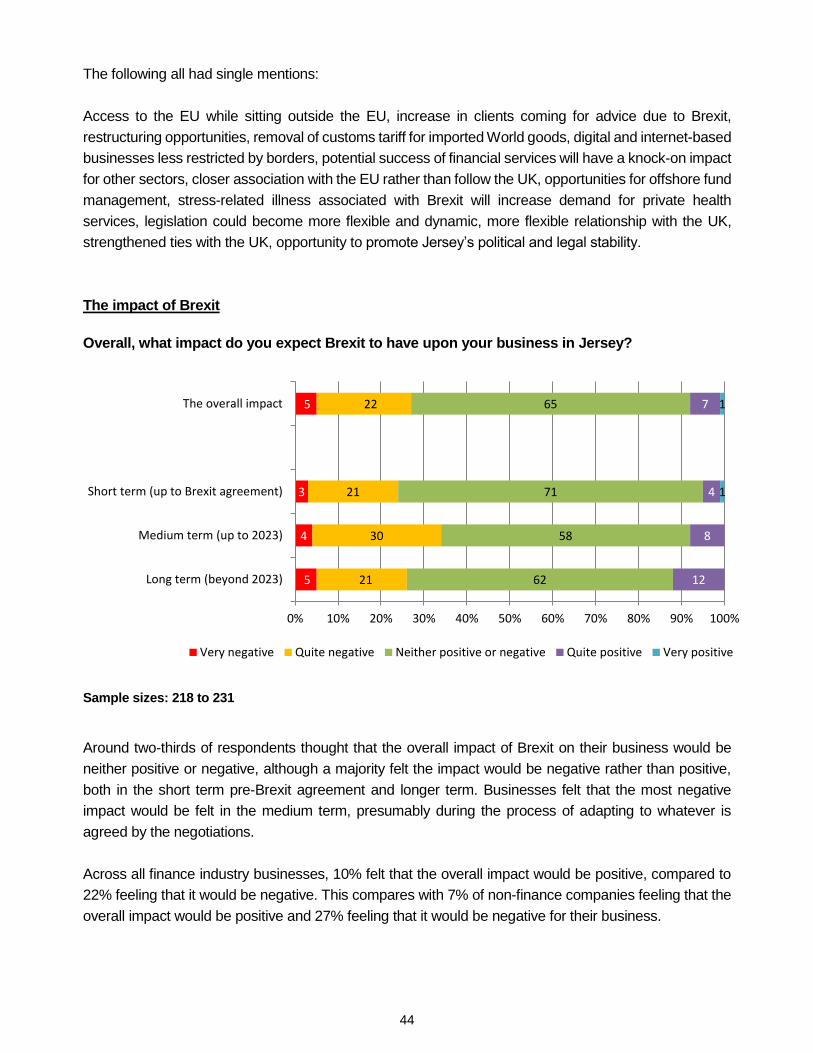
The impact of Brexit
Overall, what impact do you expect Brexit to have upon your business in Jersey?
Sample sizes: 218 to 231
Around two-thirds of respondents thought that the overall impact of Brexit on their business would be
neither positive or negative, although a majority felt the impact would be negative rather than positive,
both in the short term pre-Brexit agreement and longer term. Businesses felt that the most negative
impact would be felt in the medium term, presumably during the process of adapting to whatever is
agreed by the negotiations.
Across all finance industry businesses, 10% felt that the overall impact would be positive, compared to
22% feeling that it would be negative. This compares with 7% of non-finance companies feeling that the
overall impact would be positive and 27% feeling that it would be negative for their business.
5
4
3
5
21
30
21
22
62
58
71
65
12
8
4
7
1
1
Long term (beyond 2023)
Medium term (up to 2023)
Short term (up to Brexit agreement)
The overall impact
0% 10% 20% 30% 40% 50% 60% 70% 80% 90% 100%
Very negative Quite negative Neither positive or negative Quite positive Very positive

45
Overall impact of Brexit by industry sector:
Industry Sector Positive Neither
positive or negative
Negative Respondents
Agriculture 0% 64% 36% 11
Fishing 25% 0% 75% 4
Construction and Tradesmen 5% 70% 25% 20
Wholesale and retail 6% 59% 35% 17
Hotels and other tourist accommodation 24% 47% 29% 17
Restaurants, bars and clubs 0% 63% 37% 8
Education 13% 75% 13% 8
Health 0% 86% 14% 14
Transport and storage 0% 57% 43% 14
Information and communication services 0% 87% 13% 16
Banking 0% 73% 27% 11
Trust and company administration 15% 70% 15% 20
Fund administration and management 11% 44% 44% 9
Legal services 14% 57% 29% 7
Accountancy 20% 60% 20% 11
Insurance 0% 90% 10% 10
Manufacturing 11% 56% 33% 9
Utilities * * * 1
Other 8% 67% 25% 12
Totals 8% 65% 27% 218
* Only 1 of the utilities responded to this question so the results have been omitted
For nearly all of the individual industry sectors shown above, the majority of respondents felt that Brexit
would have neither a positive or negative impact on their business. However, there was also a larger
proportion within most industry sectors that felt that the overall impact of Brexit would be negative rather
than positive, and for 7 of the industry sectors shown above there were no respondents feeling that the
impact would be positive.

46
Potential regions of growth prior and subsequent to the EU referendum vote:
Sample sizes: Pre - 229 and Post - 227
For ‘Elsewhere’, the other regions mentioned were Australia/New Zealand, India and Latin America. As can be seen above, there was little difference between pre- and post-referendum vote in terms of
potential growth regions, apart from within the EU which came down from 29% to 19%.
4%
4%
11%
10%
12%
12%
13%
12%
13%
14%
11%
11%
19%
29%
7%
8%
33%
36%
26%
27%
64%
68%
0% 20% 40% 60% 80% 100%
Post
Prior
Post
Prior
Post
Prior
Post
Prior
Post
Prior
Post
Prior
Post
Prior
Post
Prior
Post
Prior
Post
Prior
Post
PriorEl
seh
we
reA
fric
aA
sia
No
rth
Am
eric
aM
idd
leEa
st
Oth
erEu
rop
eo
uts
ide
EUR
est
of
EUIs
le o
f M
anTh
e U
KO
ther
CI
Jers
ey(g
row
loca
lb
usi
nes
s)
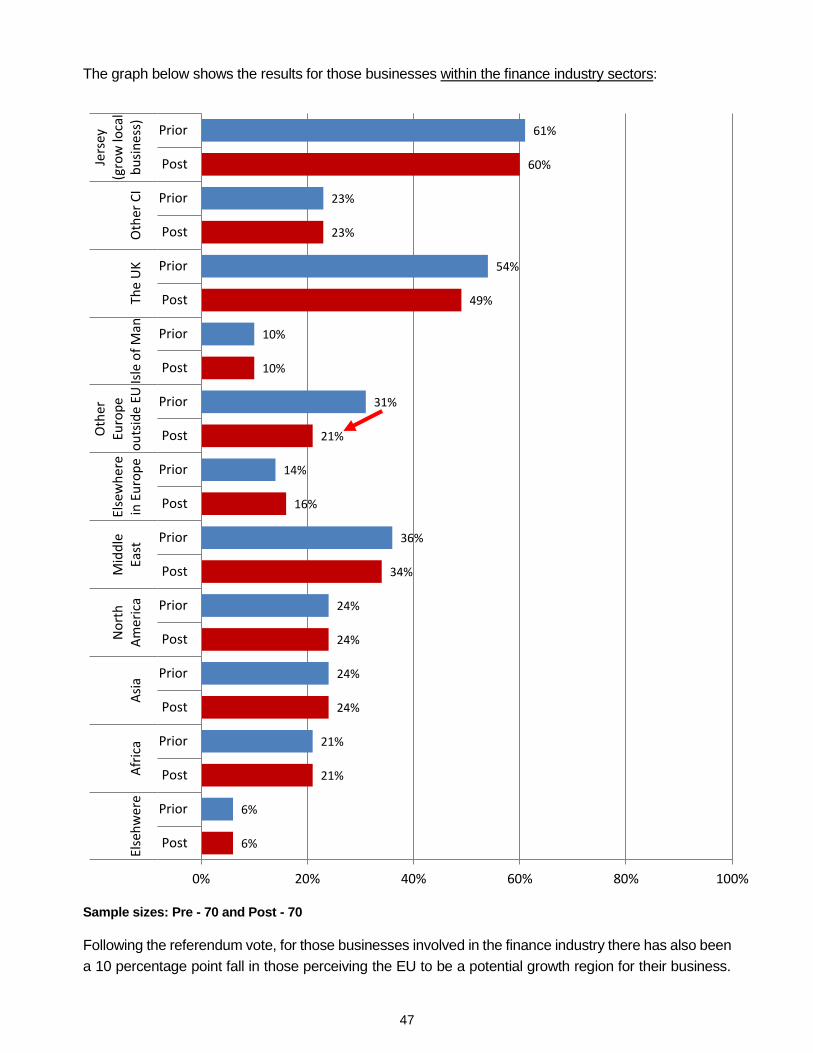
47
The graph below shows the results for those businesses within the finance industry sectors:
Sample sizes: Pre - 70 and Post - 70
Following the referendum vote, for those businesses involved in the finance industry there has also been
a 10 percentage point fall in those perceiving the EU to be a potential growth region for their business.
6%
6%
21%
21%
24%
24%
24%
24%
34%
36%
16%
14%
21%
31%
10%
10%
49%
54%
23%
23%
60%
61%
0% 20% 40% 60% 80% 100%
Post
Prior
Post
Prior
Post
Prior
Post
Prior
Post
Prior
Post
Prior
Post
Prior
Post
Prior
Post
Prior
Post
Prior
Post
PriorEl
seh
we
reA
fric
aA
sia
No
rth
Am
eric
aM
idd
leEa
stEl
sew
her
ein
Eu
rop
e
Oth
erEu
rop
eo
uts
ide
EUIs
le o
f M
anTh
e U
KO
ther
CI
Jers
ey(g
row
loca
lb
usi
nes
s)

48
Other regions have remained at a similar level in terms of perceived potential growth, although there has
also been a 5 percentage point drop for the UK.
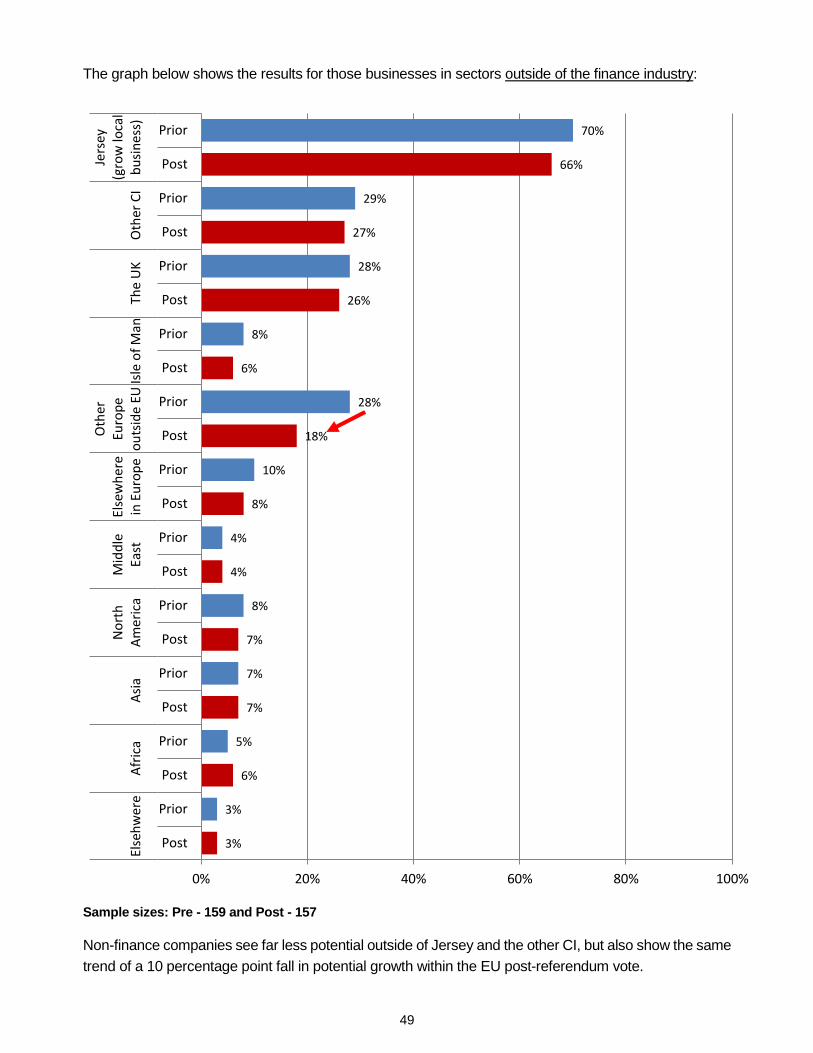
49
The graph below shows the results for those businesses in sectors outside of the finance industry:
Sample sizes: Pre - 159 and Post - 157
Non-finance companies see far less potential outside of Jersey and the other CI, but also show the same
trend of a 10 percentage point fall in potential growth within the EU post-referendum vote.
3%
3%
6%
5%
7%
7%
7%
8%
4%
4%
8%
10%
18%
28%
6%
8%
26%
28%
27%
29%
66%
70%
0% 20% 40% 60% 80% 100%
Post
Prior
Post
Prior
Post
Prior
Post
Prior
Post
Prior
Post
Prior
Post
Prior
Post
Prior
Post
Prior
Post
Prior
Post
PriorEl
seh
we
reA
fric
aA
sia
No
rth
Am
eric
aM
idd
leEa
stEl
sew
her
ein
Eu
rop
e
Oth
erEu
rop
eo
uts
ide
EUIs
le o
f M
anTh
e U
KO
ther
CI
Jers
ey(g
row
loca
lb
usi
nes
s)
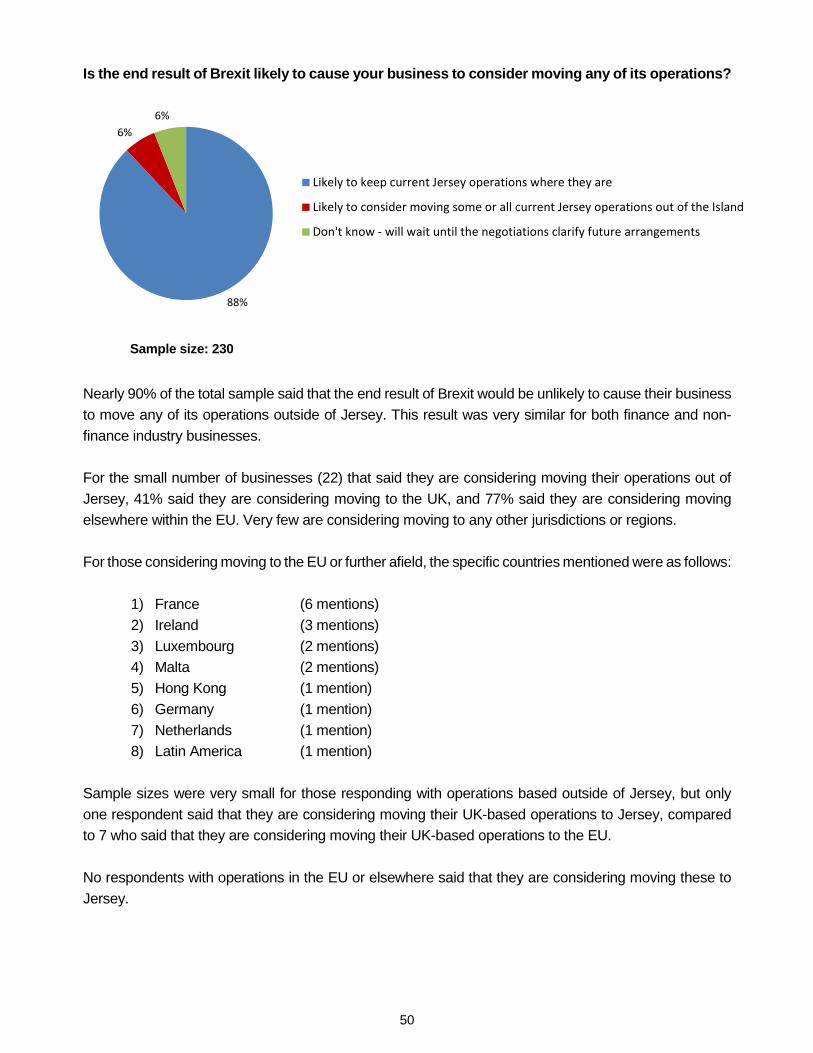
50
Is the end result of Brexit likely to cause your business to consider moving any of its operations?
Sample size: 230
Nearly 90% of the total sample said that the end result of Brexit would be unlikely to cause their business
to move any of its operations outside of Jersey. This result was very similar for both finance and non-
finance industry businesses.
For the small number of businesses (22) that said they are considering moving their operations out of
Jersey, 41% said they are considering moving to the UK, and 77% said they are considering moving
elsewhere within the EU. Very few are considering moving to any other jurisdictions or regions.
For those considering moving to the EU or further afield, the specific countries mentioned were as follows:
1) France (6 mentions)
2) Ireland (3 mentions)
3) Luxembourg (2 mentions)
4) Malta (2 mentions)
5) Hong Kong (1 mention)
6) Germany (1 mention)
7) Netherlands (1 mention)
8) Latin America (1 mention)
Sample sizes were very small for those responding with operations based outside of Jersey, but only
one respondent said that they are considering moving their UK-based operations to Jersey, compared
to 7 who said that they are considering moving their UK-based operations to the EU.
No respondents with operations in the EU or elsewhere said that they are considering moving these to
Jersey.
88%
6%
6%
Likely to keep current Jersey operations where they are
Likely to consider moving some or all current Jersey operations out of the Island
Don't know - will wait until the negotiations clarify future arrangements
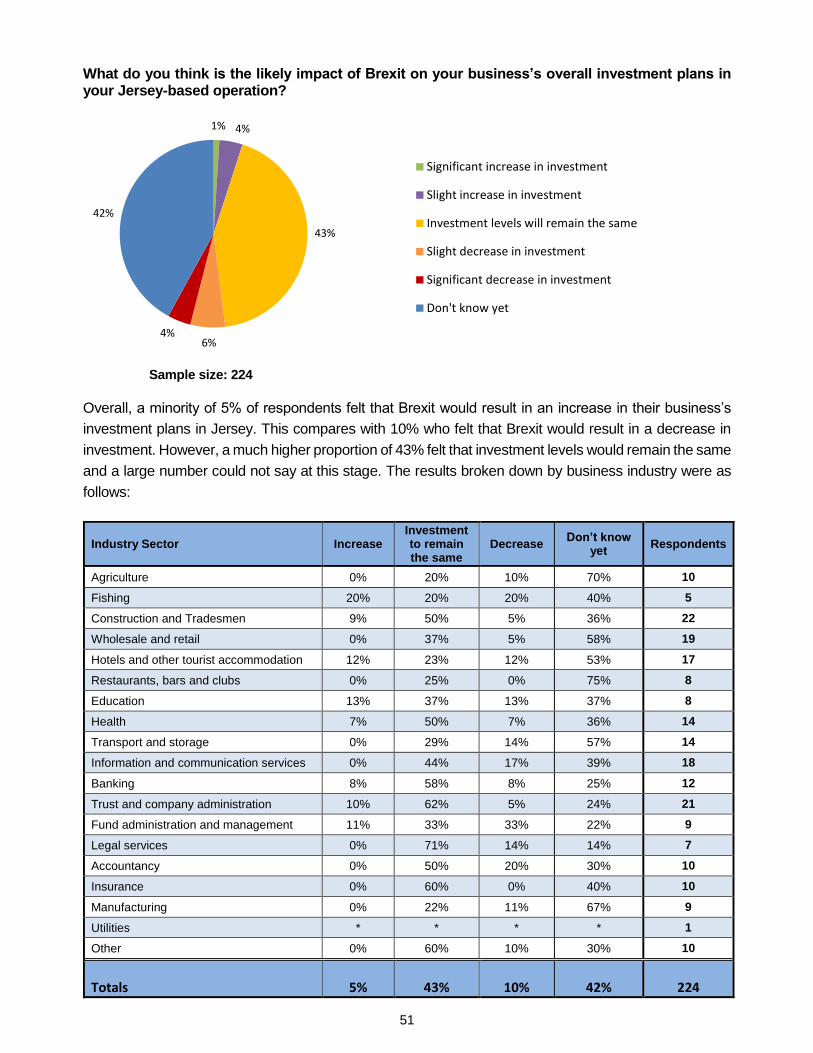
51
What do you think is the likely impact of Brexit on your business’s overall investment plans in your Jersey-based operation?
Sample size: 224
Overall, a minority of 5% of respondents felt that Brexit would result in an increase in their business’s
investment plans in Jersey. This compares with 10% who felt that Brexit would result in a decrease in
investment. However, a much higher proportion of 43% felt that investment levels would remain the same
and a large number could not say at this stage. The results broken down by business industry were as
follows:
Industry Sector Increase Investment to remain the same
Decrease Don’t know
yet Respondents
Agriculture 0% 20% 10% 70% 10
Fishing 20% 20% 20% 40% 5
Construction and Tradesmen 9% 50% 5% 36% 22
Wholesale and retail 0% 37% 5% 58% 19
Hotels and other tourist accommodation 12% 23% 12% 53% 17
Restaurants, bars and clubs 0% 25% 0% 75% 8
Education 13% 37% 13% 37% 8
Health 7% 50% 7% 36% 14
Transport and storage 0% 29% 14% 57% 14
Information and communication services 0% 44% 17% 39% 18
Banking 8% 58% 8% 25% 12
Trust and company administration 10% 62% 5% 24% 21
Fund administration and management 11% 33% 33% 22% 9
Legal services 0% 71% 14% 14% 7
Accountancy 0% 50% 20% 30% 10
Insurance 0% 60% 0% 40% 10
Manufacturing 0% 22% 11% 67% 9
Utilities * * * * 1
Other 0% 60% 10% 30% 10
Totals 5% 43% 10% 42% 224
1% 4%
43%
6%4%
42%
Significant increase in investment
Slight increase in investment
Investment levels will remain the same
Slight decrease in investment
Significant decrease in investment
Don't know yet
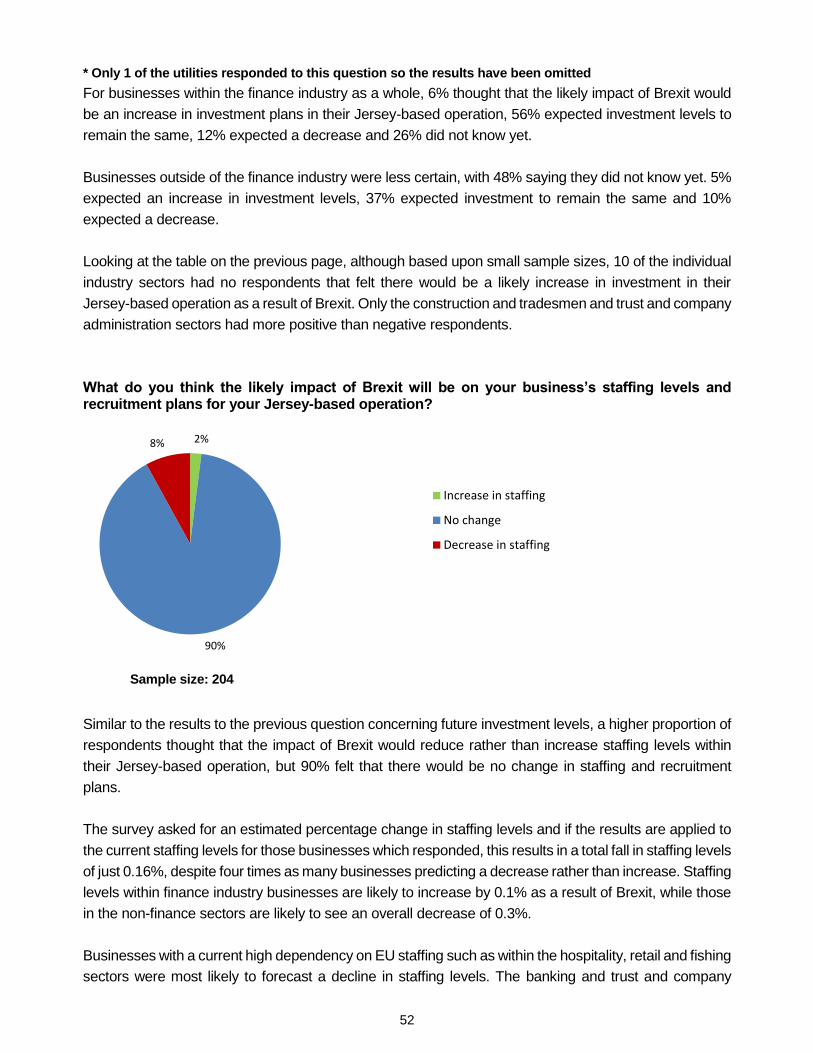
52
* Only 1 of the utilities responded to this question so the results have been omitted
For businesses within the finance industry as a whole, 6% thought that the likely impact of Brexit would
be an increase in investment plans in their Jersey-based operation, 56% expected investment levels to
remain the same, 12% expected a decrease and 26% did not know yet.
Businesses outside of the finance industry were less certain, with 48% saying they did not know yet. 5%
expected an increase in investment levels, 37% expected investment to remain the same and 10%
expected a decrease.
Looking at the table on the previous page, although based upon small sample sizes, 10 of the individual
industry sectors had no respondents that felt there would be a likely increase in investment in their
Jersey-based operation as a result of Brexit. Only the construction and tradesmen and trust and company
administration sectors had more positive than negative respondents.
What do you think the likely impact of Brexit will be on your business’s staffing levels and recruitment plans for your Jersey-based operation?
Sample size: 204
Similar to the results to the previous question concerning future investment levels, a higher proportion of
respondents thought that the impact of Brexit would reduce rather than increase staffing levels within
their Jersey-based operation, but 90% felt that there would be no change in staffing and recruitment
plans.
The survey asked for an estimated percentage change in staffing levels and if the results are applied to
the current staffing levels for those businesses which responded, this results in a total fall in staffing levels
of just 0.16%, despite four times as many businesses predicting a decrease rather than increase. Staffing
levels within finance industry businesses are likely to increase by 0.1% as a result of Brexit, while those
in the non-finance sectors are likely to see an overall decrease of 0.3%.
Businesses with a current high dependency on EU staffing such as within the hospitality, retail and fishing
sectors were most likely to forecast a decline in staffing levels. The banking and trust and company
2%
90%
8%
Increase in staffing
No change
Decrease in staffing

53
administration sectors were the only areas that were more likely to predict an increase rather than
decrease in staffing levels and recruitment plans for their Jersey-based operation.
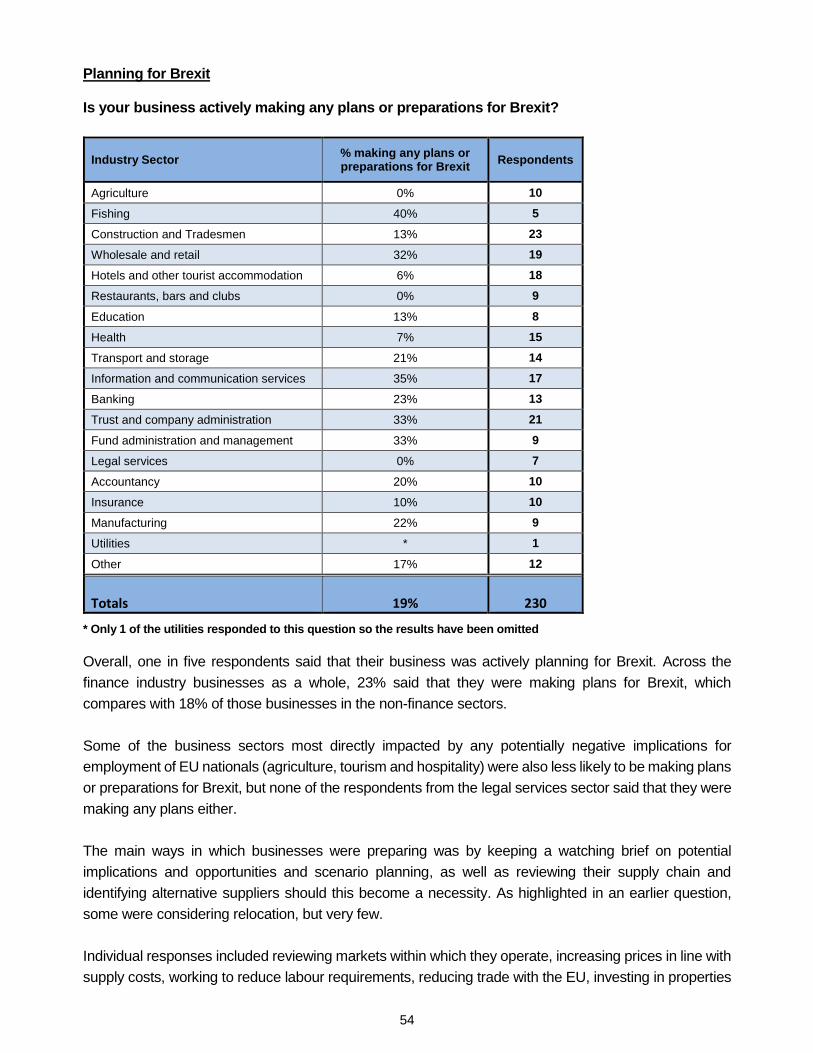
54
Planning for Brexit Is your business actively making any plans or preparations for Brexit?
Industry Sector % making any plans or preparations for Brexit
Respondents
Agriculture 0% 10
Fishing 40% 5
Construction and Tradesmen 13% 23
Wholesale and retail 32% 19
Hotels and other tourist accommodation 6% 18
Restaurants, bars and clubs 0% 9
Education 13% 8
Health 7% 15
Transport and storage 21% 14
Information and communication services 35% 17
Banking 23% 13
Trust and company administration 33% 21
Fund administration and management 33% 9
Legal services 0% 7
Accountancy 20% 10
Insurance 10% 10
Manufacturing 22% 9
Utilities * 1
Other 17% 12
Totals 19% 230 * Only 1 of the utilities responded to this question so the results have been omitted
Overall, one in five respondents said that their business was actively planning for Brexit. Across the
finance industry businesses as a whole, 23% said that they were making plans for Brexit, which
compares with 18% of those businesses in the non-finance sectors.
Some of the business sectors most directly impacted by any potentially negative implications for
employment of EU nationals (agriculture, tourism and hospitality) were also less likely to be making plans
or preparations for Brexit, but none of the respondents from the legal services sector said that they were
making any plans either.
The main ways in which businesses were preparing was by keeping a watching brief on potential
implications and opportunities and scenario planning, as well as reviewing their supply chain and
identifying alternative suppliers should this become a necessity. As highlighted in an earlier question,
some were considering relocation, but very few.
Individual responses included reviewing markets within which they operate, increasing prices in line with
supply costs, working to reduce labour requirements, reducing trade with the EU, investing in properties

55
with good covenants and long leases, phasing in equipment to comply with greater controls, and making
adjustments to products and services to meet anticipated future needs.
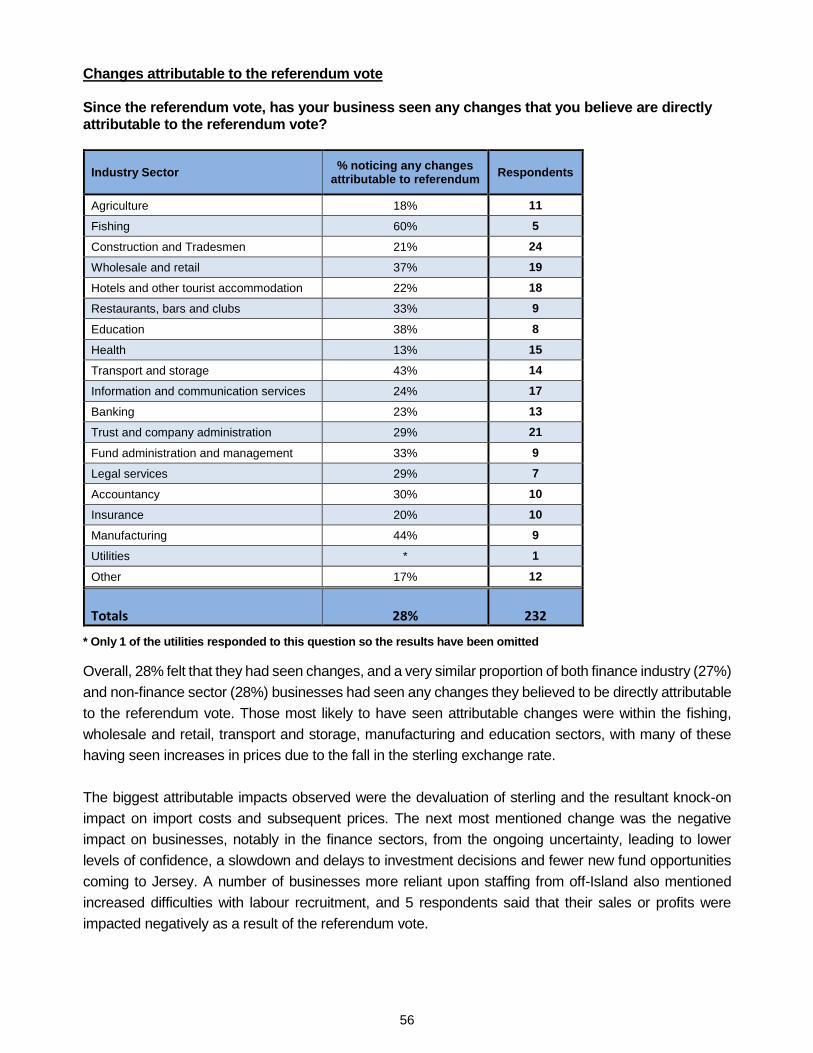
56
Changes attributable to the referendum vote Since the referendum vote, has your business seen any changes that you believe are directly attributable to the referendum vote?
Industry Sector % noticing any changes
attributable to referendum Respondents
Agriculture 18% 11
Fishing 60% 5
Construction and Tradesmen 21% 24
Wholesale and retail 37% 19
Hotels and other tourist accommodation 22% 18
Restaurants, bars and clubs 33% 9
Education 38% 8
Health 13% 15
Transport and storage 43% 14
Information and communication services 24% 17
Banking 23% 13
Trust and company administration 29% 21
Fund administration and management 33% 9
Legal services 29% 7
Accountancy 30% 10
Insurance 20% 10
Manufacturing 44% 9
Utilities * 1
Other 17% 12
Totals 28% 232 * Only 1 of the utilities responded to this question so the results have been omitted
Overall, 28% felt that they had seen changes, and a very similar proportion of both finance industry (27%)
and non-finance sector (28%) businesses had seen any changes they believed to be directly attributable
to the referendum vote. Those most likely to have seen attributable changes were within the fishing,
wholesale and retail, transport and storage, manufacturing and education sectors, with many of these
having seen increases in prices due to the fall in the sterling exchange rate.
The biggest attributable impacts observed were the devaluation of sterling and the resultant knock-on
impact on import costs and subsequent prices. The next most mentioned change was the negative
impact on businesses, notably in the finance sectors, from the ongoing uncertainty, leading to lower
levels of confidence, a slowdown and delays to investment decisions and fewer new fund opportunities
coming to Jersey. A number of businesses more reliant upon staffing from off-Island also mentioned
increased difficulties with labour recruitment, and 5 respondents said that their sales or profits were
impacted negatively as a result of the referendum vote.

57
On the positive side, rising equity markets had led to increased investment dealing and a better return
on investments, and there was also more interest in onshore fund vehicles. The weakness of sterling
had also led to increased visitors to Jersey since the referendum vote.
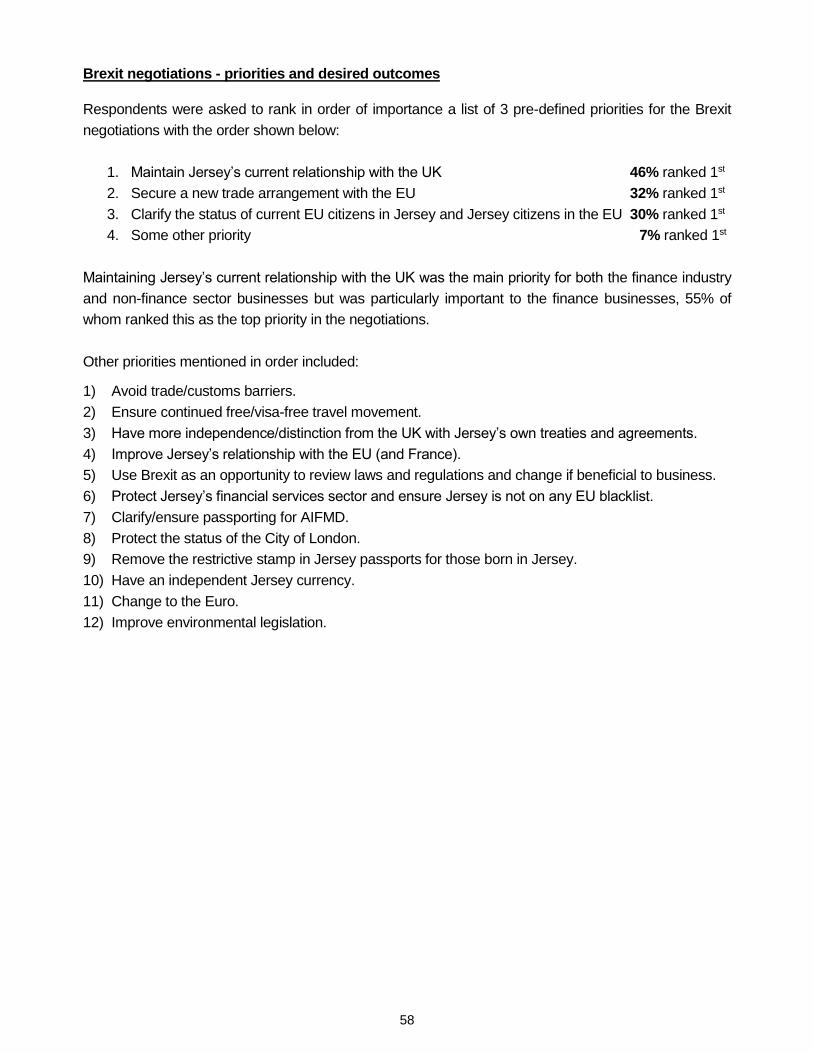
58
Brexit negotiations - priorities and desired outcomes
Respondents were asked to rank in order of importance a list of 3 pre-defined priorities for the Brexit
negotiations with the order shown below:
1. Maintain Jersey’s current relationship with the UK 46% ranked 1st
2. Secure a new trade arrangement with the EU 32% ranked 1st
3. Clarify the status of current EU citizens in Jersey and Jersey citizens in the EU 30% ranked 1st
4. Some other priority 7% ranked 1st
Maintaining Jersey’s current relationship with the UK was the main priority for both the finance industry
and non-finance sector businesses but was particularly important to the finance businesses, 55% of
whom ranked this as the top priority in the negotiations.
Other priorities mentioned in order included: 1) Avoid trade/customs barriers.
2) Ensure continued free/visa-free travel movement.
3) Have more independence/distinction from the UK with Jersey’s own treaties and agreements.
4) Improve Jersey’s relationship with the EU (and France).
5) Use Brexit as an opportunity to review laws and regulations and change if beneficial to business.
6) Protect Jersey’s financial services sector and ensure Jersey is not on any EU blacklist.
7) Clarify/ensure passporting for AIFMD.
8) Protect the status of the City of London.
9) Remove the restrictive stamp in Jersey passports for those born in Jersey.
10) Have an independent Jersey currency.
11) Change to the Euro.
12) Improve environmental legislation.
59
A subsequent question asked what the most desired outcome would be for businesses from the
forthcoming Brexit negotiations and by far the most prominent response was for no change in general,
or to maintain the status quo as far as possible.
Other outcomes are summarised in order of mentions below: 1) Free movement of people and continued access to EU labour alongside a workable immigration
strategy.
2) Securing a new trade arrangement that maintains access and free trade with the EU.
3) Achieve clarity and certainty as soon as possible to move forward and maintain economic stability.
4) Jersey to have more sovereign control, independence and autonomy from both the UK and the EU.
5) Establish stronger links and trading relationships directly with the EU and become less dependent
upon the UK.
6) Maintain the strong relationship between the UK and Jersey.
7) Achieve a ‘soft’ Brexit.
8) City passporting rights to be clarified and retained.
9) Achieve security for the finance industry in Jersey.
10) An increase in the value of sterling.
11) Achieve a reduction in EU legislation, regulation and restrictions.
12) Retain EU citizens currently resident in Jersey.
13) Achieve freedom to negotiate trade deals for Jersey independently with individual countries.
14) An exclusive fishing zone around Jersey with greater power to manage our own fish stocks.
15) No freedom of movement / restrict immigration for EU nationals.
16) Preserve the distinction between the City of London and the Crown Dependencies as domiciles for
financial services.
17) No travel restrictions.
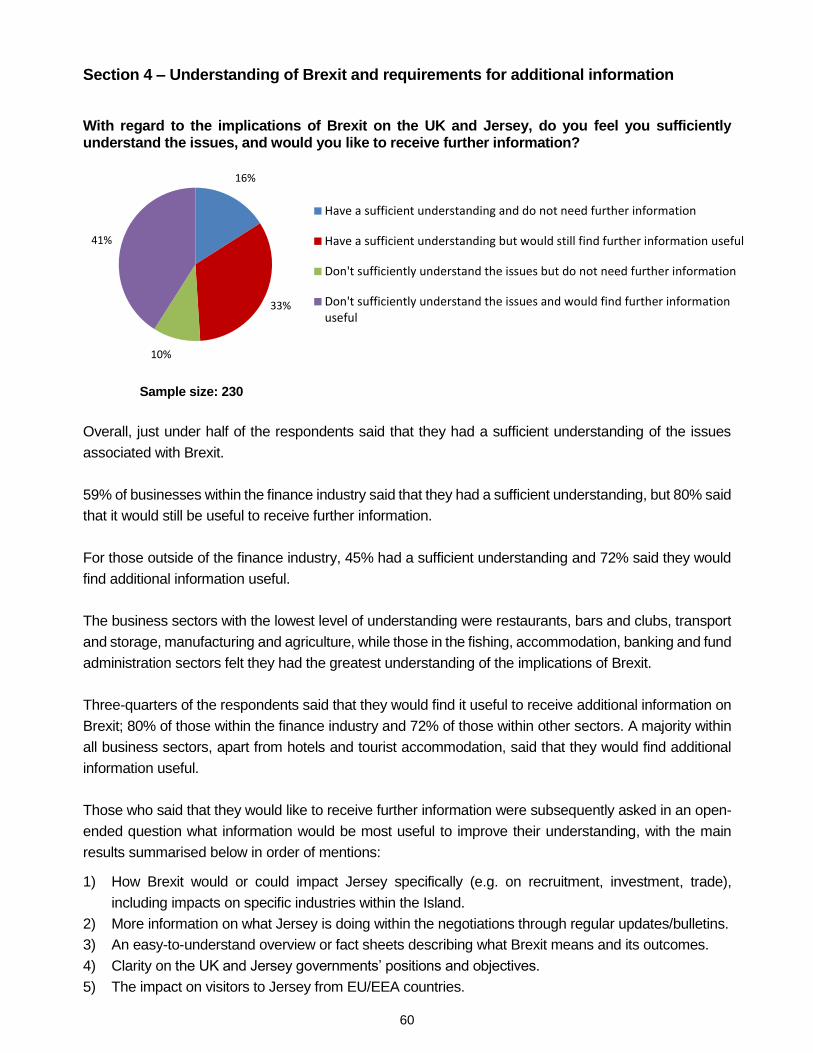
60
Section 4 – Understanding of Brexit and requirements for additional information With regard to the implications of Brexit on the UK and Jersey, do you feel you sufficiently understand the issues, and would you like to receive further information?
Sample size: 230
Overall, just under half of the respondents said that they had a sufficient understanding of the issues
associated with Brexit.
59% of businesses within the finance industry said that they had a sufficient understanding, but 80% said
that it would still be useful to receive further information.
For those outside of the finance industry, 45% had a sufficient understanding and 72% said they would
find additional information useful.
The business sectors with the lowest level of understanding were restaurants, bars and clubs, transport
and storage, manufacturing and agriculture, while those in the fishing, accommodation, banking and fund
administration sectors felt they had the greatest understanding of the implications of Brexit.
Three-quarters of the respondents said that they would find it useful to receive additional information on
Brexit; 80% of those within the finance industry and 72% of those within other sectors. A majority within
all business sectors, apart from hotels and tourist accommodation, said that they would find additional
information useful.
Those who said that they would like to receive further information were subsequently asked in an open-
ended question what information would be most useful to improve their understanding, with the main
results summarised below in order of mentions: 1) How Brexit would or could impact Jersey specifically (e.g. on recruitment, investment, trade),
including impacts on specific industries within the Island.
2) More information on what Jersey is doing within the negotiations through regular updates/bulletins.
3) An easy-to-understand overview or fact sheets describing what Brexit means and its outcomes.
4) Clarity on the UK and Jersey governments’ positions and objectives.
5) The impact on visitors to Jersey from EU/EEA countries.
16%
33%
10%
41%
Have a sufficient understanding and do not need further information
Have a sufficient understanding but would still find further information useful
Don't sufficiently understand the issues but do not need further information
Don't sufficiently understand the issues and would find further informationuseful
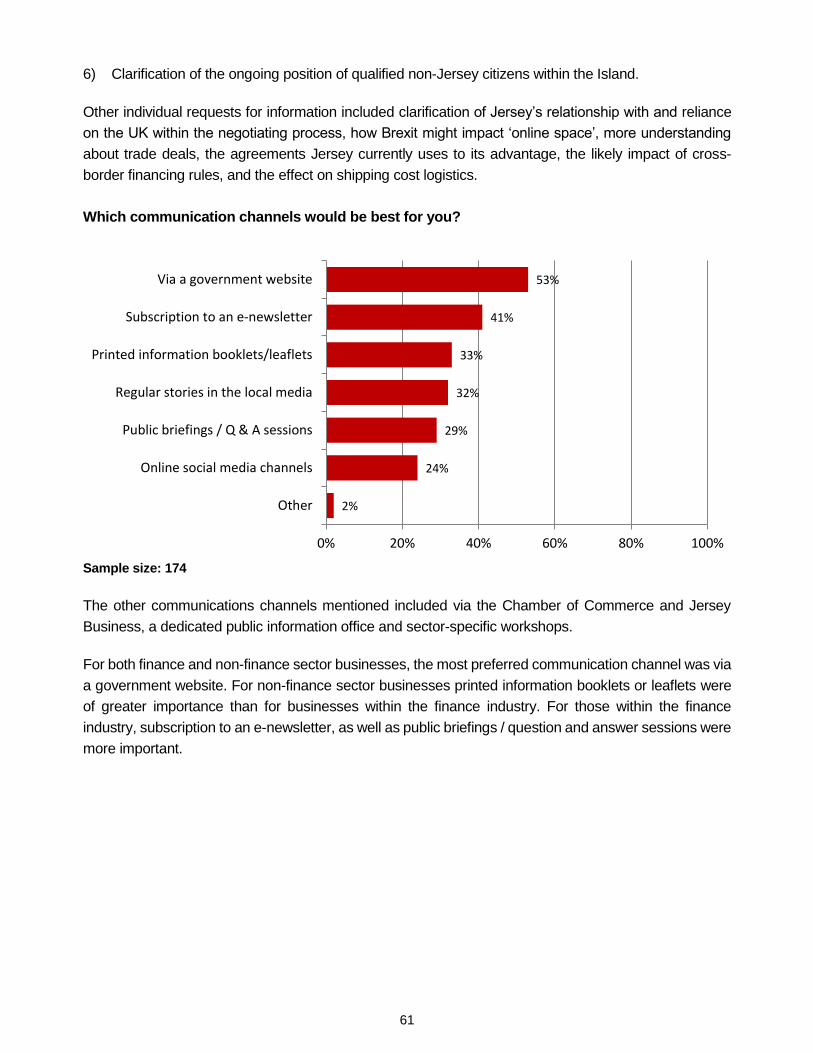
61
6) Clarification of the ongoing position of qualified non-Jersey citizens within the Island.
Other individual requests for information included clarification of Jersey’s relationship with and reliance
on the UK within the negotiating process, how Brexit might impact ‘online space’, more understanding
about trade deals, the agreements Jersey currently uses to its advantage, the likely impact of cross-
border financing rules, and the effect on shipping cost logistics.
Which communication channels would be best for you?
Sample size: 174
The other communications channels mentioned included via the Chamber of Commerce and Jersey
Business, a dedicated public information office and sector-specific workshops.
For both finance and non-finance sector businesses, the most preferred communication channel was via
a government website. For non-finance sector businesses printed information booklets or leaflets were
of greater importance than for businesses within the finance industry. For those within the finance
industry, subscription to an e-newsletter, as well as public briefings / question and answer sessions were
more important.
2%
24%
29%
32%
33%
41%
53%
0% 20% 40% 60% 80% 100%
Other
Online social media channels
Public briefings / Q & A sessions
Regular stories in the local media
Printed information booklets/leaflets
Subscription to an e-newsletter
Via a government website

62
Appendices
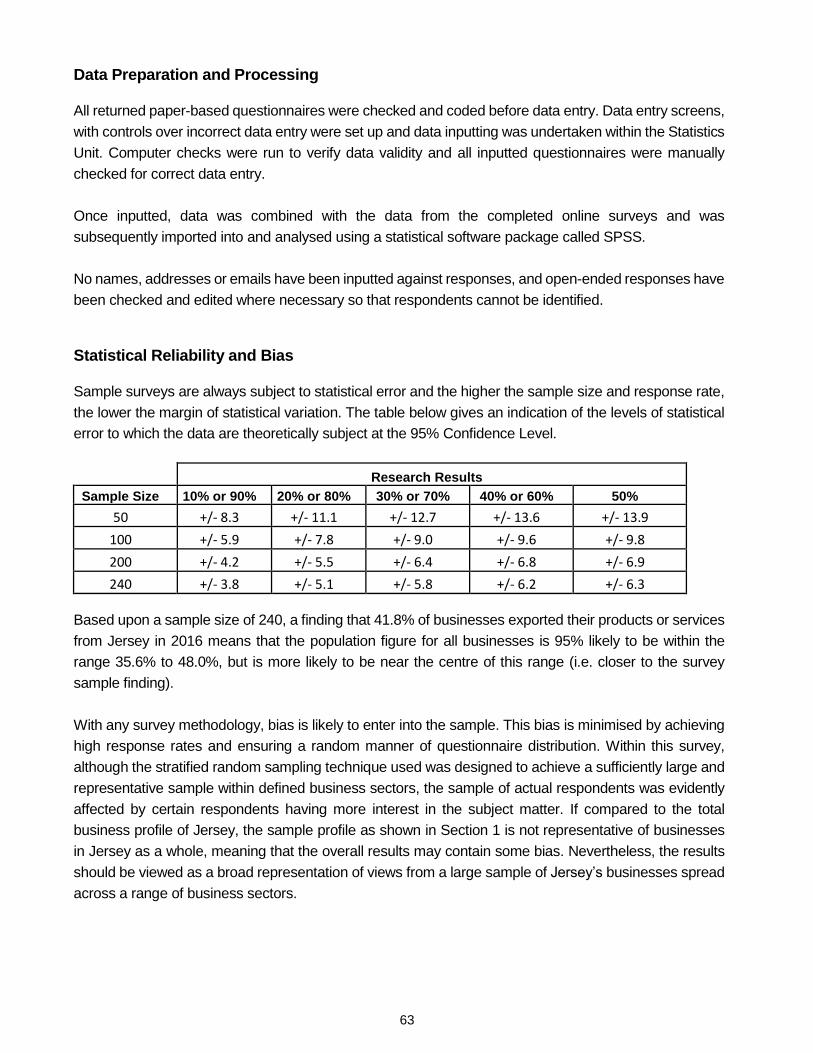
63
Data Preparation and Processing All returned paper-based questionnaires were checked and coded before data entry. Data entry screens,
with controls over incorrect data entry were set up and data inputting was undertaken within the Statistics
Unit. Computer checks were run to verify data validity and all inputted questionnaires were manually
checked for correct data entry.
Once inputted, data was combined with the data from the completed online surveys and was
subsequently imported into and analysed using a statistical software package called SPSS.
No names, addresses or emails have been inputted against responses, and open-ended responses have
been checked and edited where necessary so that respondents cannot be identified.
Statistical Reliability and Bias Sample surveys are always subject to statistical error and the higher the sample size and response rate,
the lower the margin of statistical variation. The table below gives an indication of the levels of statistical
error to which the data are theoretically subject at the 95% Confidence Level.
Research Results
Sample Size 10% or 90% 20% or 80% 30% or 70% 40% or 60% 50%
50 +/- 8.3 +/- 11.1 +/- 12.7 +/- 13.6 +/- 13.9
100 +/- 5.9 +/- 7.8 +/- 9.0 +/- 9.6 +/- 9.8
200 +/- 4.2 +/- 5.5 +/- 6.4 +/- 6.8 +/- 6.9
240 +/- 3.8 +/- 5.1 +/- 5.8 +/- 6.2 +/- 6.3
Based upon a sample size of 240, a finding that 41.8% of businesses exported their products or services
from Jersey in 2016 means that the population figure for all businesses is 95% likely to be within the
range 35.6% to 48.0%, but is more likely to be near the centre of this range (i.e. closer to the survey
sample finding).
With any survey methodology, bias is likely to enter into the sample. This bias is minimised by achieving
high response rates and ensuring a random manner of questionnaire distribution. Within this survey,
although the stratified random sampling technique used was designed to achieve a sufficiently large and
representative sample within defined business sectors, the sample of actual respondents was evidently
affected by certain respondents having more interest in the subject matter. If compared to the total
business profile of Jersey, the sample profile as shown in Section 1 is not representative of businesses
in Jersey as a whole, meaning that the overall results may contain some bias. Nevertheless, the results
should be viewed as a broad representation of views from a large sample of Jersey’s businesses spread
across a range of business sectors.
64
Methodology
In order to attract as large a sample as possible, paper-based and online surveys were used. In order
to achieve sufficient sub-sample sizes that would be representative of businesses within individual
industry sectors, a stratified random sample of 811 businesses was provided by the States Statistics Unit.
The self-completion questionnaires, together with reply-paid return envelopes, were posted out to the
whole sample and the online version of the survey was also sent to all those on the database with an
email address. Response was encouraged through reminder telephone calls and follow-up mailings and
emails.
By the cut-off date at the end of July, 246 questionnaires had been completed; 135 by post and 111
online. Excluding the ‘undeliverables’, this represents a response rate of 31%, which is a fair result for a
questionnaire of this length. While 246 businesses only represents around 3.5% of Jersey’s total number
of private sector undertakings, the number of staff employed within the businesses which did respond
was just over 11,000, which represents 22% of total private sector employment in the Island.
Completion of the survey was also promoted to a broader audience through traditional and online media,
as well as government and trade bodies. This attracted an additional 31 respondents, representing a
further 750 employees.
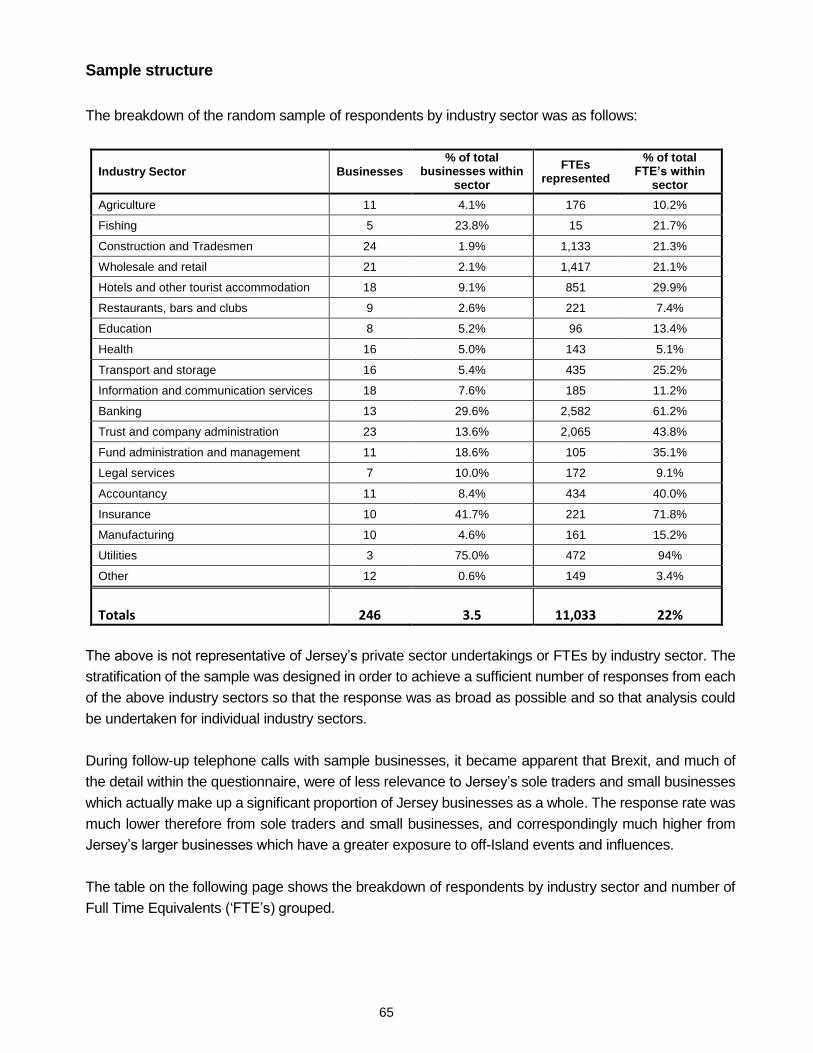
65
Sample structure
The breakdown of the random sample of respondents by industry sector was as follows:
Industry Sector Businesses
% of total businesses within
sector
FTEs represented
% of total FTE’s within
sector
Agriculture 11 4.1% 176 10.2%
Fishing 5 23.8% 15 21.7%
Construction and Tradesmen 24 1.9% 1,133 21.3%
Wholesale and retail 21 2.1% 1,417 21.1%
Hotels and other tourist accommodation 18 9.1% 851 29.9%
Restaurants, bars and clubs 9 2.6% 221 7.4%
Education 8 5.2% 96 13.4%
Health 16 5.0% 143 5.1%
Transport and storage 16 5.4% 435 25.2%
Information and communication services 18 7.6% 185 11.2%
Banking 13 29.6% 2,582 61.2%
Trust and company administration 23 13.6% 2,065 43.8%
Fund administration and management 11 18.6% 105 35.1%
Legal services 7 10.0% 172 9.1%
Accountancy 11 8.4% 434 40.0%
Insurance 10 41.7% 221 71.8%
Manufacturing 10 4.6% 161 15.2%
Utilities 3 75.0% 472 94%
Other 12 0.6% 149 3.4%
Totals 246 3.5 11,033 22%
The above is not representative of Jersey’s private sector undertakings or FTEs by industry sector. The
stratification of the sample was designed in order to achieve a sufficient number of responses from each
of the above industry sectors so that the response was as broad as possible and so that analysis could
be undertaken for individual industry sectors.
During follow-up telephone calls with sample businesses, it became apparent that Brexit, and much of
the detail within the questionnaire, were of less relevance to Jersey’s sole traders and small businesses
which actually make up a significant proportion of Jersey businesses as a whole. The response rate was
much lower therefore from sole traders and small businesses, and correspondingly much higher from
Jersey’s larger businesses which have a greater exposure to off-Island events and influences.
The table on the following page shows the breakdown of respondents by industry sector and number of
Full Time Equivalents (‘FTE’s) grouped.
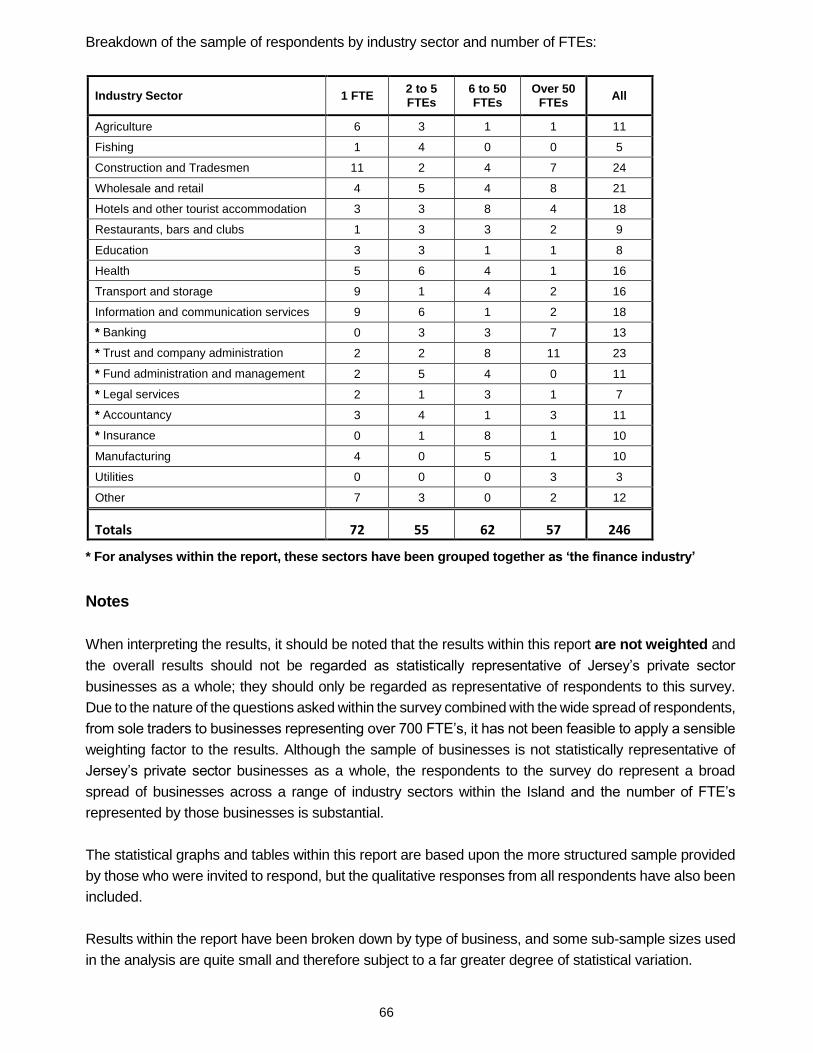
66
Breakdown of the sample of respondents by industry sector and number of FTEs:
Industry Sector 1 FTE 2 to 5 FTEs
6 to 50 FTEs
Over 50 FTEs
All
Agriculture 6 3 1 1 11
Fishing 1 4 0 0 5
Construction and Tradesmen 11 2 4 7 24
Wholesale and retail 4 5 4 8 21
Hotels and other tourist accommodation 3 3 8 4 18
Restaurants, bars and clubs 1 3 3 2 9
Education 3 3 1 1 8
Health 5 6 4 1 16
Transport and storage 9 1 4 2 16
Information and communication services 9 6 1 2 18
* Banking 0 3 3 7 13
* Trust and company administration 2 2 8 11 23
* Fund administration and management 2 5 4 0 11
* Legal services 2 1 3 1 7
* Accountancy 3 4 1 3 11
* Insurance 0 1 8 1 10
Manufacturing 4 0 5 1 10
Utilities 0 0 0 3 3
Other 7 3 0 2 12
Totals 72 55 62 57 246
* For analyses within the report, these sectors have been grouped together as ‘the finance industry’
Notes
When interpreting the results, it should be noted that the results within this report are not weighted and
the overall results should not be regarded as statistically representative of Jersey’s private sector
businesses as a whole; they should only be regarded as representative of respondents to this survey.
Due to the nature of the questions asked within the survey combined with the wide spread of respondents,
from sole traders to businesses representing over 700 FTE’s, it has not been feasible to apply a sensible
weighting factor to the results. Although the sample of businesses is not statistically representative of
Jersey’s private sector businesses as a whole, the respondents to the survey do represent a broad
spread of businesses across a range of industry sectors within the Island and the number of FTE’s
represented by those businesses is substantial.
The statistical graphs and tables within this report are based upon the more structured sample provided
by those who were invited to respond, but the qualitative responses from all respondents have also been
included.
Results within the report have been broken down by type of business, and some sub-sample sizes used
in the analysis are quite small and therefore subject to a far greater degree of statistical variation.