Embed Size (px)
Citation preview

FY2015 1st Quarter Business Results Summary
August 6, 2014

>
©
Forward-Looking Statements:
This material contains forward-looking statements regarding ITOCHU Corporation’s corporate plans, strategies, forecasts, and other statements that are not historical facts. They are based on current expectations, estimates, forecasts and projections about the industries in which ITOCHU Corporation operates. As the expectations, estimates, forecasts and projections are subject to a number of risks, uncertainties and assumptions, including without limitation, changes in economic conditions; fluctuations in currency exchange rates; changes in the competitive environment; the outcome of pending and future litigation; and the continued availability of financing and financial instruments and financial resources, they may cause actual results to differ materially from those presented in such forward-looking statements. ITOCHU Corporation, therefore, wishes to caution that readers should not place undue reliance on forward-looking statements, and, further that ITOCHU Corporation undertakes no obligation to update any forward-looking statements as a result of new information, future events or other developments.
1
Figures are based on IFRS, unless otherwise noted.

>
©
Table of Contents
Summary of FY2015 1st Quarter Business Review
Summary of FY2015 1st Quarter
Gross Trading Profit/Net Profit Attributable to ITOCHU by Segment
Earnings from Resource and Non-Resource
Financial Position, Cash Flows
2. FY2015 Forecast and Key Measures
4. Exhibit
FY2015 Quantitative Forecast
Assumption for FY2015
Investment Policy and Review
Forecast of Earnings from Resource and Non-Resource
Dividend Policy
Quarterly Gross Trading Profit/Net Profit attributable to ITOCHU by Segment
・・・・・・・・ 4
・・・・・・・・ 5
・・・・・・・・ 6~7
・・・・・・・・ 8
・・・・・・・・ 9~10
・・・・・・・・ 12
・・・・・・・・ 13
・・・・・・・・ 14
・・・・・・・・ 15
・・・・・・・・ 16
・・・・・・・・ 26~27
1. Summary of FY2015 1st Quarter
Segment Information
ITOCHU’s Equity Share(Sales Result)
・・・・・・・・ 18~23
・・・・・・・・ 24
3. Segment Information
2

>
©
1. Summary of FY2015 1st Quarter
2. FY2015 Forecast and Key Measures
3. Segment Information
4. Exhibit
3

>
©
Summary of FY2015 1st Quarter Business Review
Review
Gross trading profit: ¥245.9 billion Net income attributable to ITOCHU:¥80.8 billion Total ITOCHU stockholders’ equity:¥2 trillion and 82.5 billion NET DER:1.1 times
Business Environment
The global economy grew at a sluggish pace overall due to the slow economic recovery of certainemerging countries.
The trend in Japan’s economy was flat. Although public work projects expanded, exports were sluggish and consumer spending declined substantially due to a rebound from the last minute demand before consumption tax hike.
Against the expectation of additional easing by the Bank of Japan and contraction in Japan's tradedeficit, yen appreciated against the U.S. dollar from the ¥103-¥104 range at the beginning of April.The Nikkei Stock Average dropped from approximately ¥14,800 at the end of March to approximately¥14,000 at the beginning of May, but rose to approximately ¥15,200 at the end of June.
4

>
©
Summary of FY2015 1st Quarter FY2014
1st QuarterResult
(a)
FY20151st Quarter
Result(b)
Increase/Decrease FY2015Forecast
(May 1)
(c)
Progress
(b/c)(b–a) %
Gross trading profit 242.0 245.9 +3.8 +2% 1,110.0 22%Trading income 55.7 53.3 -2.5 -4% 300.0 18%Equity in earnings of associates and joint ventures 26.0 33.5 +7.5 +29% 140.0 24%Profit before tax 96.3 106.9 +10.6 +11% 438.0 24%Net profit attributable to ITOCHU 68.3 80.8 +12.6 +18% 300.0 27%
5(Unit : billion yen)
: Full year (Result / Forecast)
: 1st Quarter (Result)

>
©
Gross Trading Profit by Segment
FY20141st Quarter
Result(a)
FY20151st Quarter
Result(b)
Increase/Decrease
(b-a)
FY2015Forecast
(May 1)
(c)
Progress
(b/c)
Textile 30.7 28.0 -2.6 153.0 18%Machinery 24.2 28.5 +4.3 114.0 25%Metals & Minerals 26.2 17.8 -8.4 80.0 22%Energy & Chemicals 38.3 40.5 +2.2 167.0 24%
Energy 22.0 24.0 +2.0 97.0 25%Chemicals 16.3 16.5 +0.1 70.0 24%
Food 58.8 58.4 -0.3 256.0 23%ICT, General Products & Realty 65.0 68.9 +3.8 319.0 22%
Forest Products & General Merchandise 27.9 28.8 +0.9 123.7 23%
ICT, Insurance & Logistics 32.5 34.8 +2.3 160.2 22%Construction, Realty & Financial Business 4.6 5.3 +0.7 35.1 15%
Adjustments & Eliminations and others -1.1 3.8 +4.8 21.0 -Total 242.0 245.9 +3.8 1,110.0 22%
(Unit : billion yen) 6
>
©
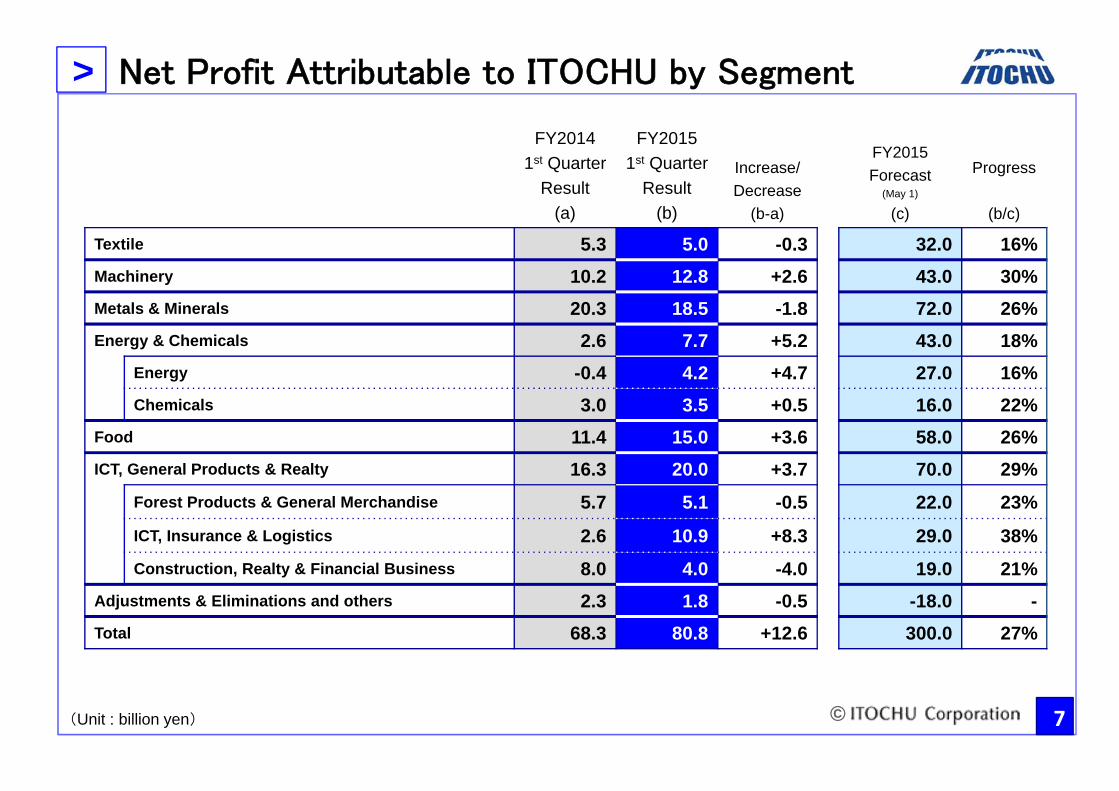
Net Profit Attributable to ITOCHU by Segment
FY20141st Quarter
Result(a)
FY20151st Quarter
Result(b)
Increase/Decrease
(b-a)
FY2015Forecast
(May 1)
(c)
Progress
(b/c)
Textile 5.3 5.0 -0.3 32.0 16%Machinery 10.2 12.8 +2.6 43.0 30%Metals & Minerals 20.3 18.5 -1.8 72.0 26%Energy & Chemicals 2.6 7.7 +5.2 43.0 18%
Energy -0.4 4.2 +4.7 27.0 16%Chemicals 3.0 3.5 +0.5 16.0 22%
Food 11.4 15.0 +3.6 58.0 26%ICT, General Products & Realty 16.3 20.0 +3.7 70.0 29%
Forest Products & General Merchandise 5.7 5.1 -0.5 22.0 23%
ICT, Insurance & Logistics 2.6 10.9 +8.3 29.0 38%Construction, Realty & Financial Business 8.0 4.0 -4.0 19.0 21%
Adjustments & Eliminations and others 2.3 1.8 -0.5 -18.0 -Total 68.3 80.8 +12.6 300.0 27%
(Unit : billion yen) 7

>
©
Earnings from Resource and Non-Resource
(Unit : billion yen) 8
: Resource
: Non-Resource
: Others
FY20141st Quarter
Result
FY20151st Quarter
ResultIncrease/Decrease
Resource 15.8 16.1 +0.2Non-Resource 50.2 63.0 +12.8Others 2.3 1.8 -0.5Total 68.3 80.8 +12.6Resource / Non-Resource (※) 24% / 76% 20% / 80% -4Point / +4Point
※ % composition is calculated for Resource and Non-Resource sectors only.
>
©
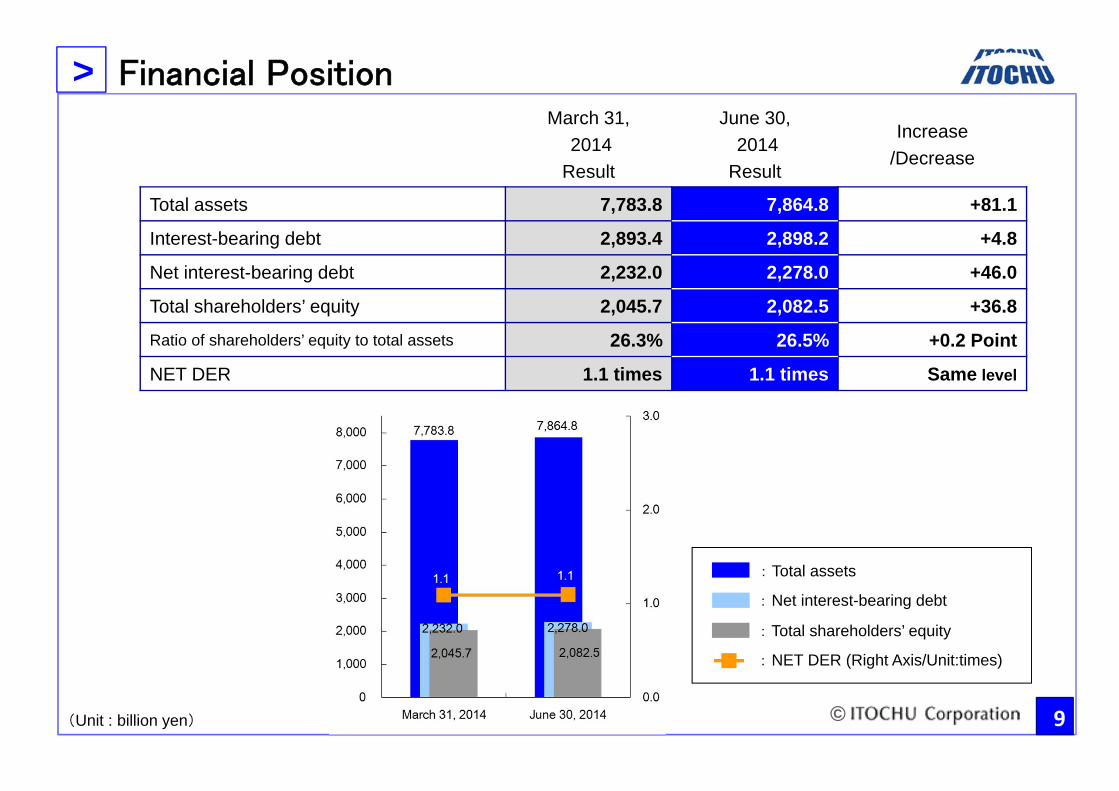
Financial PositionMarch 31,
2014Result
June 30,2014
Result
Increase/Decrease
Total assets 7,783.8 7,864.8 +81.1
Interest-bearing debt 2,893.4 2,898.2 +4.8
Net interest-bearing debt 2,232.0 2,278.0 +46.0
Total shareholders’ equity 2,045.7 2,082.5 +36.8
Ratio of shareholders’ equity to total assets 26.3% 26.5% +0.2 Point
NET DER 1.1 times 1.1 times Same level
: Total assets
: Net interest-bearing debt
: Total shareholders’ equity
: NET DER (Right Axis/Unit:times)
(Unit : billion yen) 9

>
©
Cash Flows
FY20141st Quarter
Result
FY20151st Quarter
ResultIncrease/Decrease
Cash flows from operating activities 45.6 64.8 +19.2Cash flows from investing activities -132.8 -20.1 +112.7Cash flows from financing activities -2.2 -84.4 -82.2
Free cash flows -87.2 44.7 +131.9
: Cash flows from operating activities
: Cash flows from investing activities
: Free cash flows
10(Unit : billion yen)

>
©
1. Summary of FY2015 1st Quarter
2. FY2015 Forecast and Key Measures
3. Segment Information
4. Exhibit
11

>
©
Quantitative Forecast
12(Unit : billion yen)
FY2014Result
(a)
FY20151st Quarter
Result(b)
FY2015Forecast
(May 1)
(c)
Progress
(b/c)
Increase/Decrease
(c-a)Gross trading profit 1,045.0 245.9 1,110.0 22% +65.0Trading income 289.0 53.3 300.0 18% +11.0Equity in earnings of associates and joint ventures 56.0 33.5 140.0 24% +84.0Profit before tax 360.8 106.9 438.0 24% +77.2Net profit attributable to ITOCHU 245.3 80.8 300.0 27% +54.7
Increase/Decrease
(b-c)Total assets 7,783.8 7,864.8 8,200.0 -335.2 +416.2Interest-bearing debt 2,893.4 2,898.2 3,100.0 -201.8 +206.6Net interest-bearing debt 2,232.0 2,278.0 2,500.0 -222.0 +268.0Total shareholders’ equity 2,045.7 2,082.5 2,300.0 -217.5 +254.3Ratio of shareholders’ equity to total assets 26.3% 26.5% 28.0% -1.6Point +1.8PointNET DER 1.1 times 1.1 times 1.1 times Same level Same level

>
©
Assumptions
13
The price of crude oil is the price of Brent crude oil.FY2014 and FY2015 1st quarter prices for iron ore, hard coking coal and thermal coal are prices that ITOCHU regards as general transaction prices based on the market.In the prices for iron ore and hard coking coal used in the FY2015 plan, the prices for FY2015 1st quarter are assumed based on the prices that major suppliers and customers have agreed on regarding shipments as follows and current spot prices, and the prices for FY2015 2nd to 4th quarter are assumed based on the prices agreed on the 1st quarter. The actual sales prices are decided based on negotiations with each customer, ore type and coal type. If the sales price per BBL assumed varies by US$1, the effect on net income attributable to ITOCHU for FY2015 2nd -4th quarter will be as follows: Crude oil: ±¥0.19 billionIf the sales price per TON assumed varies by US$1, the effect on net income attributable to ITOCHU for FY2015 2nd -4th quarter will be as follows: Iron ore: ±¥0.70 billion, Coal: ±¥0.53 billion
(The above effect varies according to changes in sales volume, foreign exchange rates and production costs.)
***
***
****
*****
FY2014Result
FY2015Plan
FY20151Q
Result
(Reference)
Sensitivities on net income attributable to ITOCHU for FY2015 2nd -4th quarter against forecast
Exchange rate(YEN / US$) 100 100 102 ¥ -1.1 billion (1 yen appreciation against US$)
Interest(%) YEN TIBOR(¥) 0.23% 0.25% 0.21% ¥ -4.0 billion (1% increase)
Crude Oil(US$/BBL)* 108 105 110 ****
Iron Ore(US$/TON) (Australian fine ore) 126** N.A.*** 118**
*****Hard cocking coal(US$/TON) (Australian) 153** N.A.*** 120**
Thermal coal(US$/TON) (Australian) 95** N.A.*** 81.8** *****

>
© 14
Investment Policy and Review
>
©
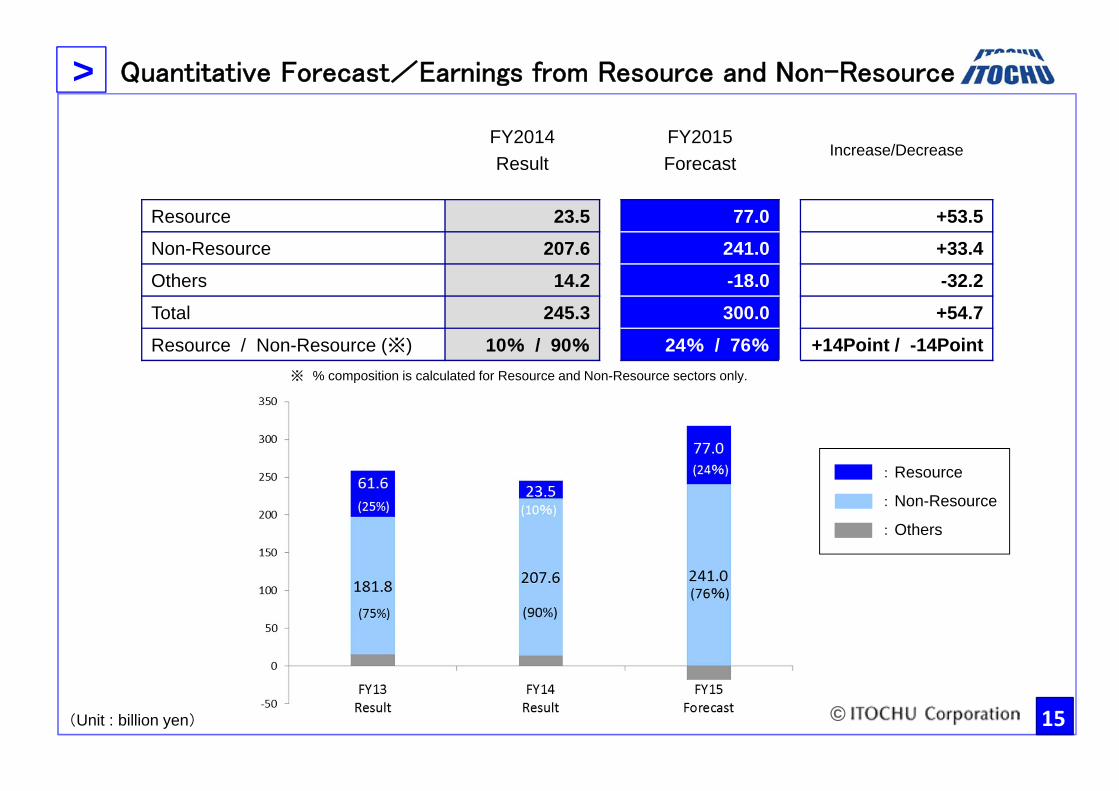
Quantitative Forecast/Earnings from Resource and Non-Resource
(Unit : billion yen) 15
: Resource
: Non-Resource
: Others
FY2014Result
FY2015Forecast
Increase/Decrease
Resource 23.5 77.0 +53.5Non-Resource 207.6 241.0 +33.4Others 14.2 -18.0 -32.2Total 245.3 300.0 +54.7Resource / Non-Resource (※) 10% / 90% 24% / 76% +14Point / -14Point
※ % composition is calculated for Resource and Non-Resource sectors only.

>
©
Dividend Policy
Under the second half of the “Brand-new Deal 2014,” for FY2015, the dividend policy will be as : a consolidated dividend payout ratio of approximately 20% on Net income attributable to ITOCHU up to ¥200.0 billion, and a consolidated dividend payout ratio of approximately 30% on the portion of Net income attributable to ITOCHU exceeding ¥200.0 billion, with further addition of a fixed amount of ¥2 per share.
<Dividends for FY2015>Although ITOCHU will issue new shares by third-party allotment of 78 million shares(4.9%) and implement a share buyback program up to 78 million shares(4.9%) as released on July 24, we intends to pay a full-year dividend of ¥46 per share, comprising an interim dividend of ¥23 per share and a year-end dividend of ¥23 per share for FY2015, as we have already announced based on the dividend policy above.
16
Dividend per share
Payout Ratio(Consolidated)
¥9¥14
¥18 ¥18.5¥15
¥18
¥44¥40
¥46 ¥46
¥0
¥10
¥20
¥30
¥40
¥50
FY06 FY07 FY08 FY09 FY10 FY11 FY12 FY13 FY14 FY15Forecast
*
The figure may change according to issuance of new shares by third-party allotmentor implementation of a share buyback program in the future.
*

>
©
1. Summary of FY2015 1st Quarter
2. FY2015 Forecast and Key Measures
3. Segment Information
4. Exhibit
17
>
©
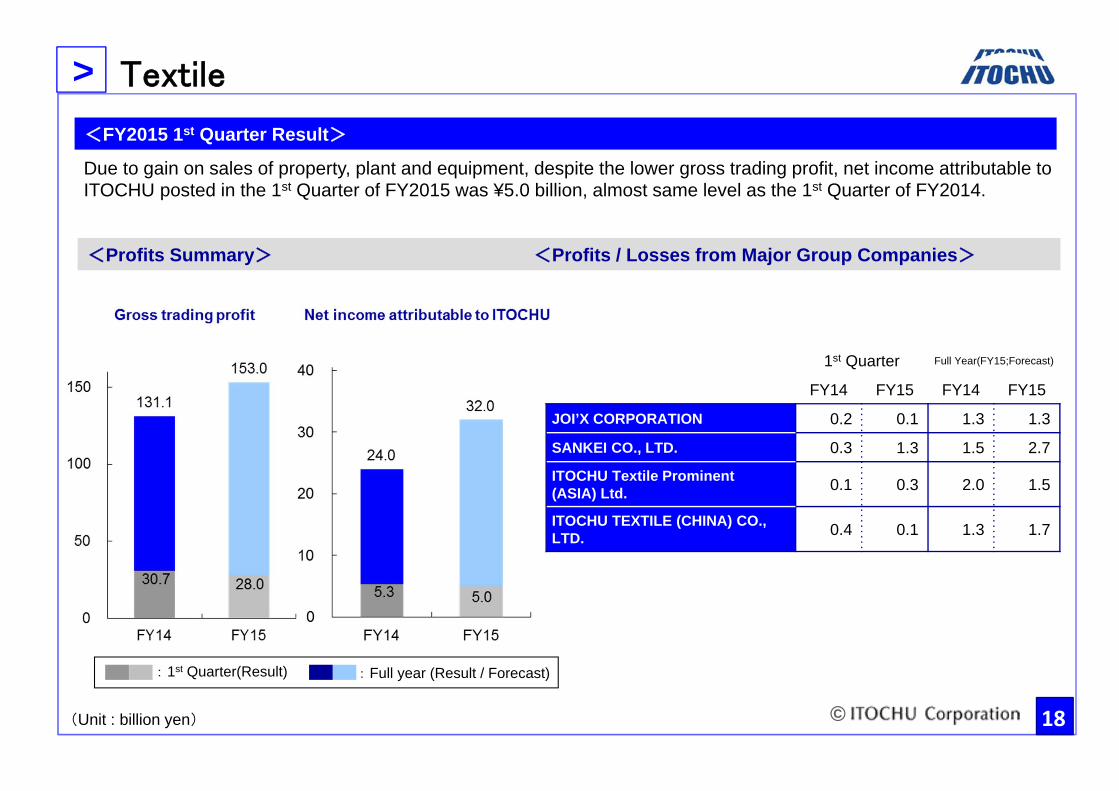
Textile
Due to gain on sales of property, plant and equipment, despite the lower gross trading profit, net income attributable to ITOCHU posted in the 1st Quarter of FY2015 was ¥5.0 billion, almost same level as the 1st Quarter of FY2014.
<FY2015 1st Quarter Result>
<Profits Summary> <Profits / Losses from Major Group Companies>
(Unit : billion yen) 18
1st Quarter Full Year(FY15;Forecast)
FY14 FY15 FY14 FY15
JOI’X CORPORATION 0.2 0.1 1.3 1.3
SANKEI CO., LTD. 0.3 1.3 1.5 2.7
ITOCHU Textile Prominent (ASIA) Ltd. 0.1 0.3 2.0 1.5
ITOCHU TEXTILE (CHINA) CO., LTD. 0.4 0.1 1.3 1.7
: Full year (Result / Forecast): 1st Quarter(Result)

>
©
Machinery
Thanks to the favorable performance in IPP related companies in the North America and higher transaction volume in automobile-related transactions, net income attributable to ITOCHU posted in the 1st Quarter of FY2015 was ¥12.8 billion, an increase of ¥2.6 billion from the 1st Quarter of FY2014.
<FY2015 1st Quarter Result>
<Profits Summary> <Profits / Losses from Major Group Companies>
(Unit : billion yen) 19
1st Quarter Full Year(FY15;Forecast)
FY14 FY15 FY14 FY15
JAPAN AEROSPACE CORPORATION 0.0 0.1 1.0 0.9
JAMCO Corporation 0.1 0.2 1.0 1.0
ITOCHU CONSTRUCTION MACHINERY CO., LTD. 0.2 0.1 1.2 0.7
Century Medical, Inc. 0.2 0.2 1.1 1.0
Century Tokyo Leasing Corporation 1.7 2.2 7.9 8.4
: Full year (Result / Forecast): 1st Quarter(Result)
>
©
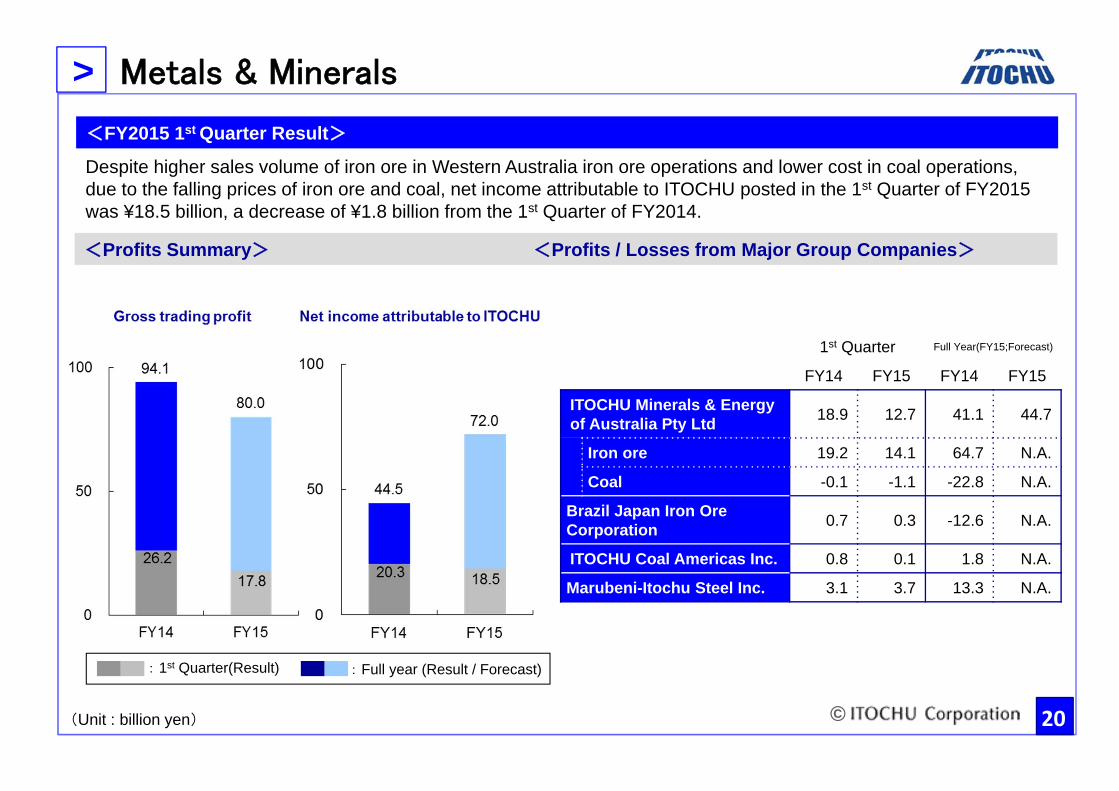
Metals & Minerals
Despite higher sales volume of iron ore in Western Australia iron ore operations and lower cost in coal operations, due to the falling prices of iron ore and coal, net income attributable to ITOCHU posted in the 1st Quarter of FY2015 was ¥18.5 billion, a decrease of ¥1.8 billion from the 1st Quarter of FY2014.
<FY2015 1st Quarter Result>
<Profits Summary> <Profits / Losses from Major Group Companies>
(Unit : billion yen) 20
1st Quarter Full Year(FY15;Forecast)
FY14 FY15 FY14 FY15
ITOCHU Minerals & Energy of Australia Pty Ltd 18.9 12.7 41.1 44.7
Iron ore 19.2 14.1 64.7 N.A.
Coal -0.1 -1.1 -22.8 N.A.
Brazil Japan Iron Ore Corporation 0.7 0.3 -12.6 N.A.
ITOCHU Coal Americas Inc. 0.8 0.1 1.8 N.A.
Marubeni-Itochu Steel Inc. 3.1 3.7 13.3 N.A.
: Full year (Result / Forecast): 1st Quarter(Result)

>
©
Energy & Chemicals
Thanks to the favorable crude oil transactions and absence of impairment loss in U.S. oil and gas development companies in the same period of the previous fiscal year, net income attributable to ITOCHU posted in the 1st Quarter of FY2015 was ¥7.7 billion, an increase of ¥5.2 billion from the 1st Quarter of FY2014.
<FY2015 1st Quarter Result>
<Profits Summary> <Profits / Losses from Major Group Companies>
(Unit : billion yen)21
1st Quarter Full Year(FY15;Forecast)
FY14 FY15 FY14 FY15
ITOCHU Oil Exploration (Azerbaijan) Inc. 2.0 1.9 15.7 8.7
JD Rockies Resources Limited -3.2 -0.5 -32.5 N.A.ITOCHU CHEMICAL FRONTIER Corporation 0.8 0.8 2.9 3.0
ITOCHU PLASTICS INC. 0.7 0.7 2.9 3.0
C.I.Kasei Co., Ltd. 0.0 0.1 1.1 1.0
1st Quarter Full Year(FY15;Forecast)
<Gross Trading Profit> FY14 FY15 FY14 FY15
Energy 22.0 24.0 107.2 97.0
Chemical 16.3 16.5 67.6 70.0
Total 38.3 40.5 174.8 167.0<Net income attributable
to ITOCHU>
1st Quarter Full Year(FY15;Forecast)
FY14 FY15 FY14 FY15
Energy -0.4 4.2 -0.5 27.0
Chemical 3.0 3.5 12.6 16.0
Total 2.6 7.7 12.1 43.0
: Full year (Result / Forecast): 1st Quarter(Result)

>
©
Food
Thanks to higher equity earnings of associated companies and joint ventures resulting from the gain on sales of affiliates in CVS companies, net income attributable to ITOCHU posted in the 1st Quarter of FY 2015 was ¥15.0 billion, an increase of ¥ 3.6 billion from the 1st Quarter of FY2014.
<FY2015 1st Quarter Result>
<Profits Summary> <Profits / Losses from Major Group Companies>
(Unit : billion yen) 22
1st Quarter Full Year(FY15;Forecast)
FY14 FY15 FY14 FY15
Fuji Oil Co., Ltd. 0.6 0.7 2.2 2.3
Dole International holdings, Inc. 1.9 1.2 6.8 10.0
Prima Meat Packers, Ltd. 0.6 0.6 2.0 1.6
FamilyMart Co., Ltd. 1.7 5.1 6.6 8.0*
NIPPON ACCESS, INC. 2.1 1.5 11.7 9.4
China Foods Investment Corp. 0.6 1.1 3.9 N.A.Revised annual forecast announced by the company (May 16)* share at the end of June, different from the forecast of FamilyMart announced by ITOCHU(May 1)
*
: Full year (Result / Forecast): 1st Quarter(Result)

>
©
ICT, General Products & Realty<FY2015 1st Quarter Result>
<Profits Summary> <Profits / Losses from Major Group Companies>
(Unit : billion yen)
23
Due to the gain on remeasurement from the conversion of an Internet advertising company from an associated company to other investments, net income attributable to ITOCHU posted in the 1st Quarter of FY2015 was ¥20.0 billion, an increase of ¥ 3.7 billion from the 1st Quarter of FY2014.
* Not disclosed because the financial results not yet announced.
1st Quarter Full Year(FY15;Forecast)
FY14 FY15 FY14 FY15ITOCHU Kenzai Corp. 0.6 1.2 2.5 2.9
Japan Brazil Paper and Pulp Resources Development Co., Ltd. 0.7 0.5 1.0 N.A.
European Tyre Enterprise Limited 0.6 0.3 5.1 N.A.
ITOCHU FIBRE LIMITED 1.0 0.8 6.5 N.A.
ITOCHU Techno-Solutions Corporation -0.2 * 7.8 9.4
CONEXIO Corporation 0.3 0.5 2.2 2.4
ITOCHU Property Development, Ltd. -0.7 -0.1 1.9 2.2
Orient Corporation 1.7 2.1 4.2 7.2
1st Quarter Full Year(FY15;Forecast)
<Gross Trading Profit> FY14 FY15 FY14 FY15
Forest Products & General Merchandise
27.9 28.8 113.5 123.7
ICT, Insurance & Logistics
32.5 34.8 152.5 160.2
Construction, Realty & Financial Business
4.6 5.3 31.4 35.1
Total 65.0 68.9 297.4 319.0
<Net income attributable to ITOCHU>
1st Quarter Full Year(FY15;Forecast)
FY14 FY15 FY14 FY15
Forest Products & General Merchandise
5.7 5.1 20.9 22.0
ICT, Insurance & Logistics
2.6 10.9 20.6 29.0
Construction, Realty & Financial Business
8.0 4.0 22.2 19.0
Total 16.3 20.0 63.8 70.0
: Full year (Result / Forecast): 1st Quarter(Result)
>
©
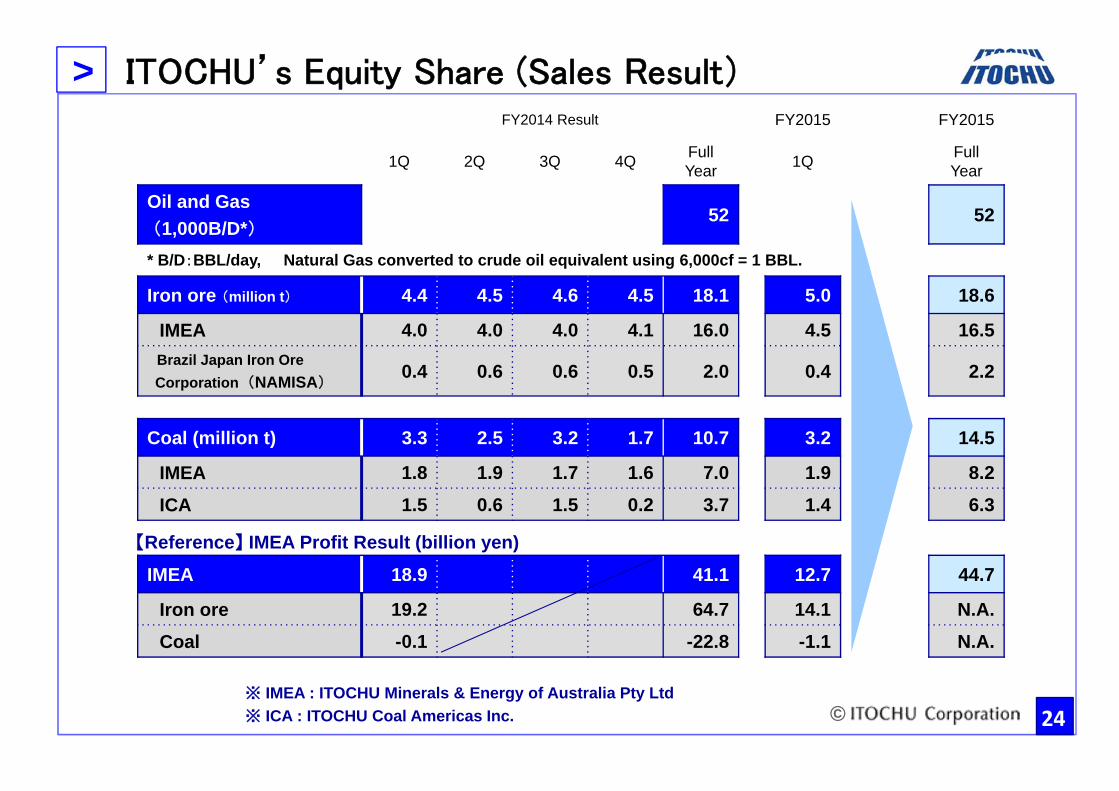
ITOCHU’s Equity Share (Sales Result)
* B/D:BBL/day, Natural Gas converted to crude oil equivalent using 6,000cf = 1 BBL.
【Reference】 IMEA Profit Result (billion yen)
24※ IMEA : ITOCHU Minerals & Energy of Australia Pty Ltd※ ICA : ITOCHU Coal Americas Inc.
FY2014 Result FY2015 FY2015
1Q 2Q 3Q 4Q Full Year 1Q Full
Year
Oil and Gas(1,000B/D*)
52 52
Iron ore (million t) 4.4 4.5 4.6 4.5 18.1 5.0 18.6
IMEA 4.0 4.0 4.0 4.1 16.0 4.5 16.5Brazil Japan Iron Ore Corporation (NAMISA)
0.4 0.6 0.6 0.5 2.0 0.4 2.2
Coal (million t) 3.3 2.5 3.2 1.7 10.7 3.2 14.5
IMEA 1.8 1.9 1.7 1.6 7.0 1.9 8.2ICA 1.5 0.6 1.5 0.2 3.7 1.4 6.3
IMEA 18.9 41.1 12.7 44.7
Iron ore 19.2 64.7 14.1 N.A.Coal -0.1 -22.8 -1.1 N.A.

>
©
1. Summary of FY2015 1st Quarter
2. FY2015 Forecast and Key Measures
3. Segment Information
4. Exhibit
25

>
©
Quarterly Gross Trading Profit by Segment
(Unit : billion yen) 26
FY2014 (U.S. GAAP) FY2014 (IFRS)FY2015(IFRS)
1Q 2Q 3Q 4Q Full year 1Q Full year 1Q
Textile 30.7 32.0 34.0 34.5 131.2 30.7 131.1 28.0
Machinery 24.1 25.4 25.9 25.3 100.7 24.2 100.8 28.5
Metals & Minerals 26.0 22.3 26.5 17.2 92.1 26.2 94.1 17.8
Energy & Chemicals 39.4 39.5 40.5 57.1 176.4 38.3 174.8 40.5
Energy 23.0 22.7 23.4 40.0 109.0 22.0 107.2 24.0
Chemicals 16.3 16.9 17.1 17.1 67.4 16.3 67.6 16.5
Food 58.7 61.7 63.7 55.8 239.9 58.8 240.8 58.4
ICT, General Products & Realty 53.6 69.3 71.2 88.1 282.1 65.0 297.4 68.9Forest Products & General Merchandise 27.9 26.7 29.1 29.6 113.4 27.9 113.5 28.8
ICT, Insurance & Logistics 21.1 36.3 35.2 48.3 141.0 32.5 152.5 34.8Construction, Realty & Financial Business 4.5 6.2 6.9 10.2 27.7 4.6 31.4 5.3
Adjustments & Eliminations and others -1.0 3.1 3.8 -0.1 5.9 -1.1 5.9 3.8
Total 231.5 253.2 265.7 277.9 1,028.3 242.0 1,045.0 245.9

>
©
Quarterly Net Profit Attributable to ITOCHU by Segment
(Unit : billion yen) 27
FY2014 (U.S. GAAP) FY2014 (IFRS)FY2015(IFRS)
1Q 2Q 3Q 4Q Full year 1Q Full
year 1Q
Textile 6.3 10.0 7.4 8.8 32.5 5.3 24.0 5.0
Machinery 13.8 10.4 8.7 10.5 43.4 10.2 35.9 12.8
Metals & Minerals 20.4 21.6 14.8 17.3 74.1 20.3 44.5 18.5
Energy & Chemicals 4.0 7.5 4.2 1.0 16.7 2.6 12.1 7.7
Energy 1.1 4.9 1.3 -5.0 2.2 -0.4 -0.5 4.2
Chemicals 2.9 2.7 2.9 6.0 14.5 3.0 12.6 3.5
Food 11.4 14.6 16.1 15.4 57.5 11.4 50.8 15.0
ICT, General Products & Realty 18.7 21.1 16.6 19.9 76.3 16.3 63.8 20.0Forest Products & General Merchandise 5.9 8.0 7.5 4.5 25.9 5.7 20.9 5.1
ICT, Insurance & Logistics 3.0 7.5 4.5 9.5 24.4 2.6 20.6 10.9Construction, Realty & Financial Business 9.9 5.6 4.7 5.9 26.1 8.0 22.2 4.0
Adjustments & Eliminations and others 2.8 2.6 7.4 -2.9 9.8 2.3 14.2 1.8
Total 77.3 87.8 75.2 69.9 310.3 68.3 245.3 80.8