Embed Size (px)
Citation preview

Business Results for the First Nine Months
of the Fiscal Year Ending December 31, 2011 (January 1, 2011 through September 30, 2011)
(Japan GAAP)
November 4, 2011 This document has been translated from the Japanese original, Kessan Tanshin (Flash Report), for reference purposes only. In the event of any discrepancy between this translated document and the Japanese original, the original shall prevail.
Company name: Yamaha Motor Co., Ltd.
Stock listing:
Tokyo Stock Exchange the First Section Code number:
7272 URL:
http://www.yamaha-motor.co.jp/global/ir/index.html Representative: Hiroyuki Yanagi, President, Chief Executive Officer and Representative Director Contact:
Takeo Ishii, General Manager, Finance & Accounting Division Phone: +81-538-32-1103
Filing of quarterly securities report (scheduled):
November 7, 2011 Beginning of payment of third quarter-end dividend (scheduled):
― Supplementary explanatory documents related to the quarterly consolidated financial results:
Yes Briefing on the quarterly consolidated financial results:
Yes (for institutional investors and securities analysts)
1

Amounts less than one million yen are omitted.
1. Consolidated Financial Results for the Nine Months Ended September 30, 2011 (January 1, 2011 through September 30, 2011)
(1) Consolidated Operating Results (cumulative)
* % represents year-on-year rate. ( ) represents negative figures. Net sales Operating income Ordinary income Net income Millions of yen % Millions of yen % Millions of yen % Millions of yen %
Nine months ended September 30, 2011 985,751 (0.2) 60,723 24.5 67,862 10.5 39,989 28.7
Nine months ended September 30, 2010 987,402 15.0 48,773 — 61,394 — 31,067 —
Net income per share ― basic
Net income per share ― diluted
Yen Yen
Nine months ended September 30, 2011 114.55 114.55
Nine months ended September 30, 2010 96.12 96.12
(2) Consolidated Financial Position
Total assets Net assets Shareholders’ equity ratio Net assets per share Millions of yen Millions of yen % Yen
As of September 30, 2011 939,487 328,406 31.2 838.59
As of December 31, 2010 978,343 310,809 28.0 785.61
Reference: Shareholders’ equity As of September 30, 2011: ¥292,746 million As of December 31, 2010: ¥274,252 million
2. Cash Dividends Annual cash dividends per share
Record date End of first quarter
End of second quarter
End of third quarter
End of fiscal year Total
Yen Yen Yen Yen Yen
Fiscal year ended December 31, 2010 ― 0.00 ― 0.00 0.00
Fiscal year ending December 31, 2011 ― 0.00 ―
Fiscal year ending December 31, 2011 (forecast)
20.00 20.00
Note: No revision of the cash dividends forecast for the fiscal year ending December 31, 2011 was made during the third quarter ended September 30, 2011.
2
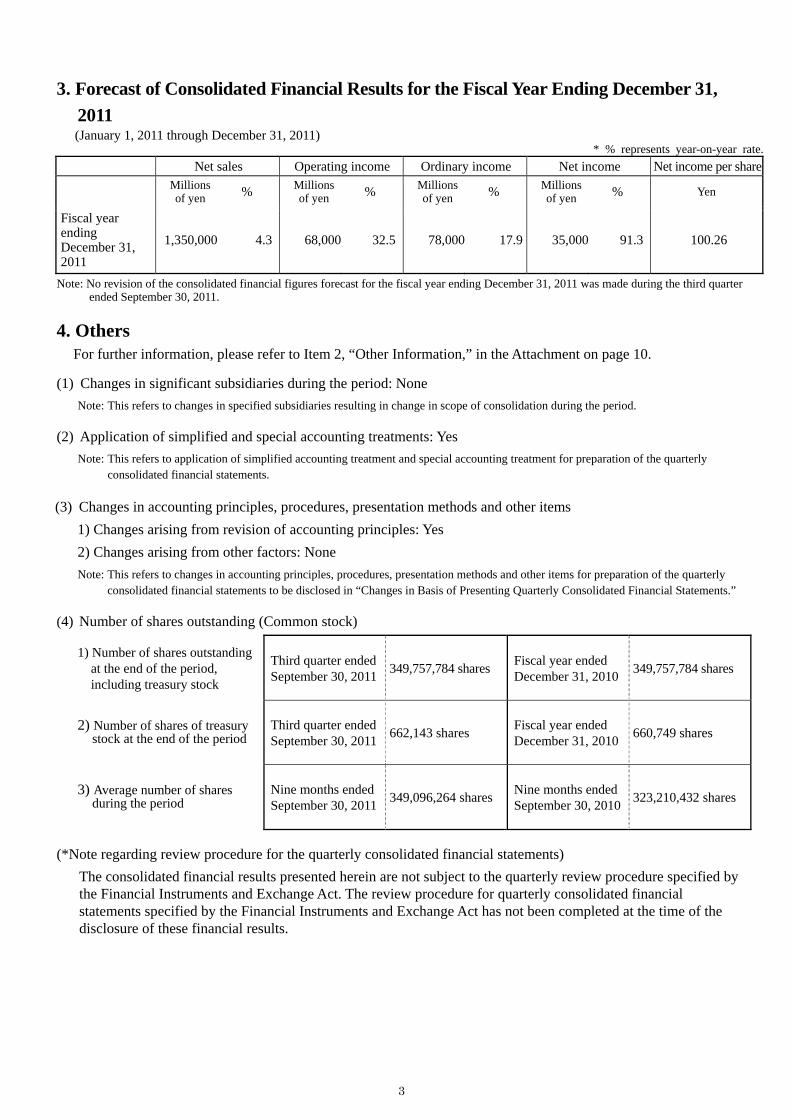
3. Forecast of Consolidated Financial Results for the Fiscal Year Ending December 31, 2011 (January 1, 2011 through December 31, 2011)
* % represents year-on-year rate. Net sales Operating income Ordinary income Net income Net income per share Millions
of yen % Millions of yen % Millions
of yen % Millions of yen % Yen
Fiscal year ending December 31, 2011
1,350,000 4.3 68,000 32.5 78,000 17.9 35,000 91.3 100.26
Note: No revision of the consolidated financial figures forecast for the fiscal year ending December 31, 2011 was made during the third quarter ended September 30, 2011.
4. Others
For further information, please refer to Item 2, “Other Information,” in the Attachment on page 10.
(1) Changes in significant subsidiaries during the period: None Note: This refers to changes in specified subsidiaries resulting in change in scope of consolidation during the period.
(2) Application of simplified and special accounting treatments: Yes Note: This refers to application of simplified accounting treatment and special accounting treatment for preparation of the quarterly
consolidated financial statements. (3) Changes in accounting principles, procedures, presentation methods and other items
1) Changes arising from revision of accounting principles: Yes 2) Changes arising from other factors: None Note: This refers to changes in accounting principles, procedures, presentation methods and other items for preparation of the quarterly
consolidated financial statements to be disclosed in “Changes in Basis of Presenting Quarterly Consolidated Financial Statements.” (4) Number of shares outstanding (Common stock)
1) Number of shares outstanding at the end of the period, including treasury stock
Third quarter ended September 30, 2011 349,757,784 shares Fiscal year ended
December 31, 2010 349,757,784 shares
2) Number of shares of treasury stock at the end of the period
Third quarter ended September 30, 2011 662,143 shares Fiscal year ended
December 31, 2010 660,749 shares
3) Average number of shares during the period
Nine months ended September 30, 2011 349,096,264 shares Nine months ended
September 30, 2010 323,210,432 shares
(*Note regarding review procedure for the quarterly consolidated financial statements)
The consolidated financial results presented herein are not subject to the quarterly review procedure specified by the Financial Instruments and Exchange Act. The review procedure for quarterly consolidated financial statements specified by the Financial Instruments and Exchange Act has not been completed at the time of the disclosure of these financial results.
3

(*Notice regarding results forecast) (1) Results forecast presented in this document is based on the assumptions and beliefs of Yamaha Motor Co., Ltd.
(“the Company”) in light of the information currently available, and may differ significantly from actual financial results, due to various risks, uncertainties and other factors, including changes in business conditions surrounding the Yamaha Motor Group, changing consumer preferences, and currency exchange rate fluctuations.
For details on potential risks, uncertainties and other factors affecting the Company’s operations, please see the Securities Report (filed on March 25, 2011).
For results forecast, please refer to Section 1-(3), “Qualitative Information on Results Forecast” on page 9. (2) With regard to amounts stated in ¥100 million units in this document, amounts less than ¥100 million are rounded
off.
4
Index of the Attachment Net Sales by Segment ..........................................................................................................................................................6 1. Qualitative Information on Consolidated Results During the Period ........................................................................7 (1) Qualitative Information on Consolidated Operating Results.........................................................................................7 (2) Qualitative Information on the Consolidated Financial Position...................................................................................9 (3) Qualitative Information on Results Forecast .................................................................................................................9
2. Other Information.........................................................................................................................................................10 (1) Outline of Changes in Significant Subsidiaries ...........................................................................................................10 (2) Outline of Application of Simplified and Special Accounting Treatments..................................................................10 (3) Outline of Changes in Accounting Principles, Procedures, Presentation Methods and Other Items ...........................10
3. Consolidated Financial Statements..............................................................................................................................11 (1) Consolidated Balance Sheets.......................................................................................................................................11 (2) Consolidated Statements of Income ............................................................................................................................13
Nine months ended September 30, 2010 and 2011 .....................................................................................................13 Third quarter ended September 30, 2010 and 2011 ....................................................................................................14
(3) Consolidated Statements of Cash Flows......................................................................................................................15 (4) Notes Regarding Going-concern Assumptions............................................................................................................17 (5) Segment Information. ..................................................................................................................................................17 (6) Notes in the Event of Material Changes in the Amount of Shareholders’ Equity........................................................23 (7) Other Notes..................................................................................................................................................................23
*The Company plans to hold a briefing as shown below. Reference documents distributed at the briefing will be posted on the Company’s website immediately after the briefing. - Friday, November 4, 2011 ・・・ Financial results briefing for institutional investors and securities analysts
5
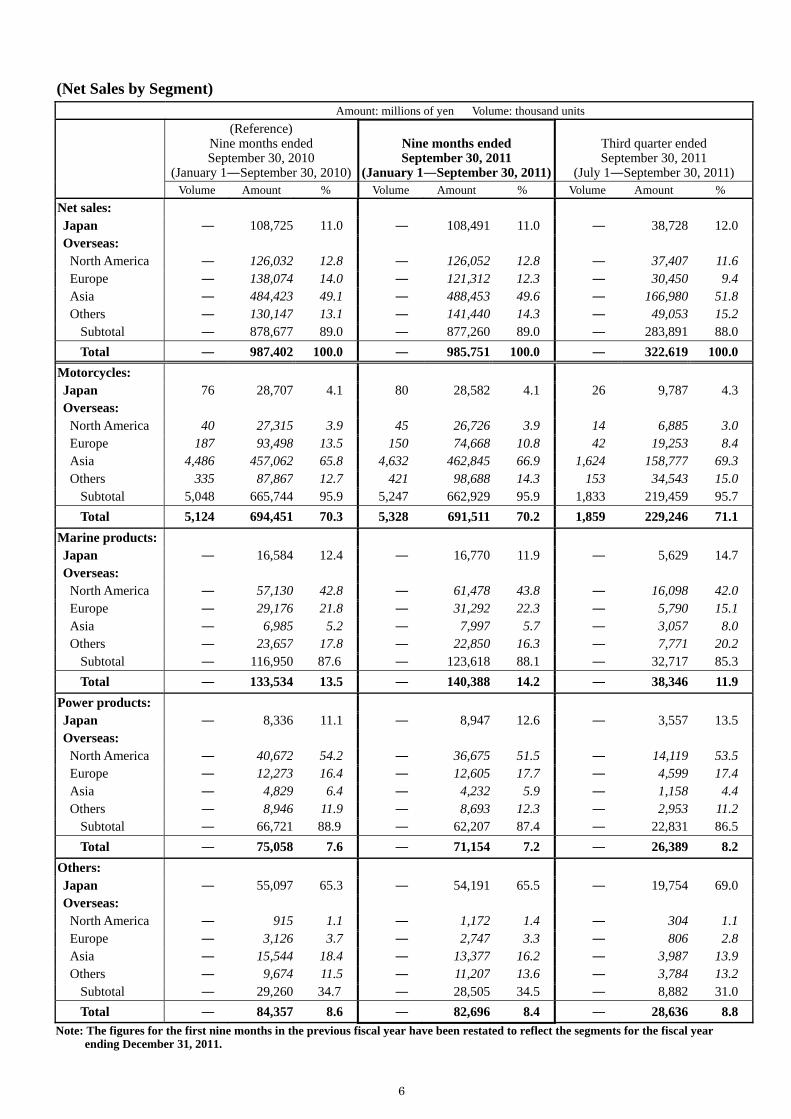
(Net Sales by Segment) Amount: millions of yen Volume: thousand units
(Reference) Nine months ended September 30, 2010
(January 1―September 30, 2010)
Nine months ended September 30, 2011
(January 1―September 30, 2011)
Third quarter ended September 30, 2011
(July 1―September 30, 2011)
Volume Amount % Volume Amount % Volume Amount % Net sales: Japan ― 108,725 11.0 ― 108,491 11.0 ― 38,728 12.0 Overseas:
North America ― 126,032 12.8 ― 126,052 12.8 ― 37,407 11.6 Europe ― 138,074 14.0 ― 121,312 12.3 ― 30,450 9.4 Asia ― 484,423 49.1 ― 488,453 49.6 ― 166,980 51.8 Others ― 130,147 13.1 ― 141,440 14.3 ― 49,053 15.2
Subtotal ― 878,677 89.0 ― 877,260 89.0 ― 283,891 88.0 Total ― 987,402 100.0 ― 985,751 100.0 ― 322,619 100.0
Motorcycles: Japan 76 28,707 4.1 80 28,582 4.1 26 9,787 4.3 Overseas:
North America 40 27,315 3.9 45 26,726 3.9 14 6,885 3.0 Europe 187 93,498 13.5 150 74,668 10.8 42 19,253 8.4 Asia 4,486 457,062 65.8 4,632 462,845 66.9 1,624 158,777 69.3 Others 335 87,867 12.7 421 98,688 14.3 153 34,543 15.0
Subtotal 5,048 665,744 95.9 5,247 662,929 95.9 1,833 219,459 95.7 Total 5,124 694,451 70.3 5,328 691,511 70.2 1,859 229,246 71.1
Marine products: Japan ― 16,584 12.4 ― 16,770 11.9 ― 5,629 14.7 Overseas:
North America ― 57,130 42.8 ― 61,478 43.8 ― 16,098 42.0 Europe ― 29,176 21.8 ― 31,292 22.3 ― 5,790 15.1 Asia ― 6,985 5.2 ― 7,997 5.7 ― 3,057 8.0 Others ― 23,657 17.8 ― 22,850 16.3 ― 7,771 20.2
Subtotal ― 116,950 87.6 ― 123,618 88.1 ― 32,717 85.3 Total ― 133,534 13.5 ― 140,388 14.2 ― 38,346 11.9
Power products: Japan ― 8,336 11.1 ― 8,947 12.6 ― 3,557 13.5 Overseas:
North America ― 40,672 54.2 ― 36,675 51.5 ― 14,119 53.5 Europe ― 12,273 16.4 ― 12,605 17.7 ― 4,599 17.4 Asia ― 4,829 6.4 ― 4,232 5.9 ― 1,158 4.4 Others ― 8,946 11.9 ― 8,693 12.3 ― 2,953 11.2
Subtotal ― 66,721 88.9 ― 62,207 87.4 ― 22,831 86.5 Total ― 75,058 7.6 ― 71,154 7.2 ― 26,389 8.2
Others: Japan ― 55,097 65.3 ― 54,191 65.5 ― 19,754 69.0 Overseas:
North America ― 915 1.1 ― 1,172 1.4 ― 304 1.1 Europe ― 3,126 3.7 ― 2,747 3.3 ― 806 2.8 Asia ― 15,544 18.4 ― 13,377 16.2 ― 3,987 13.9 Others ― 9,674 11.5 ― 11,207 13.6 ― 3,784 13.2
Subtotal ― 29,260 34.7 ― 28,505 34.5 ― 8,882 31.0 Total ― 84,357 8.6 ― 82,696 8.4 ― 28,636 8.8
Note: The figures for the first nine months in the previous fiscal year have been restated to reflect the segments for the fiscal year ending December 31, 2011.
6

1. Qualitative Information on Consolidated Results During the Period (1) Qualitative Information on Consolidated Operating Results In the economic environment during the third quarter (July 1 through September 30, 2011) of the fiscal year ending December 31, 2011, the pace of recovery in the U.S. slowed as a result of factors including a persistent high rate of unemployment and a downtrend in housing prices. In Europe, there are indications of another downturn in the economy as a result of turmoil stemming from the debt problem in Greece. Although overall stable growth continued in emerging nations, there are concerns that these nations will also be affected by the global business slowdown. In Japan, the yen continued to appreciate, and recovery from the business slump triggered by the Great East Japan Earthquake slowed.
Against this backdrop, the Company’s unit sales of motorcycles in emerging nations, as well as unit sales of outboard motors and other products for the third quarter (July 1 through September 30, 2011), increased from the same period of the previous year. Consolidated net sales rose 3.7% to ¥322.6 billion, despite ¥15.1 billion of the negative impact of exchange rates due to yen appreciation.
Operating income rose 40.0% to ¥19.2 billion, ordinary income 8.5% to ¥19.1 billion, and net income 51.2% to ¥11.0 billion, as an increase in gross profit on higher sales, cost reductions due to structural reforms and other factors exceeded the negative impact of exchange rates.
The unit sales of motorcycles in emerging nations, with unit sales of outboard motors and other products for the nine months ended September 30, 2011, increased from the same period of the previous year. Consolidated net sales edged down 0.2% to ¥985.8 billion, affected by ¥51.8 billion of the negative impact of exchange rates. Operating income rose 24.5% to ¥60.7 billion, ordinary income 10.5% to ¥67.9 billion, and net income 28.7% to ¥40.0 billion, as higher sales, cost reductions due to structural reforms, a reversal of the provision for product liabilities, and other factors offset yen appreciation, higher raw materials prices, and the impact of the earthquake disaster.
Exchange rates for the third quarter (July 1 through September 30, 2011) were ¥78 yen to the U.S. dollar (an appreciation of ¥8 from the same period of the previous year) and ¥110 to the euro (an appreciation of ¥1). Those for the nine months ended September 30, 2011 were ¥81 yen to the U.S. dollar (an appreciation of ¥8 from the same period of the previous year) and ¥113 to the euro (an appreciation of ¥5). Operating performance by segment [Motorcycles] Sales of motorcycles for the third quarter (July 1 through September 30, 2011) increased from the same period of the previous year, especially in Vietnam, Indonesia, and Brazil. An increase in unit sales was seen in the U.S., where shipment adjustments were carried out in the previous year to address market stock adjustments. Net sales of motorcycles were ¥229.2 billion, up 7.1% from the previous third quarter, despite factors including a sales decrease in Europe and the negative impact of exchange rates resulting from yen appreciation. Operating income fell 28.9% to ¥9.4 billion from the previous third quarter, due to factors including the impact of exchange rates, increases in raw materials prices, despite an increase in gross profit on higher unit sales.
Net sales for the nine months ended September 30, 2011 decreased 0.4% from the same period of the previous year to ¥691.5 billion as a result of factors including a sales decrease in Europe and the negative impact of exchange rates, despite sales increases in Central and South America, Asia, and other regions. Operating income fell 22.9% to ¥32.9 billion. [Marine products] The unit sales of outboard motors in Russia, Central and South America, the U.S., and other markets for the third quarter (July 1 through September 30, 2011) increased from the same period of the previous year, which was attributable to recovery from delays in production and shipments of outboard motors in the second quarter caused by the earthquake disaster. Net sales of marine products rose 1.7% from the previous third quarter to ¥38.3 billion despite the negative impact of exchange rates. Operating income was ¥2.7 billion, an improvement of ¥3.1 billion from the previous third quarter, which was attributable to factors including higher unit sales due to recovery from the impact of the earthquake disaster.
Net sales for the nine months ended September 30, 2011 increased 5.1% from the same period of the previous year to ¥140.4 billion, thanks to factors including a recovery in demand for outboard motors and personal watercraft. Operating income rose 131.0% to ¥8.5 billion, attributable mainly to higher sales.
7

[Power products] Net sales of power products for the third quarter (July 1 through September 30, 2011) fell 13.9% from the same
period of the previous year to ¥26.4 billion, reflecting a decrease in sales of all-terrain vehicles (ATVs) in North America and the negative impact of exchange rates. Operating income was ¥3.7 billion, an improvement of ¥6.7 billion from the previous third quarter, as a result of factors including a reversal of the provision for product liabilities and cost reductions.
Net sales for the nine months ended September 30, 2011 decreased 5.2% from the same period of the previous year to ¥71.2 billion. Operating income was ¥9.3 billion, an improvement of ¥16.5 billion from the same period of the previous year. [Others] Net sales in this segment for the third quarter (July 1 through September 30, 2011) showed a decline of 0.9% from the same period of the previous year to ¥28.6 billion, reflecting a decrease in unit sales of surface mounters, despite an increase in sales of electrically power assisted bicycles and higher unit sales of automobile engines as a result of recovery from the impact of the earthquake disaster. Operating income fell 13.6% to ¥3.5 billion from the previous third quarter.
Net sales for the nine months ended September 30, 2011 fell 2.0% from the same period of the previous year to ¥82.7 billion, while operating income rose 4.3% to ¥9.9 billion. In comparison with the same periods of the previous year, the figures for the third quarter and the nine months ended September 30, 2010 have been restated to reflect the segments for the fiscal year ending December 31, 2011. (Reference Information) Geographical segment information for the nine months ended September 30, 2011 (Net sales includes intersegment sales among areas) [Japan] Net sales in Japan for the nine months ended September 30, 2011 decreased 6.3% from the same period of the previous year to ¥380.9 billion, reflecting a decrease in unit sales of surface mounters, the negative impact of yen appreciation and other factors, despite an increase in sales of electrically power assisted bicycles and higher unit sales of automobile engines as a result of recovery from the impact of the earthquake disaster. Operating loss was ¥6.6 billion, a decrease of ¥7.3 billion from the same period of the previous year. The loss mainly resulted from lower net sales and the negative impact of yen appreciation, despite cost reductions due to structural reforms. [North America] Sales of personal watercraft, outboard motors, and other products increased from the same period of the previous year following the recovery trend in the market for marine products. Net sales in North America for the nine months ended September 30, 2011 increased 1.1% from the same period of the previous year to ¥137.5 billion as despite the negative impact of exchange rates. Operating income was ¥9.4 billion, an improvement of ¥18.0 billion from the same period of the previous year, owing mainly to a reversal of the provision for product liabilities, the impact of cost reductions due to structural reforms and higher sales. [Europe] Net sales in Europe for the nine months ended September 30, 2011 decreased 10.8% from the same period of the previous year to ¥122.0 billion as a result of continued lower sales of motorcycles and ATVs in an economic deterioration stemming from fiscal problems in countries in and around the euro zone, the negative impact of exchange rates, and other factors. Operating income fell 52.5% to ¥1.5 billion, owing to the net sales decrease. [Asia] Sales of motorcycles in Vietnam, India and other markets increased from the same period of the previous year. Despite sales decrease affected by the exhaust regulations in China, the impact of exchange rates and other factors, net sales in Asia (excluding Japan) for the nine months ended September 30, 2011 increased 2.5% from the same period of the previous year to ¥506.4 billion. Operating income fell 5.3% to ¥44.0 billion, reflecting factors including increases in raw materials prices and the negative impact of exchange rates.
8

[Others] Net sales in other areas for the nine months ended September 30, 2011 increased 15.4% from the same period of the previous year to ¥120.1 billion due to factors including higher sales of motorcycles and outboard motors in Brazil. Operating income rose 80.6% to ¥11.6 billion. (2) Qualitative Information on the Consolidated Financial Position Total assets at the end of the third quarter decreased ¥38.9 billion from the end of the previous fiscal year to ¥939.5 billion, attributable to decreases of ¥33.9 billion in current assets and ¥4.9 billion in noncurrent assets. Although shareholders’ equity increased ¥39.7 billion from the end of the previous fiscal year as a result of ¥40.0 billion in net income and other factors, total net assets increased ¥17.6 billion to ¥328.4 billion, as a result of decrease in foreign currency translation adjustment. The shareholders’ equity ratio as of September 30, 2011 was 31.2% (an improvement of 3.1 points).
Net cash provided by operating activities during the third quarter (July 1 through September 30, 2011) was ¥27.9 billion, reflecting factors including an income before income taxes of ¥18.8 billion, a decrease in notes and accounts receivable-trade of ¥18.1 billion, and income taxes paid of ¥6.5 billion. Net cash used in investing activities was ¥8.1 billion. Consequently, ¥19.8 billion in free cash flow was generated. Net cash used in financing activities was ¥17.5 billion.
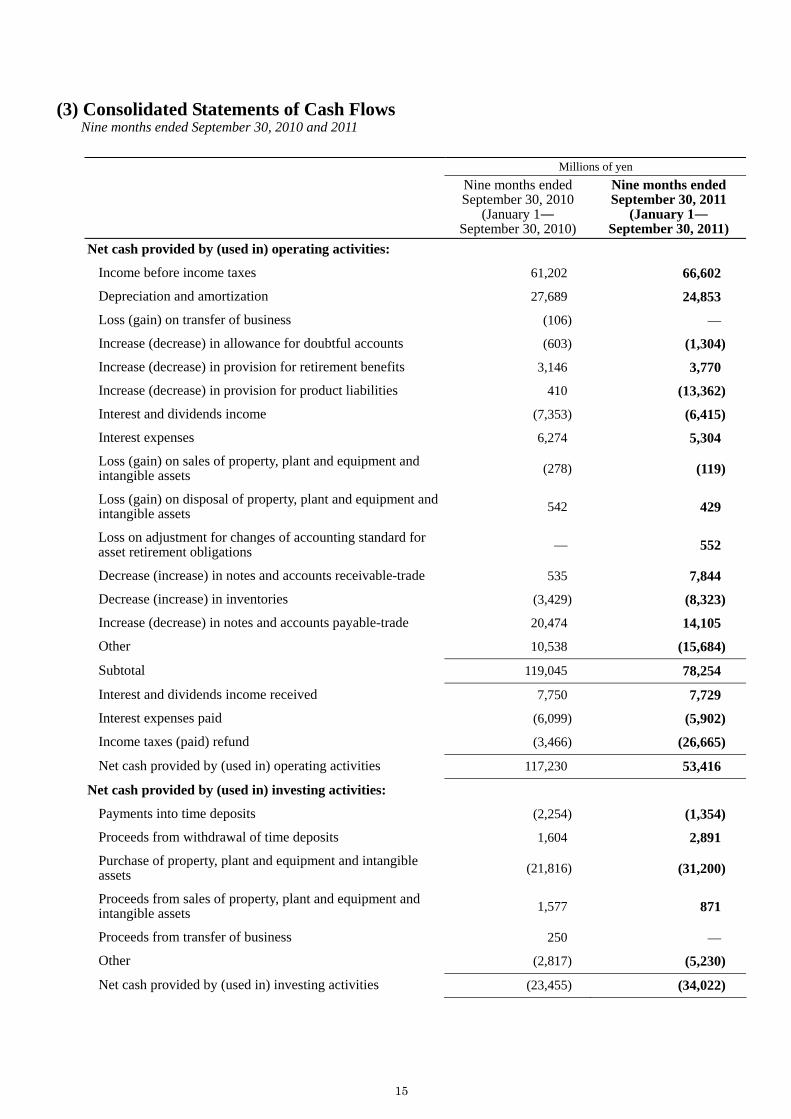
Net cash provided by operating activities during the nine months ended September 30, 2011 was ¥53.4 billion, reflecting factors including income before income taxes of ¥66.6 billion, an increase in notes and accounts payable-trade of ¥14.1 billion, and income taxes paid of ¥26.7 billion.
Net cash used in investing activities was ¥34.0 billion, mainly as a result of the purchase of facilities in Indonesia and Vietnam to increase production. Consequently, ¥19.4 billion free cash flow was generated.
Net cash used in financing activities was ¥33.0 billion, because of factors including ¥27.7 billion in repayment of short-term and long-term loans payable.
As a result of the activities discussed above, interest-bearing debt at the end of the third quarter under review was ¥291.3 billion, a decrease of ¥31.1 billion from end of the previous fiscal year. Cash and cash equivalents decreased by ¥19.8 billion from the end of the previous fiscal year to ¥184.1 billion. Interest-bearing debt includes ¥102.4 billion in borrowings for sales finance. (3) Qualitative Information on Results Forecast Although operating results through the third quarter exceeded the forecast, owing to uncertainty about the future due to factors including the yen’s appreciation beyond expectations and the impact of flooding in Thailand, the Company has not changed the forecast for full-year consolidated operating results announced at the time of the announcement of second quarter operating results on August 3, 2011.
9
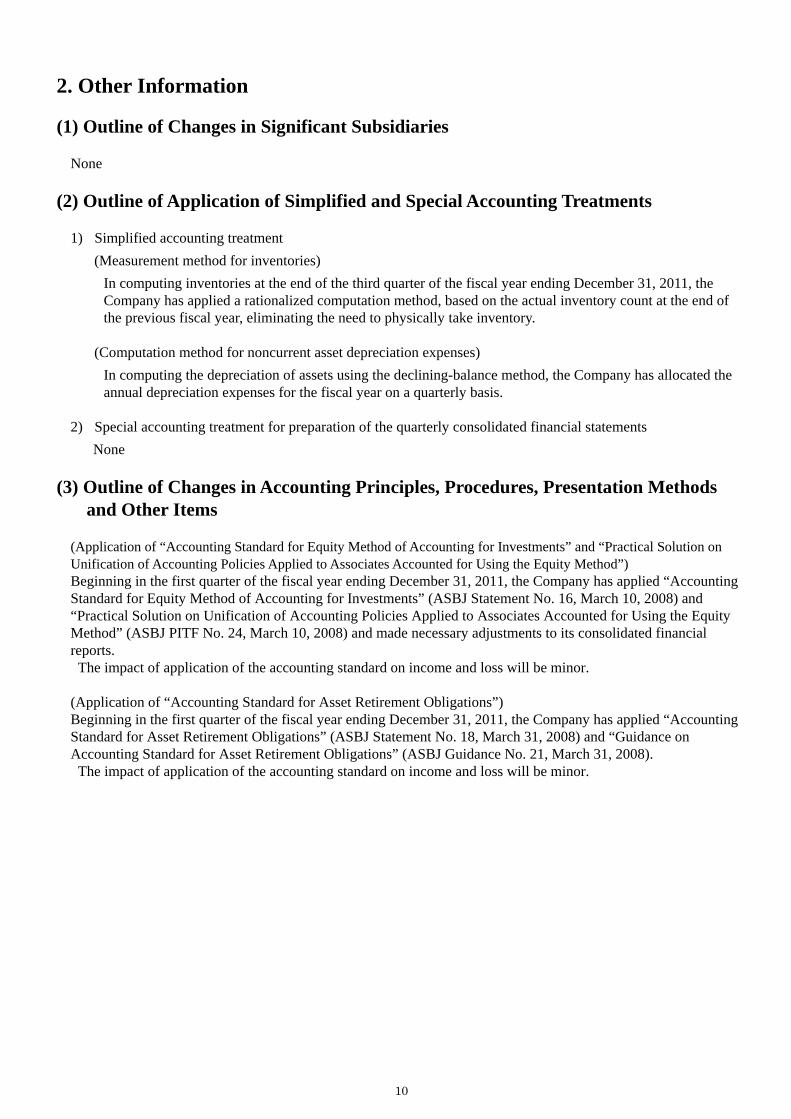
2. Other Information (1) Outline of Changes in Significant Subsidiaries
None (2) Outline of Application of Simplified and Special Accounting Treatments
1) Simplified accounting treatment (Measurement method for inventories)
In computing inventories at the end of the third quarter of the fiscal year ending December 31, 2011, the Company has applied a rationalized computation method, based on the actual inventory count at the end of the previous fiscal year, eliminating the need to physically take inventory.
(Computation method for noncurrent asset depreciation expenses)
In computing the depreciation of assets using the declining-balance method, the Company has allocated the annual depreciation expenses for the fiscal year on a quarterly basis.
2) Special accounting treatment for preparation of the quarterly consolidated financial statements
None (3) Outline of Changes in Accounting Principles, Procedures, Presentation Methods
and Other Items (Application of “Accounting Standard for Equity Method of Accounting for Investments” and “Practical Solution on Unification of Accounting Policies Applied to Associates Accounted for Using the Equity Method”) Beginning in the first quarter of the fiscal year ending December 31, 2011, the Company has applied “Accounting Standard for Equity Method of Accounting for Investments” (ASBJ Statement No. 16, March 10, 2008) and “Practical Solution on Unification of Accounting Policies Applied to Associates Accounted for Using the Equity Method” (ASBJ PITF No. 24, March 10, 2008) and made necessary adjustments to its consolidated financial reports.
The impact of application of the accounting standard on income and loss will be minor. (Application of “Accounting Standard for Asset Retirement Obligations”) Beginning in the first quarter of the fiscal year ending December 31, 2011, the Company has applied “Accounting Standard for Asset Retirement Obligations” (ASBJ Statement No. 18, March 31, 2008) and “Guidance on Accounting Standard for Asset Retirement Obligations” (ASBJ Guidance No. 21, March 31, 2008).
The impact of application of the accounting standard on income and loss will be minor.
10
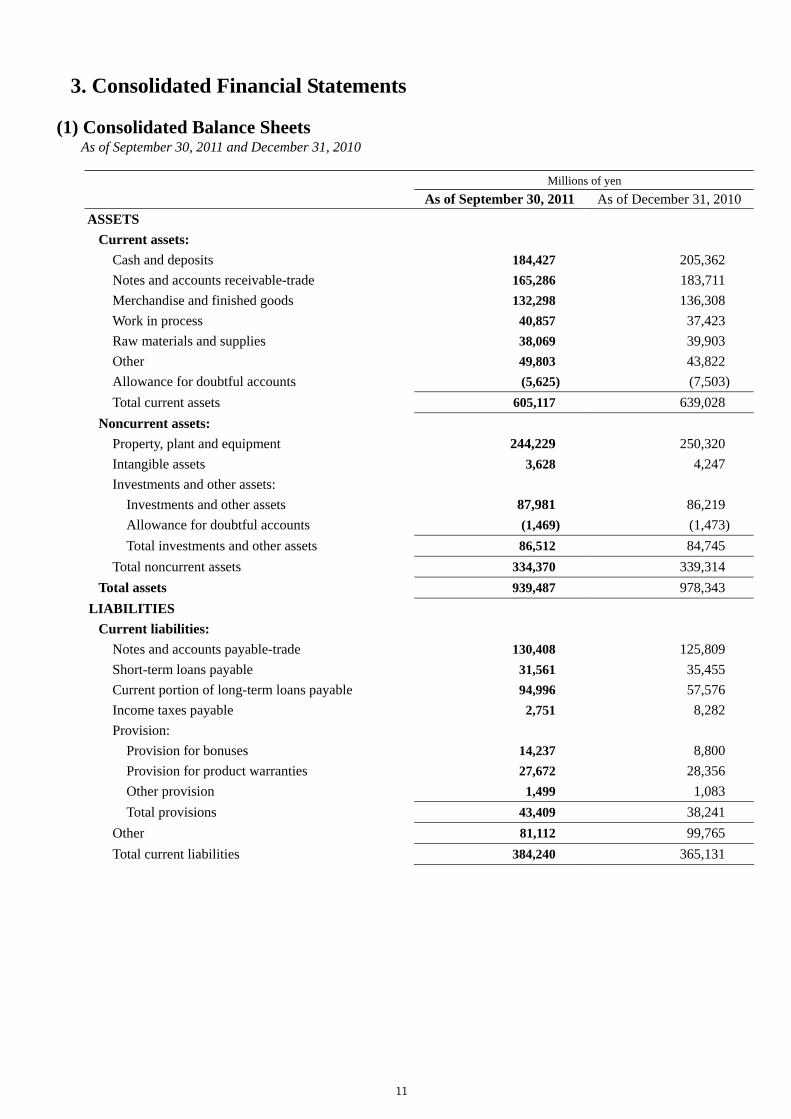
3. Consolidated Financial Statements
(1) Consolidated Balance Sheets As of September 30, 2011 and December 31, 2010
Millions of yen As of September 30, 2011 As of December 31, 2010 ASSETS
Current assets: Cash and deposits 184,427 205,362 Notes and accounts receivable-trade 165,286 183,711 Merchandise and finished goods 132,298 136,308 Work in process 40,857 37,423 Raw materials and supplies 38,069 39,903 Other 49,803 43,822 Allowance for doubtful accounts (5,625) (7,503) Total current assets 605,117 639,028
Noncurrent assets: Property, plant and equipment 244,229 250,320 Intangible assets 3,628 4,247 Investments and other assets:
Investments and other assets 87,981 86,219 Allowance for doubtful accounts (1,469) (1,473) Total investments and other assets 86,512 84,745
Total noncurrent assets 334,370 339,314 Total assets 939,487 978,343
LIABILITIES Current liabilities:
Notes and accounts payable-trade 130,408 125,809 Short-term loans payable 31,561 35,455 Current portion of long-term loans payable 94,996 57,576 Income taxes payable 2,751 8,282 Provision:
Provision for bonuses 14,237 8,800 Provision for product warranties 27,672 28,356 Other provision 1,499 1,083 Total provisions 43,409 38,241
Other 81,112 99,765 Total current liabilities 384,240 365,131
11

Millions of yen As of September 30, 2011 As of December 31, 2010
Noncurrent liabilities: Long-term loans payable 164,788 229,410 Provision:
Provision for retirement benefits 38,693 35,423 Provision for product liabilities 7,292 20,882 Other provision 1,318 1,529 Total provisions 47,304 57,834
Other 14,748 15,156 Total noncurrent liabilities 226,840 302,401
Total liabilities 611,081 667,533 NET ASSETS
Shareholders’ equity: Capital stock 85,666 85,666 Capital surplus 74,582 98,147 Retained earnings 262,505 199,190 Treasury stock (683) (681) Total shareholders’ equity 422,071 382,323
Valuation and translation adjustments: Valuation difference on available-for-sale securities 561 2,719 Revaluation reserve for land 10,186 10,186 Foreign currency translation adjustment (140,073) (120,977) Total valuation and translation adjustments (129,325) (108,070)
Subscription rights to shares 109 102 Minority interests 35,550 36,454 Total net assets 328,406 310,809
Total liabilities and net assets 939,487 978,343
12

(2) Consolidated Statements of Income Nine months ended September 30, 2010 and 2011
Millions of yen
Nine months ended September 30, 2010
(January 1― September 30, 2010)
Nine months ended September 30, 2011
(January 1― September 30, 2011)
Net sales 987,402 985,751
Cost of sales 761,855 763,839
Gross profit 225,547 221,912
Selling, general and administrative expenses 176,773 161,188
Operating income 48,773 60,723
Non-operating income: Interest income 6,743 5,951
Other 16,095 10,945
Total non-operating income 22,839 16,896
Non-operating expenses:
Interest expenses 6,274 5,304
Foreign exchange losses — 2,246
Other 3,944 2,206
Total non-operating expenses 10,219 9,757
Ordinary income 61,394 67,862
Extraordinary income:
Gain on sales of noncurrent assets 418 256
Gain on transfer of business 106 —
Other 3 —
Total extraordinary income 528 256
Extraordinary loss:
Loss on sales of noncurrent assets 140 137 Loss on disposal of noncurrent assets 542 429
Loss on adjustment for changes of accounting standard for asset retirement obligations — 552
Loss on disaster — 314
Other 37 81
Total extraordinary losses 720 1,515
Income before income taxes 61,202 66,602
Income taxes ― current 25,002 20,856 Income taxes ― deferred (1,371) (849)
Total income taxes 23,631 20,007
Income before minority interests — 46,594
Minority interests in income 6,503 6,605
Net income 31,067 39,989
13
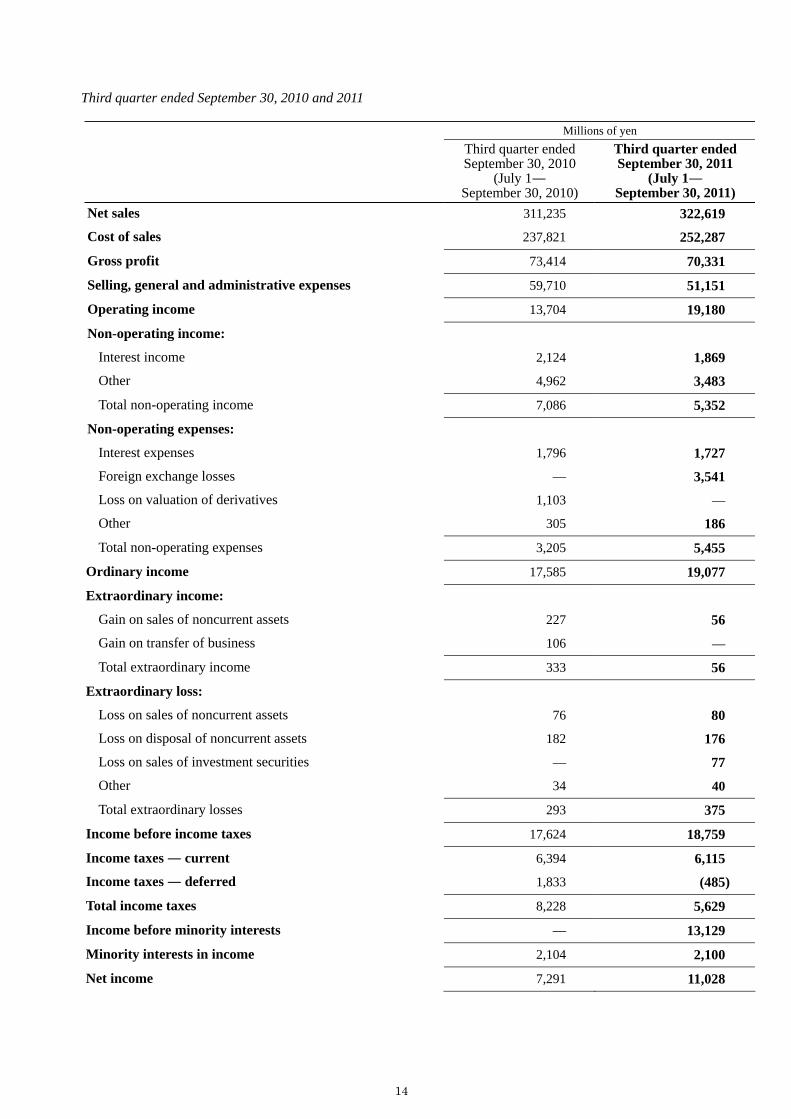
Third quarter ended September 30, 2010 and 2011
Millions of yen
Third quarter ended September 30, 2010
(July 1― September 30, 2010)
Third quarter ended September 30, 2011
(July 1― September 30, 2011)
Net sales 311,235 322,619 Cost of sales 237,821 252,287
Gross profit 73,414 70,331
Selling, general and administrative expenses 59,710 51,151
Operating income 13,704 19,180
Non-operating income:
Interest income 2,124 1,869
Other 4,962 3,483
Total non-operating income 7,086 5,352
Non-operating expenses:
Interest expenses 1,796 1,727
Foreign exchange losses — 3,541
Loss on valuation of derivatives 1,103 —
Other 305 186
Total non-operating expenses 3,205 5,455
Ordinary income 17,585 19,077
Extraordinary income:
Gain on sales of noncurrent assets 227 56
Gain on transfer of business 106 —
Total extraordinary income 333 56
Extraordinary loss: Loss on sales of noncurrent assets 76 80
Loss on disposal of noncurrent assets 182 176
Loss on sales of investment securities — 77
Other 34 40
Total extraordinary losses 293 375
Income before income taxes 17,624 18,759
Income taxes ― current 6,394 6,115
Income taxes ― deferred 1,833 (485)
Total income taxes 8,228 5,629
Income before minority interests — 13,129
Minority interests in income 2,104 2,100
Net income 7,291 11,028
14
(3) Consolidated Statements of Cash Flows
Nine months ended September 30, 2010 and 2011
Millions of yen
Nine months ended September 30, 2010
(January 1― September 30, 2010)
Nine months ended September 30, 2011
(January 1― September 30, 2011)
Net cash provided by (used in) operating activities: Income before income taxes 61,202 66,602 Depreciation and amortization 27,689 24,853 Loss (gain) on transfer of business (106) —
Increase (decrease) in allowance for doubtful accounts (603) (1,304)
Increase (decrease) in provision for retirement benefits 3,146 3,770
Increase (decrease) in provision for product liabilities 410 (13,362) Interest and dividends income (7,353) (6,415) Interest expenses 6,274 5,304
Loss (gain) on sales of property, plant and equipment and intangible assets (278) (119)
Loss (gain) on disposal of property, plant and equipment and intangible assets 542 429
Loss on adjustment for changes of accounting standard for asset retirement obligations — 552
Decrease (increase) in notes and accounts receivable-trade 535 7,844
Decrease (increase) in inventories (3,429) (8,323)
Increase (decrease) in notes and accounts payable-trade 20,474 14,105
Other 10,538 (15,684)
Subtotal 119,045 78,254
Interest and dividends income received 7,750 7,729
Interest expenses paid (6,099) (5,902)
Income taxes (paid) refund (3,466) (26,665)
Net cash provided by (used in) operating activities 117,230 53,416
Net cash provided by (used in) investing activities: Payments into time deposits (2,254) (1,354) Proceeds from withdrawal of time deposits 1,604 2,891 Purchase of property, plant and equipment and intangible assets (21,816) (31,200)
Proceeds from sales of property, plant and equipment and intangible assets 1,577 871
Proceeds from transfer of business 250 — Other (2,817) (5,230)
Net cash provided by (used in) investing activities (23,455) (34,022)
15

Millions of yen
Nine months ended September 30, 2010
(January 1― September 30, 2010)
Nine months ended September 30, 2011
(January 1― September 30, 2011)
Net cash provided by (used in) financing activities: Increase (decrease) in short-term bank loans and commercial papers (45,456) (810)
Proceeds from long-term loans payable 20,472 10,032 Repayment of long-term loans payable (38,375) (36,964) Proceeds from issuance of common stock 74,647 — Decrease (increase) in treasury stock (2) (1) Cash dividends paid to minority shareholders (3,750) (4,924) Other (208) (293) Net cash provided by (used in) financing activities 7,326 (32,962)
Effect of exchange rate change on cash and cash equivalents (5,093) (6,282)
Net increase (decrease) in cash and cash equivalents 96,007 (19,850)
Cash and cash equivalents at beginning of period 137,219 203,878
Increase in cash and cash equivalents from newly consolidated subsidiary 68 97
Cash and cash equivalents at end of period 233,295 184,125
16

(4) Notes Regarding Going-concern Assumptions
None (5) Segment Information
Business segment information
Third quarter ended September 30, 2010 (July 1, 2010 through September 30, 2010)
Millions of yen
Motorcycles Marine products
Power products
Other products Total Eliminations Consolidated
Net sales:
Outside customers 211,849 37,718 30,652 31,015 311,235 — 311,235
Intersegment — — — 19,968 19,968 (19,968) —
Total 211,849 37,718 30,652 50,984 331,204 (19,968) 311,235
Operating income (loss) 11,935 (468) (3,012) 5,250 13,704 0 13,704
Notes: 1. Business segments correspond to categories classified primarily by similarity of products and markets. 2. Major products in each business segment:
Business segment Major products
Motorcycles Motorcycles and knockdown parts for overseas production
Marine products Outboard motors, personal watercraft, boats, FRP pools, fishing boats, utility boats and diesel engines
Power products All-terrain vehicles, side-by-side vehicles, snowmobiles, golf cars, generators, small-sized snow throwers and multi-purpose engines
Other products Surface mounters, industrial robots, automobile engines, automobile components, electrically power assisted bicycles, unmanned industrial helicopters, electrically powered wheelchairs and the intermediate parts for products in all business segments
Nine months ended September 30, 2010 (January 1, 2010 through September 30, 2010)
Millions of yen
Motorcycles Marine products
Power products
Other products Total Eliminations Consolidated
Net sales:
Outside customers 688,337 133,534 75,058 90,471 987,402 — 987,402
Intersegment — — — 61,110 61,110 (61,110) —
Total 688,337 133,534 75,058 151,582 1,048,513 (61,110) 987,402
Operating income (loss) 38,014 3,698 (7,170) 14,231 48,773 0 48,773
Notes: 1. Business segments: Classified in the same way as for the third quarter ended September 30, 2010. 2. Major products in each business segment: The same as those listed above for the third quarter ended September 30, 2010.
17

Geographical segment information Third quarter ended September 30, 2010 (July 1, 2010 through September 30, 2010)
Millions of yen
Japan North America Europe Asia Others Total Eliminations Consolidated
Net sales:
Outside customers 55,446 38,260 33,905 147,649 35,973 311,235 — 311,235
Intersegment 82,738 4,943 649 11,133 429 99,894 (99,894) —
Total 138,185 43,203 34,555 158,783 36,402 411,130 (99,894) 311,235
Operating income (loss) (33) (5,261) 608 14,626 4,134 14,074 (369) 13,704
Notes: 1. Geographical segments are groupings of nations and regions, primarily based on geographical proximity. 2. Nations and regions included in segments outside Japan: (1) North America: U.S.A. and Canada (2) Europe: The Netherlands, France, Italy, Spain and Russia (3) Asia: Indonesia, Vietnam, Thailand, Taiwan, China, Singapore and India (4) Others: Brazil, Australia, Colombia and Mexico
Nine months ended September 30, 2010 (January 1, 2010 through September 30, 2010)
Millions of yen
Japan North America Europe Asia Others Total Eliminations Consolidated
Net sales:
Outside customers 164,645 124,911 134,490 460,175 103,180 987,402 — 987,402
Intersegment 241,724 11,167 2,308 33,861 878 289,939 (289,939) —
Total 406,369 136,078 136,798 494,037 104,058 1,277,341 (289,939) 987,402
Operating income (loss) 706 (8,590) 3,147 46,454 6,402 48,120 653 48,773
Notes: 1. Geographical segments are groupings of nations and regions, primarily based on geographical proximity. 2. Nations and regions included in segments outside Japan: The same as the areas listed above for the third quarter ended September 30,
2010.
18

Overseas sales
Third quarter ended September 30, 2010 (July 1, 2010 through September 30, 2010)
Millions of yen
North America Europe Asia Others Total
I. Overseas sales 38,487 35,163 156,504 45,117 275,273
II. Consolidated sales 311,235
III. Percentage of overseas sales to consolidated sales 12.4% 11.3% 50.3% 14.4% 88.4%
Notes: 1. Overseas segments are groupings of nations and regions, primarily based on geographical proximity. 2. Nations and regions included in segments outside Japan:
(1) North America: U.S.A. and Canada (2) Europe: France, Italy, Germany, UK and Russia (3) Asia: Indonesia, Vietnam, Thailand, China, Taiwan and India (4) Others: Brazil, Australia and South Africa
3. Overseas sales consist of export sales of the Company and its domestic consolidated subsidiaries, and sales (other than exports to Japan) of its foreign consolidated subsidiaries.
Nine months ended September 30, 2010 (January 1, 2010 through September 30, 2010)
Millions of yen
North America Europe Asia Others Total
I. Overseas sales 126,032 138,074 484,423 130,147 878,677
II. Consolidated sales 987,402
III. Percentage of overseas sales to consolidated sales 12.8% 14.0% 49.1% 13.1% 89.0%
Notes: 1. Overseas segments are groupings of nations and regions, primarily based on geographical proximity. 2. Nations and regions included in segments outside Japan: The same as the areas listed above for the third quarter ended September 30,
2010. 3. Overseas sales consist of export sales of the Company and its domestic consolidated subsidiaries, and sales (other than exports to
Japan) of its foreign consolidated subsidiaries.
19
Segment Information
1. Overview of reporting segments
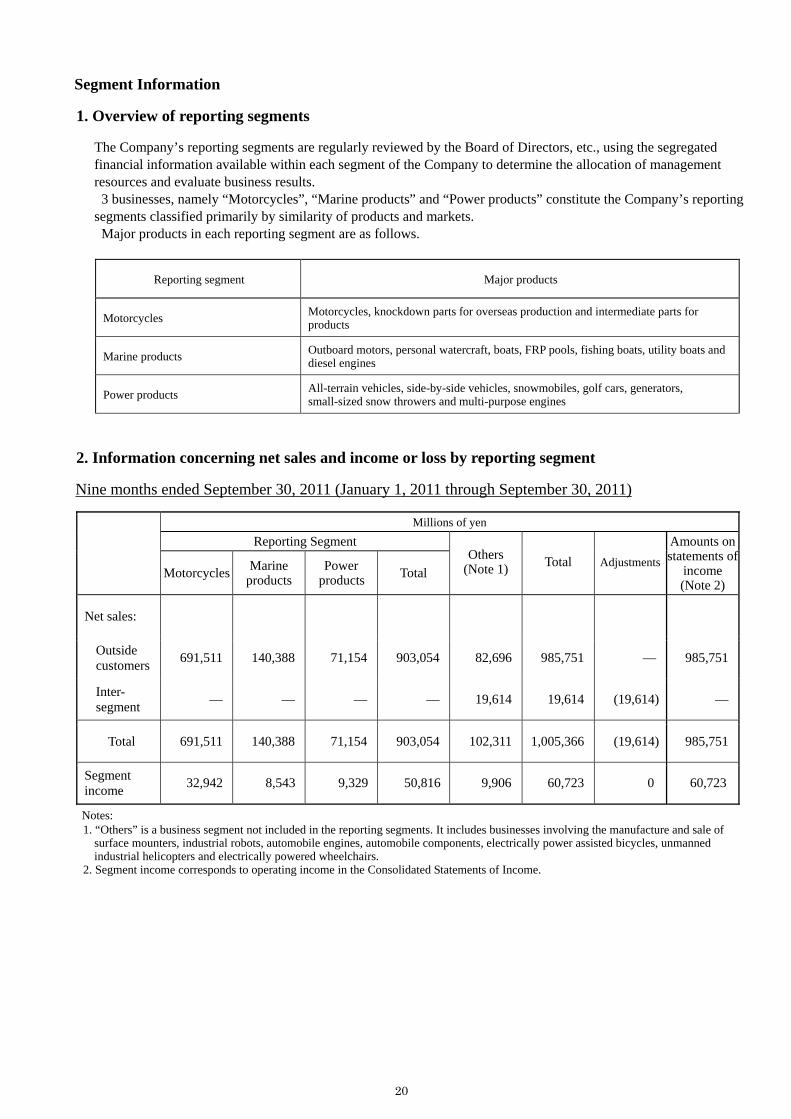
The Company’s reporting segments are regularly reviewed by the Board of Directors, etc., using the segregated financial information available within each segment of the Company to determine the allocation of management resources and evaluate business results. 3 businesses, namely “Motorcycles”, “Marine products” and “Power products” constitute the Company’s reporting segments classified primarily by similarity of products and markets. Major products in each reporting segment are as follows.
Reporting segment Major products
Motorcycles Motorcycles, knockdown parts for overseas production and intermediate parts for products
Marine products Outboard motors, personal watercraft, boats, FRP pools, fishing boats, utility boats and diesel engines
Power products All-terrain vehicles, side-by-side vehicles, snowmobiles, golf cars, generators, small-sized snow throwers and multi-purpose engines
2. Information concerning net sales and income or loss by reporting segment
Nine months ended September 30, 2011 (January 1, 2011 through September 30, 2011)
Millions of yen Reporting Segment
Motorcycles Marine
products Power
products Total Others
(Note 1) Total Adjustments
Amounts on statements of
income (Note 2)
Net sales:
Outside customers 691,511 140,388 71,154 903,054 82,696 985,751 — 985,751
Inter- segment — — — — 19,614 19,614 (19,614) —
Total 691,511 140,388 71,154 903,054 102,311 1,005,366 (19,614) 985,751
Segment income 32,942 8,543 9,329 50,816 9,906 60,723 0 60,723
Notes: 1. “Others” is a business segment not included in the reporting segments. It includes businesses involving the manufacture and sale of
surface mounters, industrial robots, automobile engines, automobile components, electrically power assisted bicycles, unmanned industrial helicopters and electrically powered wheelchairs.
2. Segment income corresponds to operating income in the Consolidated Statements of Income.
20
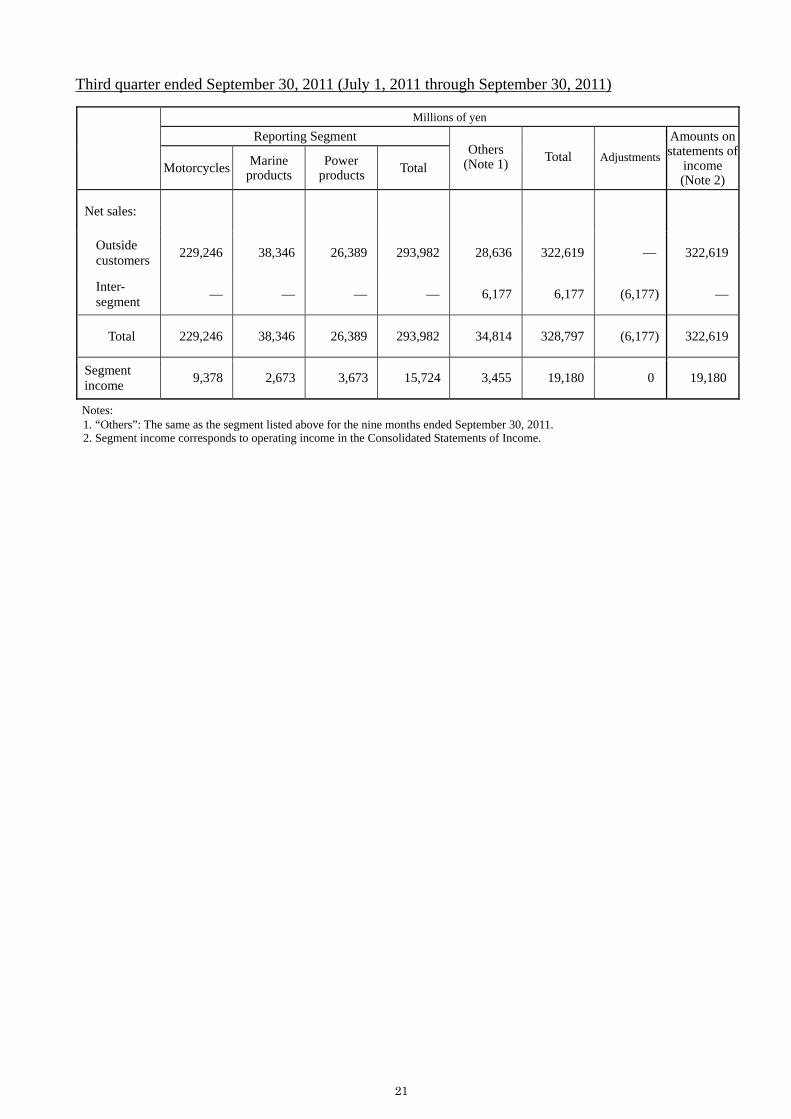
Third quarter ended September 30, 2011 (July 1, 2011 through September 30, 2011)
Millions of yen Reporting Segment
Motorcycles Marine
products Power
products Total Others
(Note 1) Total Adjustments
Amounts on statements of
income (Note 2)
Net sales:
Outside customers 229,246 38,346 26,389 293,982 28,636 322,619 — 322,619
Inter- segment — — — — 6,177 6,177 (6,177) —
Total 229,246 38,346 26,389 293,982 34,814 328,797 (6,177) 322,619
Segment income 9,378 2,673 3,673 15,724 3,455 19,180 0 19,180
Notes: 1. “Others”: The same as the segment listed above for the nine months ended September 30, 2011. 2. Segment income corresponds to operating income in the Consolidated Statements of Income.
21

(Additional Information) Beginning in the first quarter of the fiscal year ending December 31, 2011, the Company has applied “Revised Accounting Standard for Disclosures about Segments of an Enterprise and Related Information” (ASBJ Statement No. 17, March 27, 2009) and “Guidance on Accounting Standard for Disclosures about Segments of an Enterprise and Related Information” (ASBJ Guidance No.20, March 21, 2008).
Segment information for the third quarter and first nine months of the previous year presented based on this accounting standard is as follows.
Information concerning net sales and income or loss by reporting segment
Nine months ended September 30, 2010 (January 1, 2010 through September 30, 2010)
Millions of yen Reporting Segment
Motorcycles Marine
products Power
products Total Others (Note) Total Adjustments
Amounts on statements of
income
Net sales:
Outside customers
694,451 133,534 75,058 903,044 84,357 987,402 — 987,402
Inter- segment
— — — — 20,876 20,876 (20,876) —
Total 694,451 133,534 75,058 903,044 105,234 1,008,279 (20,876) 987,402
Segment income (loss)
42,751 3,698 (7,170) 39,279 9,494 48,773 0 48,773
Note: “Others” is a business segment not included in the reporting segments. It includes businesses involving the manufacture and sale of surface mounters, industrial robots, automobile engines, automobile components, electrically power assisted bicycles, unmanned industrial helicopters and electrically powered wheelchairs.
Third quarter ended September 30, 2010 (July 1, 2010 through September 30, 2010)
Millions of yen Reporting Segment
Motorcycles Marine
products Power
products Total Others (Note) Total Adjustments
Amounts on statements of
income
Net sales:
Outside customers
213,978 37,718 30,652 282,349 28,886 311,235 — 311,235
Inter- segment
— — — — 6,704 6,704 (6,704) —
Total 213,978 37,718 30,652 282,349 35,590 317,940 (6,704) 311,235
Segment income (loss)
13,186 (468) (3,012) 9,705 3,998 13,704 0 13,704
Note: “Others”: The same as the segment listed above for the nine months ended September 30, 2010.
22

(Reference Information)
Geographical segment information
Nine months ended September 30, 2011 (January 1, 2011 through September 30, 2011)
Millions of yen
Japan North America Europe Asia Others Total Eliminations Consolidated
Net sales:
Outside customers 157,833 125,239 118,213 465,265 119,199 985,751 — 985,751
Intersegment 223,072 12,309 3,794 41,114 864 281,155 (281,155) —
Total 380,906 137,548 122,008 506,380 120,063 1,266,907 (281,155) 985,751
Operating income (loss) (6,557) 9,399 1,494 43,982 11,565 59,884 839 60,723
Notes: 1. Geographical segments are groupings of nations and regions, primarily based on geographical proximity. 2. Nations and regions included in segments outside Japan:
(1) North America: U.S.A. and Canada (2) Europe: The Netherlands, France, Italy, Spain and Russia (3) Asia: Indonesia, Thailand, Vietnam, China, Taiwan, Singapore and India (4) Others: Brazil, Australia, Colombia and Mexico
(6) Notes in the Event of Material Changes in the Amount of Shareholders’ Equity
In accordance with a resolution at the 76th Ordinary General Meeting of Shareholders held on March 24, 2011, the Company has reduced the amounts of legal capital surplus and legal retained earnings by ¥23,814 million and ¥3,775 million, respectively, transferred the amounts to other capital surplus and retained earnings brought forward, respectively, and transferred ¥23,565 million in other capital surplus to retained earnings brought forward in order to dispose of deficits, in the first quarter of the fiscal year ending December 31, 2011.
(7) Other Notes
(Note to consolidated statements of income)
Nine months ended September 30, 2011 (January 1, 2011 through September 30, 2011)
Losses resulting from the Great East Japan Earthquake of March 2011 are recorded in “Loss on disaster” reported under extraordinary loss. These losses are principally expenses relating to repair of damaged assets, relief support for business partners affected by the earthquake and relief supplies for the stricken areas.
23


![YEAR BOOK 2011-12ead.gov.pk/ead/userfiles1/file/Year Books/Year book 2011... · 2018-01-12 · Year Book 2011-12 Introduction Economic Affairs Division [EAD] is responsible for assessment](https://img.pdfslide.us/doc/110x75/5e7691a2c28d3e176d383c76/year-book-2011-12eadgovpkeaduserfiles1fileyear-booksyear-book-2011-2018-01-12.jpg)