Embed Size (px)
Citation preview
1
2
Disclaimer
The ‘IICA-GIZ Corporate Social Responsibility Initiative' project that funded this study would like to point out that the research organization, ‘Foundation for MSME Clusters’ (FMC), was free to formulate its own assessment. The project did not research or verify the contents of the information contained in this report. Institutions/ Associations/ Other organisation details provided in the report are for the purpose of information only and do not constitute an endorsement from the IICA-GIZ CSR Project.
Year of publication: 2011
3
Macro structure of the report
This report is divided into two sections- Section A and Section B. Section A Methodology for identifying the economically significant and energy,
environmentally and socially sensitive clusters in India along with the quantified findings of the study
Section B Detailed report on 11 sub-sectors as identified in section A viz i. Foundry
ii. Sponge iron iii. Leather tanning iv. Textiles v. Dyes and chemicals
vi. Electroplating vii. Brick Kiln
viii. Ceramics ix. Glassware x. Cement plants
xi. Paper industry These reports discuss about the economic significance, production process, environmental and social issues, institutions which have intervened so far in these sub-sectors cluster level intervention through some scheme and bibliography
4
ACKNOWLEDGEMENTS The ‘Foundation for MSME Clusters’ (FMC) and the ‘IICA-GIZ CSR Initiative’ have entered into a partnership towards attaining an understanding for the business responsibility (BR) scenario with respect to MSME Clusters in India in order to identify and devise appropriate models of interventions to enable the MSMEs become responsible and competitive for sustainable development. The study builds on the work already undertaken by a range of institutions, national and international. The pollution control norms set up by ‘Central Pollution Control Board’ were very helpful in categorising the industries with respect to their environment intensity and we acknowledge the same. Various development initiatives taken by different national and international agencies also provided us benchmarks and understanding the scope for energy reduction in different sub-sectors. We also acknowledge various academicians and practitioners whose knowledge and expertise gave us an insight into different environment, social issues and energy intensity in different sub-sectors. We are sincerely thankful to Institute of Indian Foundry men, The Energy and Resource Institute, Sponge Iron Manufactures Association, Office of Textiles Commissioner (Ministry of Textiles), MSME–DI Ahmadabad, MSME DI – Hyderabad, Central Glass and Ceramics Research Institute, All India Small Agro and Recycled Paper Association, Central Pulp and Paper Research Institute, All India Brick Manufactures Federation, Metal Finishers Association of Faridabad and All India Hides and Leather Tanners and Merchant Association for sharing their valuable time and insight on this issue.
The role of Mr. N. Ramamurthi, a renowned national expert for providing inputs on foundry clusters, Mr. A. Sahasranamam, Mr.M. Viswanathan for leather tanneries, Mr. Vijay Kumar on textiles (National Institute of Fashion Technology), Mr. Vijay Kumar (MSME DI – Indore) on Dyes and Chemicals, Mr. S. Bhattarcharjee (West Bengal Sponge Iron Manufactures Association), Mr. N. Verma (Orissa Sponge Iron Manufacturers Association) and Mr. S.K. Mazumdar on Sponge Iron, Mr. Abdul Jalil (MD of Terra Tiles Ceramic Consortium), Dr. Sameer Maithel (Greentech Knowledge Solutions) for the bricks, Mr. Parvinder Pal for foundry and Mr. Mahesh Gulati for textiles deserve our humble appreciation and gratitude.
We are thankful to Dr. Veena Joshi, Senior Advisor at Swiss Agency for Development and Cooperation, Mr. Jitendra Sood, Energy Economist at Bureau of Energy Efficiency, Dr. Arun Kumar, President at Development Alternatives and Mr. Abhay Bakre, Joint Development Commissioner- DCMSME for their valuable suggestions on the study.
A workshop was organized on May 19 2011 to seek further inputs for the study. We are thankful to all the participants and the distinguished panel of speakers that included Mr. Manfred Haebig, Director, Private Sector Development, GIZ., Mr. Manoj Arora, former Director, Indian Institute of Corporate Affairs, Dr. Sameer Maithel, Director, Greentech
5
Knowledge Solutions Pvt. Ltd., Dr. S. Rajamani, Chairman, International Union of Environment (IUE) Commission, Dr. Aditi Haldar, Director, GRI Focal Point- India, Dr. Vijaya Lakshmi, VP& Head of Innovation Systems Branch, Development Alternatives, Mr. Viraf Mehta, Consultant, IIM Bangalore, Dr. Megha Shenoy, Research Director, Resource Optimization Initiative, Dr. Bimal Arora, Technical Advisor, GIZ, Mr. Khurram Naayaab, CSR Strategist, Cairn India Limited, Mr. R C Kesar, Director General, Okhla Garment and Textile Cluster (Okhla Garment and Textile Cluster), Mr. Neeraj Verma, Manager, Energy Efficiency Centre, SIDBI and Mr. Ravi Purewal, Project Director, Sports Goods Foundation of India for providing their valuable inputs. FMC is obliged to Indian Institute of Corporate Affairs (IICA) and Deutsche Gesellschaft für Internationale Zusammenarbeit (GIZ), New Delhi for providing the opportunity to undertake this study and especially to Ms Neha Kumar, Senior Technical Expert for their inputs in conceptualising the study.
The document has been authored by FMC team comprising of Ms Sukanya Banerjee, Deputy General Manager, Mr. Sanjeev Kumar Fauzdar, Consultant and Ms Neetu Goel, Manager. We also express our special gratitude to Mr. Sudhir Rana (Project Advisor) for sparing his time and giving valuable inputs and suggestions building the study report.
The authors bear all responsibility for facts presented, errors and omissions as well as value judgments passed, if any.
Mukesh Gulati Executive Director
6
FOREWORD Climate change is a major issue currently that affects and is affected by the business enterprises, small and large. The socio-economic significance of MSMEs in India is well known in terms of output, employment and exports. MSMEs have also led to increased pollution, excessive fossil fuel based energy consumption also creating adverse social implications for communities around several towns and cities where they are co-located in large numbers. However, MSMEs being widespread and most of them not being registered, prove to be a statistical challenge for policy makers and experts to estimate their positive and negative impact.
Government of India and judiciary have in the past taken special measures to control pollution and combat relevant social issues across different sub-sectors including leather, textiles, metal working, dyes & chemicals among various other sub-sectors. Beyond the regulatory regime, the global and domestic buyers are now increasingly basing their sourcing decisions not only on traditional commercial considerations such as price, quality and delivery commitments, but also on compliance with social and environmental norms in the workplace, covering, for instance, health and safety, social equity in employment and production, and ecological compatibility of products and processes. There is thus a clear business case for MSMEs to differentiate themselves to improve their profitability and also meet regulatory requirements. Promoting responsible business practices among MSMEs now necessitates a multipronged approach which should include facilitating MSMEs to recognize the business case and then go beyond. This study is unique since it attempts to map the quantum of energy consumed and pollution created, wherever possible by different sub-sectors identified. It further maps the major cluster towns where MSMEs from the same sub-sector are aggregated. The National Voluntary Guidelines (NVGs) instituted by the Ministry of Corporate Affairs clearly advocates the need for catalysing adoption of responsible business practices through multi-stakeholder initiatives with industry associations leading the change through public private partnership mode. The adoption of suggested methodology has shown encouraging results in select foundry clusters under the IICA-GIZ CSR initiative where Samalkha, Faridabad and Kaithal clusters in Haryana have built on business case initially through gains from energy reduction to expand into other areas such as tree plantation, health camps for workers, adoption of occupational, health & safety practices and recycling of solid waste generated in the clusters. This is sustainably undertaken by the local industry associations empowered through the initiative. There is scope to replicate and upscale similar initiatives across various other sub-sectors identified under this study. The public agencies responsible for MSME development as well as large enterprises may catalyze the process further by supporting collective initiatives of the MSMEs in clusters. The capacities of the MSME associations and market based business development

7
service providers should be built to help them undertake such collective initiatives. This study identifies all the major environmentally relevant clusters along with their economic and social contribution so that prioritisation becomes feasible for improving efficiency and effectiveness of the development initiatives in future. Moreover, it provides a list of previous initiatives that have already been undertaken by different institutions that can be scaled up using the cluster based approach. The banks and financial institutions will need to supplement the development initiatives by meeting the unique credit requirements of MSMEs through creation of special financial products that help the enterprises to become more responsible sustainably using business case.
Name of IICA person
8
Table of Contents Section Topic Page No. List of Tables List of Figures List of Abbreviations Executive Summary
Section – A
Chapter A1 Significance of MSMEs with Special Reference to Economic, Energy and Environmental Aspects
1.1 Significance of MSMEs in India 1.2
Selection of Significant industrial sectors in India based on contribution to economic development and energy intensity
1.3 Energy intensity of select sectors 1.4 Selection of significant sub-sectors Chapter A2 Selection of energy intensive and economically sensitive clusters 2.1 Understanding clusters 2.2 Geographical Expanse of the selected clusters 2.3 Energy, environmental and social issues prevalent in existing clusters Chapter A3 Economic Significance and Major BR Issues in Select Sub-sectors
3.1 Introduction 3.2 Economic significance of sub- sectors 3.3 Social schemes at cluster level 3.4 Energy intensity in the subsectors 3.5 Environmental issues in the sub-sector 3.6 Social issues in the sub-sector 3.7 Addressing the identified BR issues
Chapter A4 Way Forward
Section – B
Chapter - B1 Foundry 1.1 Economic Significance 1.2 Geographical concentration of Foundry Clusters 1.3 Production process 1.4 Energy intensity in Indian foundries 1.5 Environmental Issues in Indian Foundries 1.6 Social Issues in Indian Foundries 1.7 Institutions/Associations 1.8 Cluster Intervention 1.9 Bibliography
Chapter-B2 Sponge Iron 2.1 Economic Significance 2.2 Geographical concentration of Sponge Iron Clusters 2.3 Production Process 2.4 Energy Intensity of Sponge Iron Cluster 2.5 Environmental Issues in Sponge Iron Sector 2.6 Social Issues 2.7 Institutions/Associations
9
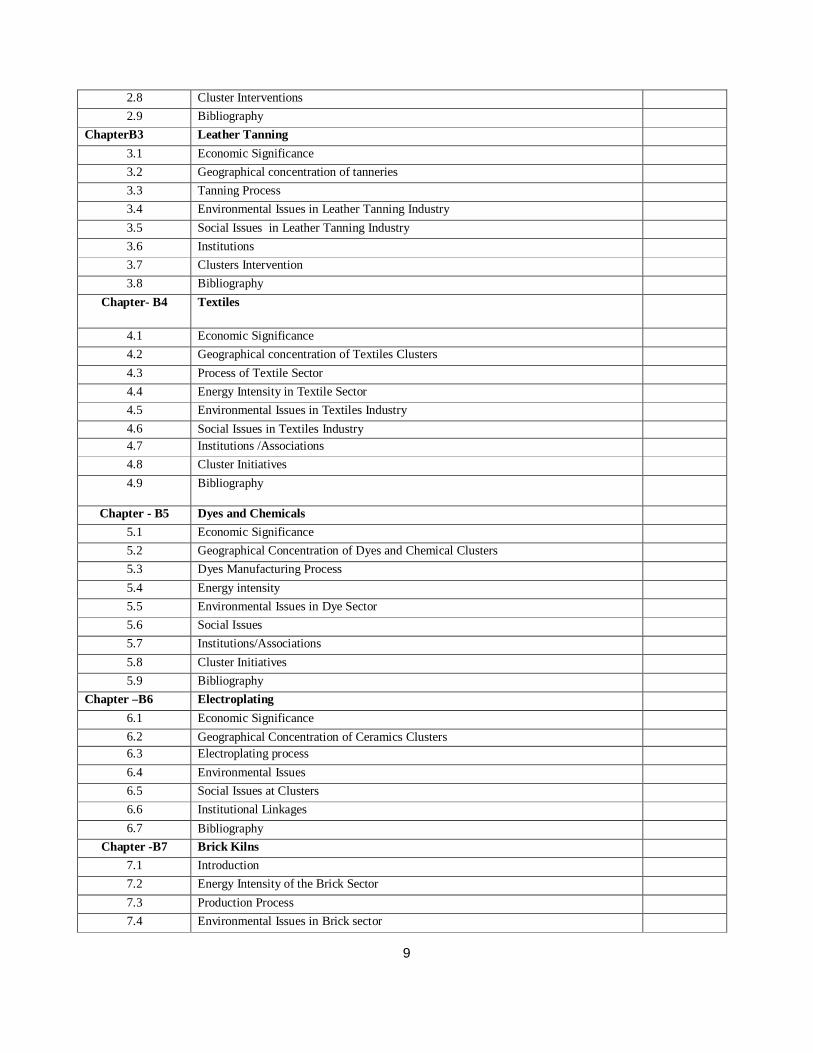
2.8 Cluster Interventions 2.9 Bibliography
ChapterB3 Leather Tanning 3.1 Economic Significance 3.2 Geographical concentration of tanneries 3.3 Tanning Process 3.4 Environmental Issues in Leather Tanning Industry 3.5 Social Issues in Leather Tanning Industry 3.6 Institutions 3.7 Clusters Intervention 3.8 Bibliography
Chapter- B4 Textiles
4.1 Economic Significance 4.2 Geographical concentration of Textiles Clusters 4.3 Process of Textile Sector 4.4 Energy Intensity in Textile Sector 4.5 Environmental Issues in Textiles Industry 4.6 Social Issues in Textiles Industry 4.7 Institutions /Associations 4.8 Cluster Initiatives 4.9 Bibliography
Chapter - B5 Dyes and Chemicals 5.1 Economic Significance 5.2 Geographical Concentration of Dyes and Chemical Clusters 5.3 Dyes Manufacturing Process 5.4 Energy intensity 5.5 Environmental Issues in Dye Sector 5.6 Social Issues 5.7 Institutions/Associations 5.8 Cluster Initiatives 5.9 Bibliography
Chapter –B6 Electroplating 6.1 Economic Significance 6.2 Geographical Concentration of Ceramics Clusters 6.3 Electroplating process 6.4 Environmental Issues 6.5 Social Issues at Clusters 6.6 Institutional Linkages 6.7 Bibliography
Chapter -B7 Brick Kilns 7.1 Introduction 7.2 Energy Intensity of the Brick Sector 7.3 Production Process 7.4 Environmental Issues in Brick sector
10
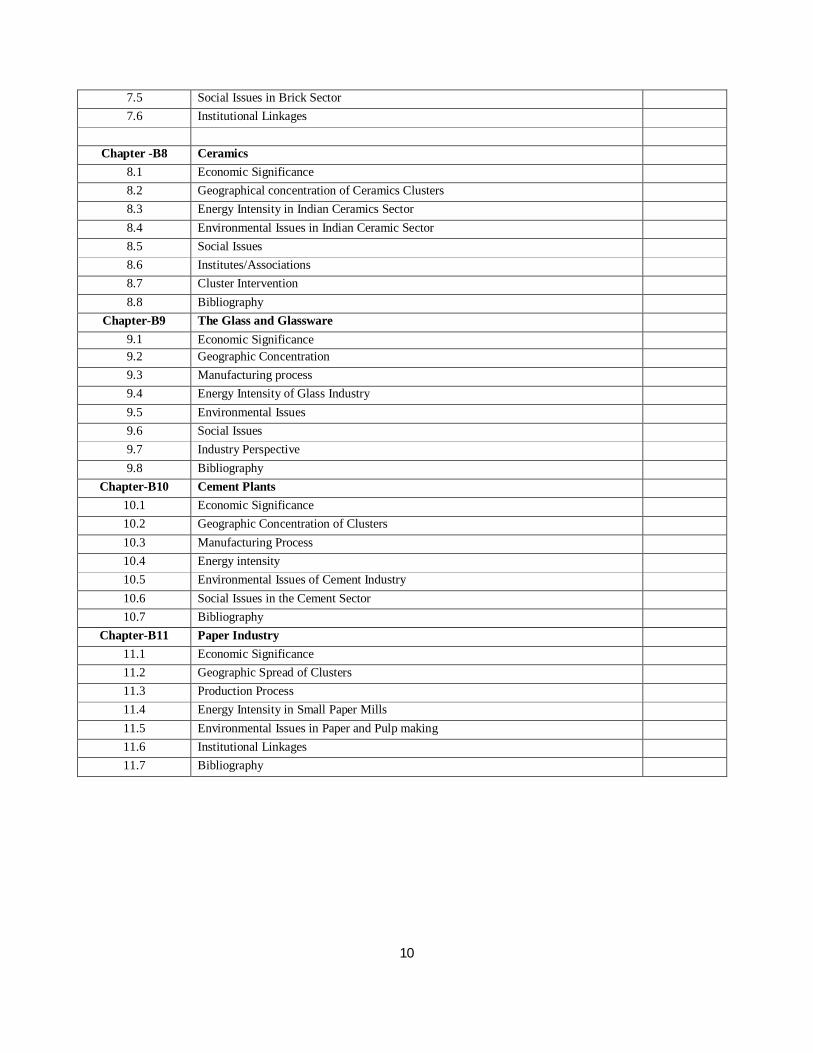
7.5 Social Issues in Brick Sector 7.6 Institutional Linkages
Chapter -B8 Ceramics
8.1 Economic Significance 8.2 Geographical concentration of Ceramics Clusters 8.3 Energy Intensity in Indian Ceramics Sector 8.4 Environmental Issues in Indian Ceramic Sector 8.5 Social Issues 8.6 Institutes/Associations 8.7 Cluster Intervention 8.8 Bibliography
Chapter-B9 The Glass and Glassware 9.1 Economic Significance 9.2 Geographic Concentration 9.3 Manufacturing process 9.4 Energy Intensity of Glass Industry 9.5 Environmental Issues 9.6 Social Issues 9.7 Industry Perspective 9.8 Bibliography
Chapter-B10 Cement Plants 10.1 Economic Significance 10.2 Geographic Concentration of Clusters 10.3 Manufacturing Process 10.4 Energy intensity 10.5 Environmental Issues of Cement Industry 10.6 Social Issues in the Cement Sector 10.7 Bibliography
Chapter-B11 Paper Industry 11.1 Economic Significance 11.2 Geographic Spread of Clusters 11.3 Production Process 11.4 Energy Intensity in Small Paper Mills 11.5 Environmental Issues in Paper and Pulp making 11.6 Institutional Linkages 11.7 Bibliography
11
List of Tables
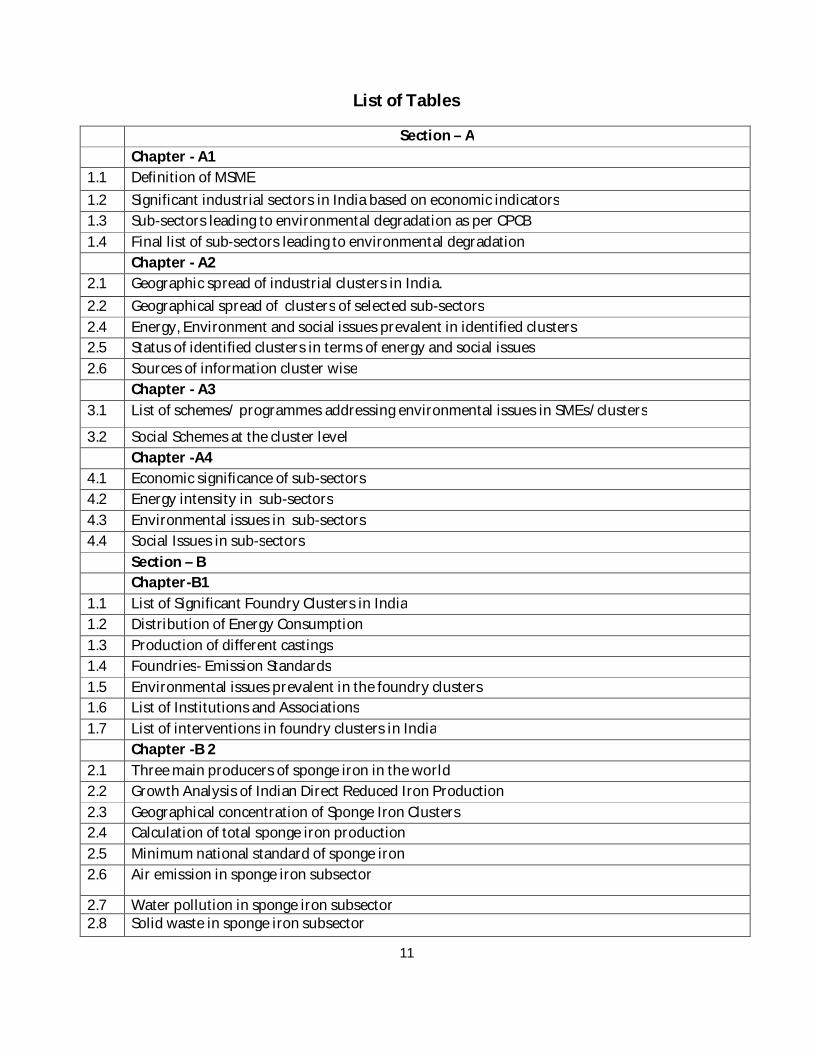
Section – A Chapter - A1 1.1 Definition of MSME 1.2 Significant industrial sectors in India based on economic indicators 1.3 Sub-sectors leading to environmental degradation as per CPCB 1.4 Final list of sub-sectors leading to environmental degradation Chapter - A2 2.1 Geographic spread of industrial clusters in India. 2.2 Geographical spread of clusters of selected sub-sectors 2.4 Energy, Environment and social issues prevalent in identified clusters 2.5 Status of identified clusters in terms of energy and social issues 2.6 Sources of information cluster wise Chapter - A3 3.1 List of schemes/ programmes addressing environmental issues in SMEs/clusters
3.2 Social Schemes at the cluster level Chapter -A4 4.1 Economic significance of sub-sectors 4.2 Energy intensity in sub-sectors 4.3 Environmental issues in sub-sectors 4.4 Social Issues in sub-sectors Section – B Chapter-B1 1.1 List of Significant Foundry Clusters in India 1.2 Distribution of Energy Consumption 1.3 Production of different castings 1.4 Foundries- Emission Standards 1.5 Environmental issues prevalent in the foundry clusters 1.6 List of Institutions and Associations 1.7 List of interventions in foundry clusters in India Chapter -B 2 2.1 Three main producers of sponge iron in the world 2.2 Growth Analysis of Indian Direct Reduced Iron Production 2.3 Geographical concentration of Sponge Iron Clusters 2.4 Calculation of total sponge iron production 2.5 Minimum national standard of sponge iron 2.6 Air emission in sponge iron subsector
2.7 Water pollution in sponge iron subsector 2.8 Solid waste in sponge iron subsector
12
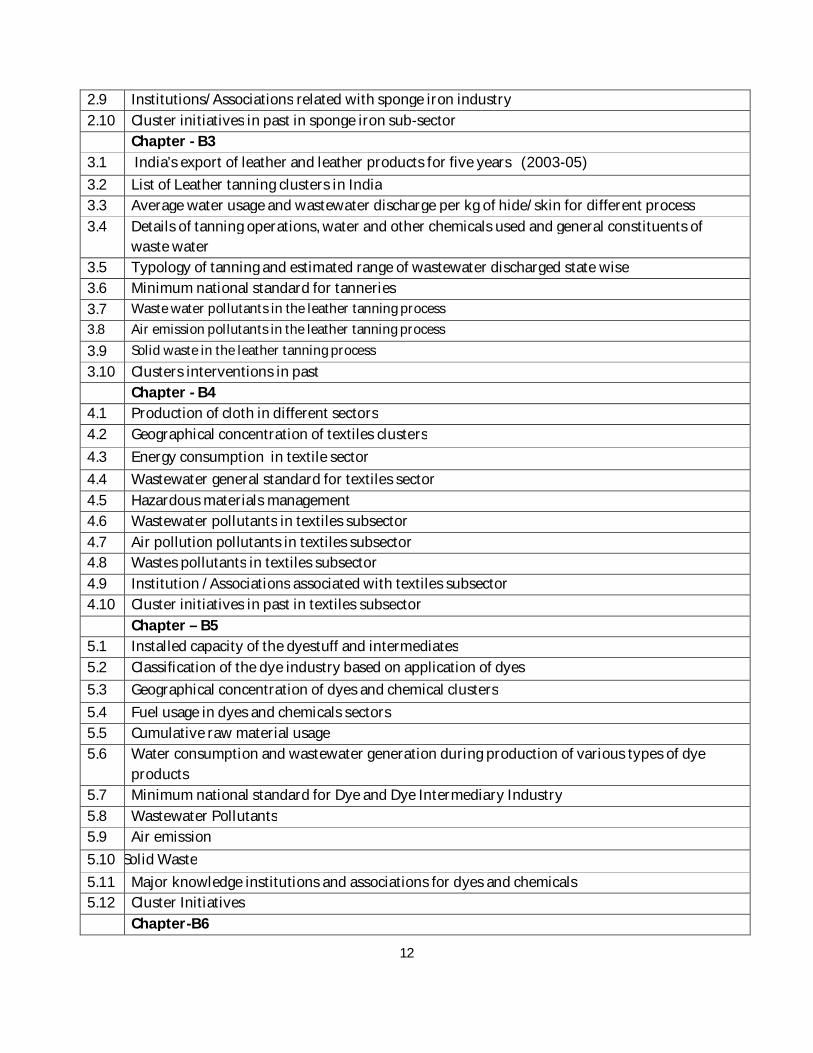
2.9 Institutions/Associations related with sponge iron industry 2.10 Cluster initiatives in past in sponge iron sub-sector Chapter - B3 3.1 India’s export of leather and leather products for five years (2003-05) 3.2 List of Leather tanning clusters in India 3.3 Average water usage and wastewater discharge per kg of hide/skin for different process 3.4 Details of tanning operations, water and other chemicals used and general constituents of
waste water 3.5 Typology of tanning and estimated range of wastewater discharged state wise 3.6 Minimum national standard for tanneries 3.7 Waste water pollutants in the leather tanning process 3.8 Air emission pollutants in the leather tanning process 3.9 Solid waste in the leather tanning process 3.10 Clusters interventions in past Chapter - B4 4.1 Production of cloth in different sectors 4.2 Geographical concentration of textiles clusters 4.3 Energy consumption in textile sector 4.4 Wastewater general standard for textiles sector 4.5 Hazardous materials management 4.6 Wastewater pollutants in textiles subsector 4.7 Air pollution pollutants in textiles subsector 4.8 Wastes pollutants in textiles subsector 4.9 Institution /Associations associated with textiles subsector 4.10 Cluster initiatives in past in textiles subsector Chapter – B5 5.1 Installed capacity of the dyestuff and intermediates 5.2 Classification of the dye industry based on application of dyes 5.3 Geographical concentration of dyes and chemical clusters 5.4 Fuel usage in dyes and chemicals sectors 5.5 Cumulative raw material usage 5.6 Water consumption and wastewater generation during production of various types of dye
products 5.7 Minimum national standard for Dye and Dye Intermediary Industry 5.8 Wastewater Pollutants 5.9 Air emission 5.10 Solid Waste 5.11 Major knowledge institutions and associations for dyes and chemicals 5.12 Cluster Initiatives Chapter-B6

13
6.1 Electroplating clusters in India 6.2 Enterprises in Faridabad 6.3 Effluents from the electroplating industry as per standards of CPCB Chapter-B7 7.1 Brick making clusters in India 7.2 Comparison of kilns: energy use 7.3 Brick kiln in India 7.4 Production of bricks 7.5 Brick kilns: emission standards 7.6 Stack height regulation Chapter-B8 8.1 List of significant ceramics clusters 8.2 Energy consumption by different types of kilns 8.3 Ceramics – emission standards 8.4 Environmental Issues in ceramics sub-sector 8.5 Institutes/Associations of ceramics sub-sector 8.6 Cluster intervention in past in ceramics sub-sector Chapter-B9 9.1 The export of the glass and glassware sector in the past five years (2004-09) 9.2 Standard for industry specific emissions Chapter - B10 10.1 List of mini cement plant clusters in India 10.2 The electrical energy requirements for different sections 10.3 The Emission standards set under CPCB 10.4 Environmental Issues Chapter - B11 11.1 List of paper manufacturing clusters in India 11.2 Energy consumption in Indian paper mills 11.3 The effluent standard of paper industry 11.4 Waste water generation

14
List of Figures
SECTION -B Chapter -B1
1.1 Process flow diagram of a Foundry Industry 1.2 Coke consumption in conventional cupola and DBC with coke having 24% and 12% ash
content Chapter -B2
2.1 Growth trend in the production of sponge iron in India 2.2 Percentage share of gas and coal based units from 1992-93 to 2008-09 2.3 Total carbon emission by sponge iron
Chapter – B3 3.1 Waste water discharged by large and small tanneries (in %) 3.2 Pollution contribution to Indian Tanning Industry
Chapter – B4 4.1 Distribution of fabric units 4.2 Classification of Indian Textiles industry 4.3 Process of Textiles sector 4.4 Heat Consumption
Chapter – B5 5.1 Import and Export of Dyes 5.2 Share of production of large and small units 5.3 Dyes Manufacturing Process
Chapter - B7 7.1 Different types of brick kilns 7.2 Production of Bricks from different type of kilns
Chapter- B8 8.1 Share of organised and unorganised sector in total production of ceramics
8.2a
Share of organised sector in glazed wall, glazed floor, unglazed vitrified, glazed porcelain tiles
8.2b Share of unorganised sector in glazed wall, glazed floor, unglazed vitrified, glazed porcelain tiles
Chapter – B9 9.1a Production of sheet and float glass
9.1(b) Production of fibre glass 9.1(c) Production of bottles and glassware 9.1(d) Production of lab glassware
9.2 The contribution of various product segments of glass industry in 2006-07 Chapter – B10
10.1 Percentage share of different large companies in total production 10.2 Various stages of cement manufacture in dry process

15
16
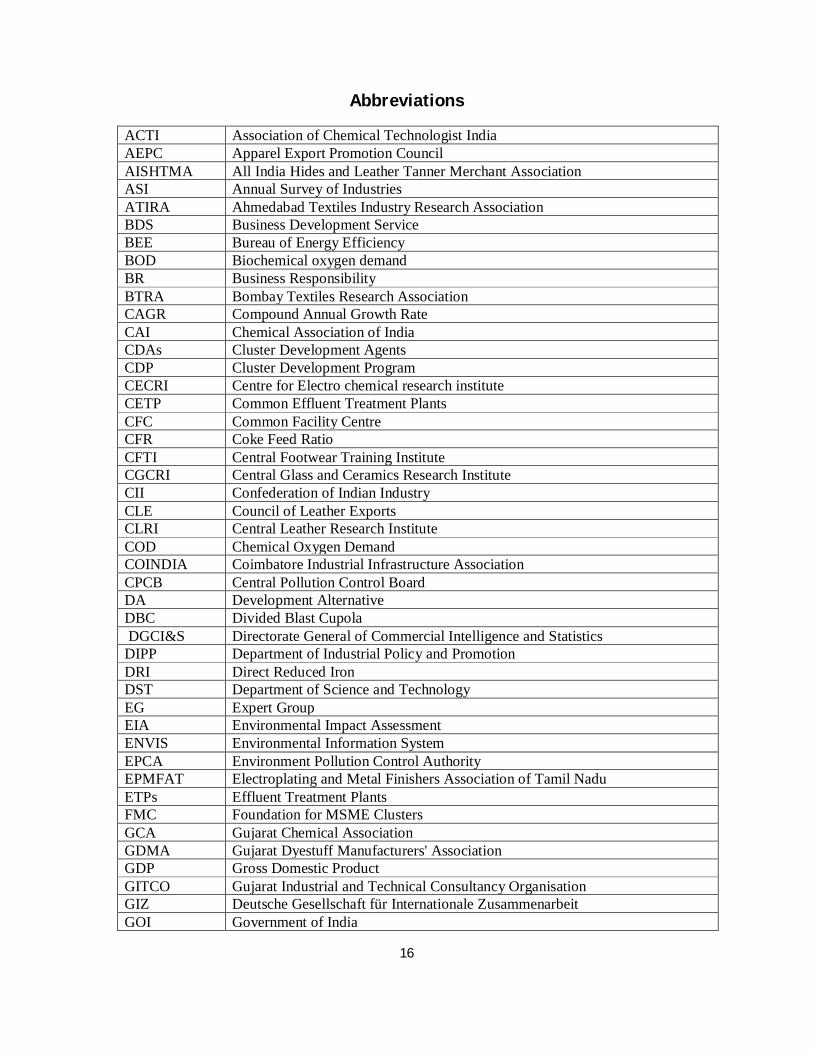
Abbreviations
ACTI Association of Chemical Technologist India AEPC Apparel Export Promotion Council AISHTMA All India Hides and Leather Tanner Merchant Association ASI Annual Survey of Industries ATIRA Ahmedabad Textiles Industry Research Association BDS Business Development Service BEE Bureau of Energy Efficiency BOD Biochemical oxygen demand BR Business Responsibility BTRA Bombay Textiles Research Association CAGR Compound Annual Growth Rate CAI Chemical Association of India CDAs Cluster Development Agents CDP Cluster Development Program CECRI Centre for Electro chemical research institute CETP Common Effluent Treatment Plants CFC Common Facility Centre CFR Coke Feed Ratio CFTI Central Footwear Training Institute CGCRI Central Glass and Ceramics Research Institute CII Confederation of Indian Industry CLE Council of Leather Exports CLRI Central Leather Research Institute COD Chemical Oxygen Demand COINDIA Coimbatore Industrial Infrastructure Association CPCB Central Pollution Control Board DA Development Alternative DBC Divided Blast Cupola DGCI&S Directorate General of Commercial Intelligence and Statistics DIPP Department of Industrial Policy and Promotion DRI Direct Reduced Iron DST Department of Science and Technology EG Expert Group EIA Environmental Impact Assessment ENVIS Environmental Information System EPCA Environment Pollution Control Authority EPMFAT Electroplating and Metal Finishers Association of Tamil Nadu ETPs Effluent Treatment Plants FMC Foundation for MSME Clusters GCA Gujarat Chemical Association GDMA Gujarat Dyestuff Manufacturers' Association GDP Gross Domestic Product GITCO Gujarat Industrial and Technical Consultancy Organisation GIZ Deutsche Gesellschaft für Internationale Zusammenarbeit GOI Government of India
17
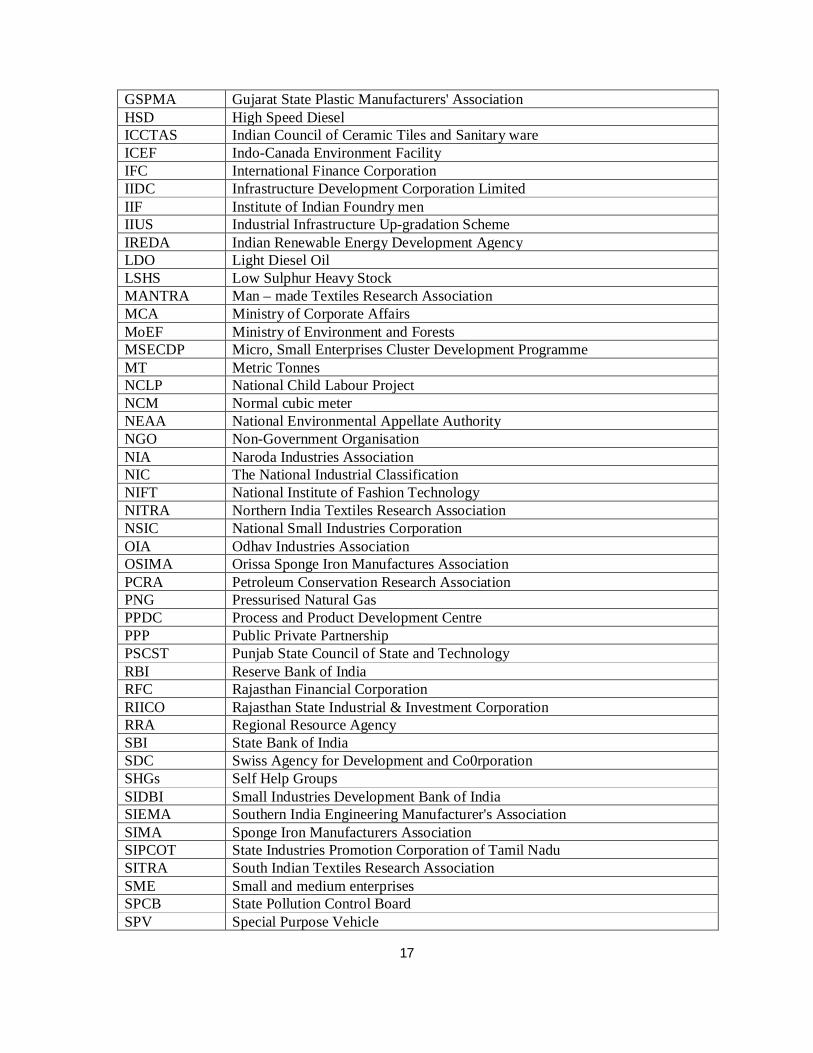
GSPMA Gujarat State Plastic Manufacturers' Association HSD High Speed Diesel ICCTAS Indian Council of Ceramic Tiles and Sanitary ware ICEF Indo-Canada Environment Facility IFC International Finance Corporation IIDC Infrastructure Development Corporation Limited IIF Institute of Indian Foundry men IIUS Industrial Infrastructure Up-gradation Scheme IREDA Indian Renewable Energy Development Agency LDO Light Diesel Oil LSHS Low Sulphur Heavy Stock MANTRA Man – made Textiles Research Association MCA Ministry of Corporate Affairs MoEF Ministry of Environment and Forests MSECDP Micro, Small Enterprises Cluster Development Programme MT Metric Tonnes NCLP National Child Labour Project NCM Normal cubic meter NEAA National Environmental Appellate Authority NGO Non-Government Organisation NIA Naroda Industries Association NIC The National Industrial Classification NIFT National Institute of Fashion Technology NITRA Northern India Textiles Research Association NSIC National Small Industries Corporation OIA Odhav Industries Association OSIMA Orissa Sponge Iron Manufactures Association PCRA Petroleum Conservation Research Association PNG Pressurised Natural Gas PPDC Process and Product Development Centre PPP Public Private Partnership PSCST Punjab State Council of State and Technology RBI Reserve Bank of India RFC Rajasthan Financial Corporation RIICO Rajasthan State Industrial & Investment Corporation RRA Regional Resource Agency SBI State Bank of India SDC Swiss Agency for Development and Co0rporation SHGs Self Help Groups SIDBI Small Industries Development Bank of India SIEMA Southern India Engineering Manufacturer's Association SIMA Sponge Iron Manufacturers Association SIPCOT State Industries Promotion Corporation of Tamil Nadu SITRA South Indian Textiles Research Association SME Small and medium enterprises SPCB State Pollution Control Board SPV Special Purpose Vehicle
18
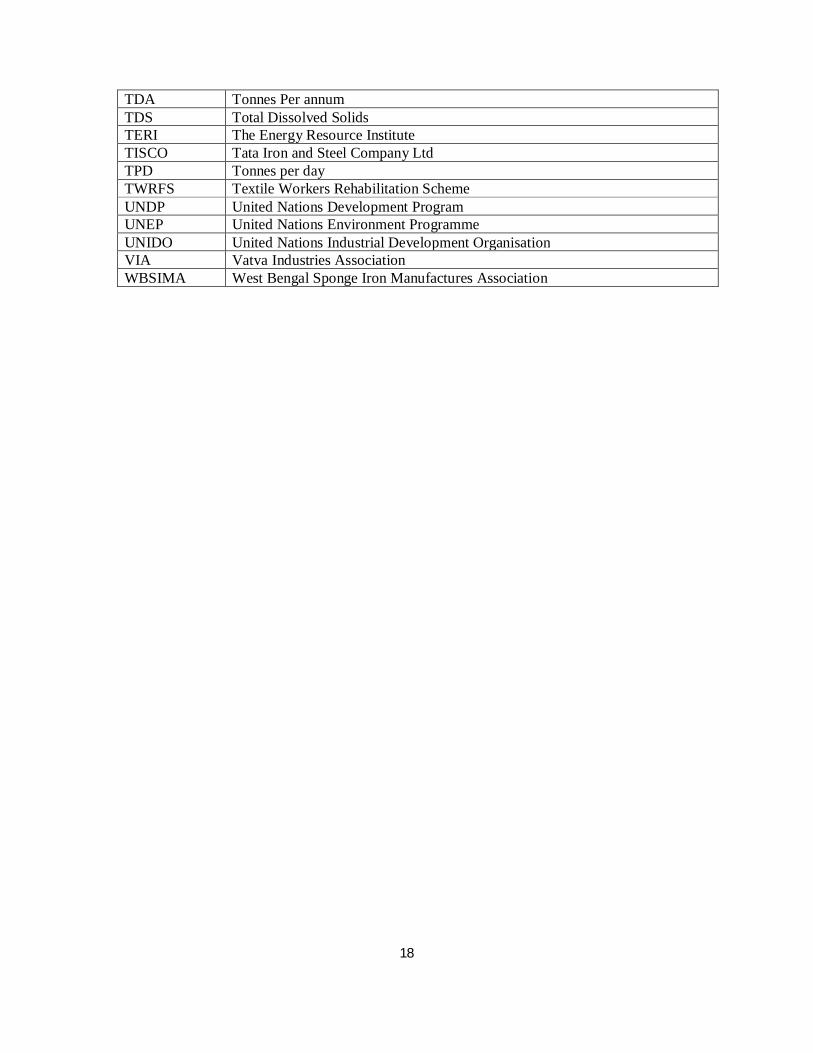
TDA Tonnes Per annum TDS Total Dissolved Solids TERI The Energy Resource Institute TISCO Tata Iron and Steel Company Ltd TPD Tonnes per day TWRFS Textile Workers Rehabilitation Scheme UNDP United Nations Development Program UNEP United Nations Environment Programme UNIDO United Nations Industrial Development Organisation VIA Vatva Industries Association WBSIMA West Bengal Sponge Iron Manufactures Association

19
Executive Summary
i. Economic significance of MSMEs: Worldwide micro, small and medium enterprises (MSMEs) have been recognised as engines of economic growth. These MSMEs have been instrumental in generating large scale employment, contributing towards rise in incomes of labour and returns to capital; and promoting regional development, touch upon the lives of most vulnerable and marginalised like women, backward community, minorities etc. In India, MSMEs contribute 45 per cent of the manufactured output, 40 per cent of its exports and 8 per cent of country’s GDP. In terms of social impact, MSMEs provide employment to around 60 million people through 26 million enterprises.
ii. MSMEs contribution to environmental degradation and social issues: MSMEs are
known for being a significant contributor to environmental degradation. The pollution per unit of production is generally higher in MSMEs than that of the corresponding large units partly due to use of obsolete technologies and poor management practices, and partly because most of the units do not come under the ambit of regulatory authorities.
iii. Selection of sub-sector based on economic significance, energy intensity and
environment degradation: The National Industrial Classification 2004 (NIC 2004, 2 digit classifications) has classified the manufacturing sector into 23 Divisions (or sectors) under the section ‘Manufacturing’1. However, the economic significance of all the 23 sectors is not uniform and to list out the significant sectors, one needs to look into the sector’s contribution to employment, output, exports and total number of units. Based on the ASI data 2005-06, these 23 sectors are ranked as per their contribution to employment, output and total number of units as shown in the table below. The significance of the sectors are determined on the basis of the ranking, if a sector is ranking between 1 to 10 in three or two of the above mentioned parameters, then it is considered as significant sector. For example, the textile products industry ranks from 1 to 10 for all the three parameters whereas tobacco and related products have a ranking of 7 in terms of employment but more than 10 for the other two parameters.
Apart from employment and output, export is another indicator that determines the economic significance of a sector. The industrial sectors that have been contributing significantly in exports are leather and manufacturers (3.39%), chemicals and related products (20.23%), engineering goods (heavy, medium and light engineering) (36.32%), textile and textile products (18.81%) and gems and jewellery (19.44%). Based on the economic significance, 9 sectors are short listed. The next parameter that is taken for selection of the sectors is energy consumption. The sectors that are economically significant and energy intensive are-
(i) Engineering Goods
1 Ministry of Statistics and Programme Implementation, NIC- 2004.
20
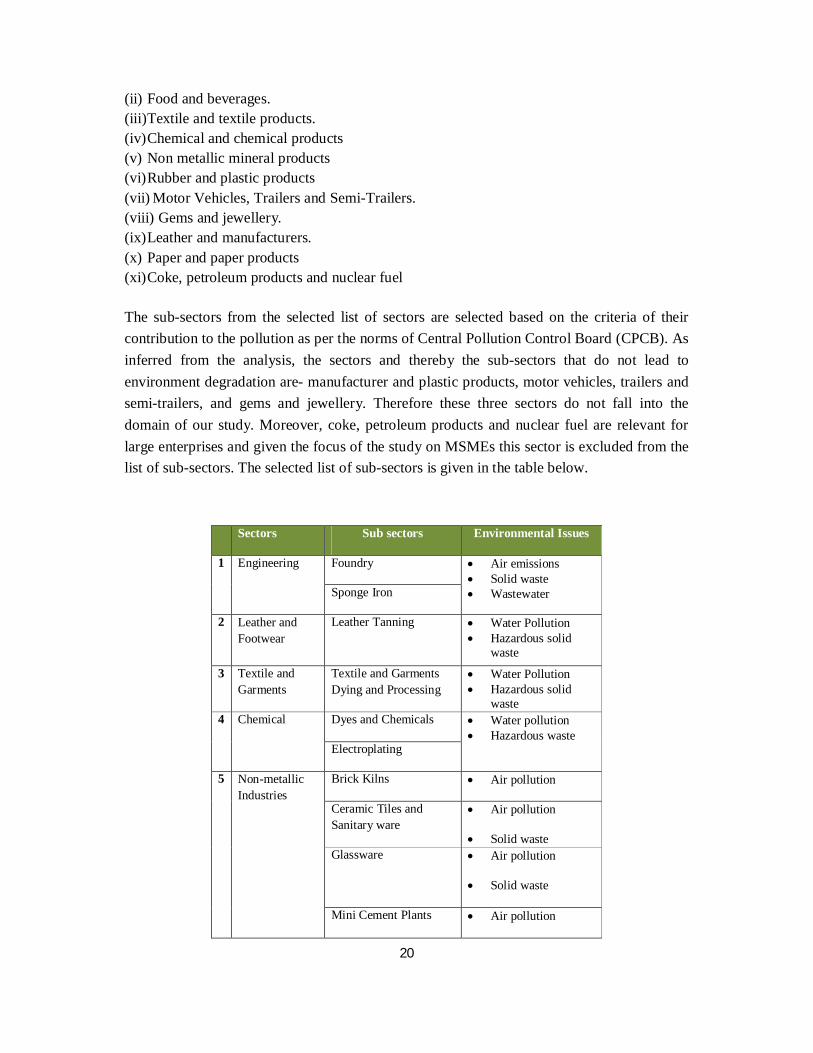
(ii) Food and beverages. (iii)Textile and textile products. (iv) Chemical and chemical products (v) Non metallic mineral products (vi) Rubber and plastic products (vii) Motor Vehicles, Trailers and Semi-Trailers. (viii) Gems and jewellery. (ix) Leather and manufacturers. (x) Paper and paper products (xi) Coke, petroleum products and nuclear fuel The sub-sectors from the selected list of sectors are selected based on the criteria of their contribution to the pollution as per the norms of Central Pollution Control Board (CPCB). As inferred from the analysis, the sectors and thereby the sub-sectors that do not lead to environment degradation are- manufacturer and plastic products, motor vehicles, trailers and semi-trailers, and gems and jewellery. Therefore these three sectors do not fall into the domain of our study. Moreover, coke, petroleum products and nuclear fuel are relevant for large enterprises and given the focus of the study on MSMEs this sector is excluded from the list of sub-sectors. The selected list of sub-sectors is given in the table below.
Sectors Sub sectors Environmental Issues
1 Engineering Foundry Air emissions Solid waste Wastewater Sponge Iron
2 Leather and Footwear
Leather Tanning Water Pollution Hazardous solid
waste
3 Textile and Garments
Textile and Garments Dying and Processing
Water Pollution Hazardous solid
waste 4 Chemical Dyes and Chemicals Water pollution
Hazardous waste Electroplating
5 Non-metallic Industries
Brick Kilns Air pollution
Ceramic Tiles and Sanitary ware
Air pollution
Solid waste Glassware Air pollution
Solid waste
Mini Cement Plants Air pollution
21
6 Paper and Paper Products
Paper Industry Air pollution Water Pollution Bio diversity
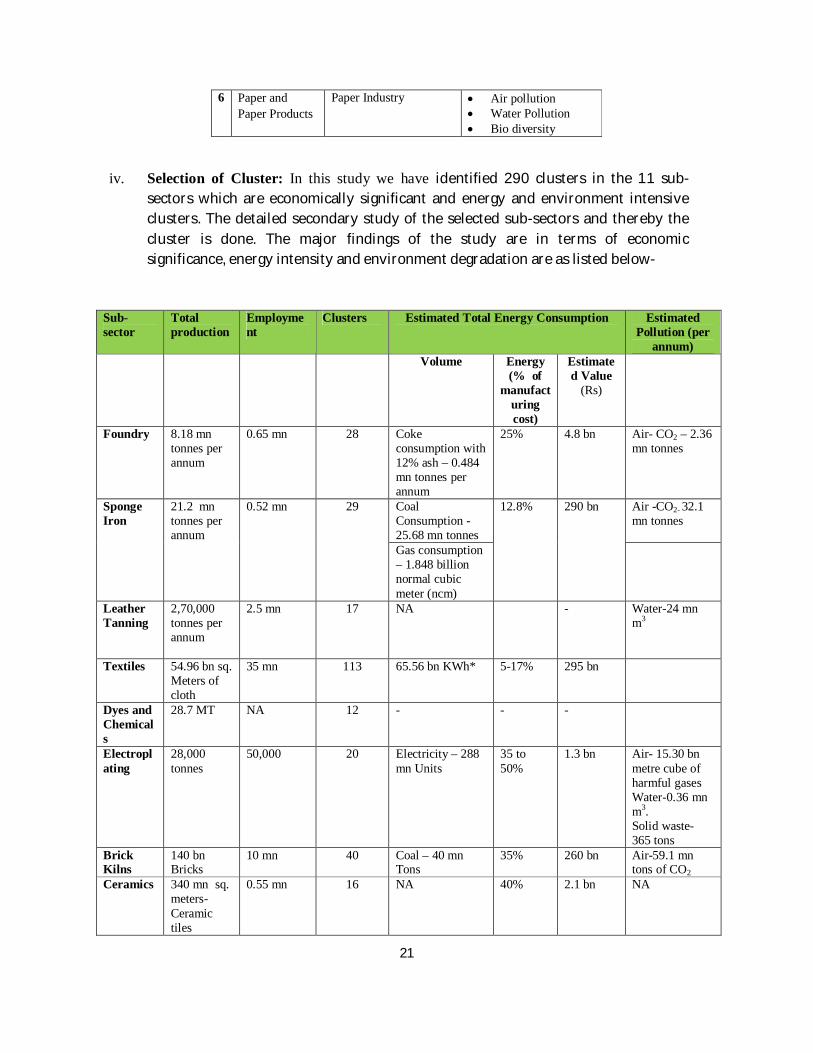
iv. Selection of Cluster: In this study we have identified 290 clusters in the 11 sub-sectors which are economically significant and energy and environment intensive clusters. The detailed secondary study of the selected sub-sectors and thereby the cluster is done. The major findings of the study are in terms of economic significance, energy intensity and environment degradation are as listed below-
Sub- sector
Total production
Employment
Clusters Estimated Total Energy Consumption Estimated Pollution (per
annum) Volume Energy
(% of manufact
uring cost)
Estimated Value
(Rs)
Foundry 8.18 mn tonnes per annum
0.65 mn 28 Coke consumption with 12% ash – 0.484 mn tonnes per annum
25% 4.8 bn Air- CO2 – 2.36 mn tonnes
Sponge Iron
21.2 mn tonnes per annum
0.52 mn
29
Coal Consumption - 25.68 mn tonnes
12.8% 290 bn Air -CO2- 32.1 mn tonnes
Gas consumption – 1.848 billion normal cubic meter (ncm)
Leather Tanning
2,70,000 tonnes per annum
2.5 mn 17 NA - Water-24 mn m3
Textiles 54.96 bn sq. Meters of cloth
35 mn 113 65.56 bn KWh* 5-17% 295 bn
Dyes and Chemicals
28.7 MT NA 12 - - -
Electroplating
28,000 tonnes
50,000 20 Electricity – 288 mn Units
35 to 50%
1.3 bn Air- 15.30 bn metre cube of harmful gases Water-0.36 mn m3. Solid waste- 365 tons
Brick Kilns
140 bn Bricks
10 mn 40 Coal – 40 mn Tons
35% 260 bn Air-59.1 mn tons of CO2
Ceramics 340 mn sq. meters- Ceramic tiles
0.55 mn 16 NA 40% 2.1 bn NA
22
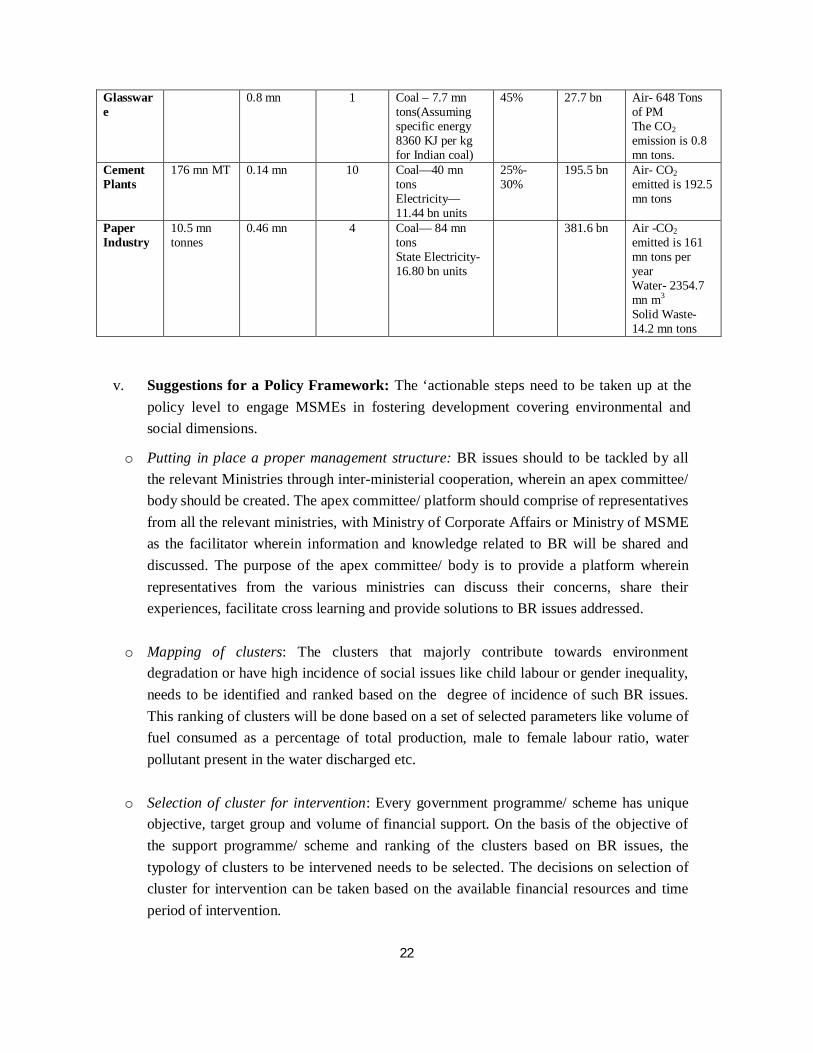
Glassware
0.8 mn 1 Coal – 7.7 mn tons(Assuming specific energy 8360 KJ per kg for Indian coal)
45% 27.7 bn Air- 648 Tons of PM The CO2 emission is 0.8 mn tons.
Cement Plants
176 mn MT 0.14 mn 10 Coal—40 mn tons Electricity—11.44 bn units
25%- 30%
195.5 bn Air- CO2 emitted is 192.5 mn tons
Paper Industry
10.5 mn tonnes
0.46 mn 4 Coal— 84 mn tons State Electricity- 16.80 bn units
381.6 bn Air -CO2 emitted is 161 mn tons per year Water- 2354.7 mn m3
Solid Waste-
14.2 mn tons
v. Suggestions for a Policy Framework: The ‘actionable steps need to be taken up at the policy level to engage MSMEs in fostering development covering environmental and social dimensions.
o Putting in place a proper management structure: BR issues should to be tackled by all the relevant Ministries through inter-ministerial cooperation, wherein an apex committee/ body should be created. The apex committee/ platform should comprise of representatives from all the relevant ministries, with Ministry of Corporate Affairs or Ministry of MSME as the facilitator wherein information and knowledge related to BR will be shared and discussed. The purpose of the apex committee/ body is to provide a platform wherein representatives from the various ministries can discuss their concerns, share their experiences, facilitate cross learning and provide solutions to BR issues addressed.
o Mapping of clusters: The clusters that majorly contribute towards environment
degradation or have high incidence of social issues like child labour or gender inequality, needs to be identified and ranked based on the degree of incidence of such BR issues. This ranking of clusters will be done based on a set of selected parameters like volume of fuel consumed as a percentage of total production, male to female labour ratio, water pollutant present in the water discharged etc.
o Selection of cluster for intervention: Every government programme/ scheme has unique objective, target group and volume of financial support. On the basis of the objective of the support programme/ scheme and ranking of the clusters based on BR issues, the typology of clusters to be intervened needs to be selected. The decisions on selection of cluster for intervention can be taken based on the available financial resources and time period of intervention.
23
o Implementation of support schemes/programmes: The implementation at the cluster level should be coordinated by the implementing agency appointed by the State government/ Central government in consultation with the local government. For the selection of the implementing agency, the State/ Central government should be equipped with the list of technical institutes or organisations that have worked at the clusters to address the various BR issues. For implementation a network should be created at the cluster level that comprise of technical institutes, various R&D institutes, educational institutes, NGOs and sector specialists for identification of the pressure points in the cluster, draw the action plan and accordingly implement at the cluster level.
o Monitoring and evaluation (M&E): Monitoring system should be in place at all the level. At the cluster level, day to day monitoring of the output will be done by the implementing agency and reported to the local government. The local government to monitor the outcome and the overall monitoring and evaluation to be done by the state/central government. The State/ Central government will monitor the support programme in terms of number of cluster supported, financial disbursement, impact of the support etc. Since dovetailing BR agenda with competitiveness is an emerging phenomenon, it is important to put in place a system that provides constant learning and inputs to policy makers.
o Disclosure of BR issues and incentive for such initiative: It has been observed that the BR issues are addressed by MSMEs when there is buyer pressure or regulatory and judicial pressure i.e. when there is a threat or external pressure. The other approach should be to encourage the clusters through incentivising them for addressing such BR issues in the form of financial loan at a lower interest rate, grant support etc. Steps should also be taken for disclosure of BR issues.
o National Voluntary Guideline (NVG): The MSMEs should be made aware of the benefits of following the National Voluntary Guideline (NVG). A proper awareness programme on NVG should be conducted for MSMEs wherein the process and benefits of following the National Voluntary Guidelines will be imparted.
o Role of cluster associations: Cluster associations can play a pivotal role in the growth and development of the clusters. To address the BR issues existing in clusters, associations can play multiple roles as illustrated below- Identification of support scheme/ programme available to address the specific BR
issue that is prevalent in the cluster and implement such schemes/ programmes in the cluster.
Identification and linking of proper BDS providers to address the BR issue.
24
Facilitate creation of network of BDS providers, R&D institute, educational institute and other related organisation.
However, the government have to take a step towards capacitating the cluster associations through introducing programmes/ schemes for training of BMO office bearers and executives and handhold them to draw up their business plan and implementation.
o Cluster Development Agent for cluster intervention: For addressing BR issues, especially environmental issues that require technical inputs, it is imperative that instead of an individual CDA, a team is constituted comprising of individuals having experience in identifying and addressing energy issues, environment issues and social issues. Cluster development agents (CDAs) will need to be trained through specialised designed training programmes that help him/her to diagnose BR issues better and then design interventions accordingly. Moreover, the cluster key stakeholders should also be trained in the area of BR as this would bring both the implementer and the beneficiary at the same level of understanding and the need to address such issues.
o Revisiting the Developmental Schemes: The developmental schemes should be audited by the respective ministries themselves to understand the magnitude of the BR issues addressed and accordingly either revise the existing scheme or design a new scheme as per the requirement.
o Inclusion of MSMEs under PAT scheme: MSMEs also contribute significantly to energy consumption given the traditional method of manufacturing, wherein per unit cost of fuel consumption is more in comparison to large companies. Therefore the PAT (Perform, Achieve, then Trade) scheme should also include MSMEs. Moreover, the scheme should be implementable at the group level as well, like clusters, special economic zones, cooperatives etc.

25

26
SECTION - A
27
Chapter A1
Significance of MSMEs with special reference to economic, energy and environmental aspects
1.1 Significance of MSMEs in India
1.1.1 Worldwide micro, small and medium enterprises (MSMEs) have been recognised as engines of economic growth. These MSMEs have been instrumental in generating large scale employment, contributing towards rise in incomes of labour and returns to capital; and promoting regional development, touch upon the lives of most vulnerable and marginalised like women, backward community, minorities etc. MSMEs are very heterogeneous groups that are grouped together on the basis of a formal definition that vary worldwide depending on the stage of economic development and culture of a country. In India, MSMEs are defined in accordance with the provision of Micro, Small & Medium Enterprises Development (MSMED) Act, 2006 the MSMEs are classified in two classes. Manufacturing Enterprises- The enterprises engaged in the manufacture or production of
goods pertaining to any industry specified in the first schedule to the industries (Development and Regulation Act, 1951). The Manufacturing Enterprise is defined in terms of investment in Plant & Machinery.
Service Enterprises: The enterprises engaged in providing or rendering of services and are defined in terms of investment in equipment.
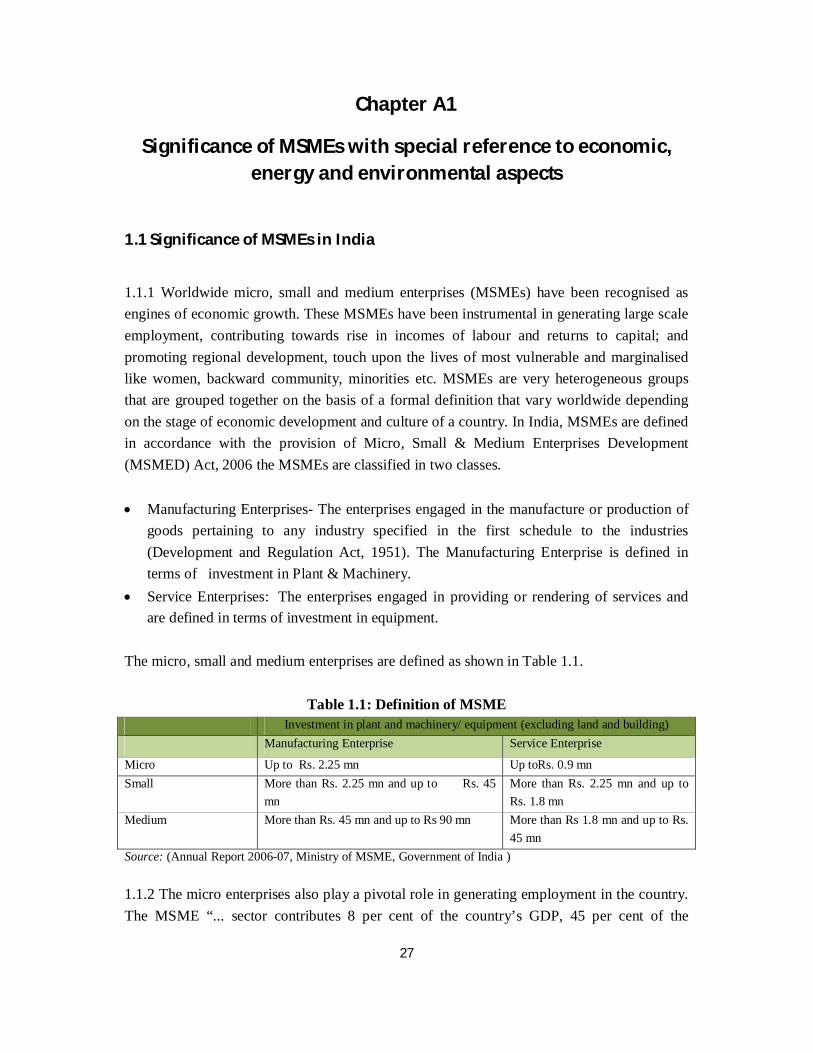
The micro, small and medium enterprises are defined as shown in Table 1.1.
Table 1.1: Definition of MSME Investment in plant and machinery/ equipment (excluding land and building) Manufacturing Enterprise Service Enterprise
Micro Up to Rs. 2.25 mn Up toRs. 0.9 mn Small More than Rs. 2.25 mn and up to Rs. 45
mn More than Rs. 2.25 mn and up to Rs. 1.8 mn
Medium More than Rs. 45 mn and up to Rs 90 mn More than Rs 1.8 mn and up to Rs. 45 mn
Source: (Annual Report 2006-07, Ministry of MSME, Government of India ) 1.1.2 The micro enterprises also play a pivotal role in generating employment in the country. The MSME “... sector contributes 8 per cent of the country’s GDP, 45 per cent of the
28
manufactured output and 40 per cent of its exports. The MSMEs provide employment to about 60 million persons through 26 million enterprises. The labour to capital ratio in MSMEs and the overall growth in the MSME sector is much higher than in the large industries. The geographic distribution of the MSMEs is also more even. Thus, MSMEs are important for the national objectives of growth with equity and inclusion” (Report of the Task Force on MSME). The MSMEs are estimated to “....manufacture over 6000 products ranging from handloom sarees, carpets, and soaps to pickles, papads, and machine parts for large industries...” (Eleventh 5 Year Plan, Government of India). Apart from its economic significance, MSMEs are instrumental in supporting inclusive growth, which touch upon the lives of the most vulnerable, most marginalized and the most skilled. 1.1.3 Though MSMEs are social and economic significance, there are few negative aspects that need to be addressed. It has been estimated that 70 per cent of the total industrial pollution is contributed by SMEs in India2. The pollution per unit of production is generally higher in SMEs than that of the corresponding large units partly due to use of obsolete technologies and poor management practices, and partly because most of the units do not come under the ambit of regulatory authorities.
1.2 Selection of significant industrial sectors in India based on contribution to economic development
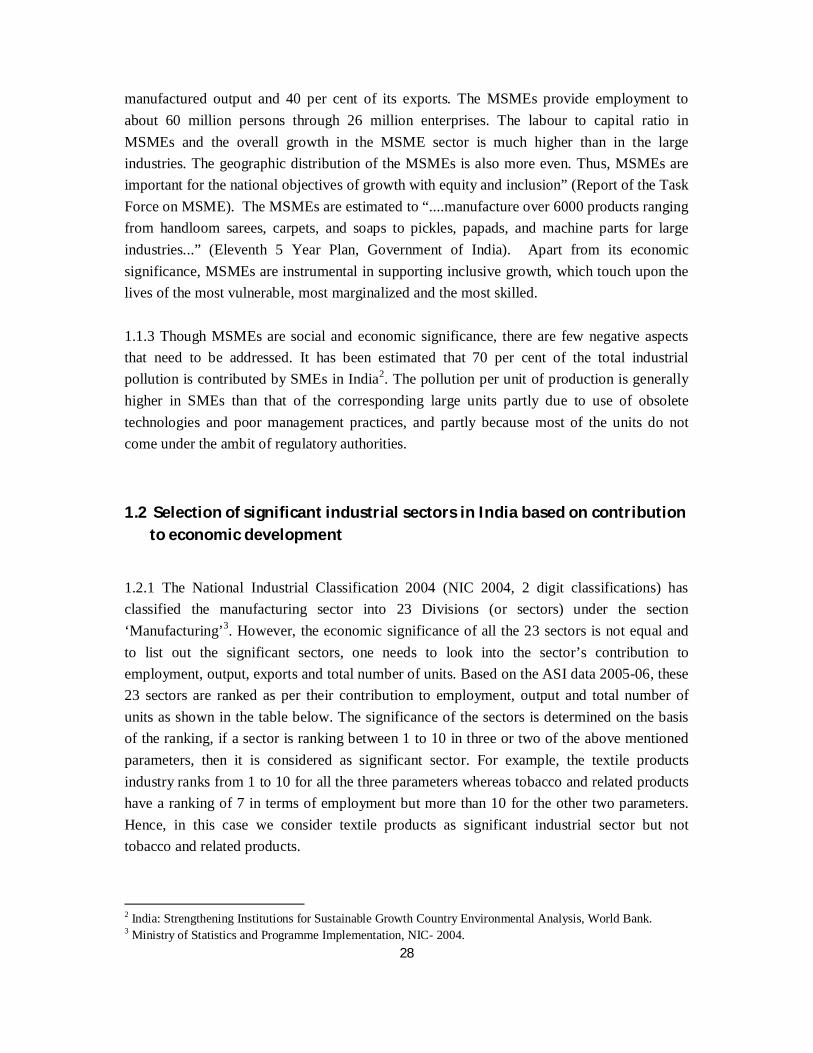
1.2.1 The National Industrial Classification 2004 (NIC 2004, 2 digit classifications) has classified the manufacturing sector into 23 Divisions (or sectors) under the section ‘Manufacturing’3. However, the economic significance of all the 23 sectors is not equal and to list out the significant sectors, one needs to look into the sector’s contribution to employment, output, exports and total number of units. Based on the ASI data 2005-06, these 23 sectors are ranked as per their contribution to employment, output and total number of units as shown in the table below. The significance of the sectors is determined on the basis of the ranking, if a sector is ranking between 1 to 10 in three or two of the above mentioned parameters, then it is considered as significant sector. For example, the textile products industry ranks from 1 to 10 for all the three parameters whereas tobacco and related products have a ranking of 7 in terms of employment but more than 10 for the other two parameters. Hence, in this case we consider textile products as significant industrial sector but not tobacco and related products.
2 India: Strengthening Institutions for Sustainable Growth Country Environmental Analysis, World Bank. 3 Ministry of Statistics and Programme Implementation, NIC- 2004.
29
Table: 1.2: Significant industrial sectors in India based on economic indicators
NIC-2004
Total persons Engaged
Rank Gross output
(USD in mn)
Rank No of Units
Rank
15 Food products and beverages
1,391,616 1 45,698.762
4 25,725 1
17 Textiles products 1,337,007 2 25,718.79 5 13,810 3
24 Chemicals and chemical products
825,435 3 48,310.802
3 10,995 4
27 Basic metals 643,594 4 51,060.612 2 7,228 8
26 Non-metallic mineral products
579,170 5 11,044.246
9 13,999 2
18 Wearing apparel, dressing & dyeing of fur
541,848 6 5,559.236
15 3,649 11
16 Tobacco & related products 473,608 7 2,679.134 19 3,344 12
29 Machinery and equipment n.e.c.
466,239 8 18,916.15
7 9,531 5
28 Fabricated metal products (except machinery & equipments)
372,726 9
10,188.268
11 8,534 6
34 Motor vehicles, trailers and semi-trailers
359,936 10
24,145.778
6 3,069 14
25 Rubber and plastic products 317,414 11 10,540.15 10 7,353 7
31 Electrical machinery and apparatus, n.e.c
274,467 12 13,558.922
8 4,069 9
35 Other transport equipments 199,230 13 10,020.618 12 1,886 18
36 Furniture & other manufacturing n.e.c.
189,725 14 8,966.612
13 2,562 16
21 Paper and paper products 177,696 15 4,977.522 16 3,749 10
19 Leather & related products 173,892 16 3,064.68 18 2,443 17
22 Publishing, printing and related activities
134,888 17 3,378.79
17 3,319 13
30
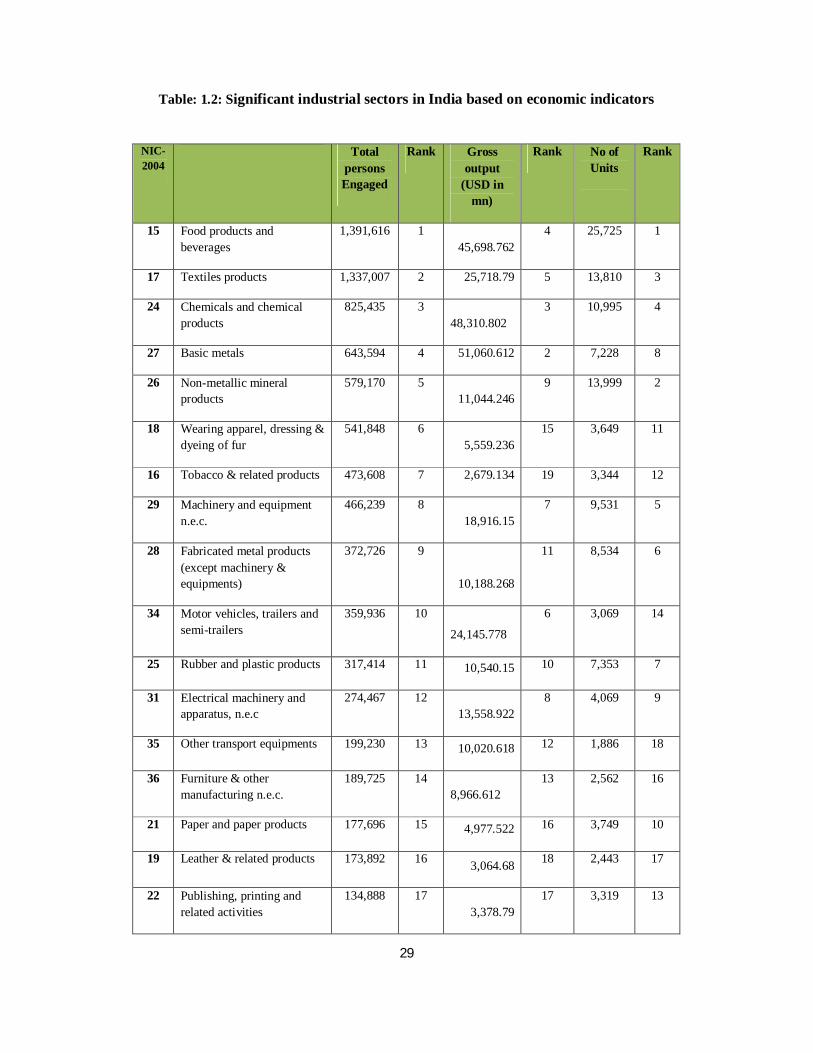
Source: Annual Sample Survey of India (ASI), Ministry of Statistics and Programme Implementation, 2005-06
Based on the above selection criteria, of the listed 23 sectors the most significant top 10 sectors are:
1. Food product and beverages 2. Textile Products 3. Chemicals and chemical products 4. Basic metals 5. Non metallic mineral products 6. Machinery and equipment n.e.c. 7. Fabricated Metal Products (except machinery and equipments) 8. Rubber and plastic products 9. Electrical machinery and apparatus 10. Motor Vehicles, Trailers and Semi-Trailers.
1.2.2 Apart from employment and output, export is another indicator that determines the economic significance of a sector. The industrial sectors that have been contributing significantly in exports are leather and leather manufacturers (4.35%)4, chemicals and related products (24.5%)5, engineering goods (heavy, medium and light engineering) (36.32%), textile and textile products (12.54%)6 and gems and jewellery (19.44%)7.
Therefore based on the economic performance indicators the combined list of significant sectors are-
4 Council for Leather Exports, 2009. 5 ITP Division, Ministry of External Affairs, 2010. 6 Ministry of Textiles, Annual Report 2010-11. 7 Eleventh Five Year Plan 2007-12.
32 Radio, television and communication equipments
115,890 18 6,819.846
14 1,036 20
23 Coke, petroleum products and nuclear fuel
85,283 19 58,911.808
1 1,037 19
33 Medical, precision and optical instruments
71,015 20 2,062.486
20 987 21
20 Wood and wood products 56,387 21 983.814 22 3,033 15
30 Office, accounting and computing machinery
21,776 22 1,783.532
21 180 22
37 Recycling 2,036 23 76.408 23 88 23
All industries 8,810,878 368,466.96 131,626
31
1. Food and beverages 2. Textile and textile products. 3. Chemical and chemical products 4. Engineering Goods (includes basic metal, machinery and equipment n.e.c. fabricated
metal products and electrical machinery and apparatus)8 5. Non metallic mineral products 6. Rubber and plastic products 7. Motor Vehicles, Trailers and Semi-Trailers 8. Gems and jewellery 9. Leather and manufacturers
1.2.3 These industrial sectors are significant both in terms of economic (share of exports and turnover) and social (employment) impact to the country. Apart from economic and social significance, the other factors that have been of major concern in all the strata of the economy are energy intensity and environmental issues of the sectors.
1.3 Energy intensity of the selected sectors
1.3.1 The energy consumption pattern of the various industrial sectors is not uniform. There are few sectors that are highly energy intensive in comparison to other sectors. The energy intensity of the sectors are determined based on the ASI data on fuel consumption for the year 2005-06. Of the selected economic significant sectors, the energy intensive sectors are listed below (this does not represent the ranking of different sectors)-
1. Engineering Goods (includes basic metal, machinery and equipment n.e.c. fabricated metal products and electrical machinery and apparatus)
2. Food and beverages. 3. Textile and textile products. 4. Chemical and chemical products 5. Non metallic mineral products 6. Rubber and plastic products
1.3.2 Apart from the listed six sectors, the other sectors that are highly energy intensive are paper and paper products and coke, petroleum products and nuclear fuel. Therefore, the combined list of sectors those are economically significant and energy intensive is-
i. Engineering Goods 8 Basic metal, machinery and equipment n.e.c. fabricated metal products and electrical machinery and apparatus are listed under Engineering goods.
32
ii. Food and beverages. iii. Textile and textile products. iv. Chemical and chemical products v. Non metallic mineral products
vi. Rubber and plastic products vii. Motor Vehicles, Trailers and Semi-Trailers.
viii. Gems and jewellery. ix. Leather and manufacturers. x. Paper and paper products
xi. Coke, petroleum products and nuclear fuel
1.4 Selection of significant sub-sectors from the above mentioned listed sectors
1.4.1 Sub-sectors leading to Environmental Degradation: The sub-sectors from the selected list of sectors are selected based on the criteria of their contribution to the pollution as per the norms of Central Pollution Control Board (CPCB). The Central Pollution Control Board (CPCB)9 has classified 64 types of polluting industries/ industrial activities as “Red Category” industries on the basis of high emissions/ discharge of significant polluting or generating hazardous wastes. The industries where the degree of pollution is less, the industries are termed as “Orange” category industries (25 types of industries) and small scale and cottage/ village industries are categorised as “Green” category industries (55 types of industries). Out of the selected 64 types of “Red Category” polluting industries, 17 of them have been identified by Ministry of Environment and Forests, Government of India as heavily polluting and covered under Central Action Plan and has significant presence in MSME sector are Pulp and paper (Paper Manufacturing with or without pulping), Dyes and Dyes Intermediaries, Tanneries, Cement and Iron and Steel (involving process from ore/ scrap, and integrated steel plants)10. The table below provides the list of sub-sectors that leads to environmental degradation from the selected list of sectors are:
9Central Pollution Control Board (CPCB) is a statutory organisation which serves as a field formation and also provides technical services to the Ministry of Environment and Forests of the provisions of the Environment (Protection) Act, 1986. Principal Functions of the CPCB is to promote cleanliness of streams and wells in different areas of the States by prevention, control and abatement of water pollution, and to improve the quality of air and to prevent, control or abate air pollution in the country 10 Central Pollution Control Board, http://www.cpcbenvis.nic.in/newsletter/pollutingindustries/pollutingintro1.htm
33
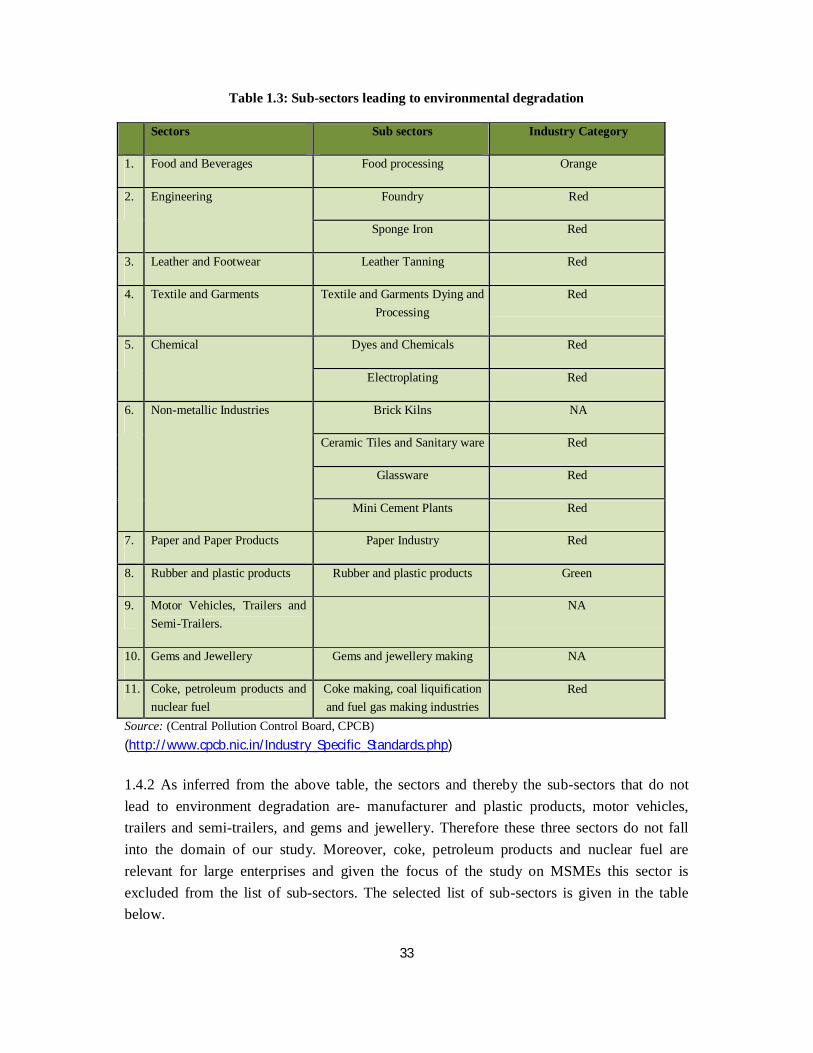
Table 1.3: Sub-sectors leading to environmental degradation
Sectors Sub sectors Industry Category
1. Food and Beverages Food processing Orange
2. Engineering Foundry Red
Sponge Iron Red
3. Leather and Footwear Leather Tanning Red
4. Textile and Garments Textile and Garments Dying and Processing
Red
5. Chemical Dyes and Chemicals Red
Electroplating Red
6. Non-metallic Industries Brick Kilns NA
Ceramic Tiles and Sanitary ware Red
Glassware Red
Mini Cement Plants Red
7. Paper and Paper Products Paper Industry Red
8. Rubber and plastic products Rubber and plastic products Green
9. Motor Vehicles, Trailers and Semi-Trailers.
NA
10. Gems and Jewellery Gems and jewellery making NA
11. Coke, petroleum products and nuclear fuel
Coke making, coal liquification and fuel gas making industries
Red
Source: (Central Pollution Control Board, CPCB) (http://www.cpcb.nic.in/Industry_Specific_Standards.php)
1.4.2 As inferred from the above table, the sectors and thereby the sub-sectors that do not lead to environment degradation are- manufacturer and plastic products, motor vehicles, trailers and semi-trailers, and gems and jewellery. Therefore these three sectors do not fall into the domain of our study. Moreover, coke, petroleum products and nuclear fuel are relevant for large enterprises and given the focus of the study on MSMEs this sector is excluded from the list of sub-sectors. The selected list of sub-sectors is given in the table below.

34
Table 1.4: Final list of sub-sectors leading to significant environmental degradation
Sectors Sub sectors Environmental Issues
1 Engineering Foundry Air emissions Solid waste Wastewater Sponge Iron
2 Leather and Footwear
Leather Tanning Water Pollution Hazardous solid
waste
3 Textile and Garments
Textile and Garments Dying and Processing
Water Pollution Hazardous solid
waste 4 Chemical Dyes and Chemicals Water pollution
Hazardous waste Electroplating
5 Non-metallic Industries
Brick Kilns Air pollution
Ceramic Tiles and Sanitary ware
Air pollution
Solid waste Glassware Air pollution
Solid waste
Mini Cement Plants Air pollution
6 Paper and Paper Products
Paper Industry Air pollution Water Pollution Bio diversity
Source: Compiled from various sources- CPCB, Ministry of Environment and Forests, CII-MSME and various sector reports.
35
Chapter A2
Selection of energy intensive and environmentally sensitive Clusters
2.1 Understanding clusters
2.1.1 Often MSMEs producing a range of similar or same products are found to co-exist in typical geographical locations for decades and even centuries in many countries. This phenomenon is referred to as clustering of MSMEs. The phenomenon of enterprise clustering is prevalent both in economically developed and developing countries. Geographical proximity of enterprises may give rise to specialised labour, nurture subsidiary industries, stimulate innovations, enable technological spillover, and make economic and non-economic inter-firm linkages feasible.
2.1.2 A cluster is defined as “…a typical geographical concentration of micro, small, medium and large firms producing same or a similar range of products (goods or services). Units in a cluster face same or similar set of threats (e.g. product obsolescence, lack of markets, etc.) and opportunities (e.g. increasing turnover through quality up-gradation or introduction of new products or markets, etc.)” (FMC: 2007)11. However there does not exist any guiding principle regarding the generality of products or geographical spread of the cluster. The definition should not include too wide a product range as the common opportunities and threats lose their sharpness or specificity and too narrow a definition that can create difficulty in finding a sizeable number of similar firms, with commonalities that enable interconnectedness. Similarly, while defining geographical spread of a cluster, too wide an area hinders the units to exploit developmental potential through proactive joint action. In India, it has been estimated from various sources that there are around 6600 clusters spread across the country. As per the estimation of Foundation for MSME clusters through Cluster Observatory, around 4700 clusters have been mapped of which, 1122 are industrial clusters as on November 2011. This is perhaps the largest number of industrial clusters in any single country.
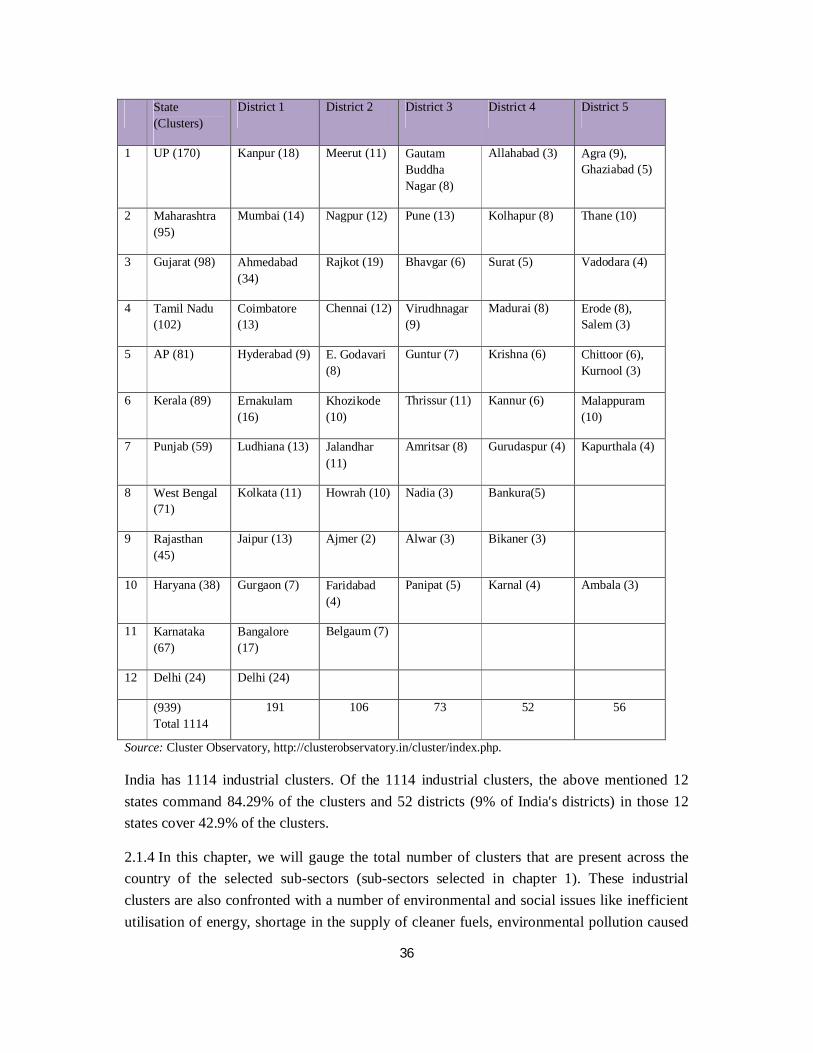
2.1.3 The spread of industrial clusters confirms the broad industrialisation trend among states in India. The table 2.1 below provides the geographic spread of some of the industrial clusters in India.
Table: 2.1: Geographic Spread of Industrial Clusters in India 11 Policy and Status Paper on Cluster Development in India, FMC 2007.
36
Source: Cluster Observatory, http://clusterobservatory.in/cluster/index.php.
India has 1114 industrial clusters. Of the 1114 industrial clusters, the above mentioned 12 states command 84.29% of the clusters and 52 districts (9% of India's districts) in those 12 states cover 42.9% of the clusters.
2.1.4 In this chapter, we will gauge the total number of clusters that are present across the country of the selected sub-sectors (sub-sectors selected in chapter 1). These industrial clusters are also confronted with a number of environmental and social issues like inefficient utilisation of energy, shortage in the supply of cleaner fuels, environmental pollution caused
State (Clusters)
District 1 District 2 District 3 District 4 District 5
1 UP (170) Kanpur (18) Meerut (11) Gautam Buddha Nagar (8)
Allahabad (3) Agra (9), Ghaziabad (5)
2 Maharashtra (95)
Mumbai (14) Nagpur (12) Pune (13) Kolhapur (8) Thane (10)
3 Gujarat (98) Ahmedabad (34)
Rajkot (19) Bhavgar (6) Surat (5) Vadodara (4)
4 Tamil Nadu (102)
Coimbatore (13)
Chennai (12) Virudhnagar (9)
Madurai (8) Erode (8), Salem (3)
5 AP (81) Hyderabad (9) E. Godavari (8)
Guntur (7) Krishna (6) Chittoor (6), Kurnool (3)
6 Kerala (89) Ernakulam (16)
Khozikode (10)
Thrissur (11) Kannur (6) Malappuram (10)
7 Punjab (59) Ludhiana (13) Jalandhar (11)
Amritsar (8) Gurudaspur (4) Kapurthala (4)
8 West Bengal (71)
Kolkata (11) Howrah (10) Nadia (3) Bankura(5)
9 Rajasthan (45)
Jaipur (13) Ajmer (2) Alwar (3) Bikaner (3)
10 Haryana (38) Gurgaon (7) Faridabad (4)
Panipat (5) Karnal (4) Ambala (3)
11 Karnataka (67)
Bangalore (17)
Belgaum (7)
12 Delhi (24) Delhi (24)
(939) Total 1114
191 106 73 52 56
37
due to inefficient combustion and clustering of units, occupational health hazards, child labour, women empowerment etc. In the following sections, our focus is to address the energy intensity, environmental and social issues that are prevalent cluster wide. The objective is to explore and understand the intensity of the existing issues and thereby identify areas for intervention.
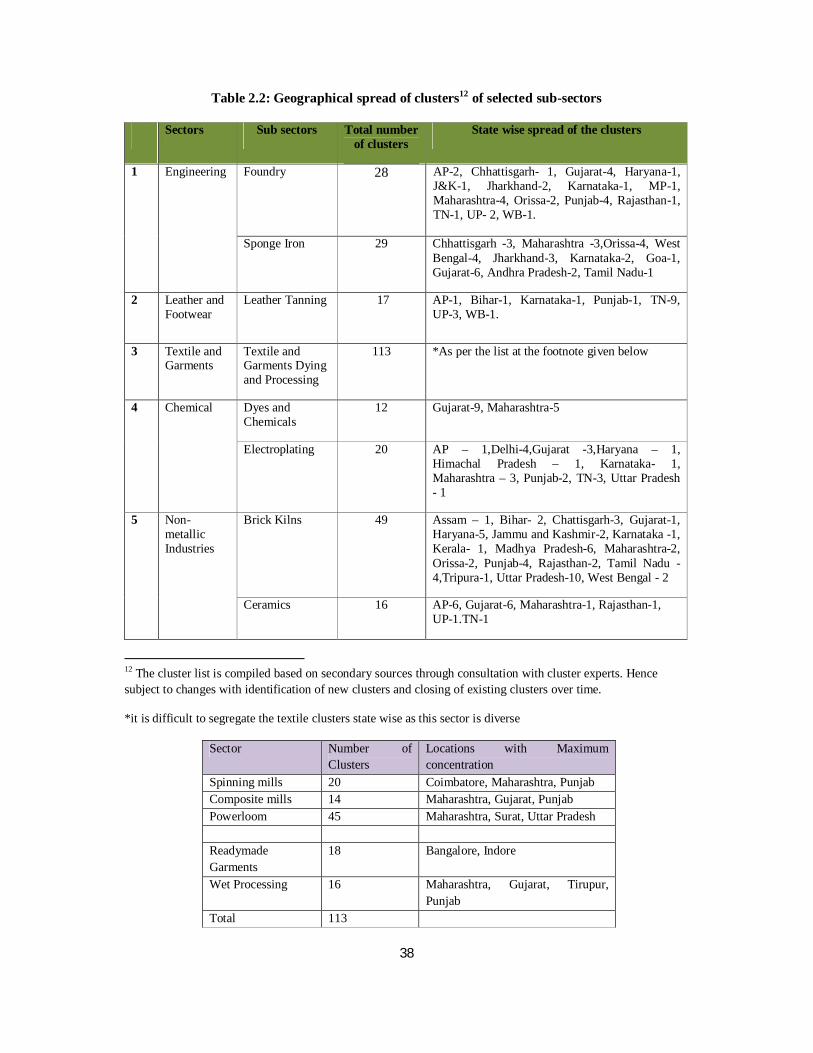
2.2 Geographical Expanse of the selected clusters
2.2.1 As mentioned earlier based on the economic, energy and environmental issues sectors and thereby 11 sub-sectors are selected. These selected sub-sectors have clusters spread across the country. The numbers of clusters that are present in the country also vary from one sub-sector to another. The geographical expanse and the number of clusters that are present in India of the selected sub-sectors are as shown in the table below.
38
Table 2.2: Geographical spread of clusters12 of selected sub-sectors
Sectors Sub sectors Total number of clusters
State wise spread of the clusters
1 Engineering Foundry 28 AP-2, Chhattisgarh- 1, Gujarat-4, Haryana-1, J&K-1, Jharkhand-2, Karnataka-1, MP-1, Maharashtra-4, Orissa-2, Punjab-4, Rajasthan-1, TN-1, UP- 2, WB-1.
Sponge Iron 29 Chhattisgarh -3, Maharashtra -3,Orissa-4, West Bengal-4, Jharkhand-3, Karnataka-2, Goa-1, Gujarat-6, Andhra Pradesh-2, Tamil Nadu-1
2 Leather and Footwear
Leather Tanning 17 AP-1, Bihar-1, Karnataka-1, Punjab-1, TN-9, UP-3, WB-1.
3 Textile and Garments
Textile and Garments Dying and Processing
113 *As per the list at the footnote given below
4 Chemical Dyes and Chemicals
12 Gujarat-9, Maharashtra-5
Electroplating 20 AP – 1,Delhi-4,Gujarat -3,Haryana – 1, Himachal Pradesh – 1, Karnataka- 1, Maharashtra – 3, Punjab-2, TN-3, Uttar Pradesh - 1
5 Non-metallic Industries
Brick Kilns 49 Assam – 1, Bihar- 2, Chattisgarh-3, Gujarat-1, Haryana-5, Jammu and Kashmir-2, Karnataka -1, Kerala- 1, Madhya Pradesh-6, Maharashtra-2, Orissa-2, Punjab-4, Rajasthan-2, Tamil Nadu -4,Tripura-1, Uttar Pradesh-10, West Bengal - 2
Ceramics 16 AP-6, Gujarat-6, Maharashtra-1, Rajasthan-1, UP-1.TN-1
12 The cluster list is compiled based on secondary sources through consultation with cluster experts. Hence subject to changes with identification of new clusters and closing of existing clusters over time.
*it is difficult to segregate the textile clusters state wise as this sector is diverse
Sector Number of Clusters
Locations with Maximum concentration
Spinning mills 20 Coimbatore, Maharashtra, Punjab Composite mills 14 Maharashtra, Gujarat, Punjab Powerloom 45 Maharashtra, Surat, Uttar Pradesh Readymade Garments
18 Bangalore, Indore
Wet Processing 16 Maharashtra, Gujarat, Tirupur, Punjab
Total 113
39
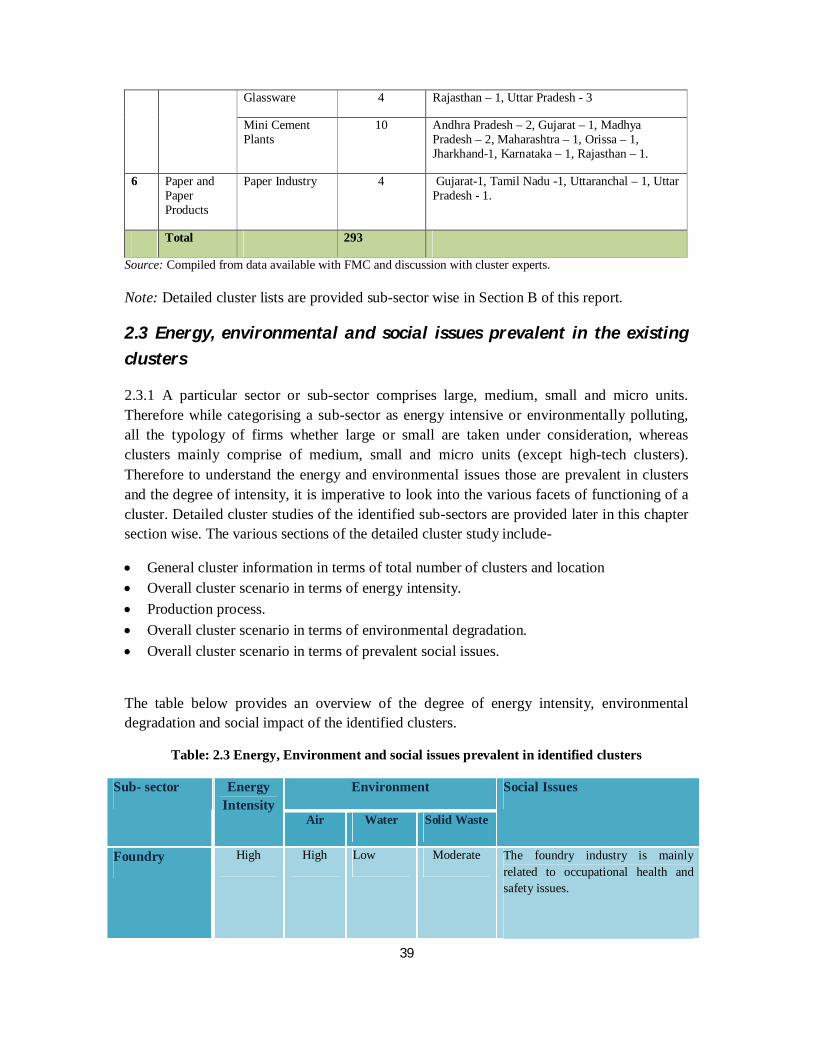
Glassware 4 Rajasthan – 1, Uttar Pradesh - 3
Mini Cement Plants
10 Andhra Pradesh – 2, Gujarat – 1, Madhya Pradesh – 2, Maharashtra – 1, Orissa – 1, Jharkhand-1, Karnataka – 1, Rajasthan – 1.
6 Paper and Paper Products
Paper Industry 4 Gujarat-1, Tamil Nadu -1, Uttaranchal – 1, Uttar Pradesh - 1.
Total 293
Source: Compiled from data available with FMC and discussion with cluster experts.
Note: Detailed cluster lists are provided sub-sector wise in Section B of this report.
2.3 Energy, environmental and social issues prevalent in the existing
clusters
2.3.1 A particular sector or sub-sector comprises large, medium, small and micro units. Therefore while categorising a sub-sector as energy intensive or environmentally polluting, all the typology of firms whether large or small are taken under consideration, whereas clusters mainly comprise of medium, small and micro units (except high-tech clusters). Therefore to understand the energy and environmental issues those are prevalent in clusters and the degree of intensity, it is imperative to look into the various facets of functioning of a cluster. Detailed cluster studies of the identified sub-sectors are provided later in this chapter section wise. The various sections of the detailed cluster study include-
General cluster information in terms of total number of clusters and location Overall cluster scenario in terms of energy intensity. Production process. Overall cluster scenario in terms of environmental degradation. Overall cluster scenario in terms of prevalent social issues.
The table below provides an overview of the degree of energy intensity, environmental degradation and social impact of the identified clusters.
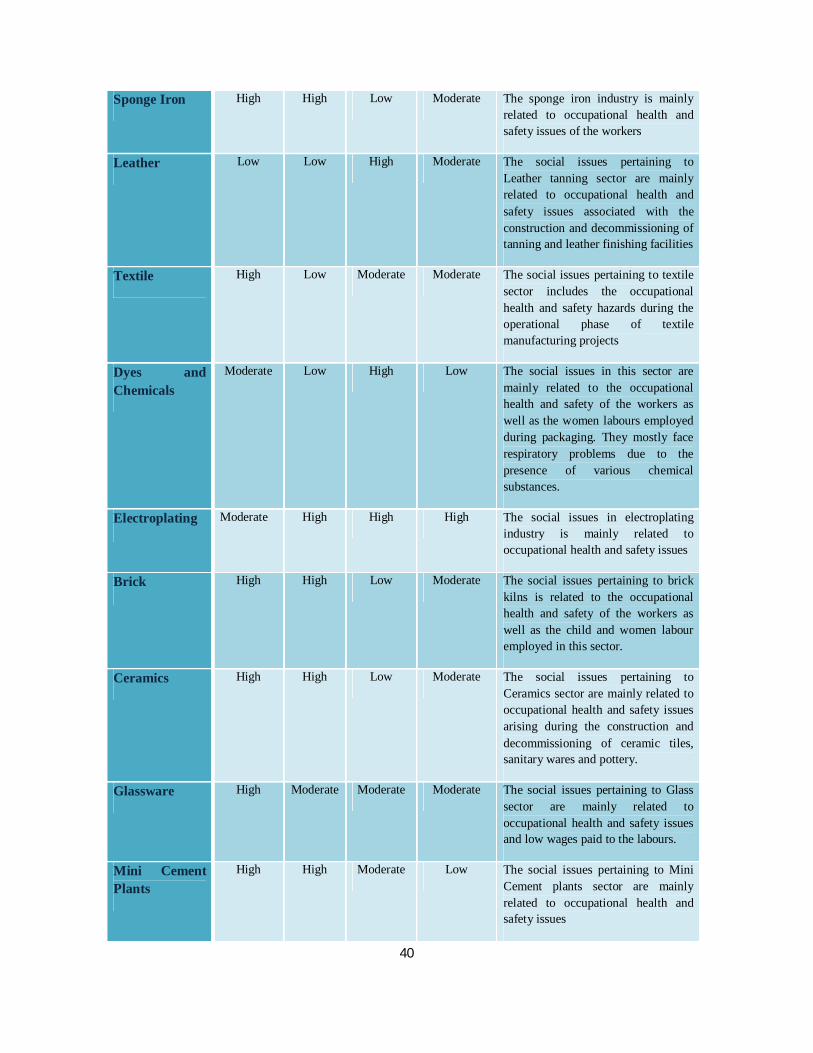
Table: 2.3 Energy, Environment and social issues prevalent in identified clusters
Sub- sector Energy Intensity
Environment Social Issues
Air Water Solid Waste
Foundry High High Low Moderate The foundry industry is mainly related to occupational health and safety issues.
40
Sponge Iron High High Low Moderate The sponge iron industry is mainly related to occupational health and safety issues of the workers
Leather Low Low High Moderate The social issues pertaining to Leather tanning sector are mainly related to occupational health and safety issues associated with the construction and decommissioning of tanning and leather finishing facilities
Textile High Low Moderate Moderate The social issues pertaining to textile sector includes the occupational health and safety hazards during the operational phase of textile manufacturing projects
Dyes and Chemicals
Moderate Low High Low The social issues in this sector are mainly related to the occupational health and safety of the workers as well as the women labours employed during packaging. They mostly face respiratory problems due to the presence of various chemical substances.
Electroplating Moderate High High High The social issues in electroplating industry is mainly related to occupational health and safety issues
Brick High High Low Moderate The social issues pertaining to brick kilns is related to the occupational health and safety of the workers as well as the child and women labour employed in this sector.
Ceramics High High Low Moderate The social issues pertaining to Ceramics sector are mainly related to occupational health and safety issues arising during the construction and decommissioning of ceramic tiles, sanitary wares and pottery.
Glassware High Moderate Moderate Moderate The social issues pertaining to Glass sector are mainly related to occupational health and safety issues and low wages paid to the labours.
Mini Cement Plants
High High Moderate Low The social issues pertaining to Mini Cement plants sector are mainly related to occupational health and safety issues

41
Paper Industry High High High Moderate The social issues pertaining to paper sector are mainly related to occupational health and safety issues
Source: Compiled based from the sector studies and inputs from experts.
The energy, environmental and social impact of the clusters from the selected 11 sub-sectors are further illustrated in the following chapter based on the detailed sub-sector study provided in Section B of the report.
42
Chapter A3
Economic Significance and Major BR Issues in Select Sub-sectors
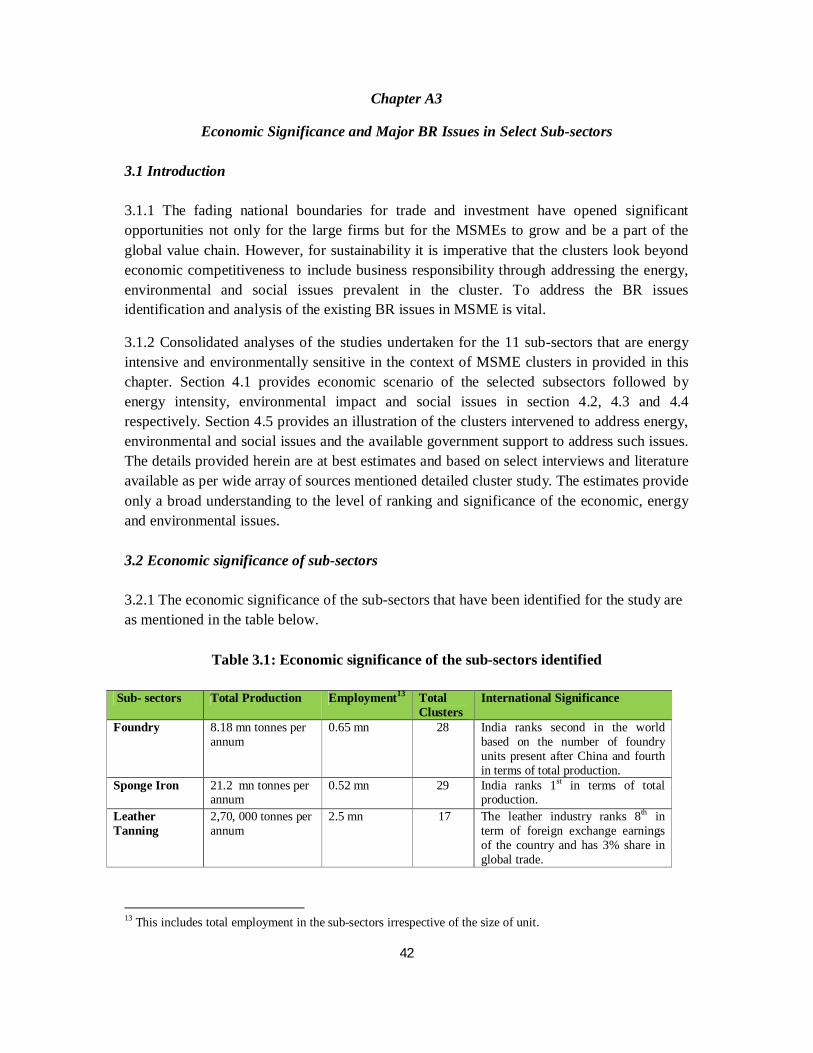
3.1 Introduction 3.1.1 The fading national boundaries for trade and investment have opened significant opportunities not only for the large firms but for the MSMEs to grow and be a part of the global value chain. However, for sustainability it is imperative that the clusters look beyond economic competitiveness to include business responsibility through addressing the energy, environmental and social issues prevalent in the cluster. To address the BR issues identification and analysis of the existing BR issues in MSME is vital.
3.1.2 Consolidated analyses of the studies undertaken for the 11 sub-sectors that are energy intensive and environmentally sensitive in the context of MSME clusters in provided in this chapter. Section 4.1 provides economic scenario of the selected subsectors followed by energy intensity, environmental impact and social issues in section 4.2, 4.3 and 4.4 respectively. Section 4.5 provides an illustration of the clusters intervened to address energy, environmental and social issues and the available government support to address such issues. The details provided herein are at best estimates and based on select interviews and literature available as per wide array of sources mentioned detailed cluster study. The estimates provide only a broad understanding to the level of ranking and significance of the economic, energy and environmental issues. 3.2 Economic significance of sub-sectors 3.2.1 The economic significance of the sub-sectors that have been identified for the study are as mentioned in the table below.
Table 3.1: Economic significance of the sub-sectors identified
Sub- sectors Total Production Employment13 Total
Clusters International Significance
Foundry 8.18 mn tonnes per annum
0.65 mn 28 India ranks second in the world based on the number of foundry units present after China and fourth in terms of total production.
Sponge Iron 21.2 mn tonnes per annum
0.52 mn 29 India ranks 1st in terms of total production.
Leather Tanning
2,70, 000 tonnes per annum
2.5 mn 17 The leather industry ranks 8th in term of foreign exchange earnings of the country and has 3% share in global trade.
13 This includes total employment in the sub-sectors irrespective of the size of unit.
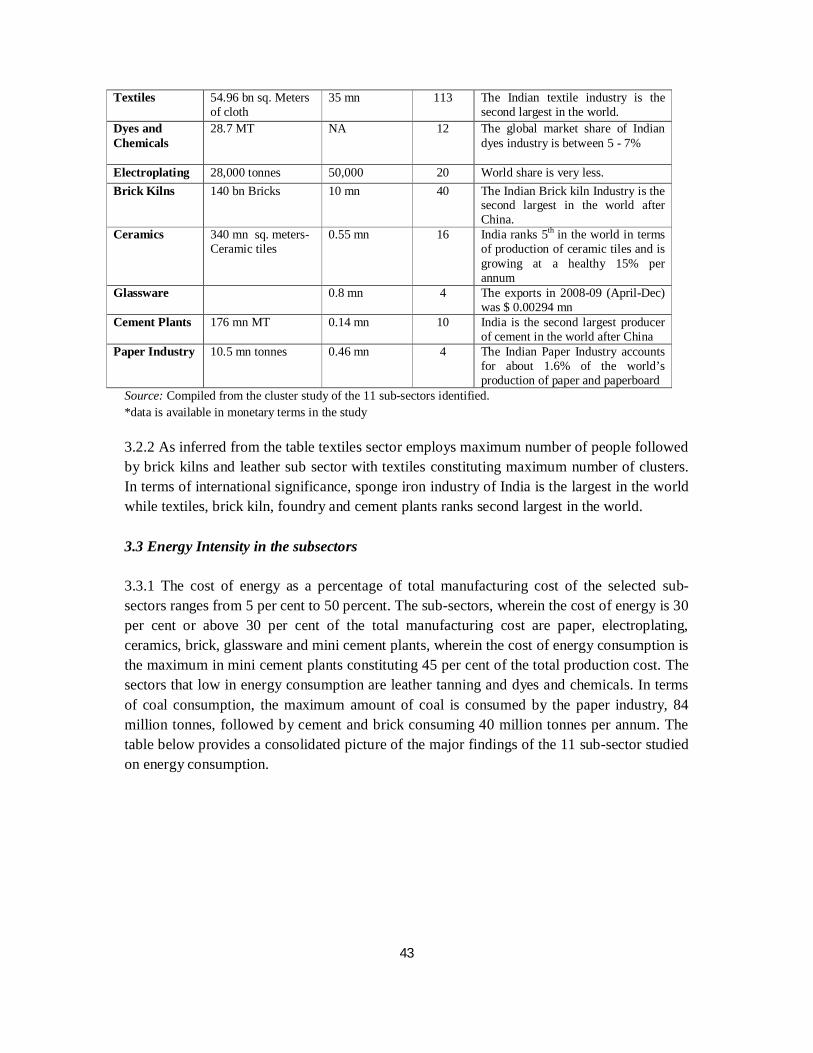
43
Textiles 54.96 bn sq. Meters of cloth
35 mn 113 The Indian textile industry is the second largest in the world.
Dyes and Chemicals
28.7 MT NA 12 The global market share of Indian dyes industry is between 5 - 7%
Electroplating 28,000 tonnes 50,000 20 World share is very less. Brick Kilns 140 bn Bricks 10 mn 40 The Indian Brick kiln Industry is the
second largest in the world after China.
Ceramics 340 mn sq. meters- Ceramic tiles
0.55 mn 16 India ranks 5th in the world in terms of production of ceramic tiles and is growing at a healthy 15% per annum
Glassware 0.8 mn 4 The exports in 2008-09 (April-Dec) was $ 0.00294 mn
Cement Plants 176 mn MT 0.14 mn 10 India is the second largest producer of cement in the world after China
Paper Industry 10.5 mn tonnes 0.46 mn 4 The Indian Paper Industry accounts for about 1.6% of the world’s production of paper and paperboard
Source: Compiled from the cluster study of the 11 sub-sectors identified. *data is available in monetary terms in the study 3.2.2 As inferred from the table textiles sector employs maximum number of people followed by brick kilns and leather sub sector with textiles constituting maximum number of clusters. In terms of international significance, sponge iron industry of India is the largest in the world while textiles, brick kiln, foundry and cement plants ranks second largest in the world. 3.3 Energy Intensity in the subsectors 3.3.1 The cost of energy as a percentage of total manufacturing cost of the selected sub-sectors ranges from 5 per cent to 50 percent. The sub-sectors, wherein the cost of energy is 30 per cent or above 30 per cent of the total manufacturing cost are paper, electroplating, ceramics, brick, glassware and mini cement plants, wherein the cost of energy consumption is the maximum in mini cement plants constituting 45 per cent of the total production cost. The sectors that low in energy consumption are leather tanning and dyes and chemicals. In terms of coal consumption, the maximum amount of coal is consumed by the paper industry, 84 million tonnes, followed by cement and brick consuming 40 million tonnes per annum. The table below provides a consolidated picture of the major findings of the 11 sub-sector studied on energy consumption.
44
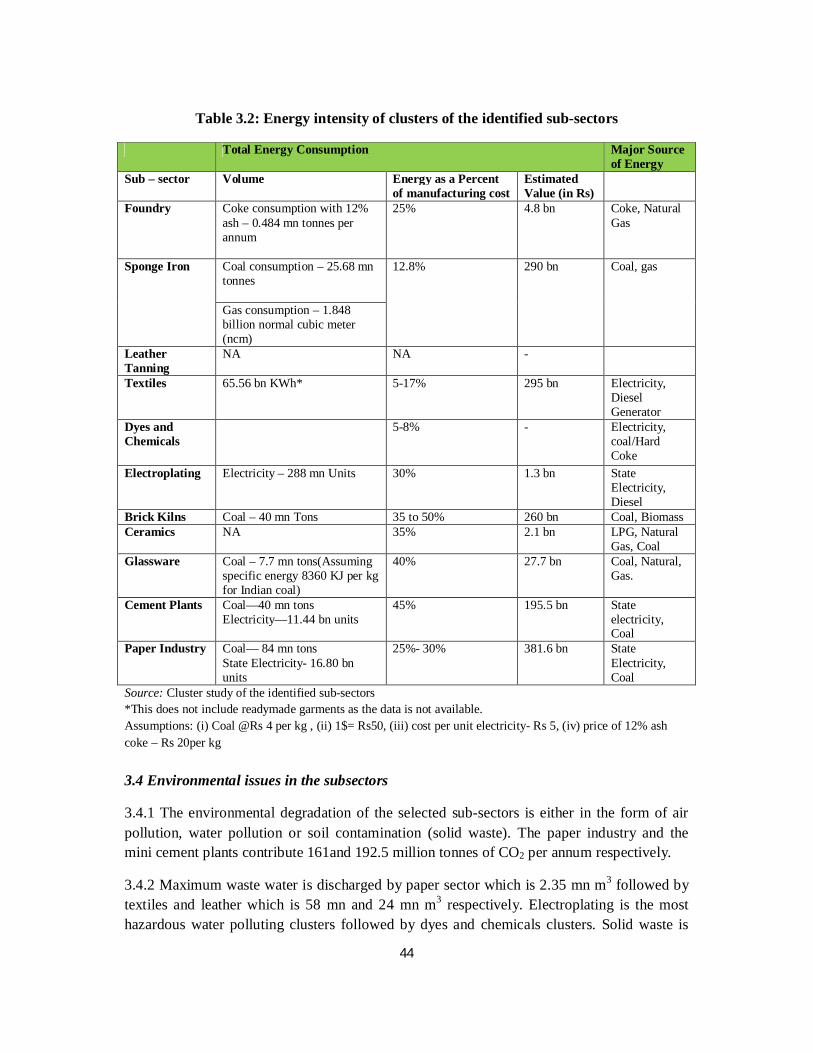
Table 3.2: Energy intensity of clusters of the identified sub-sectors
Total Energy Consumption Major Source of Energy
Sub – sector Volume Energy as a Percent of manufacturing cost
Estimated Value (in Rs)
Foundry Coke consumption with 12% ash – 0.484 mn tonnes per annum
25% 4.8 bn Coke, Natural Gas
Sponge Iron Coal consumption – 25.68 mn tonnes
12.8% 290 bn Coal, gas
Gas consumption – 1.848 billion normal cubic meter (ncm)
Leather Tanning
NA NA -
Textiles 65.56 bn KWh* 5-17% 295 bn Electricity, Diesel Generator
Dyes and Chemicals
5-8% - Electricity, coal/Hard Coke
Electroplating Electricity – 288 mn Units 30% 1.3 bn State Electricity, Diesel
Brick Kilns Coal – 40 mn Tons 35 to 50% 260 bn Coal, Biomass Ceramics NA 35% 2.1 bn LPG, Natural
Gas, Coal Glassware Coal – 7.7 mn tons(Assuming
specific energy 8360 KJ per kg for Indian coal)
40% 27.7 bn Coal, Natural, Gas.
Cement Plants Coal—40 mn tons Electricity—11.44 bn units
45% 195.5 bn State electricity, Coal
Paper Industry Coal— 84 mn tons State Electricity- 16.80 bn units
25%- 30% 381.6 bn State Electricity, Coal
Source: Cluster study of the identified sub-sectors *This does not include readymade garments as the data is not available. Assumptions: (i) Coal @Rs 4 per kg , (ii) 1$= Rs50, (iii) cost per unit electricity- Rs 5, (iv) price of 12% ash coke – Rs 20per kg 3.4 Environmental issues in the subsectors
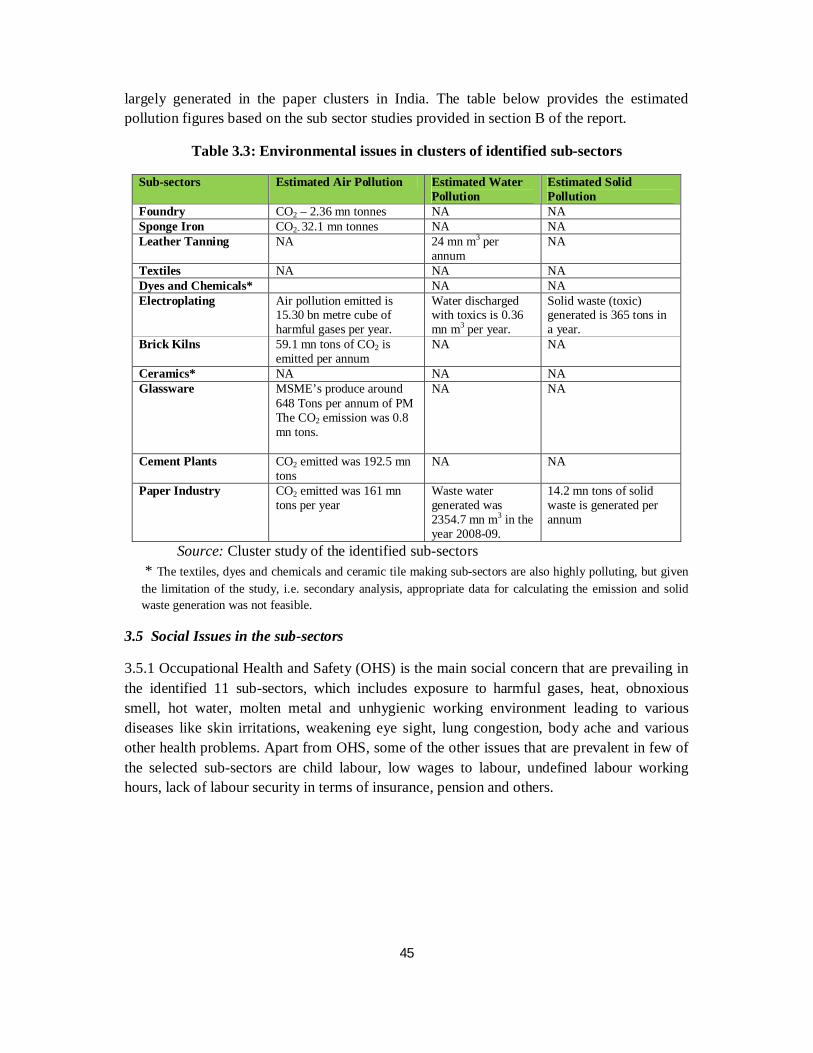
3.4.1 The environmental degradation of the selected sub-sectors is either in the form of air pollution, water pollution or soil contamination (solid waste). The paper industry and the mini cement plants contribute 161and 192.5 million tonnes of CO2 per annum respectively.
3.4.2 Maximum waste water is discharged by paper sector which is 2.35 mn m3 followed by textiles and leather which is 58 mn and 24 mn m3 respectively. Electroplating is the most hazardous water polluting clusters followed by dyes and chemicals clusters. Solid waste is
45
largely generated in the paper clusters in India. The table below provides the estimated pollution figures based on the sub sector studies provided in section B of the report.
Table 3.3: Environmental issues in clusters of identified sub-sectors
Sub-sectors Estimated Air Pollution Estimated Water Pollution
Estimated Solid Pollution
Foundry CO2 – 2.36 mn tonnes NA NA Sponge Iron CO2- 32.1 mn tonnes NA NA Leather Tanning NA 24 mn m3 per
annum NA
Textiles NA NA NA Dyes and Chemicals* NA NA Electroplating Air pollution emitted is
15.30 bn metre cube of harmful gases per year.
Water discharged with toxics is 0.36 mn m3 per year.
Solid waste (toxic) generated is 365 tons in a year.
Brick Kilns 59.1 mn tons of CO2 is emitted per annum
NA NA
Ceramics* NA NA NA Glassware MSME’s produce around
648 Tons per annum of PM The CO2 emission was 0.8 mn tons.
NA NA
Cement Plants CO2 emitted was 192.5 mn tons
NA NA
Paper Industry CO2 emitted was 161 mn tons per year
Waste water generated was 2354.7 mn m3 in the year 2008-09.
14.2 mn tons of solid waste is generated per annum
Source: Cluster study of the identified sub-sectors * The textiles, dyes and chemicals and ceramic tile making sub-sectors are also highly polluting, but given the limitation of the study, i.e. secondary analysis, appropriate data for calculating the emission and solid waste generation was not feasible.
3.5 Social Issues in the sub-sectors
3.5.1 Occupational Health and Safety (OHS) is the main social concern that are prevailing in the identified 11 sub-sectors, which includes exposure to harmful gases, heat, obnoxious smell, hot water, molten metal and unhygienic working environment leading to various diseases like skin irritations, weakening eye sight, lung congestion, body ache and various other health problems. Apart from OHS, some of the other issues that are prevalent in few of the selected sub-sectors are child labour, low wages to labour, undefined labour working hours, lack of labour security in terms of insurance, pension and others.

46
Table 3.4: Social issues prevalent in clusters of identified sub-sectors
Sub-sectors Most Significant Foundry Contact with hot metal or hot water resulting in severe burn as the workers are not
properly guarded The workers wear loose garment to work and some are also bare chest, which is a
safety hazard. The workers are not aware of the safety measures that need to be followed at work.
Sponge Iron Heavy metals which are released in air from the sponge iron plants are highly toxic and increase the risk of cancer.
Air pollution has a great impact on plant and vegetation as well, particularly the pollutants like Sulphur dioxide (SO2), nitrogen dioxide (NO2) and particulate matter are the primary pollutants
Leather Tanning
Workers are exposed to disease-agents such as bacteria, fungi, mites, and parasites which are present in the hides or as part of the manufacturing process. Some allergic reactions are developed due to these diseases – agents
Obnoxious smell comes from the hides and skins which makes breathing difficult for workers
Child labour is said to be employed in the tanneries. Textiles The exposure of workers to dusts from material such as silk, cotton, wool, flax,
hemp, sisal, and jute which occur during weaving, spinning, cutting, ginning, and packaging cause nasal or bladder cancer
Manual handling, the lifting, holding, putting down, pushing, pulling, carrying or movement of a load, is the largest cause of injury in the textiles sector
In some of the units child labour is also said to be employed. Dyes and Chemicals
Depletion of ground water due to large volume of water usage in the process of dyeing resulting in water related problems in the community.
Contamination of groundwater due to waste water discharge in the ground leads to health related problem.
Since the workers are working with different dye colours, it is usually found that their skin colour changes to the colour of dye
Electroplating The workers are exposed routinely and persistently to the pollutants in the environment of the electroplating unit and suffer from various health problem.
The employed labours are mostly illiterate and are not aware of the safety procedures or the impact of pollutants on their health
In some of the units women labour is also employed. Brick Kilns The major social issue is related to occupational health and safety of the workers
In brick kilns industry child labour and bonded labour is the problem Ceramics The main occupational hazard is the exposure to fine airborne particulates in the
form of silica dust (SiO2), deriving from silica sands and feldspar in the workplace. Exposure to heat during operation and maintenance of furnaces or other hot
equipment results in severe burns. Glassware The workers are exposed to heat, dust and noise pollution
Low wages is another social issue of the glassware industry. Cement Plants
The workers are exposed to fine particulates of dust, heat, noise and vibration The workers are also exposed to unhealthy practices like lifting of heavy weight
and over-exertion in the polluted environment Paper Industry
The workers are exposed to air pollution.
Source: Cluster study of the identified sub-sectors.
47
3.6 Addressing the identified BR issues
3.6.1 Various institutions, both public and private, have taken strive towards addressing the environmental and social issues that have been identified in the study. For example, in the foundry sub-sector sector around 28 clusters have been identified of which 14 are supported under any schemes or programmes on cluster development. However, one needs to ponder on the fact that given the number of existing clusters there exist a tremendous scope and scale of intervention to address the environmental and social issues.
3.6.2 Moreover, there exist various governmental support schemes of ‘social sector ministries’ dealing with environment , women and child, non-formal education, social justice and empowerment etc that can be applied in clusters to address the environmental and social issues prevalent in the cluster. Illustration of some of the schemes that could support BR initiatives in clusters is noted below.
a. Special Health Scheme for Rural Areas (NRHM) under the aegis of Ministry of Health and Family Welfare promotes outreach services in rural and high density urban slum population of the country. The financial assistance is available to the voluntary organizations for encouraging them to set up new hospitals/dispensaries in rural areas or to expand and improve the existing hospital facilities. In association with local NGOs, clusters located in rural areas can work towards providing a better access to health care by utilizing the assistance under the scheme. This can lead to economic pay offs to cluster firms by way of reducing incidence of absenteeism.
b. Industrial Pollution Abatement through Preventive Strategies under the aegis of Ministry of Forest and Environment provide assistance to SMEs who do not have access to the requisite technical expertise. The assistance is towards building capacities of SMEs to tackle pollution related issues. This can lead to economic pay offs to cluster firms by way of reduction in process wastage and potential for recycling.
c. Scheme of Support to Voluntary Agencies for Adult Education and Skill Development under the aegis of Department of Elementary Education & Literacy and Department of Secondary & Higher Education helps improve the occupational skills and technical knowledge of the neo-literates and the trainees and to raise their efficiency and increase productive ability. This can lead to economic pay offs to cluster firms by way of better supply of skilled personnel.

48
The list of relevant social sector schemes that are applicable in MSME clusters are provided in Annex 1.
49
Chapter A4
Way Forward 4.1 MSMEs in India are economically significant and play a pivotal role in the social development of the country in terms of development of backward areas, large scale employment, touch upon the lives of most vulnerable and marginalised like women, backward community, minorities etc. However, in terms of business responsibility, the incidence of consumption of fossil fuel, environmental degradation and social issues like child labour, OHS, etc are similarly significant in MSMEs that needs attention both at the policy and implementation level. The Government along with the support of the private sector have to play a pivotal role in addressing the energy, environmental and social issues that are prevalent in the cluster since at times addressing these issues require investment that is beyond the capacity of MSMEs, no direct impact on profit and the gestation period is high. 4.2 This chapter attempts to provide some actionable agenda for the policy makers, private sector and other knowledge based institutions that have a role to play in addressing the business responsibility issue in MSMEs. The following ‘actionable steps need to be taken up at the policy level to engage MSMEs in fostering development covering environmental and social dimensions.
o Putting in place a proper management structure: Business responsibility (BR) is unique and does not fall under the ambit of any particular sector or theme. Therefore at the policy level BR issues should to be tackled by all the relevant Ministries through inter-ministerial cooperation, wherein an apex committee/ body should be created. The apex committee/ platform should comprise of representatives from all the relevant ministries, with Ministry of Corporate Affairs or Ministry of MSME as the facilitator wherein information and knowledge related to BR will be shared and discussed. The purpose of the apex committee/ body is to provide a platform wherein representatives from the various ministries can discuss their concerns, share their experiences, facilitate cross learning and provide solutions to BR issues addressed.
o Mapping of clusters: In India it has been estimated that there are around 6500 cluster. However, the status of the identified clusters in terms of environmental degradation, energy consumption, and incidence of social issues is not mapped. The clusters that majorly contribute towards environment degradation or have high incidence of social issues like child labour or gender inequality, needs to be identified and ranked based on the degree of incidence of such BR issues. This ranking of clusters will be done based on a set of selected parameters like volume of coal consumed as a percentage of total
50
production, male to female labour ratio, water pollutant present in the water discharged etc.
o Selection of cluster for intervention: Every government programme/ scheme has unique objective, target group and volume of financial support. On the basis of the objective of the support programme/ scheme and ranking of the clusters based on BR issues, the typology of clusters to be intervened needs to be selected.
Similarly, decisions on selection of cluster for intervention can be taken based on the available financial resources and time period of intervention.
o Implementation of support schemes/programmes: The implementation at the cluster level should be coordinated by the implementing agency appointed by the State government/ Central government in consultation with the local government. For the selection of the implementing agency, the State/ Central government should be equipped with the list of technical institutes or organisations that have worked at the clusters to address the various BR issues. For implementation a network should be created at the cluster level that comprise of technical institutes, various R&D institutes, educational institutes, NGOs and sector specialists for identification of the pressure points in the cluster, draw the action plan and accordingly implement at the cluster level.
o Monitoring and evaluation (M&E): Monitoring system should be in place at all the level. At the cluster level, day to day monitoring of the output will be done by the implementing agency and reported to the local government. The local government to monitor the outcome and the overall monitoring and evaluation to be done by the state/central government. The State/ Central government will monitor the support programme in terms of number of cluster supported, financial disbursement, impact of the support etc. Since dovetailing BR agenda with competitiveness is an emerging phenomenon, it is important to put in place a system that provides constant learning and inputs to policy makers.
o Disclosure of BR issues and incentive for such initiative: It has been observed that the BR issues are addressed by MSMEs when there is buyer pressure or regulatory and judicial pressure i.e. when there is a threat or external pressure. The other approach should be to encourage the clusters through incentivising them for addressing such BR issues in the form of financial loan at a lower interest rate, grant support etc. Steps should also be taken for disclosure of BR issues.
51
o National Voluntary Guideline (NVG): The MSMEs should be made aware of the benefits of following the National Voluntary Guideline (NVG). A proper awareness programme on NVG should be conducted for MSMEs wherein the process and benefits of following the National Voluntary Guidelines will be imparted.
o Role of cluster associations: Cluster associations can play a pivotal role in the growth and development of the clusters. To address the BR issues existing in clusters, associations can play multiple roles as illustrated below- Identification of support scheme/ programme available to address the specific BR
issue that is prevalent in the cluster and implement such schemes/ programmes in the cluster.
Identification and linking of proper BDS providers to address the BR issue. Facilitate creation of network of BDS providers, R&D institute, educational
institute and other related organisation.
However, the government have to take a step towards capacitating the cluster associations through introducing programmes/ schemes for training of BMO office bearers and executives and handhold them to draw up their business plan and implementation.
o Cluster Development Agent for cluster intervention: For addressing BR issues, especially environmental issues that require technical inputs, it is imperative that instead of an individual CDA, a team is constituted comprising of individuals having experience in identifying and addressing energy issues, environment issues and social issues. Cluster development agents (CDAs) will need to be trained through specialised designed training programmes that help him/her to diagnose BR issues better and then design interventions accordingly. Moreover, the cluster key stakeholders should also be trained in the area of BR as this would bring both the implementer and the beneficiary at the same level of understanding and the need to address such issues.
o Revisiting the Developmental Schemes: The developmental schemes should be audited by the respective ministries themselves to understand the magnitude of the BR issues addressed and accordingly either revise the existing scheme or design a new scheme as per the requirement.
o Inclusion of MSMEs under PAT scheme: MSMEs also contribute significantly to energy consumption given the traditional method of manufacturing, wherein per unit cost of fuel consumption is more in comparison to large companies. Therefore the PAT (Perform, Achieve, then Trade) scheme should also include MSMEs. Moreover, the scheme should be implementable at the group level as well, like clusters, special economic zones, cooperatives etc.
52
Bibliography
Apparel Export Promotion Council. (n.d.).
Central Pollution Control Board, CPCB. http://www.cpcb.nic.in/Industry_Specific_Standards.php)
Cluster Observatory, http://clusterobservatory.in/cluster/index.php.
Council for Leather Exports, 2009
Dun and Bradstreet Economy Outlook 2010-11.
Eleventh Five Year Plan 2007-12.
India: Strengthening Institutions for Sustainable Growth Country Environmental Analysis, World Bank.
ITP Division, Ministry of External Affairs, 2010.
Ministry of MSME, Annual Report 2006-07, Government of India .
Ministry of MSME. Annual Report 2006-07.
Ministry of Statistics and Programme Implementation, Annual Sample Survey of India (ASI), 2005-06
Ministry of Statistics and Programme Implementation, NIC- 2004.
Ministry of Statistics and Programme Implementation, NIC- 2004.
Ministry of Textiles, Annual Report 2010-11.
Policy and Status Paper on Cluster Development in India, FMC 2007.
www.msmementor.in.

53
SECTION - B
54
Chapter-B1
Foundry
1.1 Economic Significance
1.1.1The impetus of Foundry Sector in India was given by machinery manufacturing for Jute Industry in Bengal and textile machine cotton Industry in Mumbai in late 19th century. The establishment of TISCO, Bengal Iron Company and IISCO led to a remarkable use of castings in both domestic and Industrial Area. A foundry is a factory which produces metal castings from either ferrous or non-ferrous alloys. The typology of products produced under this sector are- Automotive/oil engines/Diesel Engines Pumps/valves/Fans Electric motors Machine Tools/machine parts Tractors Parts /agricultural implements/Chaff cutters Food Processing Industry/Sugar Industry Textile machinery Others
1.2 Geographical concentration of Foundry Clusters
1.2.1 The Foundry units in India are mostly located in clusters; notable among them are Howrah, Rajkot, Agra, Jamnagar, Belgaum, Kolhapur, Coimbatore and Hyderabad. Foundry units are concentrated in states of West Bengal, Gujarat, Haryana, Maharashtra, Punjab, Tamil Nadu, Karnataka, Andhra Pradesh and Jharkhand. Concentration of foundries is correlated to the spread of Engineering and Automobile Industries.
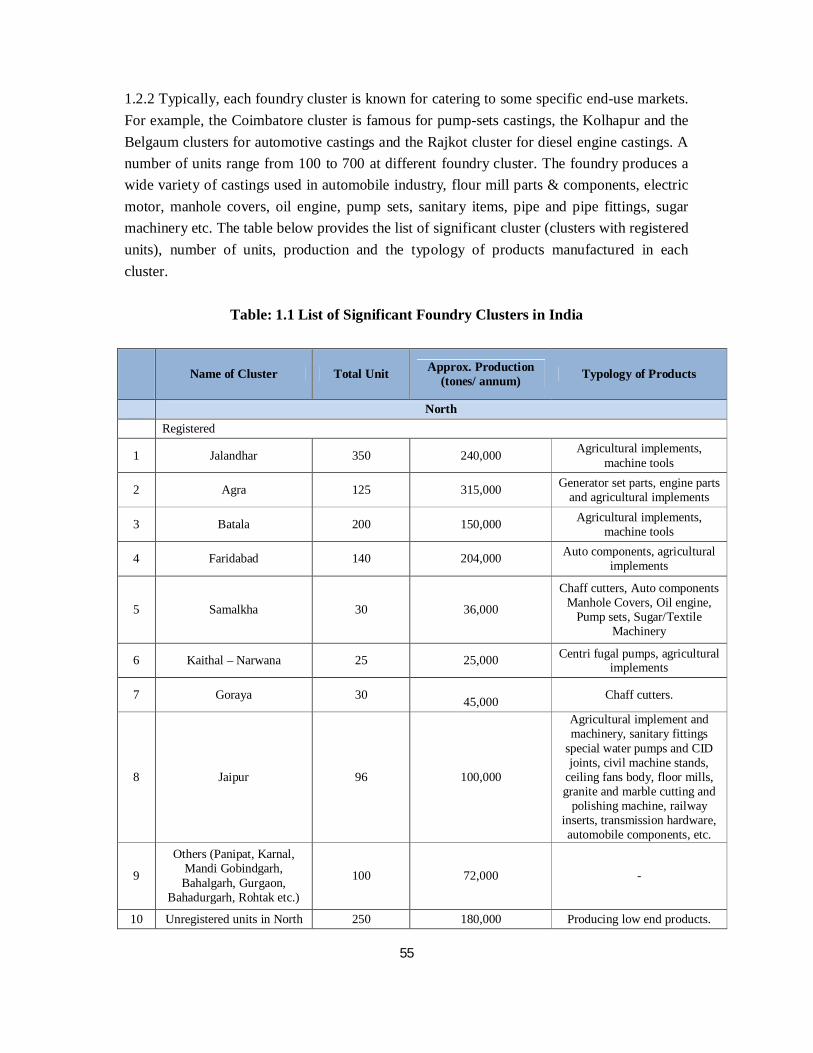
55
1.2.2 Typically, each foundry cluster is known for catering to some specific end-use markets. For example, the Coimbatore cluster is famous for pump-sets castings, the Kolhapur and the Belgaum clusters for automotive castings and the Rajkot cluster for diesel engine castings. A number of units range from 100 to 700 at different foundry cluster. The foundry produces a wide variety of castings used in automobile industry, flour mill parts & components, electric motor, manhole covers, oil engine, pump sets, sanitary items, pipe and pipe fittings, sugar machinery etc. The table below provides the list of significant cluster (clusters with registered units), number of units, production and the typology of products manufactured in each cluster.
Table: 1.1 List of Significant Foundry Clusters in India
Name of Cluster Total Unit Approx. Production (tones/ annum) Typology of Products
North
Registered
1 Jalandhar 350 240,000 Agricultural implements, machine tools
2 Agra 125 315,000 Generator set parts, engine parts and agricultural implements
3 Batala 200 150,000 Agricultural implements, machine tools
4 Faridabad 140 204,000 Auto components, agricultural implements
5 Samalkha 30 36,000
Chaff cutters, Auto components Manhole Covers, Oil engine,
Pump sets, Sugar/Textile Machinery
6 Kaithal – Narwana 25 25,000 Centri fugal pumps, agricultural implements
7 Goraya 30 45,000 Chaff cutters.
8 Jaipur 96 100,000
Agricultural implement and machinery, sanitary fittings
special water pumps and CID joints, civil machine stands,
ceiling fans body, floor mills, granite and marble cutting and
polishing machine, railway inserts, transmission hardware, automobile components, etc.
9
Others (Panipat, Karnal, Mandi Gobindgarh, Bahalgarh, Gurgaon,
Bahadurgarh, Rohtak etc.)
100 72,000 -
10 Unregistered units in North 250 180,000 Producing low end products.
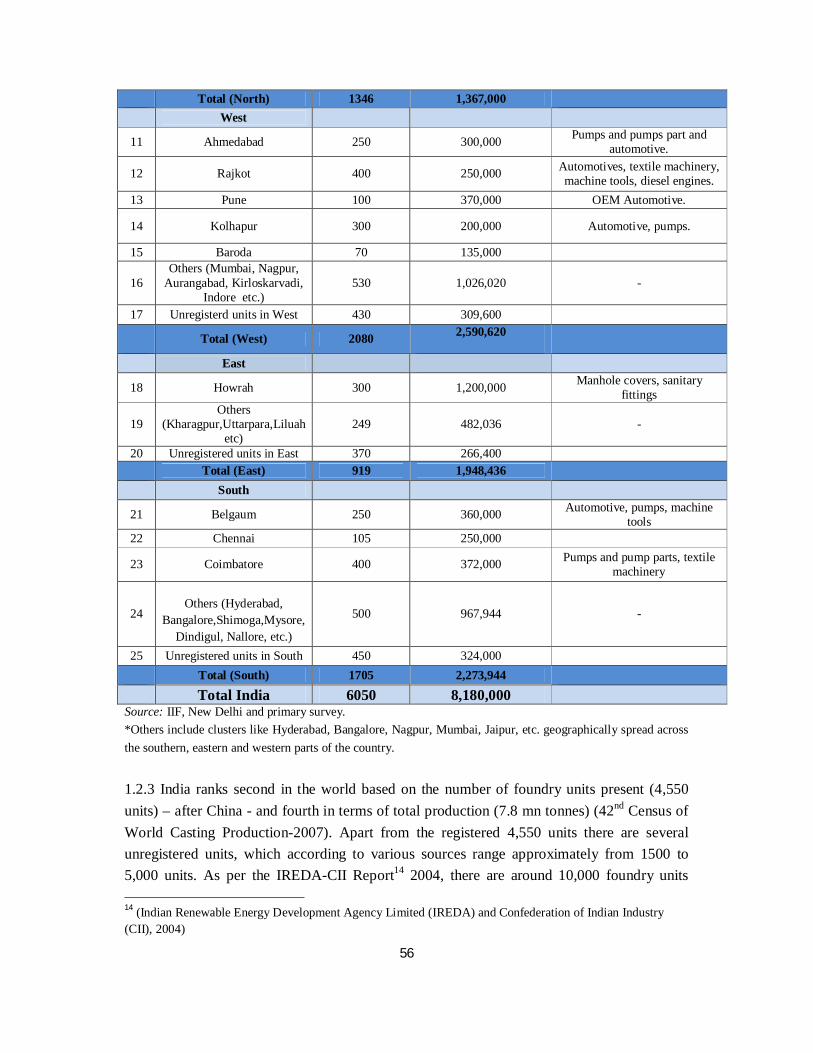
56
Total (North) 1346 1,367,000 West
11 Ahmedabad 250 300,000 Pumps and pumps part and automotive.
12 Rajkot 400 250,000 Automotives, textile machinery, machine tools, diesel engines.
13 Pune 100 370,000 OEM Automotive.
14 Kolhapur 300 200,000 Automotive, pumps.
15 Baroda 70 135,000
16 Others (Mumbai, Nagpur,
Aurangabad, Kirloskarvadi, Indore etc.)
530 1,026,020 -
17 Unregisterd units in West 430 309,600
Total (West) 2080 2,590,620
East 18 Howrah 300 1,200,000 Manhole covers, sanitary
fittings
19 Others
(Kharagpur,Uttarpara,Liluah etc)
249 482,036 -
20 Unregistered units in East 370 266,400 Total (East) 919 1,948,436 South
21 Belgaum 250 360,000 Automotive, pumps, machine tools
22 Chennai 105 250,000 23 Coimbatore 400 372,000 Pumps and pump parts, textile
machinery
24
Others (Hyderabad,
Bangalore,Shimoga,Mysore, Dindigul, Nallore, etc.)
500 967,944 -
25 Unregistered units in South 450 324,000 Total (South) 1705 2,273,944 Total India 6050 8,180,000 Source: IIF, New Delhi and primary survey.
*Others include clusters like Hyderabad, Bangalore, Nagpur, Mumbai, Jaipur, etc. geographically spread across the southern, eastern and western parts of the country.
1.2.3 India ranks second in the world based on the number of foundry units present (4,550 units) – after China - and fourth in terms of total production (7.8 mn tonnes) (42nd Census of World Casting Production-2007). Apart from the registered 4,550 units there are several unregistered units, which according to various sources range approximately from 1500 to 5,000 units. As per the IREDA-CII Report14 2004, there are around 10,000 foundry units 14 (Indian Renewable Energy Development Agency Limited (IREDA) and Confederation of Indian Industry (CII), 2004)
57
present in India including registered and unregistered units. Considering that 4,550 units are registered, the total number of units unregistered is around 5,450 units. As per the estimation of experts of the foundry sector, there are around 1,500 unregistered foundry units that are scattered across the country. This discrepancy in unregistered units is mainly due to the fact that the 5,450 units included all kinds of micro and small units engaged in castings. Whereas the 1,500 units data incorporates only those foundry units that are engaged to grey iron casting and use conventional cupola and excludes those units that are too micro in nature and use crucible for melting of metals. Also several foundry units had closed due to non compliance with the pollution standard set by the government, e.g. Howrah, Agra and nearby areas. Of the total foundry units present 90 per cent are small and micro units. Most of these units are situated in clusters, with cluster size ranging from 30-500 units. 1.2.4 Similar, discrepancies exist in total production, where as per the 42nd Census of World Casting Production-2007, there are 4550 units producing 7.8 mn tonnes of castings whereas as per the IIF data, there are 4,550 units producing 7.1 mn tonnes of casting. In our study we will consider the data provided by IIF. Considering there are 1,500 unregistered units producing grey iron castings, the total production capacity of the unregistered unit is 1.1 mn tonnes per annum. Therefore the total casting production in India, including both registered and unregistered unit is 8.2 mn tonnes. The industry is labour intensive and employs around 0.5 mn people directly and around 0.15 mn indirectly. The labour intensity depends on the size of the firm, which is inversely related. The small units mostly depend on manual labour in comparison to medium and large units that are semi or fully mechanized. The export of castings from India is worth Rs.34,560 mn for the financial year 2005-06. These exports are mainly to USA and European Countries. 1.2.5 Of the total number of registered units, 800 units are engaged in the production of non-ferrous alloy, 700 units are engaged in steel casting and the rest (around 3,050) are engaged to grey iron casting. The total production of castings of these units is approximately 7.1 mn tonnes per annum. Of the total production of registered castings, 72% are grey iron, 10% steel casting, 10% SG Iron and 8% non-ferrous castings. 1.3 Production process
A typical foundry process includes the following activities- melting and metal treatment in the melting shop; preparation of molds and cores in the molding shop, casting of molten metal into the mold, cooling for solidification, and removing the casting from molds in the casting shop; and finishing of raw casting in the finishing shop- as shown in the figure below.
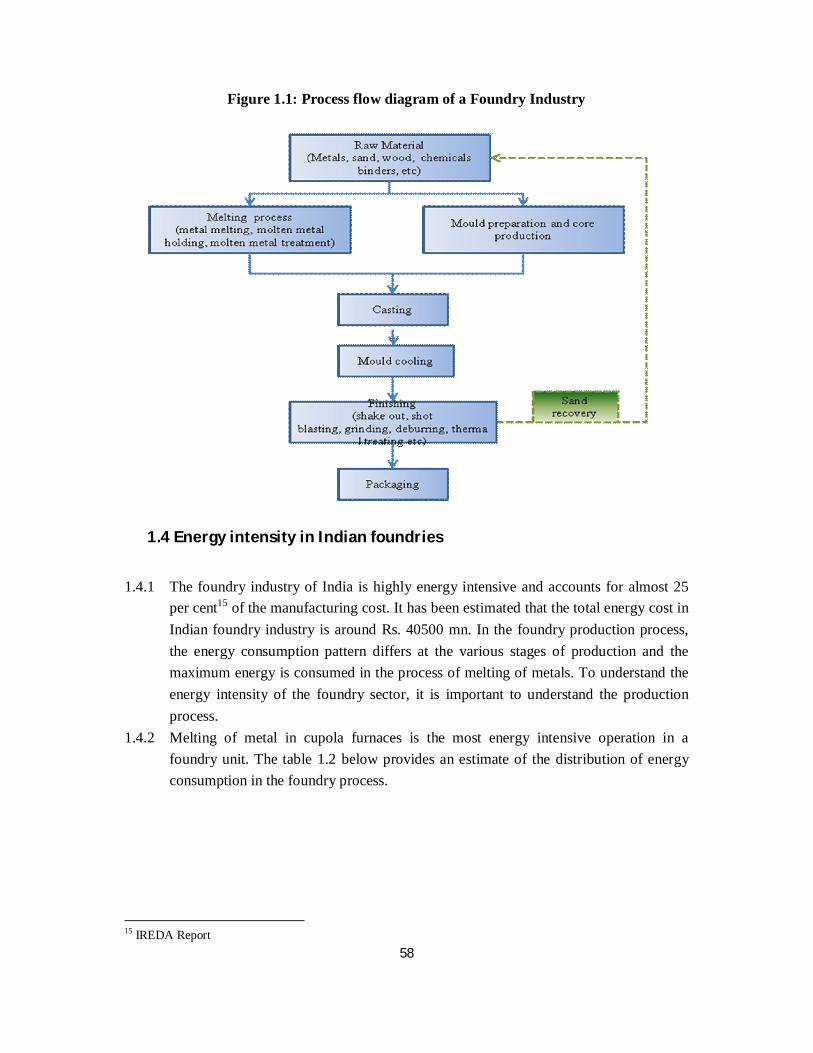
58
Figure 1.1: Process flow diagram of a Foundry Industry
1.4 Energy intensity in Indian foundries
1.4.1 The foundry industry of India is highly energy intensive and accounts for almost 25
per cent15 of the manufacturing cost. It has been estimated that the total energy cost in Indian foundry industry is around Rs. 40500 mn. In the foundry production process, the energy consumption pattern differs at the various stages of production and the maximum energy is consumed in the process of melting of metals. To understand the energy intensity of the foundry sector, it is important to understand the production process.
1.4.2 Melting of metal in cupola furnaces is the most energy intensive operation in a foundry unit. The table 1.2 below provides an estimate of the distribution of energy consumption in the foundry process.
15 IREDA Report

59
Table 1.2: Distribution of Energy Consumption
Sections Energy Consumption (%)
1. Melting 70 2. Moulding and core making 10 3. Sand plant 6 4. Lighting 5 5. Compressor 5 6. Other 4
Source: (Arasu & Jeffrey, 2009) Indian Foundry Congress.
1.4.3 The energy consumption pattern in Indian foundries varies according to the size of the unit, i.e. for medium and large scale units the major energy usage is electrical energy used for induction and arc furnaces whereas in small and micro units coke is used for melting metal in the cupola furnace. Most of the small and micro foundry units are family owned and managed and the awareness level on energy conservation is very limited. The production processes of these small units are highly energy inefficient and have a large potential, in the range of 25 to 65 percent, to save energy through adoption of improved cupola design. Coke is the main source of energy in cupola furnace and its energy efficiency is measured in terms of the amount of metal charged/ molten metal produced by one tonne of charged coke. In a cold blast cupola for molten metal temperature in the range of 1380-1410oC the coke consumption is about 150-200 kg/ MT of molten metal. This is known as CFR or coke feed ratio and is denoted either by a ratio or as a percentage. The lower the CFR, the more efficient is the cupola. It has been generally observed in case of conventional cupola the CFR ranges from 1:4 to 1:6 and in case of divide blast cupola (DBC) the range is from 1:8 to 1:10 based on the field experience in foundries clusters like Samalkha, Faridabad, Batala etc. However, energy audits conducted by TERI in 1993-94 in representative units in Agra foundry cluster reveal that the CFR ranges from 1:3.2 in conventional cupolas and 1:5.3 in DBC16.
1.4.4 The power consumption in induction melting furnace of capacity 12-15 tonnes is in the range of 625-650 kWh/ tonne of metal (cast iron) melted and 1-3 tonnes is in the range of 700-725 kWh/ tonne of metal melted. In induction furnace electric loss consist of losses in transformer, frequency converter, capacitor banks cable and coil losses and heat losses from furnace wall to coil side (carried away by cooling water), radiation from melt surface and slag removal. Efficiency of medium frequency
16 TERI, 1993-04, Towards Cleaner Technologies
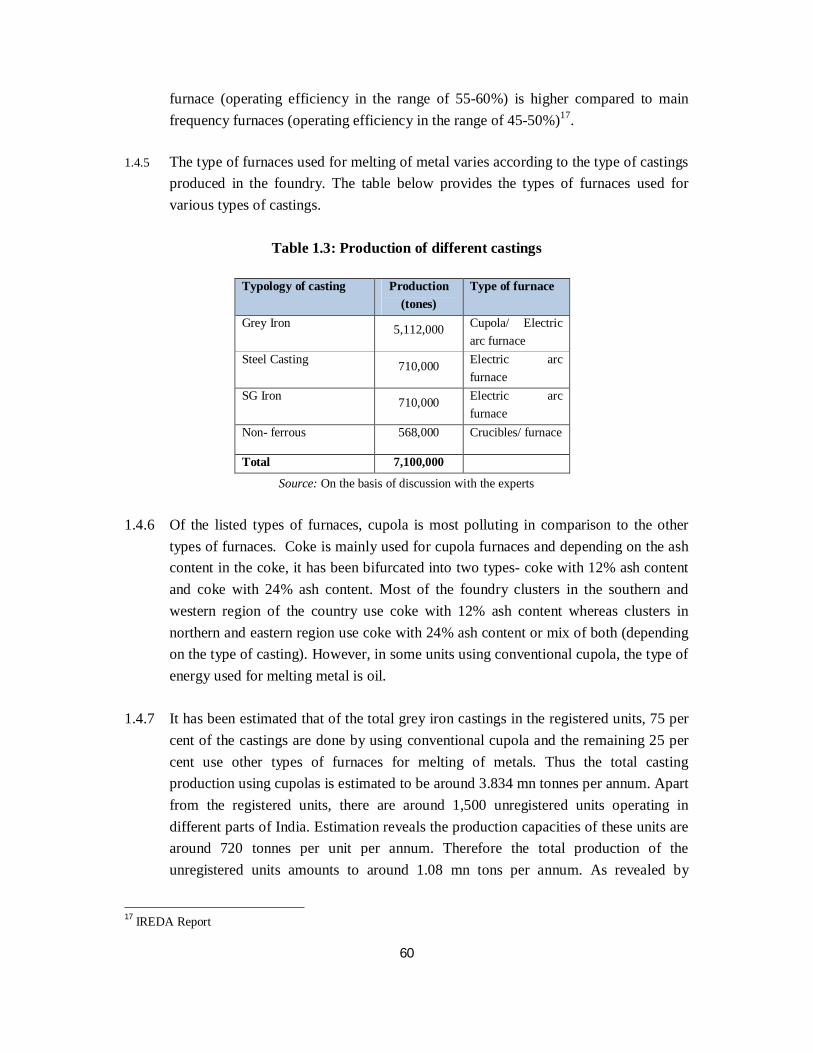
60
furnace (operating efficiency in the range of 55-60%) is higher compared to main frequency furnaces (operating efficiency in the range of 45-50%)17.
1.4.5 The type of furnaces used for melting of metal varies according to the type of castings produced in the foundry. The table below provides the types of furnaces used for various types of castings.
Table 1.3: Production of different castings
Source: On the basis of discussion with the experts
1.4.6 Of the listed types of furnaces, cupola is most polluting in comparison to the other types of furnaces. Coke is mainly used for cupola furnaces and depending on the ash content in the coke, it has been bifurcated into two types- coke with 12% ash content and coke with 24% ash content. Most of the foundry clusters in the southern and western region of the country use coke with 12% ash content whereas clusters in northern and eastern region use coke with 24% ash content or mix of both (depending on the type of casting). However, in some units using conventional cupola, the type of energy used for melting metal is oil.
1.4.7 It has been estimated that of the total grey iron castings in the registered units, 75 per
cent of the castings are done by using conventional cupola and the remaining 25 per cent use other types of furnaces for melting of metals. Thus the total casting production using cupolas is estimated to be around 3.834 mn tonnes per annum. Apart from the registered units, there are around 1,500 unregistered units operating in different parts of India. Estimation reveals the production capacities of these units are around 720 tonnes per unit per annum. Therefore the total production of the unregistered units amounts to around 1.08 mn tons per annum. As revealed by
17 IREDA Report
Typology of casting Production (tones)
Type of furnace
Grey Iron 5,112,000 Cupola/ Electric arc furnace
Steel Casting 710,000 Electric arc furnace
SG Iron 710,000 Electric arc furnace
Non- ferrous 568,000 Crucibles/ furnace
Total 7,100,000
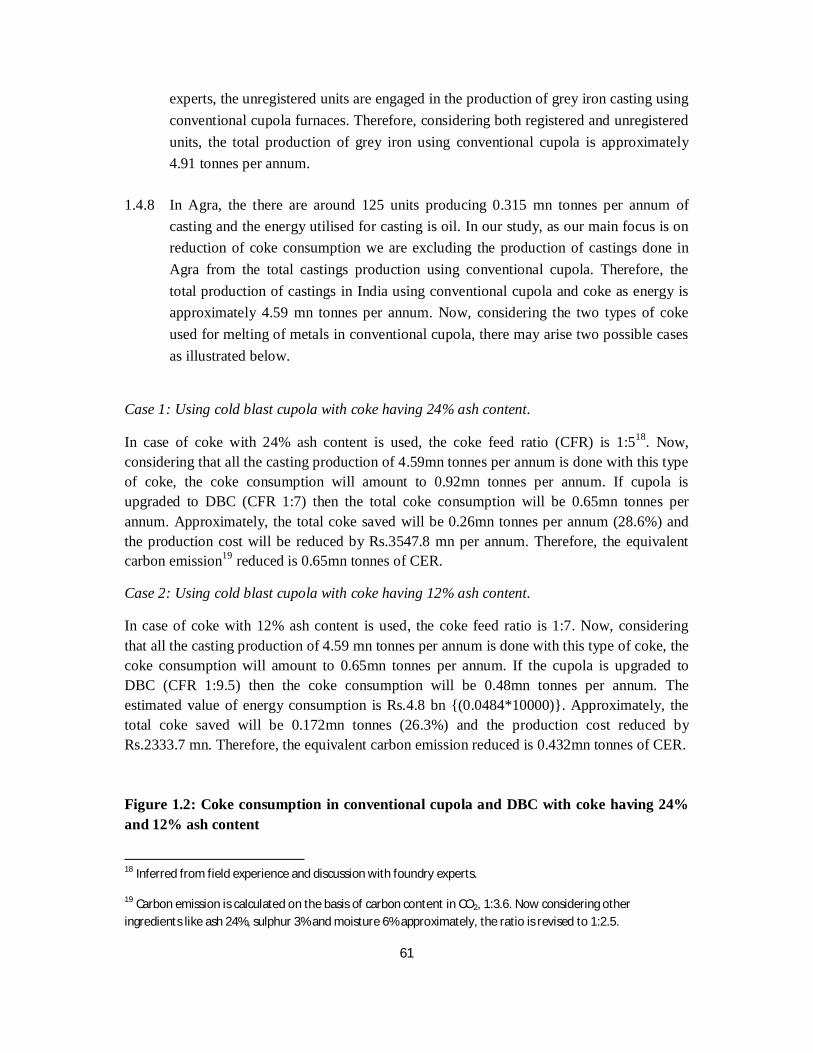
61
experts, the unregistered units are engaged in the production of grey iron casting using conventional cupola furnaces. Therefore, considering both registered and unregistered units, the total production of grey iron using conventional cupola is approximately 4.91 tonnes per annum.
1.4.8 In Agra, the there are around 125 units producing 0.315 mn tonnes per annum of casting and the energy utilised for casting is oil. In our study, as our main focus is on reduction of coke consumption we are excluding the production of castings done in Agra from the total castings production using conventional cupola. Therefore, the total production of castings in India using conventional cupola and coke as energy is approximately 4.59 mn tonnes per annum. Now, considering the two types of coke used for melting of metals in conventional cupola, there may arise two possible cases as illustrated below.
Case 1: Using cold blast cupola with coke having 24% ash content.
In case of coke with 24% ash content is used, the coke feed ratio (CFR) is 1:518. Now, considering that all the casting production of 4.59mn tonnes per annum is done with this type of coke, the coke consumption will amount to 0.92mn tonnes per annum. If cupola is upgraded to DBC (CFR 1:7) then the total coke consumption will be 0.65mn tonnes per annum. Approximately, the total coke saved will be 0.26mn tonnes per annum (28.6%) and the production cost will be reduced by Rs.3547.8 mn per annum. Therefore, the equivalent carbon emission19 reduced is 0.65mn tonnes of CER.
Case 2: Using cold blast cupola with coke having 12% ash content.
In case of coke with 12% ash content is used, the coke feed ratio is 1:7. Now, considering that all the casting production of 4.59 mn tonnes per annum is done with this type of coke, the coke consumption will amount to 0.65mn tonnes per annum. If the cupola is upgraded to DBC (CFR 1:9.5) then the coke consumption will be 0.48mn tonnes per annum. The estimated value of energy consumption is Rs.4.8 bn {(0.0484*10000)}. Approximately, the total coke saved will be 0.172mn tonnes (26.3%) and the production cost reduced by Rs.2333.7 mn. Therefore, the equivalent carbon emission reduced is 0.432mn tonnes of CER. Figure 1.2: Coke consumption in conventional cupola and DBC with coke having 24% and 12% ash content
18 Inferred from field experience and discussion with foundry experts.
19 Carbon emission is calculated on the basis of carbon content in CO2, 1:3.6. Now considering other ingredients like ash 24%, sulphur 3% and moisture 6% approximately, the ratio is revised to 1:2.5.
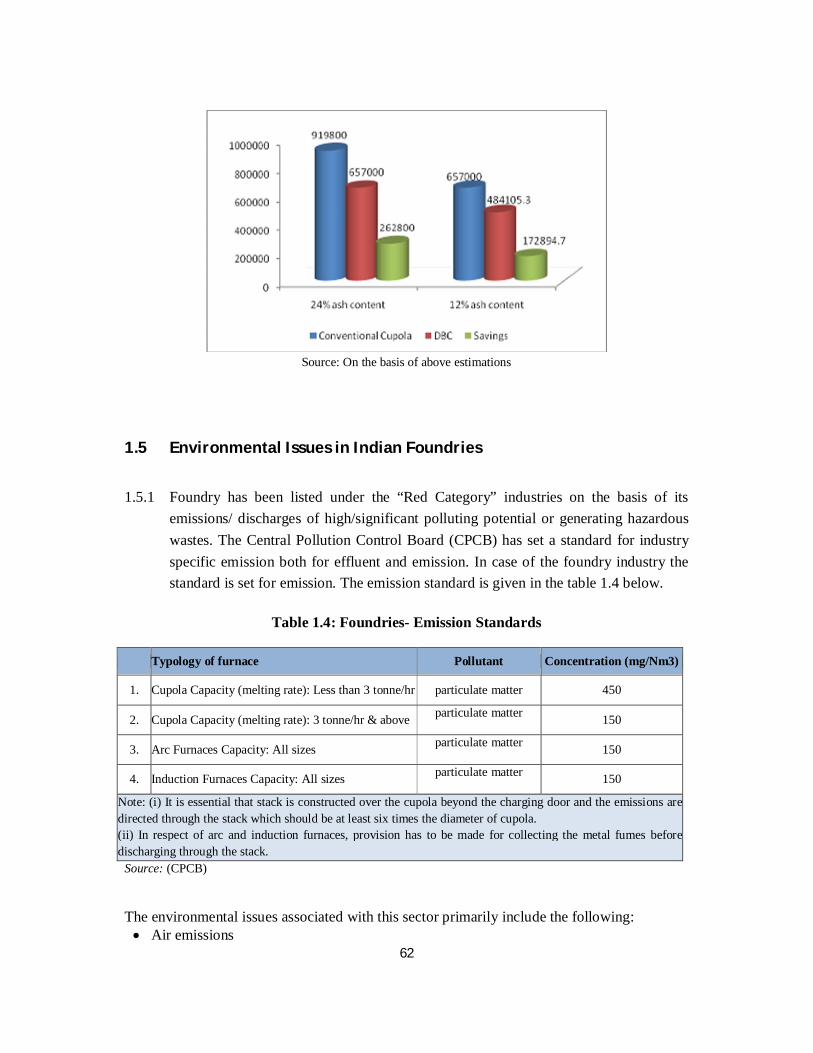
62
Source: On the basis of above estimations
1.5 Environmental Issues in Indian Foundries
1.5.1 Foundry has been listed under the “Red Category” industries on the basis of its
emissions/ discharges of high/significant polluting potential or generating hazardous wastes. The Central Pollution Control Board (CPCB) has set a standard for industry specific emission both for effluent and emission. In case of the foundry industry the standard is set for emission. The emission standard is given in the table 1.4 below.
Table 1.4: Foundries- Emission Standards
Typology of furnace Pollutant Concentration (mg/Nm3)
1. Cupola Capacity (melting rate): Less than 3 tonne/hr particulate matter 450
2. Cupola Capacity (melting rate): 3 tonne/hr & above particulate matter 150
3. Arc Furnaces Capacity: All sizes particulate matter 150
4. Induction Furnaces Capacity: All sizes particulate matter 150
Note: (i) It is essential that stack is constructed over the cupola beyond the charging door and the emissions are directed through the stack which should be at least six times the diameter of cupola. (ii) In respect of arc and induction furnaces, provision has to be made for collecting the metal fumes before discharging through the stack.
Source: (CPCB)
The environmental issues associated with this sector primarily include the following: Air emissions
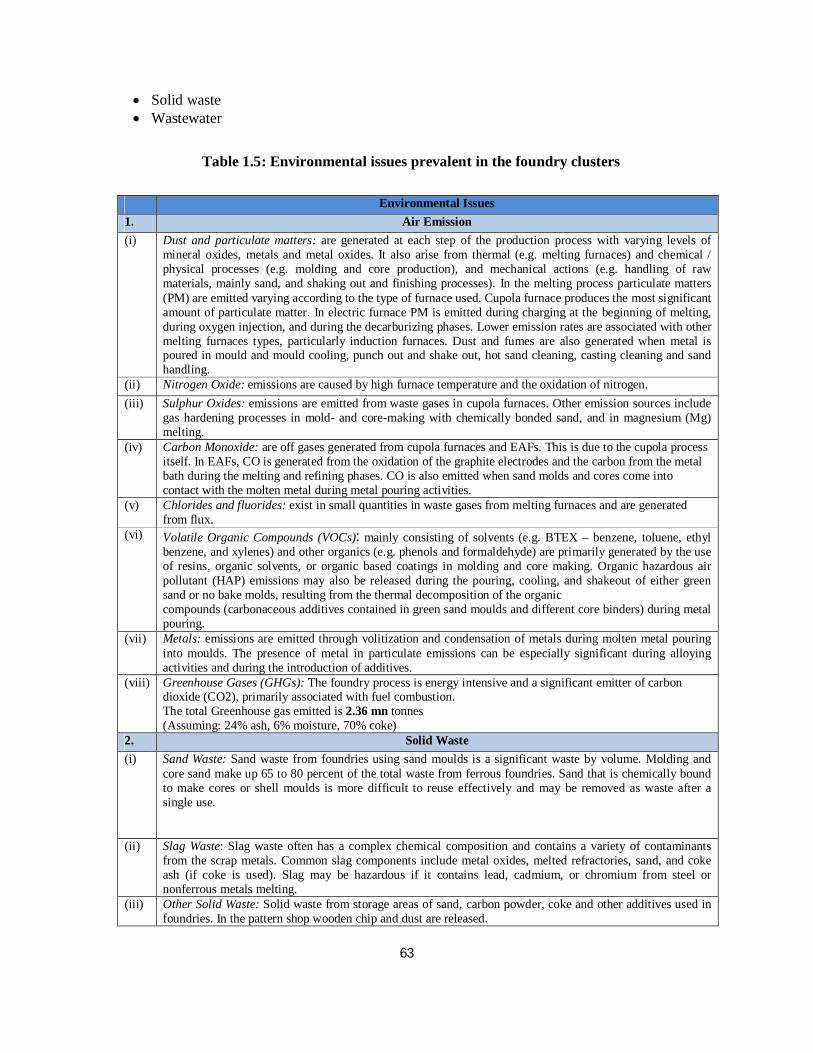
63
Solid waste Wastewater
Table 1.5: Environmental issues prevalent in the foundry clusters
Environmental Issues 1. Air Emission (i) Dust and particulate matters: are generated at each step of the production process with varying levels of
mineral oxides, metals and metal oxides. It also arise from thermal (e.g. melting furnaces) and chemical / physical processes (e.g. molding and core production), and mechanical actions (e.g. handling of raw materials, mainly sand, and shaking out and finishing processes). In the melting process particulate matters (PM) are emitted varying according to the type of furnace used. Cupola furnace produces the most significant amount of particulate matter. In electric furnace PM is emitted during charging at the beginning of melting, during oxygen injection, and during the decarburizing phases. Lower emission rates are associated with other melting furnaces types, particularly induction furnaces. Dust and fumes are also generated when metal is poured in mould and mould cooling, punch out and shake out, hot sand cleaning, casting cleaning and sand handling.
(ii) Nitrogen Oxide: emissions are caused by high furnace temperature and the oxidation of nitrogen. (iii) Sulphur Oxides: emissions are emitted from waste gases in cupola furnaces. Other emission sources include
gas hardening processes in mold- and core-making with chemically bonded sand, and in magnesium (Mg) melting.
(iv) Carbon Monoxide: are off gases generated from cupola furnaces and EAFs. This is due to the cupola process itself. In EAFs, CO is generated from the oxidation of the graphite electrodes and the carbon from the metal bath during the melting and refining phases. CO is also emitted when sand molds and cores come into contact with the molten metal during metal pouring activities.
(v) Chlorides and fluorides: exist in small quantities in waste gases from melting furnaces and are generated from flux.
(vi) Volatile Organic Compounds (VOCs): mainly consisting of solvents (e.g. BTEX – benzene, toluene, ethyl benzene, and xylenes) and other organics (e.g. phenols and formaldehyde) are primarily generated by the use of resins, organic solvents, or organic based coatings in molding and core making. Organic hazardous air pollutant (HAP) emissions may also be released during the pouring, cooling, and shakeout of either green sand or no bake molds, resulting from the thermal decomposition of the organic compounds (carbonaceous additives contained in green sand moulds and different core binders) during metal pouring.
(vii) Metals: emissions are emitted through volitization and condensation of metals during molten metal pouring into moulds. The presence of metal in particulate emissions can be especially significant during alloying activities and during the introduction of additives.
(viii) Greenhouse Gases (GHGs): The foundry process is energy intensive and a significant emitter of carbon dioxide (CO2), primarily associated with fuel combustion. The total Greenhouse gas emitted is 2.36 mn tonnes (Assuming: 24% ash, 6% moisture, 70% coke)
2. Solid Waste (i) Sand Waste: Sand waste from foundries using sand moulds is a significant waste by volume. Molding and
core sand make up 65 to 80 percent of the total waste from ferrous foundries. Sand that is chemically bound to make cores or shell moulds is more difficult to reuse effectively and may be removed as waste after a single use.
(ii) Slag Waste: Slag waste often has a complex chemical composition and contains a variety of contaminants from the scrap metals. Common slag components include metal oxides, melted refractories, sand, and coke ash (if coke is used). Slag may be hazardous if it contains lead, cadmium, or chromium from steel or nonferrous metals melting.
(iii) Other Solid Waste: Solid waste from storage areas of sand, carbon powder, coke and other additives used in foundries. In the pattern shop wooden chip and dust are released.
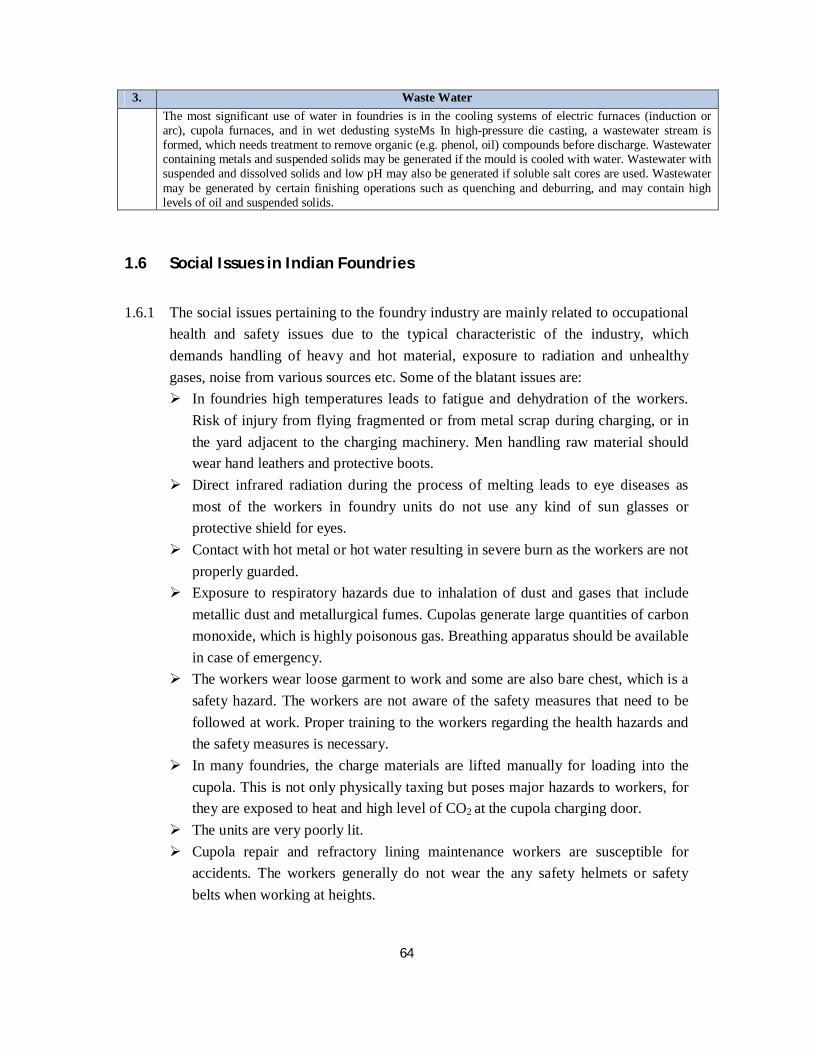
64
3. Waste Water The most significant use of water in foundries is in the cooling systems of electric furnaces (induction or
arc), cupola furnaces, and in wet dedusting systeMs In high-pressure die casting, a wastewater stream is formed, which needs treatment to remove organic (e.g. phenol, oil) compounds before discharge. Wastewater containing metals and suspended solids may be generated if the mould is cooled with water. Wastewater with suspended and dissolved solids and low pH may also be generated if soluble salt cores are used. Wastewater may be generated by certain finishing operations such as quenching and deburring, and may contain high levels of oil and suspended solids.
1.6 Social Issues in Indian Foundries
1.6.1 The social issues pertaining to the foundry industry are mainly related to occupational
health and safety issues due to the typical characteristic of the industry, which demands handling of heavy and hot material, exposure to radiation and unhealthy gases, noise from various sources etc. Some of the blatant issues are: In foundries high temperatures leads to fatigue and dehydration of the workers.
Risk of injury from flying fragmented or from metal scrap during charging, or in the yard adjacent to the charging machinery. Men handling raw material should wear hand leathers and protective boots.
Direct infrared radiation during the process of melting leads to eye diseases as most of the workers in foundry units do not use any kind of sun glasses or protective shield for eyes.
Contact with hot metal or hot water resulting in severe burn as the workers are not properly guarded.
Exposure to respiratory hazards due to inhalation of dust and gases that include metallic dust and metallurgical fumes. Cupolas generate large quantities of carbon monoxide, which is highly poisonous gas. Breathing apparatus should be available in case of emergency.
The workers wear loose garment to work and some are also bare chest, which is a safety hazard. The workers are not aware of the safety measures that need to be followed at work. Proper training to the workers regarding the health hazards and the safety measures is necessary.
In many foundries, the charge materials are lifted manually for loading into the cupola. This is not only physically taxing but poses major hazards to workers, for they are exposed to heat and high level of CO2 at the cupola charging door.
The units are very poorly lit. Cupola repair and refractory lining maintenance workers are susceptible for
accidents. The workers generally do not wear the any safety helmets or safety belts when working at heights.
65
Exposure to electrical hazards due to the presence of heavy-duty electrical equipment throughout foundries.
Handling of liquid metal may generate a risk of explosion, melt run out, and burns, especially when humidity is trapped in enclosed spaces and exposed to molten metal.
Raw and product material handling (e.g. waste metals, plates, bars), sand compacting, wood-model manufacturing, fettling and finishing may generate noise.
Most of the workers are contract workers who all are appointed through a contractor. These workers do not enjoy the facilities (e.g. leaves, bonus, health facilities etc) of that the permanent workers have.
In India, foundry workers are mainly male labourers, except for Coimbatore where female labourers are also present, given the typology of work environment prevailing in the foundry units.
1.7 Institutions/Associations
The table below (1.6) shows the list of institutions and associations of foundry sub-sector Table 1.6: List of technical institutions and associations of Foundry
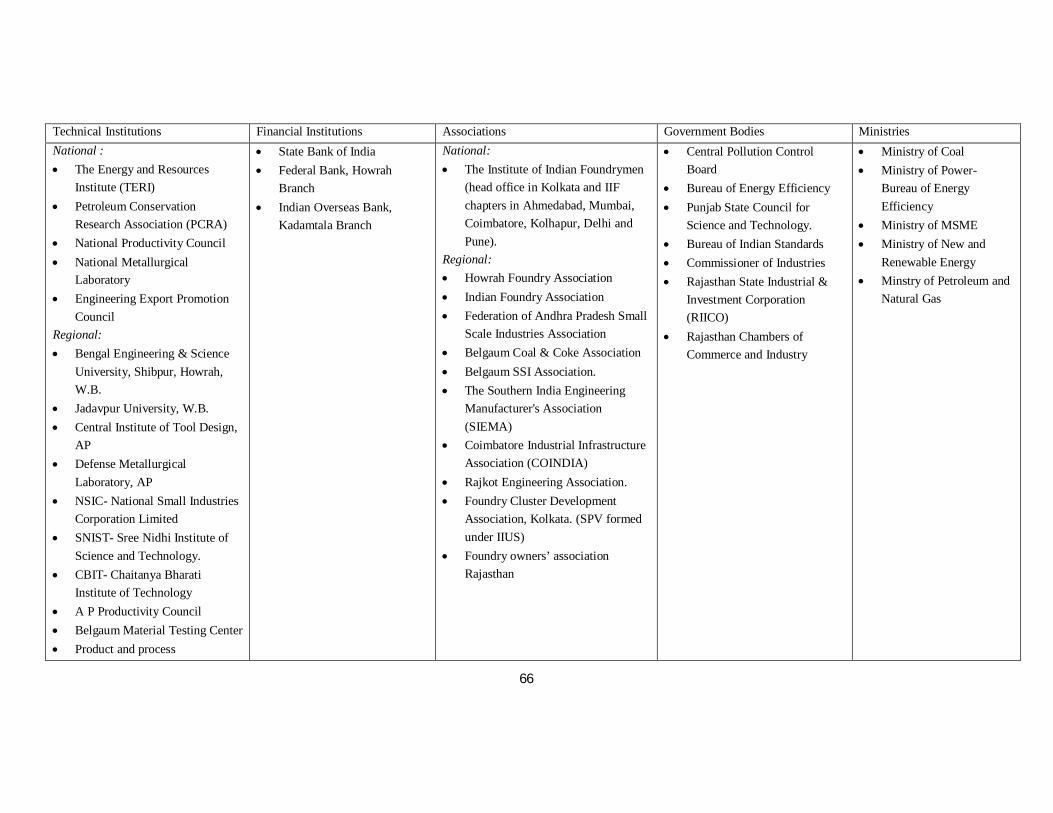
66
Technical Institutions Financial Institutions Associations Government Bodies Ministries National : The Energy and Resources
Institute (TERI) Petroleum Conservation
Research Association (PCRA) National Productivity Council National Metallurgical
Laboratory Engineering Export Promotion
Council Regional: Bengal Engineering & Science
University, Shibpur, Howrah, W.B.
Jadavpur University, W.B. Central Institute of Tool Design,
AP Defense Metallurgical
Laboratory, AP NSIC- National Small Industries
Corporation Limited SNIST- Sree Nidhi Institute of
Science and Technology. CBIT- Chaitanya Bharati
Institute of Technology A P Productivity Council Belgaum Material Testing Center Product and process
State Bank of India Federal Bank, Howrah
Branch Indian Overseas Bank,
Kadamtala Branch
National: The Institute of Indian Foundrymen
(head office in Kolkata and IIF chapters in Ahmedabad, Mumbai, Coimbatore, Kolhapur, Delhi and Pune).
Regional: Howrah Foundry Association Indian Foundry Association Federation of Andhra Pradesh Small
Scale Industries Association Belgaum Coal & Coke Association Belgaum SSI Association. The Southern India Engineering
Manufacturer's Association (SIEMA)
Coimbatore Industrial Infrastructure Association (COINDIA)
Rajkot Engineering Association. Foundry Cluster Development
Association, Kolkata. (SPV formed under IIUS)
Foundry owners’ association Rajasthan
Central Pollution Control Board
Bureau of Energy Efficiency Punjab State Council for
Science and Technology. Bureau of Indian Standards Commissioner of Industries Rajasthan State Industrial &
Investment Corporation (RIICO)
Rajasthan Chambers of Commerce and Industry
Ministry of Coal Ministry of Power-
Bureau of Energy Efficiency
Ministry of MSME Ministry of New and
Renewable Energy Minstry of Petroleum and
Natural Gas
67
Development Center , Agra Field Testing Station, National Test House, MNIT
1.8 Cluster Intervention
The table below shows the list of intervention in foundry clusters in India. Table 1.7: Interventions in Foundry clusters in India
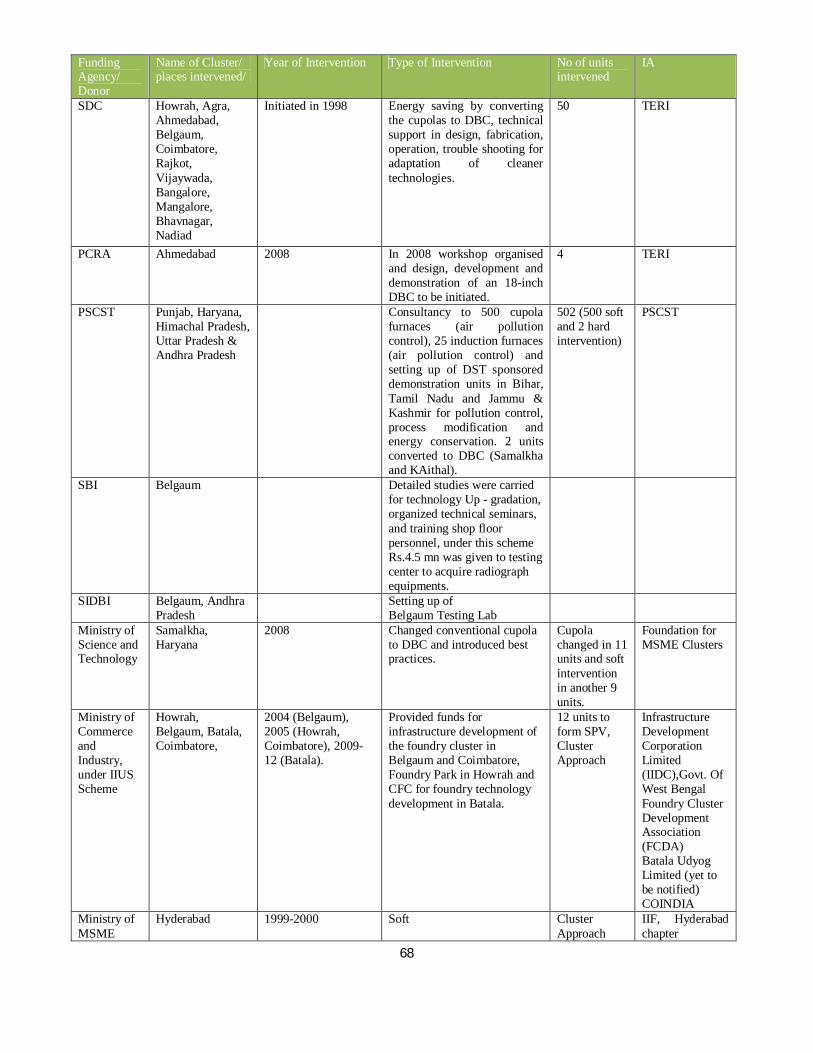
68
Funding Agency/ Donor
Name of Cluster/ places intervened/
Year of Intervention Type of Intervention No of units intervened
IA
SDC Howrah, Agra, Ahmedabad, Belgaum, Coimbatore, Rajkot, Vijaywada, Bangalore, Mangalore, Bhavnagar, Nadiad
Initiated in 1998 Energy saving by converting the cupolas to DBC, technical support in design, fabrication, operation, trouble shooting for adaptation of cleaner technologies.
50 TERI
PCRA Ahmedabad 2008 In 2008 workshop organised and design, development and demonstration of an 18-inch DBC to be initiated.
4 TERI
PSCST Punjab, Haryana, Himachal Pradesh, Uttar Pradesh & Andhra Pradesh
Consultancy to 500 cupola furnaces (air pollution control), 25 induction furnaces (air pollution control) and setting up of DST sponsored demonstration units in Bihar, Tamil Nadu and Jammu & Kashmir for pollution control, process modification and energy conservation. 2 units converted to DBC (Samalkha and KAithal).
502 (500 soft and 2 hard intervention)
PSCST
SBI Belgaum Detailed studies were carried for technology Up - gradation, organized technical seminars, and training shop floor personnel, under this scheme Rs.4.5 mn was given to testing center to acquire radiograph equipments.
SIDBI Belgaum, Andhra Pradesh
Setting up of Belgaum Testing Lab
Ministry of Science and Technology
Samalkha, Haryana
2008 Changed conventional cupola to DBC and introduced best practices.
Cupola changed in 11 units and soft intervention in another 9 units.
Foundation for MSME Clusters
Ministry of Commerce and Industry, under IIUS Scheme
Howrah, Belgaum, Batala, Coimbatore,
2004 (Belgaum), 2005 (Howrah, Coimbatore), 2009-12 (Batala).
Provided funds for infrastructure development of the foundry cluster in Belgaum and Coimbatore, Foundry Park in Howrah and CFC for foundry technology development in Batala.
12 units to form SPV, Cluster Approach
Infrastructure Development Corporation Limited (IIDC),Govt. Of West Bengal Foundry Cluster Development Association (FCDA) Batala Udyog Limited (yet to be notified) COINDIA
Ministry of MSME
Hyderabad 1999-2000 Soft Cluster Approach
IIF, Hyderabad chapter
69
Source: Individual websites and discussion with cluster experts.
1.9 Bibliography Arasu, M and LR Jeffery (2009), “Energy Consumption Studies in Cast Iron Foundries”, Transaction of 57th Indian Foundry Congress “Investors Manual for Energy Efficiency”, Indian Renewable Energy Development Agency and Confederation of Indian Industry, Pg 400 Pal,P. (2006),”Towards Cleaner Technologies, A process story of small scale foundries”, Swiss Agency and Development and Corporation and The Energy and Resource Institute 42nd Census of World Casting Production (2007), Modern Castings Websites http://www.thewfo.com/uploads/file/censusdec08.pdf
under MSECDP Scheme
Ahmedabad 2005-06 (H) & 2007-08 (S)
Soft & Hard (CFC) Cluster Approach
GITCO, Ahmedabad/ MSME-DI, Ahmedabad
Belgaum 2003-04 soft Cluster Approach
MSME-DI Bangalore Soft
Agra 2003-04 Hard Cluster Approach
PPDC, Agra
Howrah 2007-08 Soft Cluster Approach
MSME-DI, Kolkata
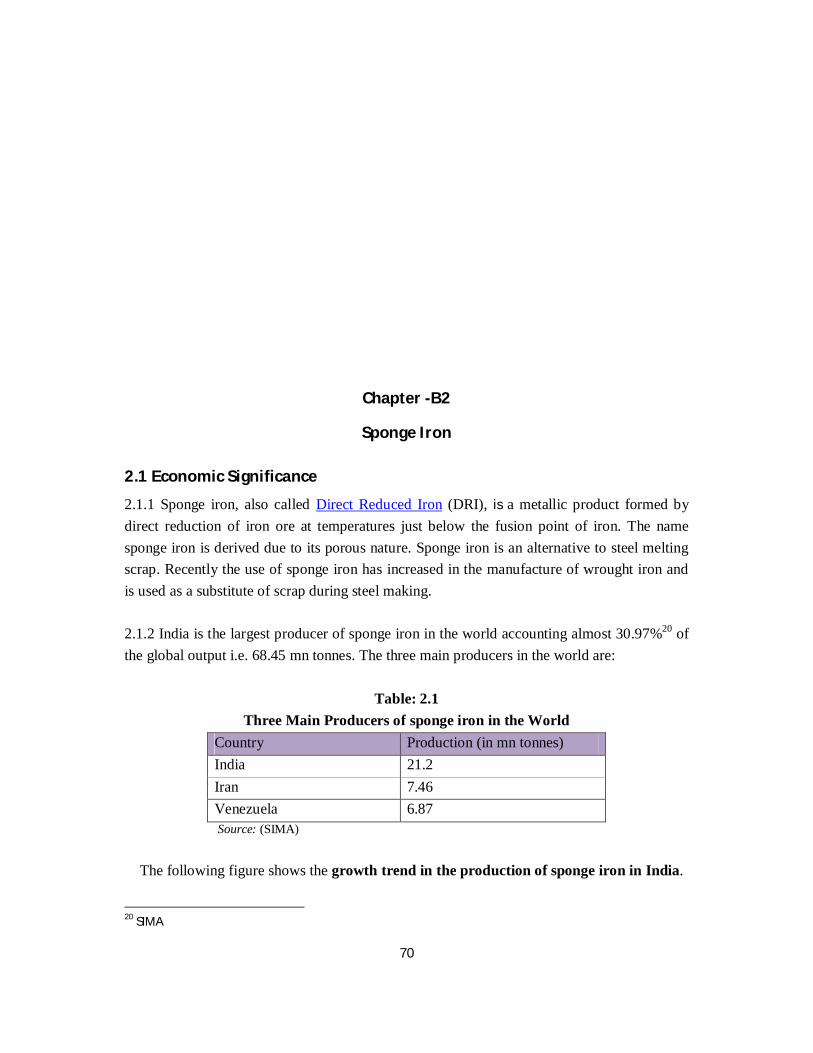
70
Chapter -B2
Sponge Iron
2.1 Economic Significance
2.1.1 Sponge iron, also called Direct Reduced Iron (DRI), is a metallic product formed by direct reduction of iron ore at temperatures just below the fusion point of iron. The name sponge iron is derived due to its porous nature. Sponge iron is an alternative to steel melting scrap. Recently the use of sponge iron has increased in the manufacture of wrought iron and is used as a substitute of scrap during steel making. 2.1.2 India is the largest producer of sponge iron in the world accounting almost 30.97%20 of the global output i.e. 68.45 mn tonnes. The three main producers in the world are:
Table: 2.1 Three Main Producers of sponge iron in the World
Country Production (in mn tonnes) India 21.2 Iran 7.46 Venezuela 6.87 Source: (SIMA)
The following figure shows the growth trend in the production of sponge iron in India.
20 SIMA
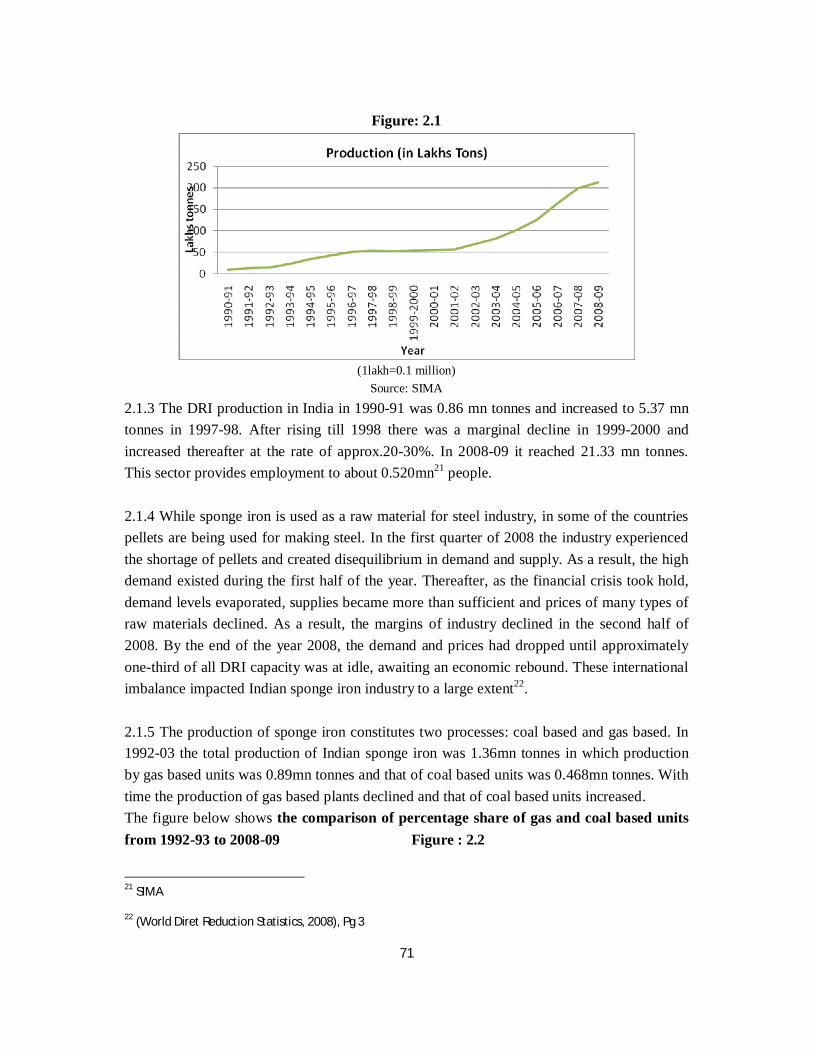
71
Figure: 2.1
(1lakh=0.1 million)
Source: SIMA
2.1.3 The DRI production in India in 1990-91 was 0.86 mn tonnes and increased to 5.37 mn tonnes in 1997-98. After rising till 1998 there was a marginal decline in 1999-2000 and increased thereafter at the rate of approx.20-30%. In 2008-09 it reached 21.33 mn tonnes. This sector provides employment to about 0.520mn21 people. 2.1.4 While sponge iron is used as a raw material for steel industry, in some of the countries pellets are being used for making steel. In the first quarter of 2008 the industry experienced the shortage of pellets and created disequilibrium in demand and supply. As a result, the high demand existed during the first half of the year. Thereafter, as the financial crisis took hold, demand levels evaporated, supplies became more than sufficient and prices of many types of raw materials declined. As a result, the margins of industry declined in the second half of 2008. By the end of the year 2008, the demand and prices had dropped until approximately one-third of all DRI capacity was at idle, awaiting an economic rebound. These international imbalance impacted Indian sponge iron industry to a large extent22. 2.1.5 The production of sponge iron constitutes two processes: coal based and gas based. In 1992-03 the total production of Indian sponge iron was 1.36mn tonnes in which production by gas based units was 0.89mn tonnes and that of coal based units was 0.468mn tonnes. With time the production of gas based plants declined and that of coal based units increased. The figure below shows the comparison of percentage share of gas and coal based units from 1992-93 to 2008-09 Figure : 2.2
21 SIMA
22 (World Diret Reduction Statistics, 2008), Pg 3
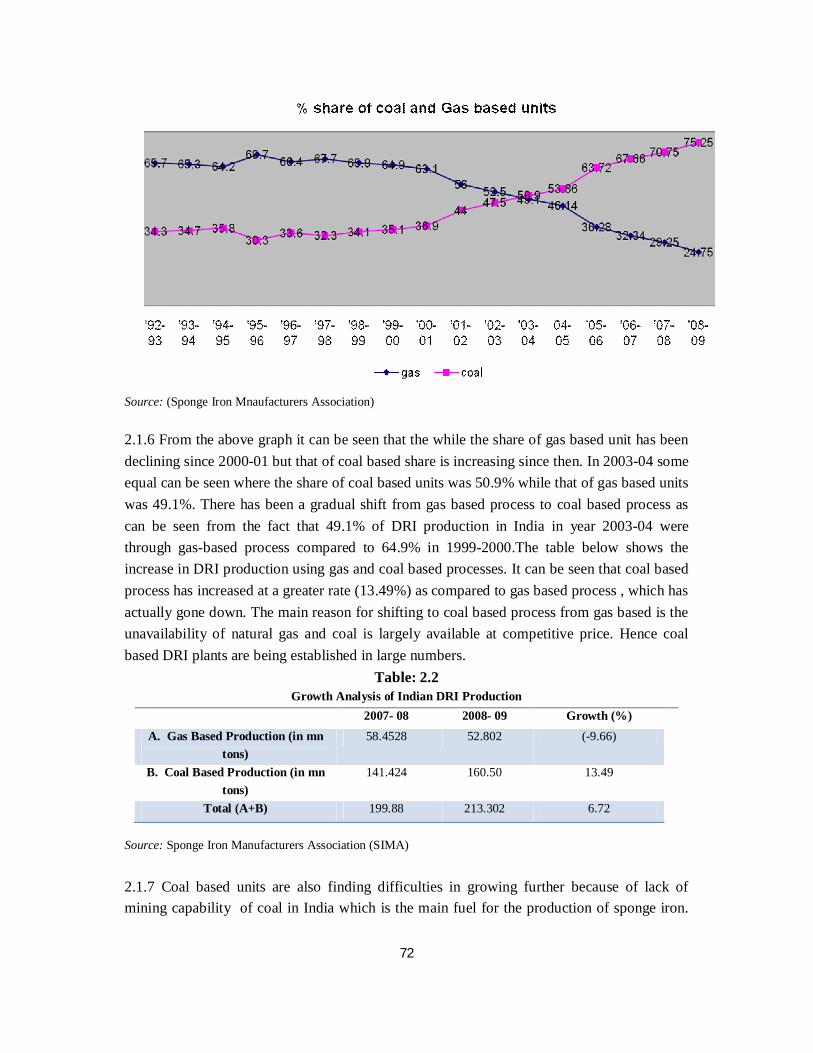
72
Source: (Sponge Iron Mnaufacturers Association)
2.1.6 From the above graph it can be seen that the while the share of gas based unit has been declining since 2000-01 but that of coal based share is increasing since then. In 2003-04 some equal can be seen where the share of coal based units was 50.9% while that of gas based units was 49.1%. There has been a gradual shift from gas based process to coal based process as can be seen from the fact that 49.1% of DRI production in India in year 2003-04 were through gas-based process compared to 64.9% in 1999-2000.The table below shows the increase in DRI production using gas and coal based processes. It can be seen that coal based process has increased at a greater rate (13.49%) as compared to gas based process , which has actually gone down. The main reason for shifting to coal based process from gas based is the unavailability of natural gas and coal is largely available at competitive price. Hence coal based DRI plants are being established in large numbers.
Table: 2.2 Growth Analysis of Indian DRI Production
2007- 08 2008- 09 Growth (%) A. Gas Based Production (in mn
tons) 58.4528 52.802 (-9.66)
B. Coal Based Production (in mn tons)
141.424 160.50 13.49
Total (A+B) 199.88 213.302 6.72
Source: Sponge Iron Manufacturers Association (SIMA)
2.1.7 Coal based units are also finding difficulties in growing further because of lack of mining capability of coal in India which is the main fuel for the production of sponge iron.
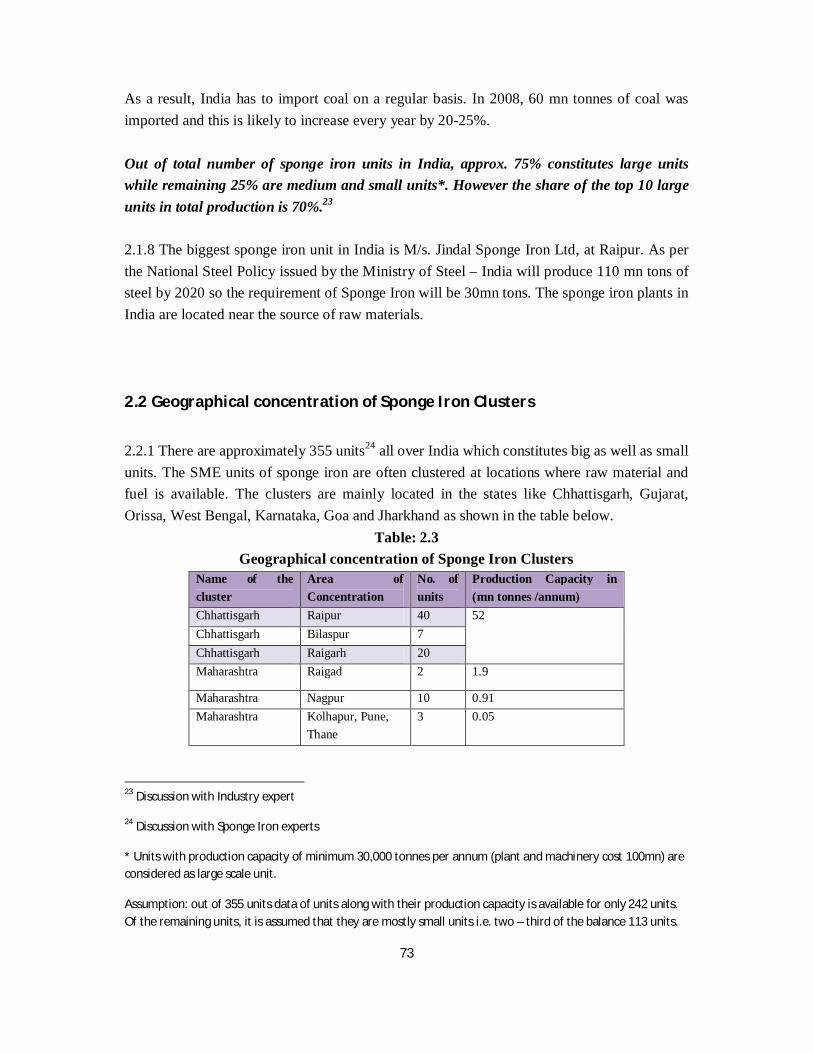
73
As a result, India has to import coal on a regular basis. In 2008, 60 mn tonnes of coal was imported and this is likely to increase every year by 20-25%. Out of total number of sponge iron units in India, approx. 75% constitutes large units while remaining 25% are medium and small units*. However the share of the top 10 large units in total production is 70%.23 2.1.8 The biggest sponge iron unit in India is M/s. Jindal Sponge Iron Ltd, at Raipur. As per the National Steel Policy issued by the Ministry of Steel – India will produce 110 mn tons of steel by 2020 so the requirement of Sponge Iron will be 30mn tons. The sponge iron plants in India are located near the source of raw materials. 2.2 Geographical concentration of Sponge Iron Clusters
2.2.1 There are approximately 355 units24 all over India which constitutes big as well as small units. The SME units of sponge iron are often clustered at locations where raw material and fuel is available. The clusters are mainly located in the states like Chhattisgarh, Gujarat, Orissa, West Bengal, Karnataka, Goa and Jharkhand as shown in the table below.
Table: 2.3 Geographical concentration of Sponge Iron Clusters
Name of the cluster
Area of Concentration
No. of units
Production Capacity in (mn tonnes /annum)
Chhattisgarh Raipur 40 52 Chhattisgarh Bilaspur 7 Chhattisgarh Raigarh 20 Maharashtra Raigad 2 1.9
Maharashtra Nagpur 10 0.91 Maharashtra Kolhapur, Pune,
Thane 3 0.05
23 Discussion with Industry expert
24 Discussion with Sponge Iron experts
* Units with production capacity of minimum 30,000 tonnes per annum (plant and machinery cost 100mn) are considered as large scale unit.
Assumption: out of 355 units data of units along with their production capacity is available for only 242 units. Of the remaining units, it is assumed that they are mostly small units i.e. two – third of the balance 113 units.
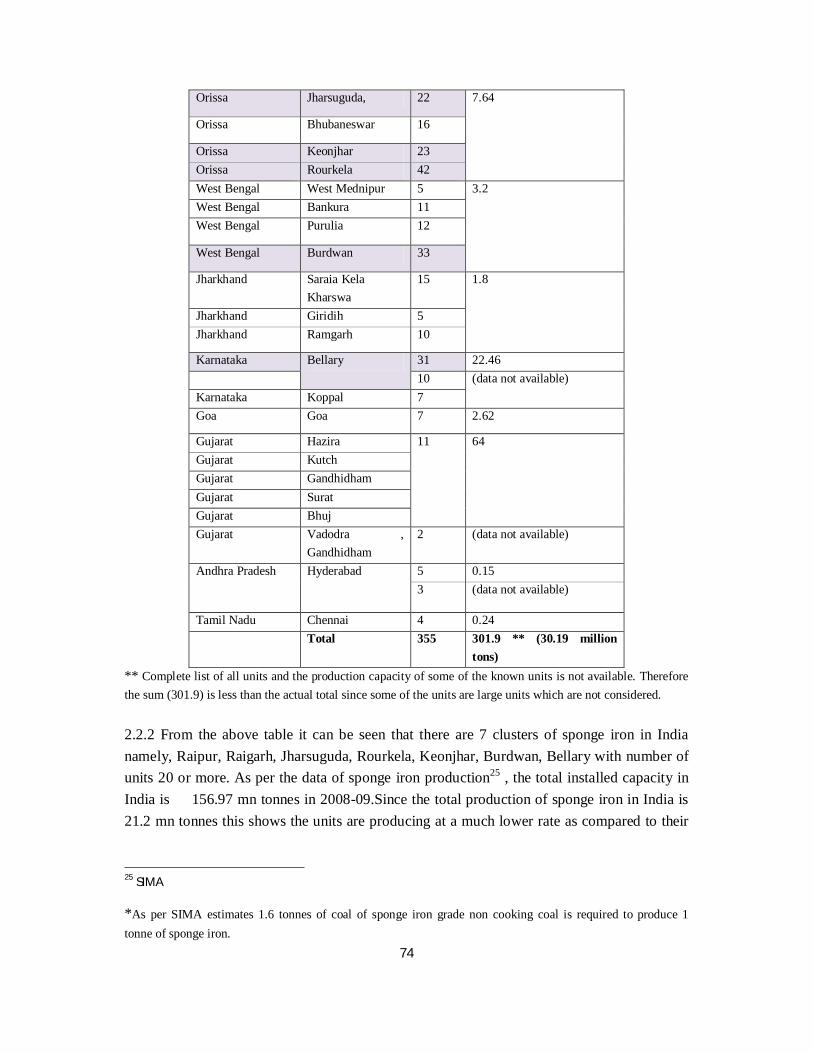
74
Orissa Jharsuguda, 22 7.64
Orissa Bhubaneswar 16
Orissa Keonjhar 23 Orissa Rourkela 42 West Bengal West Mednipur 5 3.2 West Bengal Bankura 11 West Bengal Purulia 12
West Bengal Burdwan 33
Jharkhand Saraia Kela Kharswa
15 1.8
Jharkhand Giridih 5 Jharkhand Ramgarh 10
Karnataka Bellary 31 22.46 10 (data not available) Karnataka Koppal 7 Goa Goa 7 2.62
Gujarat Hazira 11 64 Gujarat Kutch Gujarat Gandhidham Gujarat Surat Gujarat Bhuj Gujarat Vadodra ,
Gandhidham 2 (data not available)
Andhra Pradesh
Hyderabad
5 0.15 3 (data not available)
Tamil Nadu Chennai 4 0.24 Total 355 301.9 ** (30.19 million
tons) ** Complete list of all units and the production capacity of some of the known units is not available. Therefore the sum (301.9) is less than the actual total since some of the units are large units which are not considered. 2.2.2 From the above table it can be seen that there are 7 clusters of sponge iron in India namely, Raipur, Raigarh, Jharsuguda, Rourkela, Keonjhar, Burdwan, Bellary with number of units 20 or more. As per the data of sponge iron production25 , the total installed capacity in India is 156.97 mn tonnes in 2008-09.Since the total production of sponge iron in India is 21.2 mn tonnes this shows the units are producing at a much lower rate as compared to their
25 SIMA
*As per SIMA estimates 1.6 tonnes of coal of sponge iron grade non cooking coal is required to produce 1 tonne of sponge iron.
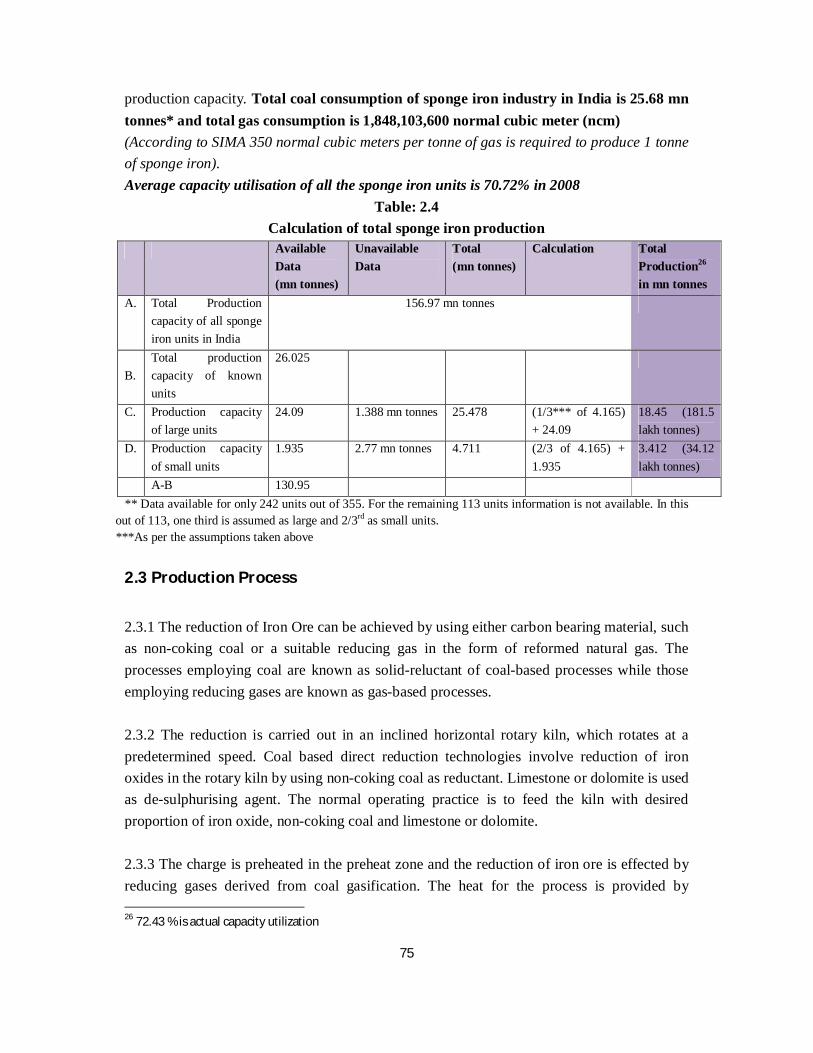
75
production capacity. Total coal consumption of sponge iron industry in India is 25.68 mn tonnes* and total gas consumption is 1,848,103,600 normal cubic meter (ncm) (According to SIMA 350 normal cubic meters per tonne of gas is required to produce 1 tonne of sponge iron). Average capacity utilisation of all the sponge iron units is 70.72% in 2008
Table: 2.4 Calculation of total sponge iron production
Available Data (mn tonnes)
Unavailable Data
Total (mn tonnes)
Calculation Total Production26 in mn tonnes
A. Total Production capacity of all sponge iron units in India
156.97 mn tonnes
B.
Total production capacity of known units
26.025
C. Production capacity of large units
24.09 1.388 mn tonnes 25.478 (1/3*** of 4.165) + 24.09
18.45 (181.5 lakh tonnes)
D. Production capacity of small units
1.935 2.77 mn tonnes 4.711 (2/3 of 4.165) + 1.935
3.412 (34.12 lakh tonnes)
A-B 130.95 ** Data available for only 242 units out of 355. For the remaining 113 units information is not available. In this
out of 113, one third is assumed as large and 2/3rd as small units. ***As per the assumptions taken above
2.3 Production Process
2.3.1 The reduction of Iron Ore can be achieved by using either carbon bearing material, such as non-coking coal or a suitable reducing gas in the form of reformed natural gas. The processes employing coal are known as solid-reluctant of coal-based processes while those employing reducing gases are known as gas-based processes. 2.3.2 The reduction is carried out in an inclined horizontal rotary kiln, which rotates at a predetermined speed. Coal based direct reduction technologies involve reduction of iron oxides in the rotary kiln by using non-coking coal as reductant. Limestone or dolomite is used as de-sulphurising agent. The normal operating practice is to feed the kiln with desired proportion of iron oxide, non-coking coal and limestone or dolomite. 2.3.3 The charge is preheated in the preheat zone and the reduction of iron ore is effected by reducing gases derived from coal gasification. The heat for the process is provided by 26 72.43 % is actual capacity utilization
76
burning coal volatiles and excess carbon monoxide emerging from the charge. This is done by introducing controlled quantity of air in the kiln along the preheating and reduction zones. Part of coal is introduced from the kiln discharge end to supply energy at discharge end, maintaining reducing atmosphere at discharge end to prevent re-oxidation of DRI and for controlling degree of metallisation and carbon content of DRI. A temperature profile ranging from 800-1050 degree centigrade is maintained along the length of the kiln at different zones and as the material flows down due to gravity the ore is reduced. 2.3.4 The reduction process occurs in solid state. The crucial factor in this is the controlled combustion of the coal and its conversion to carbon monoxide to remove oxygen from the iron ore. Chemical reaction is shown below; C + O2 = CO2 CO2 + C = 2CO Fe2O3 + CO = Fe3O4 + CO2 Fe3O4 + CO = FeO + CO2 FeO + CO = Fe + CO2
2.3.5 The overall process requires duration of approximately ten to twelve hours inside the kiln during which iron ore is optimally reduced and discharged to a rotary cooler for cooling. The hot reduced sponge iron along with semi-burnt coal, discharged from kiln is cooled in water-cooled cylindrical rotary cooler to a temperature of 100–200 degree centigrade. The discharge from cooler consisting of sponge iron, char other contaminations are passed on through magnetic separators so that sponge iron can be separated from other impurities. Subsequently the Sponge Iron is stored into Bins through conveyor belts. 2.4 Energy Intensity of Sponge Iron Cluster
2.4.1 The main fuel used in the production process of sponge iron is coal and gas. As mentioned earlier 16.05 mn tonnes of sponge iron is coal based and 5.28 mn tonnes is gas based (2008-09). The maximum energy is consumed in the process of reduction of iron ore in the kiln. The estimated total value of energy consumption in sponge iron sub-sector is Rs 290.97 bn. All the small units are using indigenous technology. There are several ways of improving the energy efficiency in sponge iron production process. Some of the suggested potential areas of improving energy efficiency are- (i) Use of higher grade coal: Sponge iron requires specific characteristic of coal – IDT of
coal ash should have 13000 degree C temperature, reactivity of coal – 2 cc of CO / gm of C/Sec., Fixed Carbon (FC) to the level of 42-44%. Other features like Volatile Matter between 26-32%, Ash 25%, Coking Index and Swelling index less than 1, etc. are
77
required for maximization of good quality sponge iron production. This is causing a concern for the sponge iron industry as well as environment. The sponge iron industry is forced to use coal with ash content over 40%, FC LESS THAN 33%.
(ii) Waste Heat Recovery: For reduction process to takes place in the kiln the temperature is maintained in the range of 950-1050°C. The hot gas (CO2) also bears the temperature in the same range. In the existing practice of the hot gas treatment the heat contained in the gas is lost in the environment. Hence there exists a great potential of Waste Heat Recovery in the process. Following Energy Efficiency measures can be implemented by utilizing the waste heat in productive ways.
(a) Preheating Kiln: Iron Ore enters the kiln at the environmental temperature. For the reduction process to take place it is necessary that the Iron Ore is heated to the desired temperature. For this purpose the Kiln is divided into different zones (In existing practices). The few zones (two or three) are dedicated for the preheating the Iron Ore. These zones are called Preheating Zones. In the preheating zones the Coal charged with Iron Ore acts as fuel to generate the heat for preheating. This Preheating can be done in a Preheating Kiln by utilizing the heat of the hot exhaust gas generated in the reduction process. Hence charging of Iron Ore at an elevated temperature will require lesser number (or nothing at all) of preheating zones. This will reduce the coal consumption for the purpose of preheating in main kiln.
Installing the preheating kiln can be viable for all the units (with any range of production capacity). The Financial Analysis and the technicalities involved in this venture are to be looked upon.
(b) Installing Waste Heat Recovery Boiler (WHRB): Waste Heat can also be recovered by installing the Waste Heat Recovery Boiler. If a 100 MTD capacity kiln is operated at maximum capacity, it can generate approximately 10 Tons of steam which have the potential of generating approximately 2MW of electricity. Operation of WHRB has been successful in sponge Iron units with a minimum capacity of producing 200 TPD. Hence a 200 TPD sponge iron unit can generate approximately 4MW electricity. Maximum electricity requirement of a 200 TPD SI unit comes out to be 0.7 MW. Hence the surplus Electricity available through Captive Power Generation can be utilized by Forward integration of the production operations (Like Induction furnace or Re-rolling) or it can be traded.
2.5 Environmental Issues in Sponge Iron Sector
2.5.1 Sponge iron industries are one of the most pollution creating industries having enormous demand of its product in the country with low capital investment, resulting mushrooming growth of plants causing huge pollution and loss of natural resources. Coal based sponge iron industry is prone to pollution because it is a dry thermal reduction process. It is prone mainly to air pollution
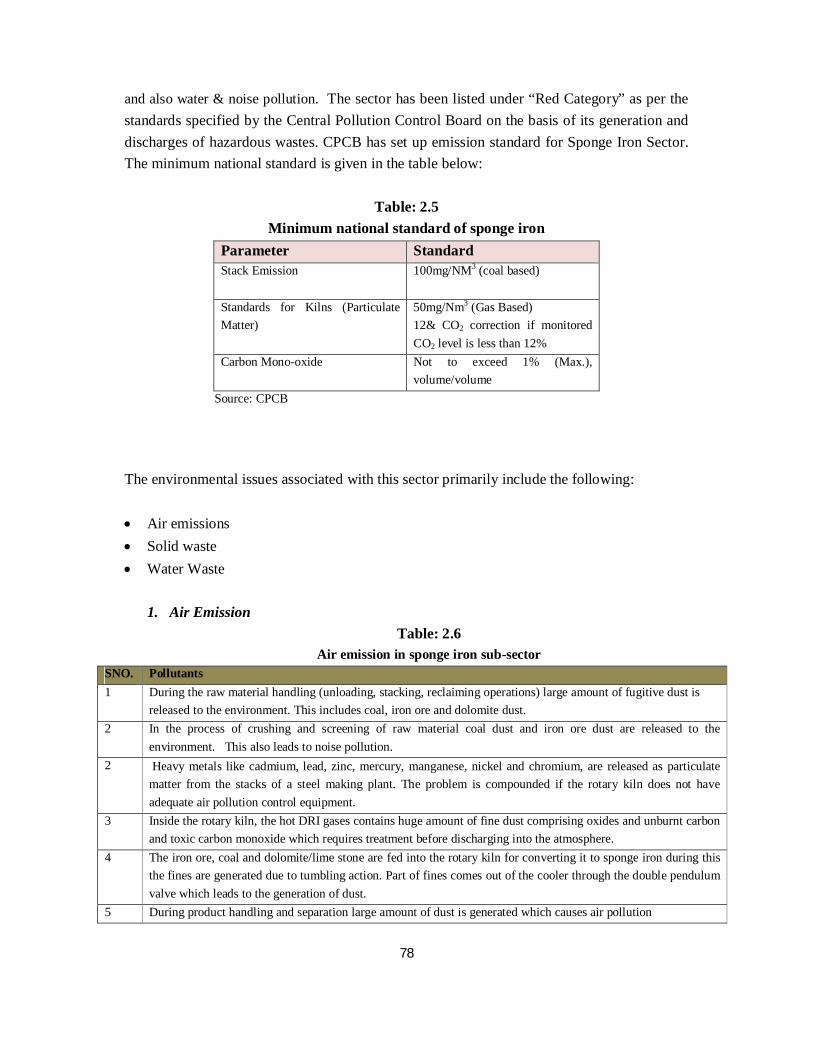
78
and also water & noise pollution. The sector has been listed under “Red Category” as per the standards specified by the Central Pollution Control Board on the basis of its generation and discharges of hazardous wastes. CPCB has set up emission standard for Sponge Iron Sector. The minimum national standard is given in the table below:
Table: 2.5 Minimum national standard of sponge iron
Parameter Standard Stack Emission 100mg/NM3 (coal based)
Standards for Kilns (Particulate Matter)
50mg/Nm3 (Gas Based) 12& CO2 correction if monitored CO2 level is less than 12%
Carbon Mono-oxide Not to exceed 1% (Max.), volume/volume
Source: CPCB
The environmental issues associated with this sector primarily include the following: Air emissions Solid waste Water Waste
1. Air Emission
Table: 2.6 Air emission in sponge iron sub-sector
SNO. Pollutants 1 During the raw material handling (unloading, stacking, reclaiming operations) large amount of fugitive dust is
released to the environment. This includes coal, iron ore and dolomite dust. 2 In the process of crushing and screening of raw material coal dust and iron ore dust are released to the
environment. This also leads to noise pollution. 2 Heavy metals like cadmium, lead, zinc, mercury, manganese, nickel and chromium, are released as particulate
matter from the stacks of a steel making plant. The problem is compounded if the rotary kiln does not have adequate air pollution control equipment.
3 Inside the rotary kiln, the hot DRI gases contains huge amount of fine dust comprising oxides and unburnt carbon and toxic carbon monoxide which requires treatment before discharging into the atmosphere.
4 The iron ore, coal and dolomite/lime stone are fed into the rotary kiln for converting it to sponge iron during this the fines are generated due to tumbling action. Part of fines comes out of the cooler through the double pendulum valve which leads to the generation of dust.
5 During product handling and separation large amount of dust is generated which causes air pollution
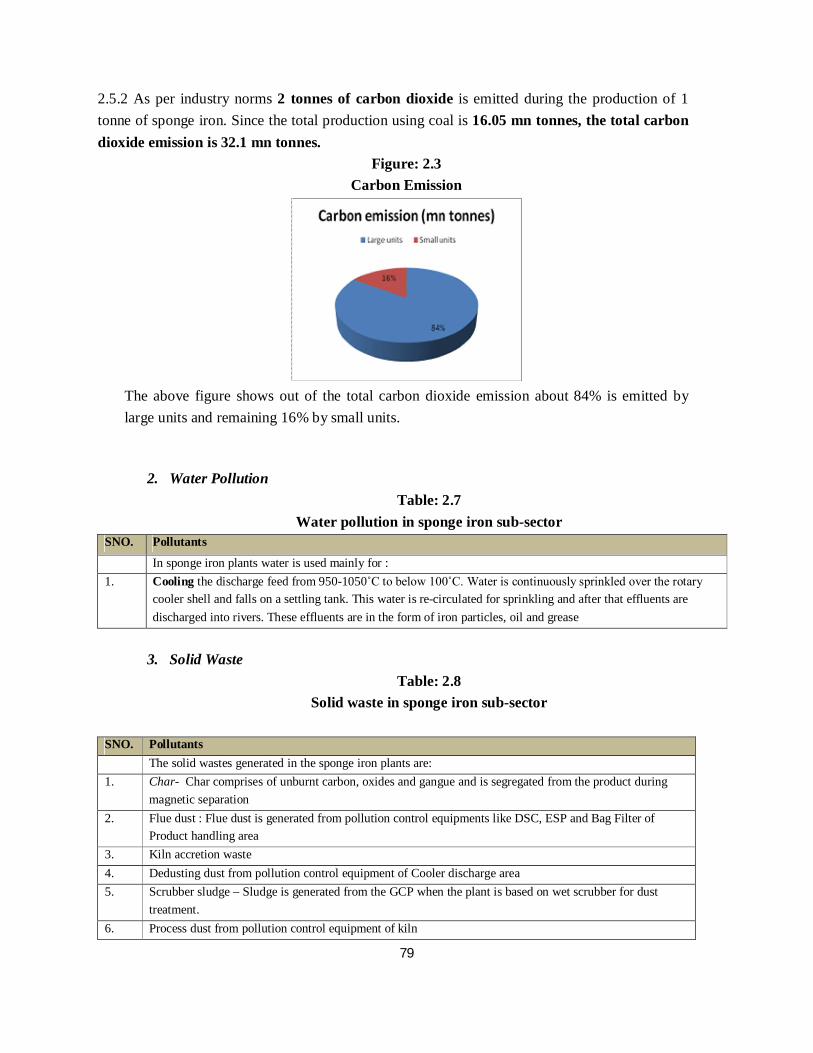
79
2.5.2 As per industry norms 2 tonnes of carbon dioxide is emitted during the production of 1 tonne of sponge iron. Since the total production using coal is 16.05 mn tonnes, the total carbon dioxide emission is 32.1 mn tonnes.
Figure: 2.3 Carbon Emission
The above figure shows out of the total carbon dioxide emission about 84% is emitted by large units and remaining 16% by small units.
2. Water Pollution Table: 2.7
Water pollution in sponge iron sub-sector SNO. Pollutants
In sponge iron plants water is used mainly for : 1. Cooling the discharge feed from 950-1050˚C to below 100˚C. Water is continuously sprinkled over the rotary
cooler shell and falls on a settling tank. This water is re-circulated for sprinkling and after that effluents are discharged into rivers. These effluents are in the form of iron particles, oil and grease
3. Solid Waste
Table: 2.8 Solid waste in sponge iron sub-sector
SNO. Pollutants The solid wastes generated in the sponge iron plants are: 1. Char- Char comprises of unburnt carbon, oxides and gangue and is segregated from the product during
magnetic separation 2. Flue dust : Flue dust is generated from pollution control equipments like DSC, ESP and Bag Filter of
Product handling area 3. Kiln accretion waste 4. Dedusting dust from pollution control equipment of Cooler discharge area 5. Scrubber sludge – Sludge is generated from the GCP when the plant is based on wet scrubber for dust
treatment. 6. Process dust from pollution control equipment of kiln
80
2.6 Social Issues
The social issues associated with the Sponge iron sector are: Heavy metals released in air from the sponge iron plants are highly toxic. Some of them,
like chromium, cadmium, nickel, are human carcinogens. Iron acts along with other carcinogenic heavy metals and increases the risk of cancer.
Sponge iron plants also emit oxides of sulphur and nitrogen and hydrocarbons. These air pollutants are likely to increase the incidence of respiratory tract ailments like cough, phlegm, chronic bronchitis and also exacerbate asthmatic conditions.
Air pollution has a great impact on plant and vegetation as well, particularly the pollutants like Sulphur dioxide (SO2), nitrogen dioxide (NO2) and particulate matter are the primary pollutants
Noise is generated in the gas based plants from briquetting machines, compressors etc. In coal based plants noise is generated from the moving parts of kilns, cooler and associated equipments like gear boxes, fans etc that generates up to 90dB noise. These may impair the hearing capacity of the workers
Industrial dangers are present during the mining, transportation and preparation of the ores. Inhalation of iron dust or fumes occurs in iron – ore mining, arc welding, metal grinding, polishing and working and boiling scaling.
A number of zinc salts may enter the body by inhalation, through the skin or by ingestion and produce intoxication. Zinc chloride causes skin cancers.
2.6.1 Industry Initiatives
SIMA, the apex body for sponge iron plants has set up a membership criteria that only
those units registered under State Pollution control board and has installed pollution control devices will be registered under them. For non – SIMA members information is not available.
In many sponge iron units pollution control equipments have been installed to control the pollution levels with maximum such units in Orissa.
Many big sponge iron units have built schools and ensured medical checkups for the health of workers. Temples have been built in the nearby industrial areas.
Some of the units have supported the formation of SHGs to provide employment to the local workforce especially women.
2.7 Institutions/Associations
The table below shows the list of Institutions and associations of sponge iron industry Table: 2.9
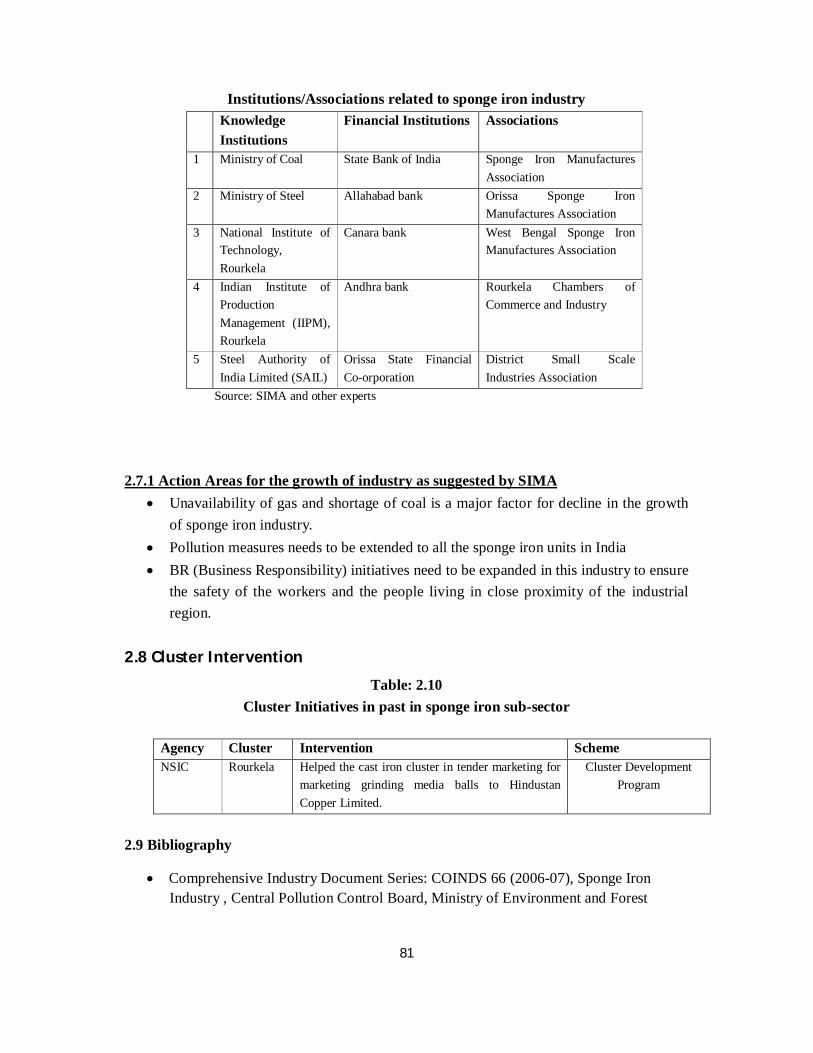
81
Institutions/Associations related to sponge iron industry Knowledge
Institutions Financial Institutions Associations
1 Ministry of Coal State Bank of India Sponge Iron Manufactures Association
2 Ministry of Steel Allahabad bank Orissa Sponge Iron Manufactures Association
3 National Institute of Technology, Rourkela
Canara bank West Bengal Sponge Iron Manufactures Association
4 Indian Institute of Production Management (IIPM), Rourkela
Andhra bank Rourkela Chambers of Commerce and Industry
5 Steel Authority of India Limited (SAIL)
Orissa State Financial Co-orporation
District Small Scale Industries Association
Source: SIMA and other experts
2.7.1 Action Areas for the growth of industry as suggested by SIMA
Unavailability of gas and shortage of coal is a major factor for decline in the growth of sponge iron industry.
Pollution measures needs to be extended to all the sponge iron units in India BR (Business Responsibility) initiatives need to be expanded in this industry to ensure
the safety of the workers and the people living in close proximity of the industrial region.
2.8 Cluster Intervention
Table: 2.10 Cluster Initiatives in past in sponge iron sub-sector
Agency Cluster Intervention Scheme NSIC Rourkela Helped the cast iron cluster in tender marketing for
marketing grinding media balls to Hindustan Copper Limited.
Cluster Development Program
2.9 Bibliography
Comprehensive Industry Document Series: COINDS 66 (2006-07), Sponge Iron Industry , Central Pollution Control Board, Ministry of Environment and Forest

82
“Rourkela General Engineering Cluster, Diagnostic Study Report”(2008), United Nations Industrial Development Organisation
Chetana, J. “Risk appraisal study: Sponge iron plants, Raigarh District” (2006), Hyderabad, Cerana Foundation
“Environmental, Health and Safety (EHS) General Guidelines”(2007), World Bank, IFC
Pandey, A. And D Goswami (2008), “Energy Mapping in Rourkela Sponge Iron and Induction Furnace Clusters” UNIDO Cluster development Program
Websites
http://www.hbia.org/pdf/MIDREXStatsBook20081.pdf
83
Chapter – B3
Leather Tanning Cluster
3.1Economic Significance
3.1.1 Leather manufacturing is one of the oldest industries that occupy a place of prominence in the Indian economy in view of its substantial export earnings, employment generation and growth. There has been increasing emphasis on its planned development, aimed at optimum utilization of available raw material for maximizing the returns particularly from export. The major products of the leather sector are:
Leather Garments Footwear and Footwear components Leather Goods (bags, wallets, belts, gloves, accessories) Saddlery and harness articles
3.1.2 The leather industry ranks 8th in term of foreign exchange earnings of the country and has 3% share in global trade. The annual production of leather and leather products in India is about Rs.270000 mn. The composition of export of leather products from India has undergone a structural change during the last three decades, from merely being an exporter of raw material in the sixties to value added products in the nineties. The exports are growing at the rate of 11.91% (5 years)27. Despite slowdown in US and EU, major importers of leather goods, leather exports grew 20 percent in the first half of financial year 2009, registering a 20 percent rise over the previous year. A large proportion of India’s export of leather and leather products is mainly in four countries, namely USA, Germany, UK and Italy. This sector employs about 2.528mn workforce with 30% women. 27 (Council of Leather Exports)
28 Council of leather exports

84
Table: 3.1 India’s export of leather and leather products for five years (2003-2008) (Value in mn Rs.) 2003-04 2004-05 2005-06 2006-07 2007-08
Finished Leather 12003.34 13126.97 13743.43 15638.4 16565.69
Footwear 16582.97 19672.63 22577.18 26717.26 31877.93 Leather Garments 6503.328 7115.904 7199.28 6694.056 7430.184
Leather Goods 11646.94 12651.55 14259.67 15255.65 16954.92 Saddlery & Harness 1138.536 1332.936 1674.432 1778.328 2285.496
Source: (DGCI&S) 3.1.3 The growth of the leather sector is directly related with the growth of livestock sector. India is the largest livestock holding country with 21% large animals and 11% small animals. Indian leather sector is a source for 10% global leather requirement with annual production value of Rs.216000 mn. The estimated production capacity of hides and skins is 65mn and 170mn29 pieces. 3.2 Geographical concentration of tanneries
There are about 1,381 tanneries spread out all over India. About 96% of these tanneries are in small and medium, and approx. 4% in the large sector.30 3.2.1 Since the tanning process requires large quantity of water, most of the units are located near river banks and they draw surface water. Most of the tanneries also use ground water from their own open wells/tube wells existing within their premises. The places where overhead water tanks are not available, there water is pumped directly to the process and in some places water is stored in open cement lined pits and ground level tanks. Tanning industry clusters are mainly located in Tamil Nadu, West Bengal, Uttar Pradesh, Karnataka, Punjab and Maharashtra. The highest concentration of tanneries in India is on the banks of the Ganga river system in North India and the Palar river system in Tamil Nadu. Each location produces a particular end use leather product. Isolated medium and large scale tanneries are located in other states like Rajasthan, Bihar, Andhra Pradesh, Haryana, Orissa, Madhya Pradesh, Gujarat etc.
29 (CLRI) 30 Discussion with the expert
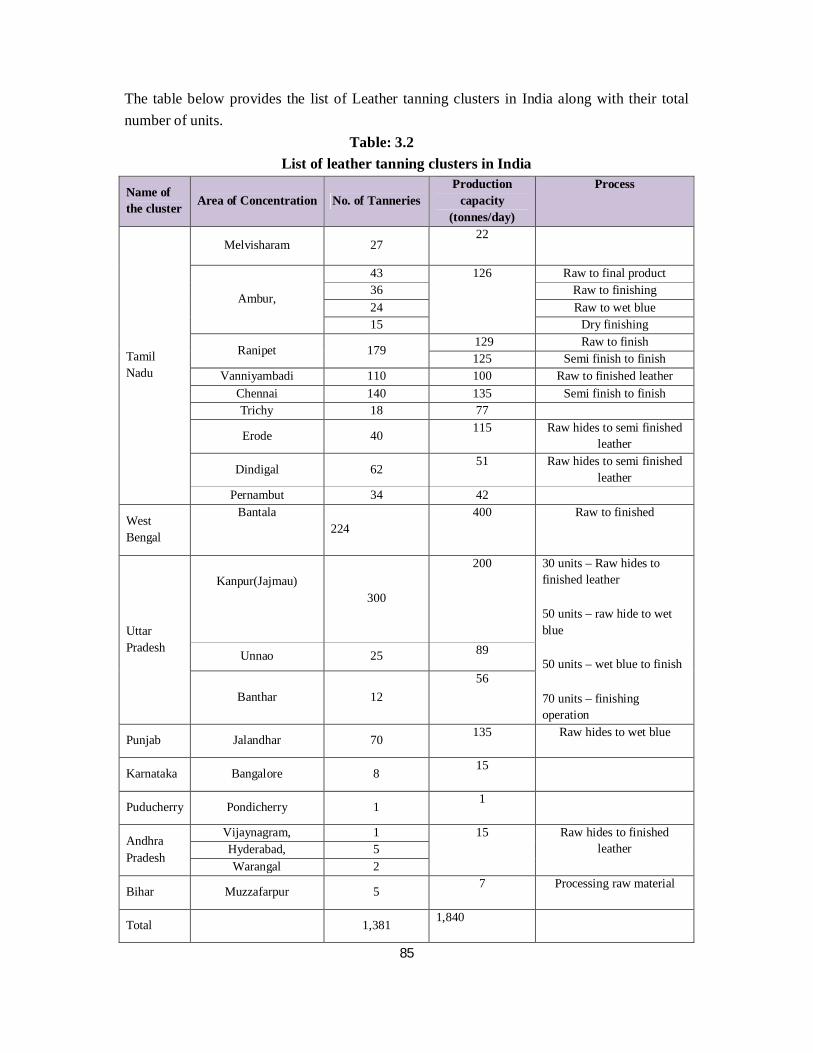
85
The table below provides the list of Leather tanning clusters in India along with their total number of units. Table: 3.2
List of leather tanning clusters in India
Name of the cluster Area of Concentration No. of Tanneries
Production capacity
(tonnes/day)
Process
Tamil Nadu
Melvisharam 27 22
Ambur,
43 126 Raw to final product 36 Raw to finishing 24 Raw to wet blue 15 Dry finishing
Ranipet 179 129 Raw to finish 125 Semi finish to finish
Vanniyambadi 110 100 Raw to finished leather Chennai 140 135 Semi finish to finish Trichy 18 77
Erode 40 115 Raw hides to semi finished
leather
Dindigal 62 51 Raw hides to semi finished
leather Pernambut 34 42
West Bengal
Bantala
224
400 Raw to finished
Uttar Pradesh
Kanpur(Jajmau)
300
200 30 units – Raw hides to finished leather
50 units – raw hide to wet blue
50 units – wet blue to finish
70 units – finishing operation
Unnao 25 89
Banthar 12 56
Punjab Jalandhar 70 135 Raw hides to wet blue
Karnataka Bangalore 8 15
Puducherry Pondicherry 1 1
Andhra Pradesh
Vijaynagram, 1 15 Raw hides to finished leather Hyderabad, 5
Warangal 2
Bihar Muzzafarpur 5 7 Processing raw material
Total 1,381 1,840
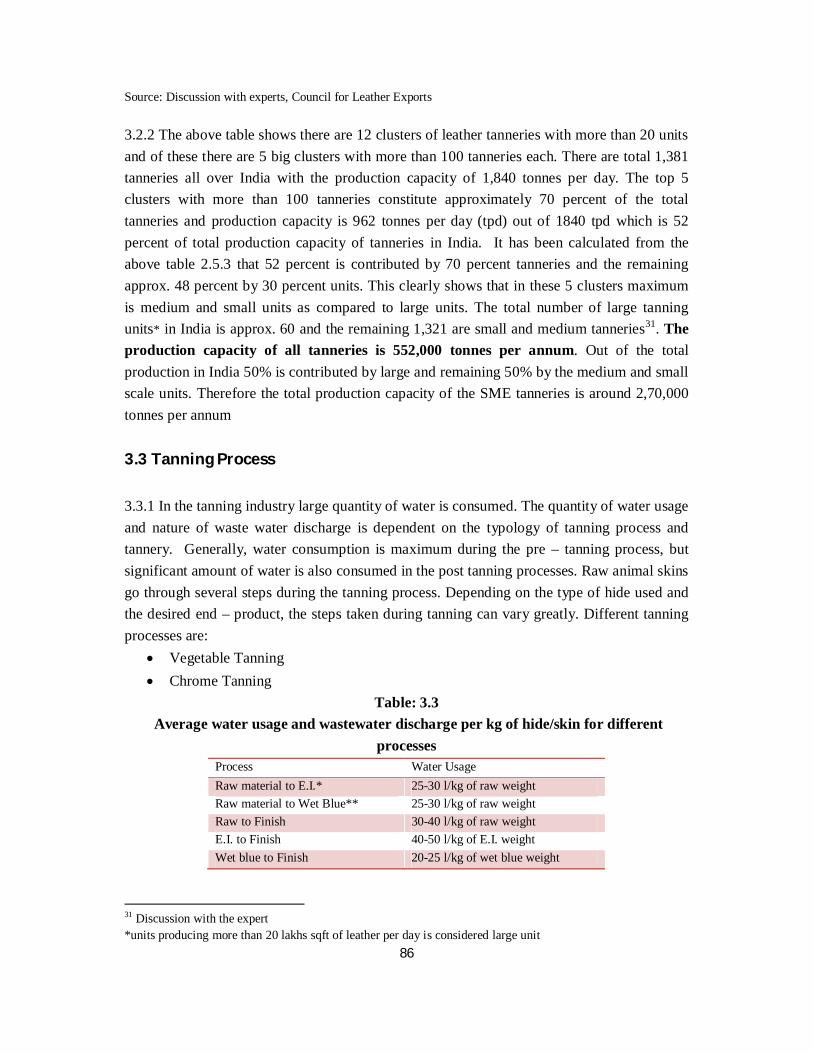
86
Source: Discussion with experts, Council for Leather Exports
3.2.2 The above table shows there are 12 clusters of leather tanneries with more than 20 units and of these there are 5 big clusters with more than 100 tanneries each. There are total 1,381 tanneries all over India with the production capacity of 1,840 tonnes per day. The top 5 clusters with more than 100 tanneries constitute approximately 70 percent of the total tanneries and production capacity is 962 tonnes per day (tpd) out of 1840 tpd which is 52 percent of total production capacity of tanneries in India. It has been calculated from the above table 2.5.3 that 52 percent is contributed by 70 percent tanneries and the remaining approx. 48 percent by 30 percent units. This clearly shows that in these 5 clusters maximum is medium and small units as compared to large units. The total number of large tanning units* in India is approx. 60 and the remaining 1,321 are small and medium tanneries31. The production capacity of all tanneries is 552,000 tonnes per annum. Out of the total production in India 50% is contributed by large and remaining 50% by the medium and small scale units. Therefore the total production capacity of the SME tanneries is around 2,70,000 tonnes per annum 3.3 Tanning Process
3.3.1 In the tanning industry large quantity of water is consumed. The quantity of water usage and nature of waste water discharge is dependent on the typology of tanning process and tannery. Generally, water consumption is maximum during the pre – tanning process, but significant amount of water is also consumed in the post tanning processes. Raw animal skins go through several steps during the tanning process. Depending on the type of hide used and the desired end – product, the steps taken during tanning can vary greatly. Different tanning processes are:
Vegetable Tanning Chrome Tanning
Table: 3.3 Average water usage and wastewater discharge per kg of hide/skin for different
processes
31 Discussion with the expert *units producing more than 20 lakhs sqft of leather per day is considered large unit
Process Water Usage Raw material to E.I.* 25-30 l/kg of raw weight Raw material to Wet Blue** 25-30 l/kg of raw weight Raw to Finish 30-40 l/kg of raw weight E.I. to Finish 40-50 l/kg of E.I. weight Wet blue to Finish 20-25 l/kg of wet blue weight
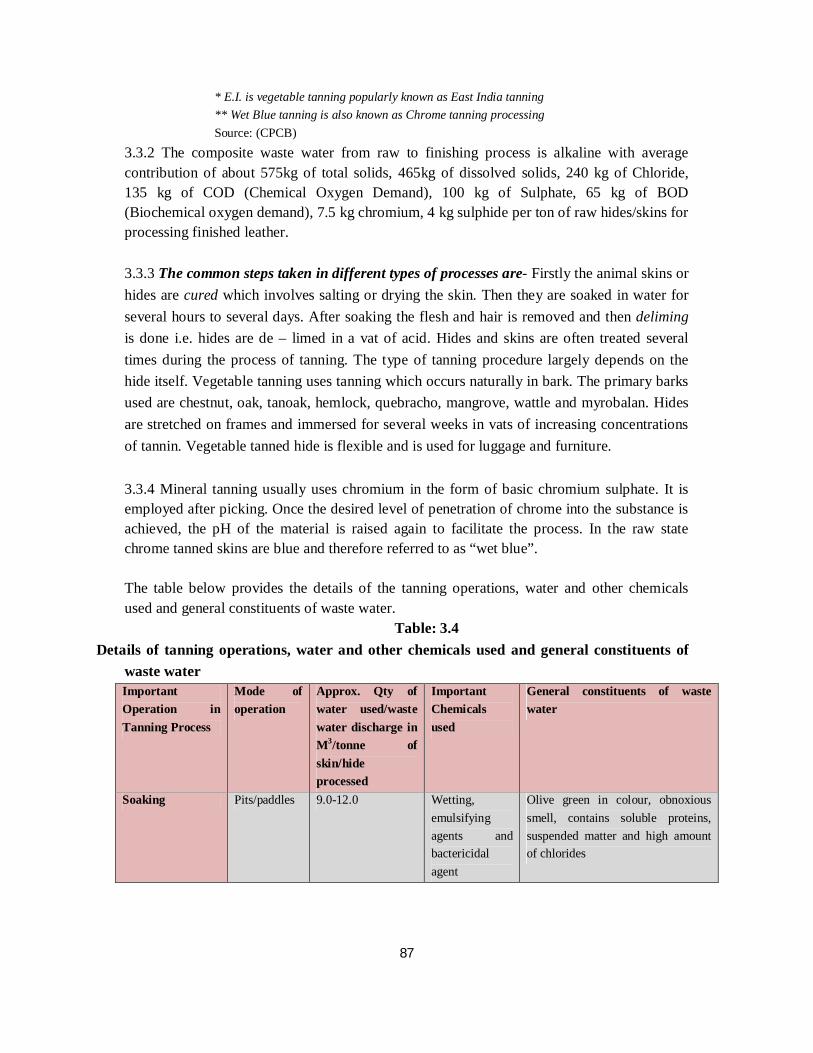
87
* E.I. is vegetable tanning popularly known as East India tanning ** Wet Blue tanning is also known as Chrome tanning processing Source: (CPCB)
3.3.2 The composite waste water from raw to finishing process is alkaline with average contribution of about 575kg of total solids, 465kg of dissolved solids, 240 kg of Chloride, 135 kg of COD (Chemical Oxygen Demand), 100 kg of Sulphate, 65 kg of BOD (Biochemical oxygen demand), 7.5 kg chromium, 4 kg sulphide per ton of raw hides/skins for processing finished leather. 3.3.3 The common steps taken in different types of processes are- Firstly the animal skins or hides are cured which involves salting or drying the skin. Then they are soaked in water for several hours to several days. After soaking the flesh and hair is removed and then deliming is done i.e. hides are de – limed in a vat of acid. Hides and skins are often treated several times during the process of tanning. The type of tanning procedure largely depends on the hide itself. Vegetable tanning uses tanning which occurs naturally in bark. The primary barks used are chestnut, oak, tanoak, hemlock, quebracho, mangrove, wattle and myrobalan. Hides are stretched on frames and immersed for several weeks in vats of increasing concentrations of tannin. Vegetable tanned hide is flexible and is used for luggage and furniture. 3.3.4 Mineral tanning usually uses chromium in the form of basic chromium sulphate. It is employed after picking. Once the desired level of penetration of chrome into the substance is achieved, the pH of the material is raised again to facilitate the process. In the raw state chrome tanned skins are blue and therefore referred to as “wet blue”. The table below provides the details of the tanning operations, water and other chemicals used and general constituents of waste water. Table: 3.4
Details of tanning operations, water and other chemicals used and general constituents of waste water Important Operation in Tanning Process
Mode of operation
Approx. Qty of water used/waste water discharge in M3/tonne of skin/hide processed
Important Chemicals used
General constituents of waste water
Soaking Pits/paddles 9.0-12.0 Wetting, emulsifying agents and bactericidal agent
Olive green in colour, obnoxious smell, contains soluble proteins, suspended matter and high amount of chlorides
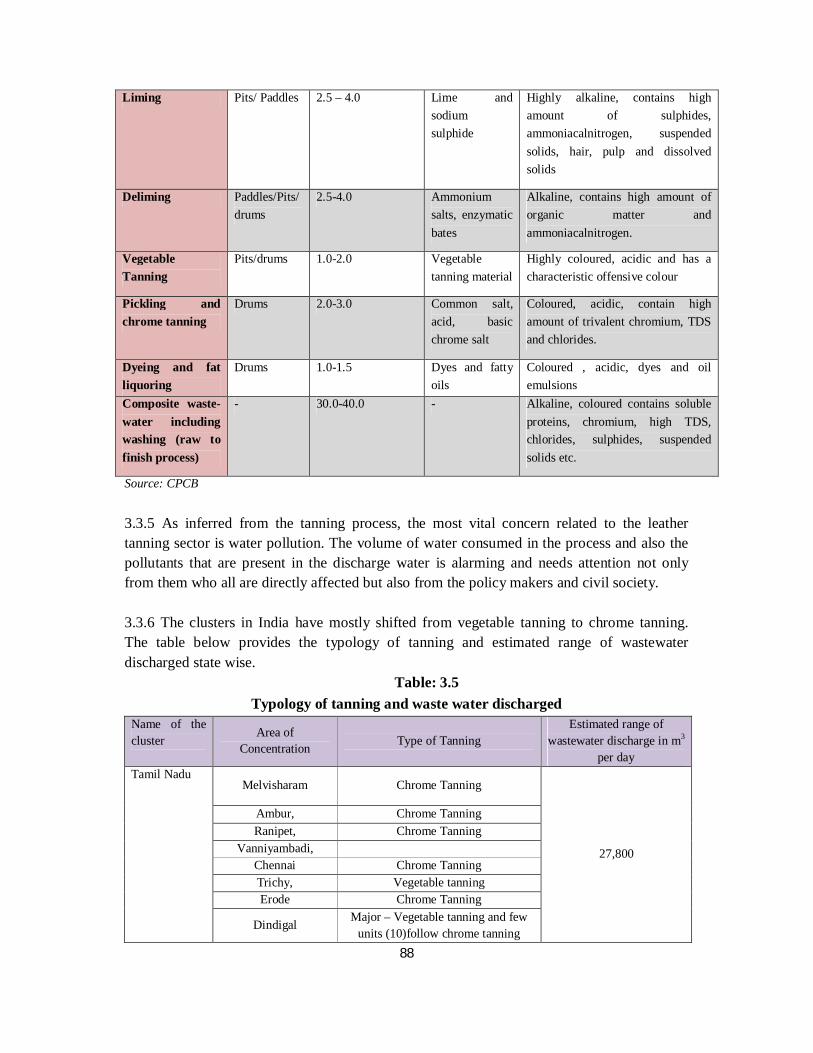
88
Liming Pits/ Paddles 2.5 – 4.0 Lime and sodium sulphide
Highly alkaline, contains high amount of sulphides, ammoniacalnitrogen, suspended solids, hair, pulp and dissolved solids
Deliming Paddles/Pits/ drums
2.5-4.0 Ammonium salts, enzymatic bates
Alkaline, contains high amount of organic matter and ammoniacalnitrogen.
Vegetable Tanning
Pits/drums 1.0-2.0 Vegetable tanning material
Highly coloured, acidic and has a characteristic offensive colour
Pickling and chrome tanning
Drums 2.0-3.0 Common salt, acid, basic chrome salt
Coloured, acidic, contain high amount of trivalent chromium, TDS and chlorides.
Dyeing and fat liquoring
Drums 1.0-1.5 Dyes and fatty oils
Coloured , acidic, dyes and oil emulsions
Composite waste- water including washing (raw to finish process)
- 30.0-40.0 - Alkaline, coloured contains soluble proteins, chromium, high TDS, chlorides, sulphides, suspended solids etc.
Source: CPCB 3.3.5 As inferred from the tanning process, the most vital concern related to the leather tanning sector is water pollution. The volume of water consumed in the process and also the pollutants that are present in the discharge water is alarming and needs attention not only from them who all are directly affected but also from the policy makers and civil society. 3.3.6 The clusters in India have mostly shifted from vegetable tanning to chrome tanning. The table below provides the typology of tanning and estimated range of wastewater discharged state wise. Table: 3.5
Typology of tanning and waste water discharged Name of the cluster
Area of Concentration Type of Tanning
Estimated range of wastewater discharge in m3
per day Tamil Nadu
Melvisharam Chrome Tanning
27,800
Ambur, Chrome Tanning Ranipet, Chrome Tanning
Vanniyambadi, Chennai Chrome Tanning Trichy, Vegetable tanning Erode Chrome Tanning
Dindigal Major – Vegetable tanning and few units (10)follow chrome tanning
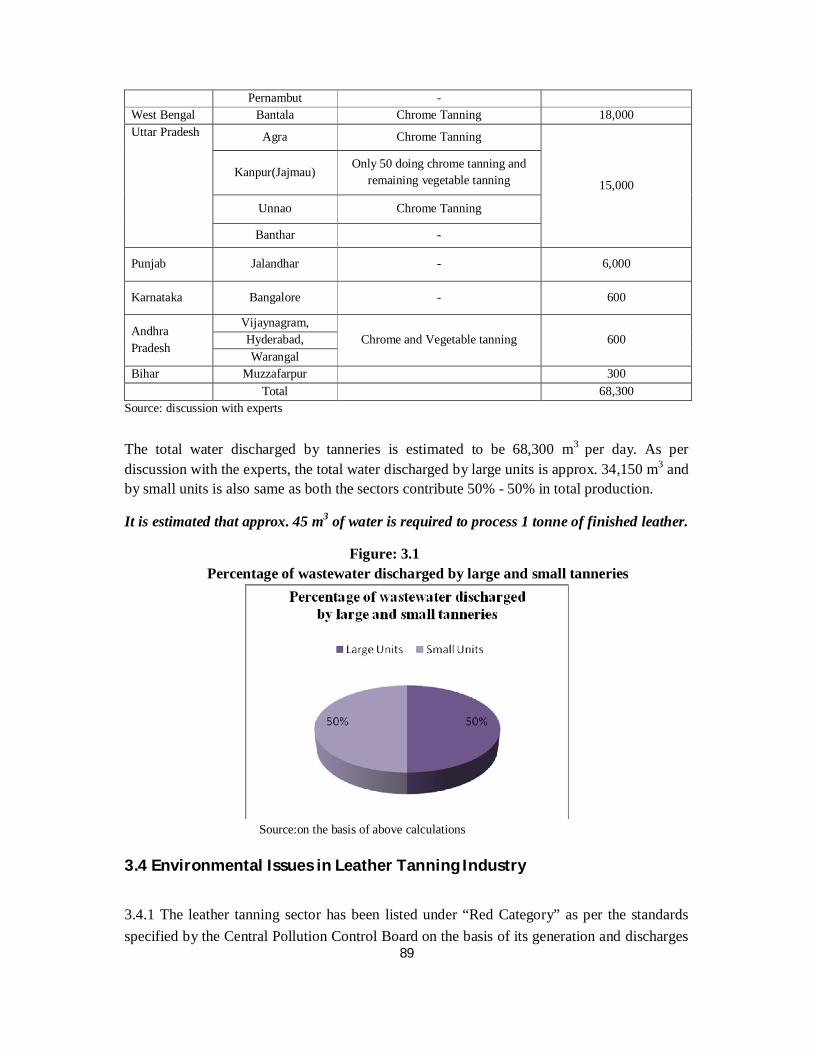
89
Pernambut - West Bengal Bantala Chrome Tanning 18,000 Uttar Pradesh Agra Chrome Tanning
15,000 Kanpur(Jajmau)
Only 50 doing chrome tanning and remaining vegetable tanning
Unnao Chrome Tanning
Banthar -
Punjab Jalandhar - 6,000
Karnataka Bangalore - 600
Andhra Pradesh
Vijaynagram, Chrome and Vegetable tanning 600 Hyderabad,
Warangal Bihar Muzzafarpur 300 Total 68,300
Source: discussion with experts The total water discharged by tanneries is estimated to be 68,300 m3 per day. As per discussion with the experts, the total water discharged by large units is approx. 34,150 m3 and by small units is also same as both the sectors contribute 50% - 50% in total production.
It is estimated that approx. 45 m3 of water is required to process 1 tonne of finished leather.
Figure: 3.1 Percentage of wastewater discharged by large and small tanneries
Source:on the basis of above calculations
3.4 Environmental Issues in Leather Tanning Industry
3.4.1 The leather tanning sector has been listed under “Red Category” as per the standards specified by the Central Pollution Control Board on the basis of its generation and discharges
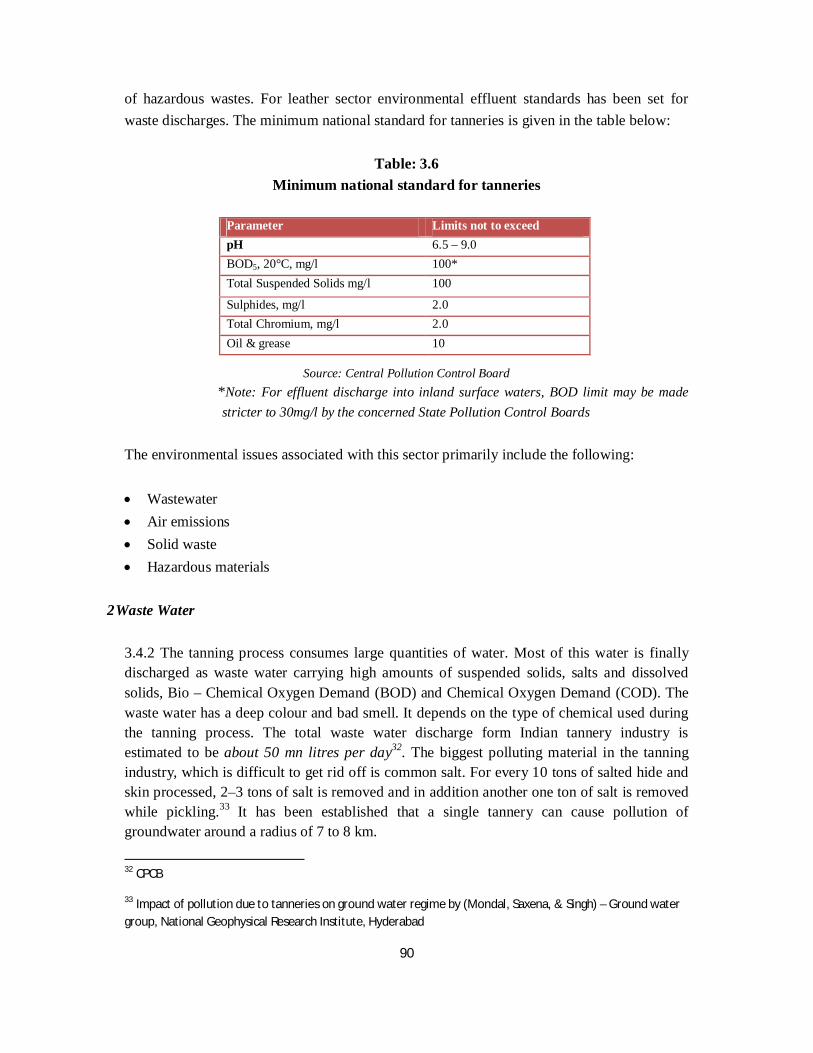
90
of hazardous wastes. For leather sector environmental effluent standards has been set for waste discharges. The minimum national standard for tanneries is given in the table below:
Table: 3.6
Minimum national standard for tanneries
Source: Central Pollution Control Board *Note: For effluent discharge into inland surface waters, BOD limit may be made
stricter to 30mg/l by the concerned State Pollution Control Boards The environmental issues associated with this sector primarily include the following: Wastewater Air emissions Solid waste Hazardous materials
2 Waste Water
3.4.2 The tanning process consumes large quantities of water. Most of this water is finally discharged as waste water carrying high amounts of suspended solids, salts and dissolved solids, Bio – Chemical Oxygen Demand (BOD) and Chemical Oxygen Demand (COD). The waste water has a deep colour and bad smell. It depends on the type of chemical used during the tanning process. The total waste water discharge form Indian tannery industry is estimated to be about 50 mn litres per day32. The biggest polluting material in the tanning industry, which is difficult to get rid off is common salt. For every 10 tons of salted hide and skin processed, 2–3 tons of salt is removed and in addition another one ton of salt is removed while pickling.33 It has been established that a single tannery can cause pollution of groundwater around a radius of 7 to 8 km.
32 CPCB
33 Impact of pollution due to tanneries on ground water regime by (Mondal, Saxena, & Singh) – Ground water group, National Geophysical Research Institute, Hyderabad
Parameter Limits not to exceed pH 6.5 – 9.0 BOD5, 20°C, mg/l 100* Total Suspended Solids mg/l 100
Sulphides, mg/l 2.0 Total Chromium, mg/l 2.0 Oil & grease 10
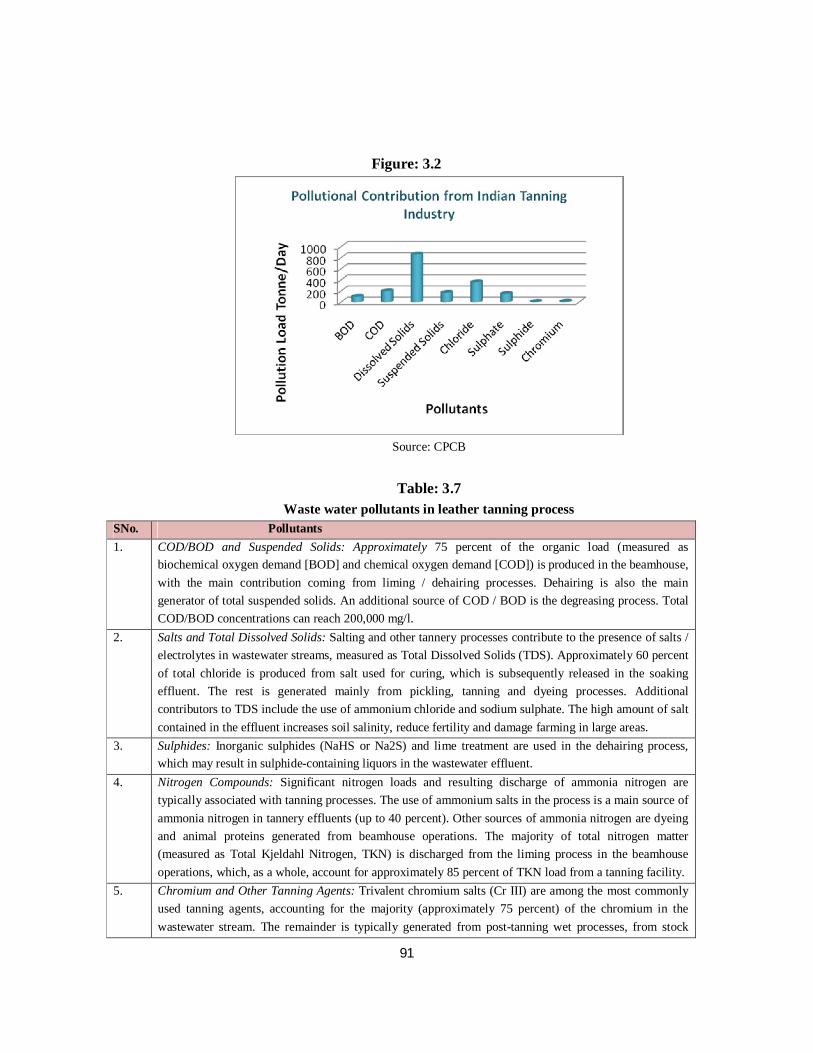
91
Figure: 3.2
Source: CPCB
Table: 3.7
Waste water pollutants in leather tanning process SNo. Pollutants 1. COD/BOD and Suspended Solids: Approximately 75 percent of the organic load (measured as
biochemical oxygen demand [BOD] and chemical oxygen demand [COD]) is produced in the beamhouse, with the main contribution coming from liming / dehairing processes. Dehairing is also the main generator of total suspended solids. An additional source of COD / BOD is the degreasing process. Total COD/BOD concentrations can reach 200,000 mg/l.
2. Salts and Total Dissolved Solids: Salting and other tannery processes contribute to the presence of salts / electrolytes in wastewater streams, measured as Total Dissolved Solids (TDS). Approximately 60 percent of total chloride is produced from salt used for curing, which is subsequently released in the soaking effluent. The rest is generated mainly from pickling, tanning and dyeing processes. Additional contributors to TDS include the use of ammonium chloride and sodium sulphate. The high amount of salt contained in the effluent increases soil salinity, reduce fertility and damage farming in large areas.
3. Sulphides: Inorganic sulphides (NaHS or Na2S) and lime treatment are used in the dehairing process, which may result in sulphide-containing liquors in the wastewater effluent.
4. Nitrogen Compounds: Significant nitrogen loads and resulting discharge of ammonia nitrogen are typically associated with tanning processes. The use of ammonium salts in the process is a main source of ammonia nitrogen in tannery effluents (up to 40 percent). Other sources of ammonia nitrogen are dyeing and animal proteins generated from beamhouse operations. The majority of total nitrogen matter (measured as Total Kjeldahl Nitrogen, TKN) is discharged from the liming process in the beamhouse operations, which, as a whole, account for approximately 85 percent of TKN load from a tanning facility.
5. Chromium and Other Tanning Agents: Trivalent chromium salts (Cr III) are among the most commonly used tanning agents, accounting for the majority (approximately 75 percent) of the chromium in the wastewater stream. The remainder is typically generated from post-tanning wet processes, from stock
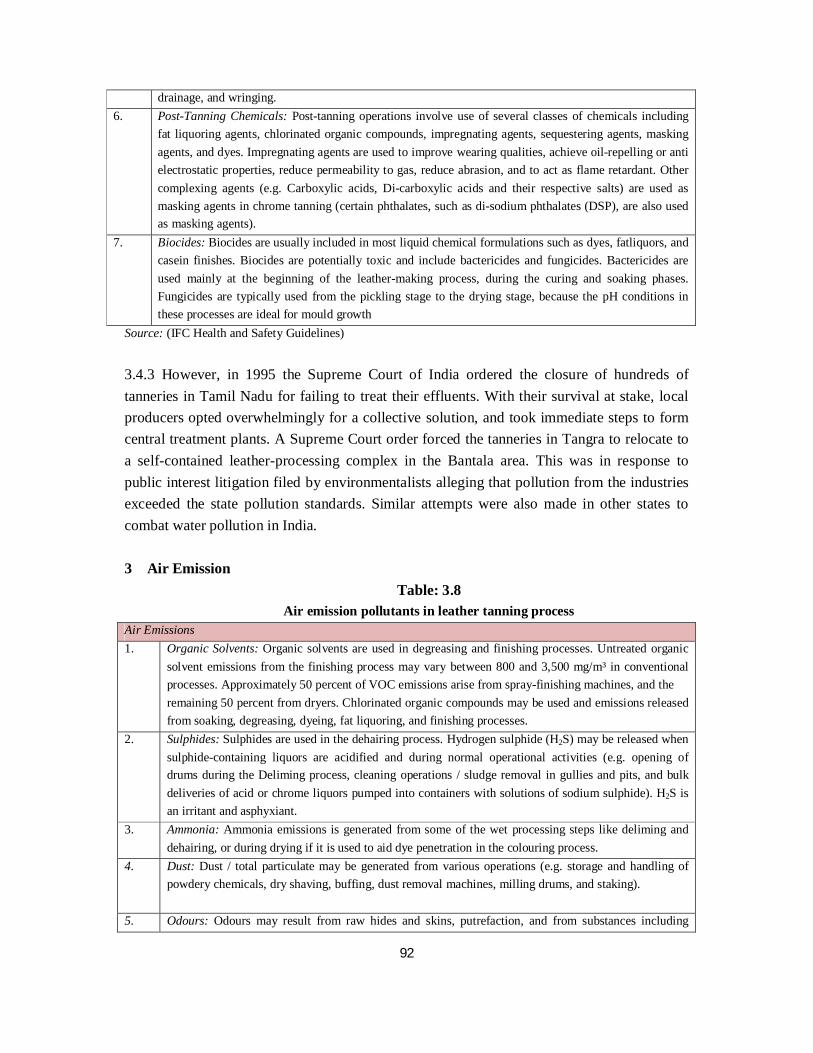
92
drainage, and wringing. 6. Post-Tanning Chemicals: Post-tanning operations involve use of several classes of chemicals including
fat liquoring agents, chlorinated organic compounds, impregnating agents, sequestering agents, masking agents, and dyes. Impregnating agents are used to improve wearing qualities, achieve oil-repelling or anti electrostatic properties, reduce permeability to gas, reduce abrasion, and to act as flame retardant. Other complexing agents (e.g. Carboxylic acids, Di-carboxylic acids and their respective salts) are used as masking agents in chrome tanning (certain phthalates, such as di-sodium phthalates (DSP), are also used as masking agents).
7. Biocides: Biocides are usually included in most liquid chemical formulations such as dyes, fatliquors, and casein finishes. Biocides are potentially toxic and include bactericides and fungicides. Bactericides are used mainly at the beginning of the leather-making process, during the curing and soaking phases. Fungicides are typically used from the pickling stage to the drying stage, because the pH conditions in these processes are ideal for mould growth
Source: (IFC Health and Safety Guidelines) 3.4.3 However, in 1995 the Supreme Court of India ordered the closure of hundreds of tanneries in Tamil Nadu for failing to treat their effluents. With their survival at stake, local producers opted overwhelmingly for a collective solution, and took immediate steps to form central treatment plants. A Supreme Court order forced the tanneries in Tangra to relocate to a self-contained leather-processing complex in the Bantala area. This was in response to public interest litigation filed by environmentalists alleging that pollution from the industries exceeded the state pollution standards. Similar attempts were also made in other states to combat water pollution in India. 3 Air Emission
Table: 3.8 Air emission pollutants in leather tanning process
Air Emissions 1. Organic Solvents: Organic solvents are used in degreasing and finishing processes. Untreated organic
solvent emissions from the finishing process may vary between 800 and 3,500 mg/m³ in conventional processes. Approximately 50 percent of VOC emissions arise from spray-finishing machines, and the remaining 50 percent from dryers. Chlorinated organic compounds may be used and emissions released from soaking, degreasing, dyeing, fat liquoring, and finishing processes.
2. Sulphides: Sulphides are used in the dehairing process. Hydrogen sulphide (H2S) may be released when sulphide-containing liquors are acidified and during normal operational activities (e.g. opening of drums during the Deliming process, cleaning operations / sludge removal in gullies and pits, and bulk deliveries of acid or chrome liquors pumped into containers with solutions of sodium sulphide). H2S is an irritant and asphyxiant.
3. Ammonia: Ammonia emissions is generated from some of the wet processing steps like deliming and dehairing, or during drying if it is used to aid dye penetration in the colouring process.
4. Dust: Dust / total particulate may be generated from various operations (e.g. storage and handling of powdery chemicals, dry shaving, buffing, dust removal machines, milling drums, and staking).
5. Odours: Odours may result from raw hides and skins, putrefaction, and from substances including
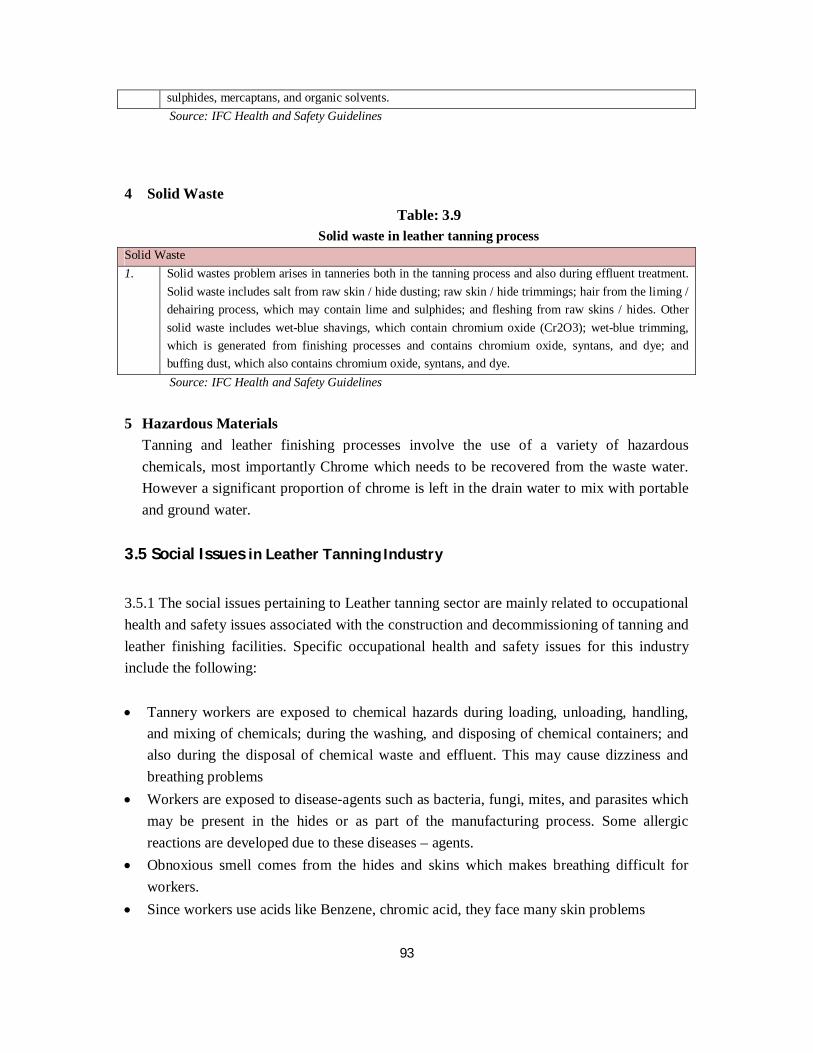
93
sulphides, mercaptans, and organic solvents. Source: IFC Health and Safety Guidelines
4 Solid Waste Table: 3.9
Solid waste in leather tanning process Solid Waste 1. Solid wastes problem arises in tanneries both in the tanning process and also during effluent treatment.
Solid waste includes salt from raw skin / hide dusting; raw skin / hide trimmings; hair from the liming / dehairing process, which may contain lime and sulphides; and fleshing from raw skins / hides. Other solid waste includes wet-blue shavings, which contain chromium oxide (Cr2O3); wet-blue trimming, which is generated from finishing processes and contains chromium oxide, syntans, and dye; and buffing dust, which also contains chromium oxide, syntans, and dye. Source: IFC Health and Safety Guidelines
5 Hazardous Materials Tanning and leather finishing processes involve the use of a variety of hazardous chemicals, most importantly Chrome which needs to be recovered from the waste water. However a significant proportion of chrome is left in the drain water to mix with portable and ground water.
3.5 Social Issues in Leather Tanning Industry
3.5.1 The social issues pertaining to Leather tanning sector are mainly related to occupational health and safety issues associated with the construction and decommissioning of tanning and leather finishing facilities. Specific occupational health and safety issues for this industry include the following: Tannery workers are exposed to chemical hazards during loading, unloading, handling,
and mixing of chemicals; during the washing, and disposing of chemical containers; and also during the disposal of chemical waste and effluent. This may cause dizziness and breathing problems
Workers are exposed to disease-agents such as bacteria, fungi, mites, and parasites which may be present in the hides or as part of the manufacturing process. Some allergic reactions are developed due to these diseases – agents.
Obnoxious smell comes from the hides and skins which makes breathing difficult for workers.
Since workers use acids like Benzene, chromic acid, they face many skin problems
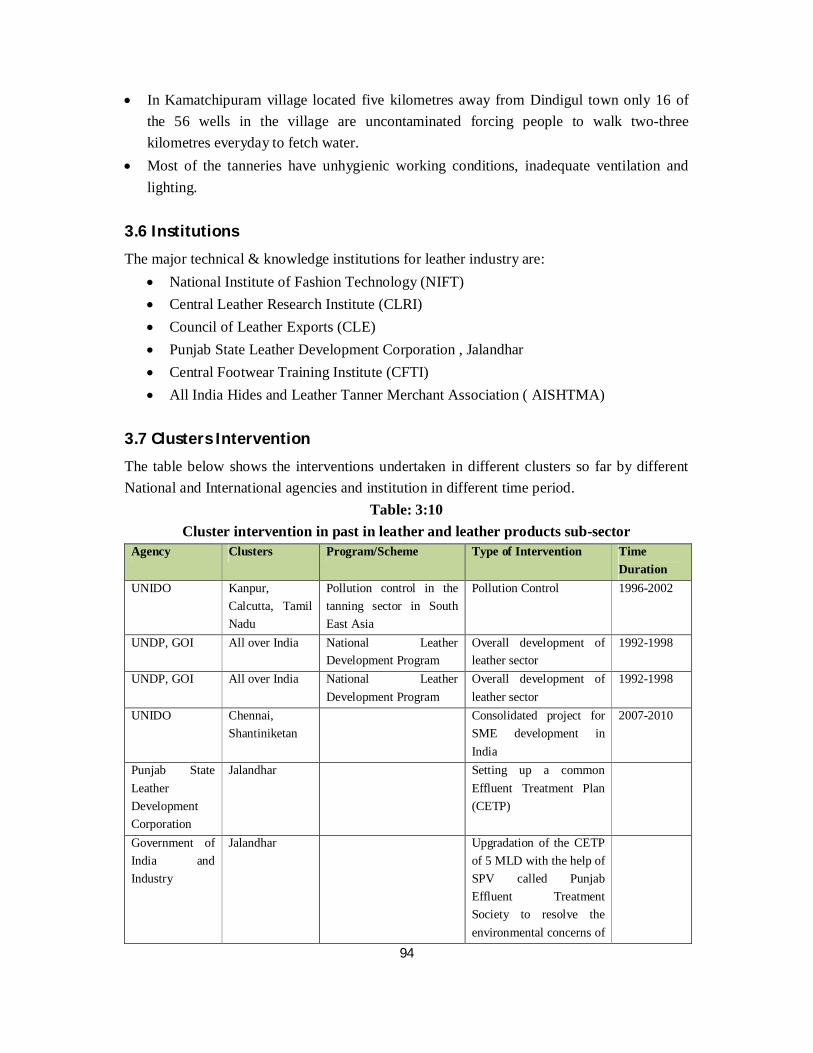
94
In Kamatchipuram village located five kilometres away from Dindigul town only 16 of the 56 wells in the village are uncontaminated forcing people to walk two-three kilometres everyday to fetch water.
Most of the tanneries have unhygienic working conditions, inadequate ventilation and lighting.
3.6 Institutions
The major technical & knowledge institutions for leather industry are: National Institute of Fashion Technology (NIFT) Central Leather Research Institute (CLRI) Council of Leather Exports (CLE) Punjab State Leather Development Corporation , Jalandhar Central Footwear Training Institute (CFTI) All India Hides and Leather Tanner Merchant Association ( AISHTMA)
3.7 Clusters Intervention
The table below shows the interventions undertaken in different clusters so far by different National and International agencies and institution in different time period.
Table: 3:10 Cluster intervention in past in leather and leather products sub-sector
Agency Clusters Program/Scheme Type of Intervention Time Duration
UNIDO Kanpur, Calcutta, Tamil Nadu
Pollution control in the tanning sector in South East Asia
Pollution Control 1996-2002
UNDP, GOI All over India National Leather Development Program
Overall development of leather sector
1992-1998
UNDP, GOI All over India National Leather Development Program
Overall development of leather sector
1992-1998
UNIDO Chennai, Shantiniketan
Consolidated project for SME development in India
2007-2010
Punjab State Leather Development Corporation
Jalandhar Setting up a common Effluent Treatment Plan (CETP)
Government of India and Industry
Jalandhar Upgradation of the CETP of 5 MLD with the help of SPV called Punjab Effluent Treatment Society to resolve the environmental concerns of
95
the leather complex State Industries Promotion Corporation of Tamil Nadu (SIPCOT)
Ranipet Setting up an industrial complex which also houses many tanneries
BIPCC* as per the advice of corporation under a tripartite agreement with UPSIDC, Banther Industrial Pollution Control Company and CLRI, Chennai
Unnao ASIDE scheme of GOI Setting up CETP under this scheme
*a public limited company formed jointly in public interest by all tanneries to assist small scale units in the matters of Prevention & Control of Pollution Source: Discussion with experts
3.8 Bibliography
“Environmental, Health and Safety (EHS) General Guidelines for Leather and Tanning Finishing”(2007), World Bank, IFC
Mondal, N., Saxena, V., & Singh, V. Impact of Pollution due to tanneries on ground water regime. Ground Water Group. Hyderabad: National Geophysical Research Institute.
Aggarwal, G, “Diagnostic Study Report for Leather Footwear Cluster, Agra”, Government of India, Ministry of Small Scale Industries
UNIDO, “Diagnostic Study SME The Leather Cluster, Ambur”(1999)
Websites:
http://www.clri.org/ http://www.cpcb.nic.in/Industry-Specific-Standards/Effluent/425.pdf http://www.dgciskol.nic.in/ http://www.leatherindia.org/ http://www.msmefoundation.org/DSR_temp/Diagnostic%20Study%20Report%20of%20Ambur%20Cluster.pdf
96
Chapter B4
Textiles Sector
4.1Economic Significance
4.1.1 The Indian textile industry is the second largest in the world. The Indian textile industry contributes about 14% to the national industrial production, 4 % to GDP and about 17% to the total national export earnings34. The textile industry in India is a key sector in terms of employment as it is the second largest employment provider after agriculture with direct employment of about 35 mn people which constitutes 21% workforce35. The products of textiles sector includes: Bed sheets Quilt covers Tent materials Pullovers Shirts Dress Materials 4.1.2 Currently, India has about 1,726 spinning mills and 176 composite units with about 39.07 mn spindles and 0.6mn rotors in the organised and unorganised sector. The total number of composite mills in the organised sector has decreased from 223 units in 2003- 04 to 176 units 2007-0836.There are about 12,400 processing factories of which around 10,000 are engaged in manual processing. There are 2.15mn powerlooms in the country as on 31st December, 2008 distributed over approximately 0.482mn units. The powerloom sector
34 (Ministry of Textiles Annual Report, 2008-09) 35 (Official Indian Textiles Statistics, 2005-06) 36 (www.txcindia.org)
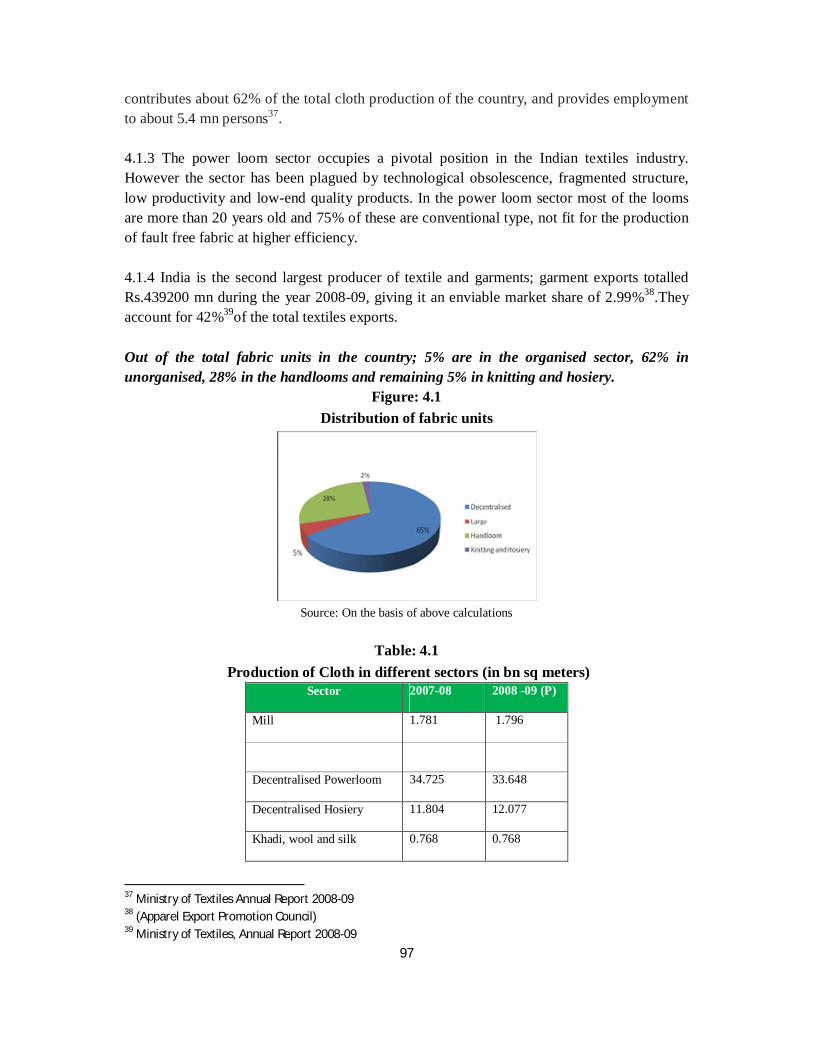
97
contributes about 62% of the total cloth production of the country, and provides employment to about 5.4 mn persons37. 4.1.3 The power loom sector occupies a pivotal position in the Indian textiles industry. However the sector has been plagued by technological obsolescence, fragmented structure, low productivity and low-end quality products. In the power loom sector most of the looms are more than 20 years old and 75% of these are conventional type, not fit for the production of fault free fabric at higher efficiency. 4.1.4 India is the second largest producer of textile and garments; garment exports totalled Rs.439200 mn during the year 2008-09, giving it an enviable market share of 2.99%38.They account for 42%39of the total textiles exports. Out of the total fabric units in the country; 5% are in the organised sector, 62% in unorganised, 28% in the handlooms and remaining 5% in knitting and hosiery.
Figure: 4.1 Distribution of fabric units
Source: On the basis of above calculations
Table: 4.1 Production of Cloth in different sectors (in bn sq meters)
Sector 2007-08 2008 -09 (P)
Mill 1.781 1.796
Decentralised Powerloom 34.725 33.648
Decentralised Hosiery 11.804 12.077
Khadi, wool and silk 0.768 0.768
37 Ministry of Textiles Annual Report 2008-09 38 (Apparel Export Promotion Council) 39 Ministry of Textiles, Annual Report 2008-09
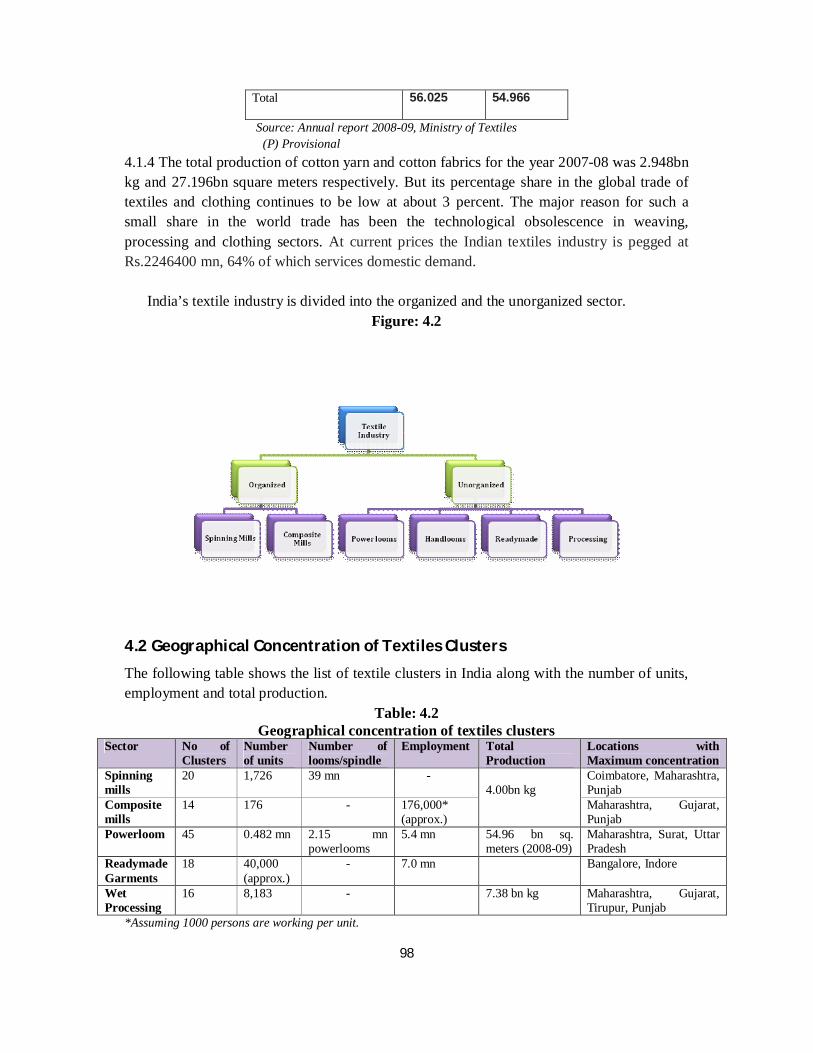
98
Total 56.025 54.966
Source: Annual report 2008-09, Ministry of Textiles (P) Provisional 4.1.4 The total production of cotton yarn and cotton fabrics for the year 2007-08 was 2.948bn kg and 27.196bn square meters respectively. But its percentage share in the global trade of textiles and clothing continues to be low at about 3 percent. The major reason for such a small share in the world trade has been the technological obsolescence in weaving, processing and clothing sectors. At current prices the Indian textiles industry is pegged at Rs.2246400 mn, 64% of which services domestic demand. India’s textile industry is divided into the organized and the unorganized sector.
Figure: 4.2
4.2 Geographical Concentration of Textiles Clusters
The following table shows the list of textile clusters in India along with the number of units, employment and total production.
Table: 4.2 Geographical concentration of textiles clusters
Sector No of Clusters
Number of units
Number of looms/spindle
Employment Total Production
Locations with Maximum concentration
Spinning mills
20 1,726 39 mn - 4.00bn kg
Coimbatore, Maharashtra, Punjab
Composite mills
14 176 - 176,000* (approx.)
Maharashtra, Gujarat, Punjab
Powerloom 45 0.482 mn 2.15 mn powerlooms
5.4 mn 54.96 bn sq. meters (2008-09)
Maharashtra, Surat, Uttar Pradesh
Readymade Garments
18 40,000 (approx.)
- 7.0 mn Bangalore, Indore
Wet Processing
16 8,183 - 7.38 bn kg Maharashtra, Gujarat, Tirupur, Punjab
*Assuming 1000 persons are working per unit.
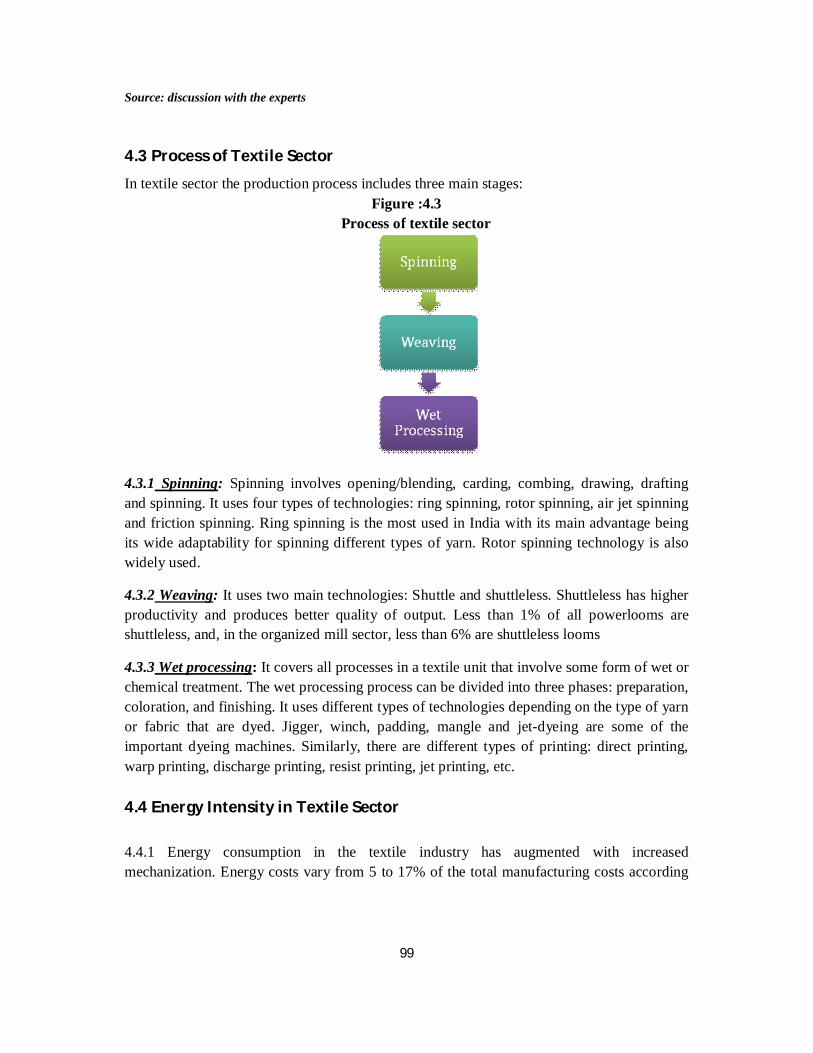
99
Source: discussion with the experts 4.3 Process of Textile Sector
In textile sector the production process includes three main stages: Figure :4.3
Process of textile sector
4.3.1 Spinning: Spinning involves opening/blending, carding, combing, drawing, drafting and spinning. It uses four types of technologies: ring spinning, rotor spinning, air jet spinning and friction spinning. Ring spinning is the most used in India with its main advantage being its wide adaptability for spinning different types of yarn. Rotor spinning technology is also widely used.
4.3.2 Weaving: It uses two main technologies: Shuttle and shuttleless. Shuttleless has higher productivity and produces better quality of output. Less than 1% of all powerlooms are shuttleless, and, in the organized mill sector, less than 6% are shuttleless looms
4.3.3 Wet processing: It covers all processes in a textile unit that involve some form of wet or chemical treatment. The wet processing process can be divided into three phases: preparation, coloration, and finishing. It uses different types of technologies depending on the type of yarn or fabric that are dyed. Jigger, winch, padding, mangle and jet-dyeing are some of the important dyeing machines. Similarly, there are different types of printing: direct printing, warp printing, discharge printing, resist printing, jet printing, etc. 4.4 Energy Intensity in Textile Sector
4.4.1 Energy consumption in the textile industry has augmented with increased mechanization. Energy costs vary from 5 to 17% of the total manufacturing costs according
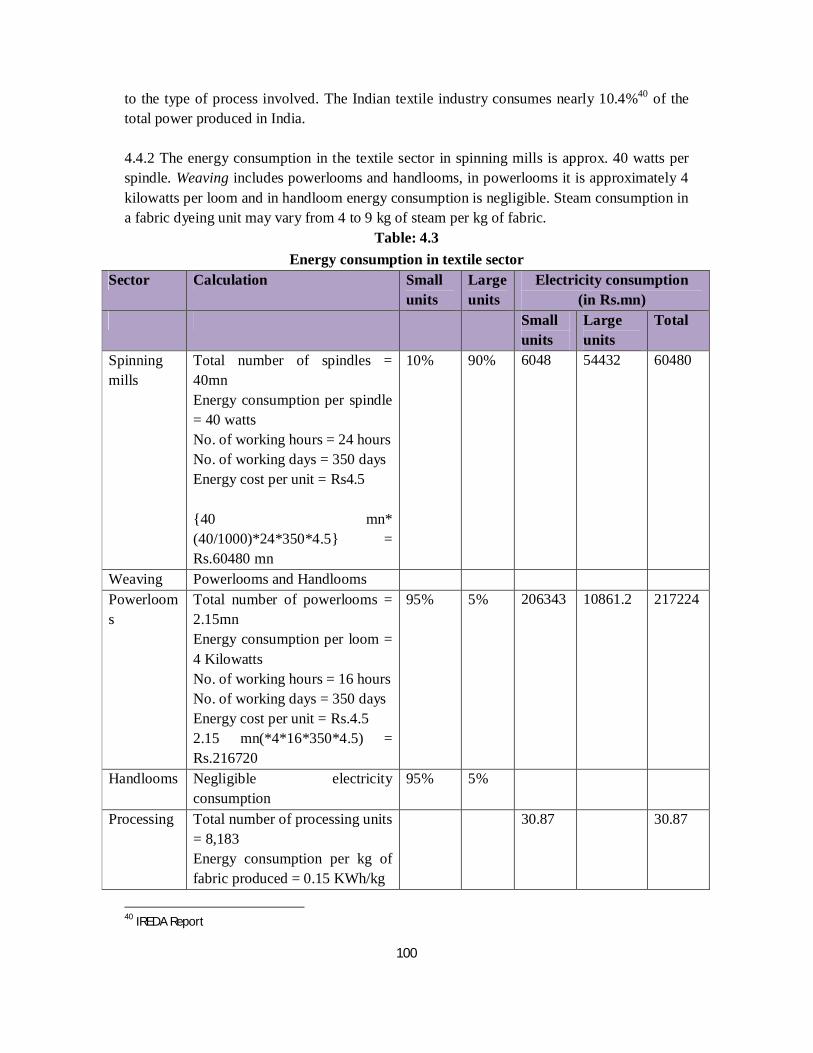
100
to the type of process involved. The Indian textile industry consumes nearly 10.4%40 of the total power produced in India. 4.4.2 The energy consumption in the textile sector in spinning mills is approx. 40 watts per spindle. Weaving includes powerlooms and handlooms, in powerlooms it is approximately 4 kilowatts per loom and in handloom energy consumption is negligible. Steam consumption in a fabric dyeing unit may vary from 4 to 9 kg of steam per kg of fabric.
Table: 4.3 Energy consumption in textile sector
Sector Calculation Small units
Large units
Electricity consumption (in Rs.mn)
Small units
Large units
Total
Spinning mills
Total number of spindles = 40mn Energy consumption per spindle = 40 watts No. of working hours = 24 hours No. of working days = 350 days Energy cost per unit = Rs4.5 {40 mn* (40/1000)*24*350*4.5} = Rs.60480 mn
10% 90% 6048 54432 60480
Weaving Powerlooms and Handlooms Powerlooms
Total number of powerlooms = 2.15mn Energy consumption per loom = 4 Kilowatts No. of working hours = 16 hours No. of working days = 350 days Energy cost per unit = Rs.4.5 2.15 mn(*4*16*350*4.5) = Rs.216720
95% 5% 206343 10861.2 217224
Handlooms Negligible electricity consumption
95% 5%
Processing Total number of processing units = 8,183 Energy consumption per kg of fabric produced = 0.15 KWh/kg
30.87 30.87
40 IREDA Report
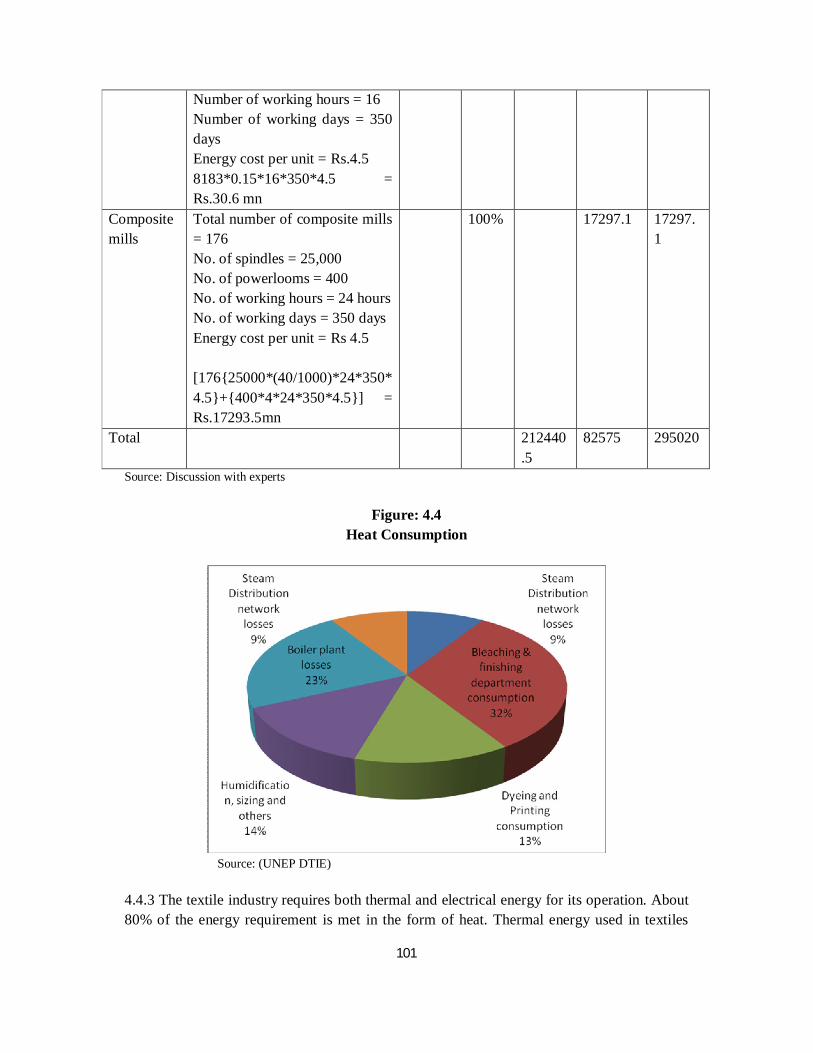
101
Number of working hours = 16 Number of working days = 350 days Energy cost per unit = Rs.4.5 8183*0.15*16*350*4.5 = Rs.30.6 mn
Composite mills
Total number of composite mills = 176 No. of spindles = 25,000 No. of powerlooms = 400 No. of working hours = 24 hours No. of working days = 350 days Energy cost per unit = Rs 4.5 [176{25000*(40/1000)*24*350*4.5}+{400*4*24*350*4.5}] = Rs.17293.5mn
100% 17297.1 17297.1
Total 212440.5
82575 295020
Source: Discussion with experts
Figure: 4.4 Heat Consumption
Source: (UNEP DTIE) 4.4.3 The textile industry requires both thermal and electrical energy for its operation. About 80% of the energy requirement is met in the form of heat. Thermal energy used in textiles

102
sector is in the form of coal and gas. Wet processing includes Bleaching & finishing , dyeing & printing, humidification and boiler plant losses.The above graph shows that in the process of wet processing maximum thermal energy is used i.e 82% of the total energy consumed. In the stage of weaving and spinning 15% and 18% energy is used respectively.The three major factors for energy conservation in the textile industry are high capacity utilization, fine tuning of equipment and technology up-gradation. Since greater percentage of thermal energy is used in wet processing sector, it can be interpreted that maximum pollution is generated in this stage of textile production because of larger consumption of coal.
4.5 Environmental Issues in Textiles Industry
4.5.1 The textiles sector has been listed under “Red Category” as per the standards specified by the Central Pollution Control Board on the basis of its generation and discharges of hazardous wastes. The wastewater general standard for textiles sector is given in the table below:
Table: 4.4 Wastewater general standard for textiles sector
Textile Industry Quantum
Man- Made Fibre
1. Nylon and Polyester 120m3/tonne of fibre produced
2. Voscose Staple Fibre 150m3/tonne of product
3. Viscose Filament Yarn 500m3/tonne of product Source: Central Pollution Control Board Environmental issues during the operational phase of textile manufacturing primarily include the following: • Hazardous materials management • Wastewater • Emissions to air • Solid and liquid waste Hazardous materials management
Table: 4.5 Hazardous materials management
1. Textile manufacturing activities includes the use of hazardous chemicals in pre treatment, dyeing, and other processes to provide the final product with desired visual and functional properties.
Source: IFC Health and Safety Guidelines Wastewater
4.5.2 Water is highly polluted in the textiles processing. For example in Tirupur the textile manufacturing activities alone utilize around 28.80 bn litres of ground water,
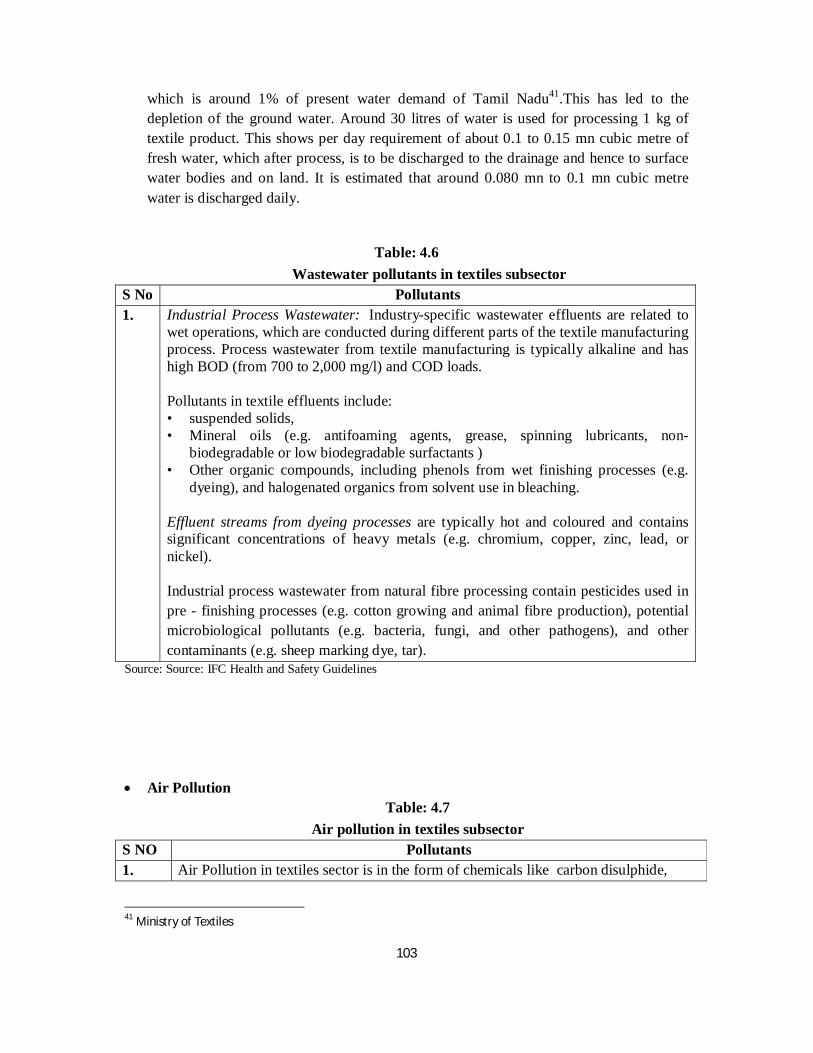
103
which is around 1% of present water demand of Tamil Nadu41.This has led to the depletion of the ground water. Around 30 litres of water is used for processing 1 kg of textile product. This shows per day requirement of about 0.1 to 0.15 mn cubic metre of fresh water, which after process, is to be discharged to the drainage and hence to surface water bodies and on land. It is estimated that around 0.080 mn to 0.1 mn cubic metre water is discharged daily.
Table: 4.6 Wastewater pollutants in textiles subsector
S No Pollutants 1. Industrial Process Wastewater: Industry-specific wastewater effluents are related to
wet operations, which are conducted during different parts of the textile manufacturing process. Process wastewater from textile manufacturing is typically alkaline and has high BOD (from 700 to 2,000 mg/l) and COD loads. Pollutants in textile effluents include: • suspended solids, • Mineral oils (e.g. antifoaming agents, grease, spinning lubricants, non-
biodegradable or low biodegradable surfactants ) • Other organic compounds, including phenols from wet finishing processes (e.g.
dyeing), and halogenated organics from solvent use in bleaching.
Effluent streams from dyeing processes are typically hot and coloured and contains significant concentrations of heavy metals (e.g. chromium, copper, zinc, lead, or nickel). Industrial process wastewater from natural fibre processing contain pesticides used in pre - finishing processes (e.g. cotton growing and animal fibre production), potential microbiological pollutants (e.g. bacteria, fungi, and other pathogens), and other contaminants (e.g. sheep marking dye, tar).
Source: Source: IFC Health and Safety Guidelines
Air Pollution Table: 4.7
Air pollution in textiles subsector S NO Pollutants 1. Air Pollution in textiles sector is in the form of chemicals like carbon disulphide,
41 Ministry of Textiles
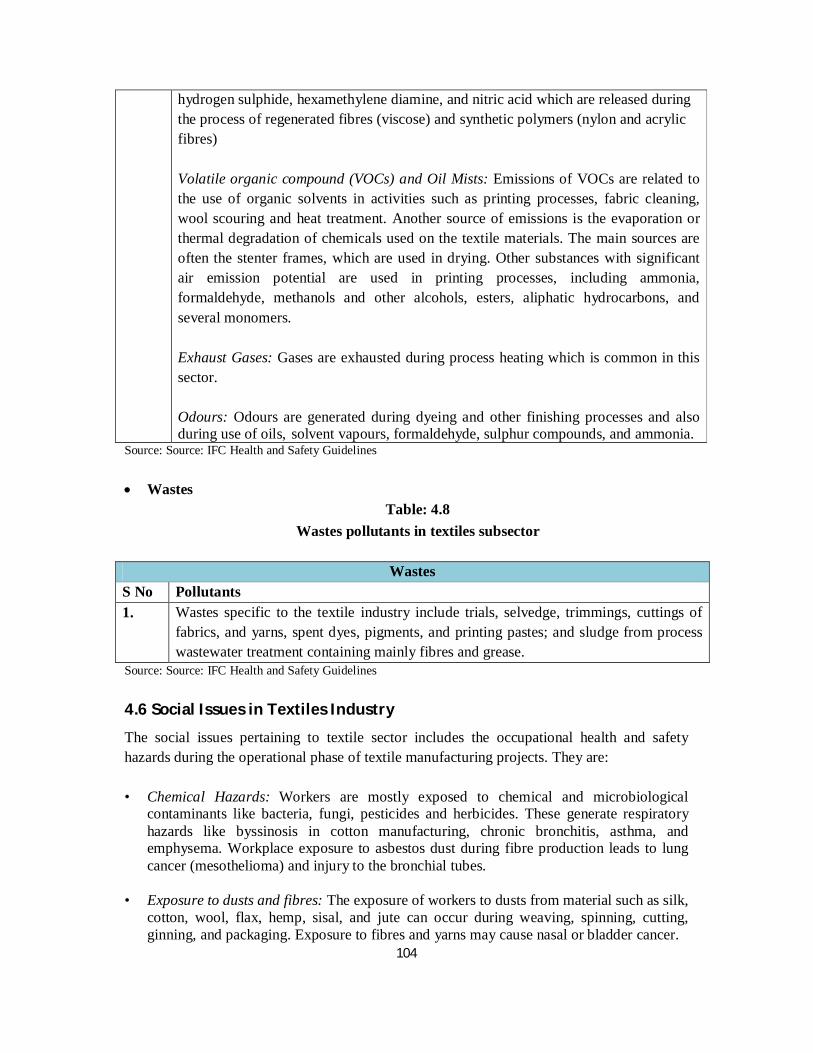
104
hydrogen sulphide, hexamethylene diamine, and nitric acid which are released during the process of regenerated fibres (viscose) and synthetic polymers (nylon and acrylic fibres) Volatile organic compound (VOCs) and Oil Mists: Emissions of VOCs are related to the use of organic solvents in activities such as printing processes, fabric cleaning, wool scouring and heat treatment. Another source of emissions is the evaporation or thermal degradation of chemicals used on the textile materials. The main sources are often the stenter frames, which are used in drying. Other substances with significant air emission potential are used in printing processes, including ammonia, formaldehyde, methanols and other alcohols, esters, aliphatic hydrocarbons, and several monomers. Exhaust Gases: Gases are exhausted during process heating which is common in this sector. Odours: Odours are generated during dyeing and other finishing processes and also during use of oils, solvent vapours, formaldehyde, sulphur compounds, and ammonia.
Source: Source: IFC Health and Safety Guidelines
Wastes Table: 4.8
Wastes pollutants in textiles subsector
Wastes S No Pollutants 1. Wastes specific to the textile industry include trials, selvedge, trimmings, cuttings of
fabrics, and yarns, spent dyes, pigments, and printing pastes; and sludge from process wastewater treatment containing mainly fibres and grease.
Source: Source: IFC Health and Safety Guidelines
4.6 Social Issues in Textiles Industry
The social issues pertaining to textile sector includes the occupational health and safety hazards during the operational phase of textile manufacturing projects. They are: • Chemical Hazards: Workers are mostly exposed to chemical and microbiological
contaminants like bacteria, fungi, pesticides and herbicides. These generate respiratory hazards like byssinosis in cotton manufacturing, chronic bronchitis, asthma, and emphysema. Workplace exposure to asbestos dust during fibre production leads to lung cancer (mesothelioma) and injury to the bronchial tubes.
• Exposure to dusts and fibres: The exposure of workers to dusts from material such as silk, cotton, wool, flax, hemp, sisal, and jute can occur during weaving, spinning, cutting, ginning, and packaging. Exposure to fibres and yarns may cause nasal or bladder cancer.
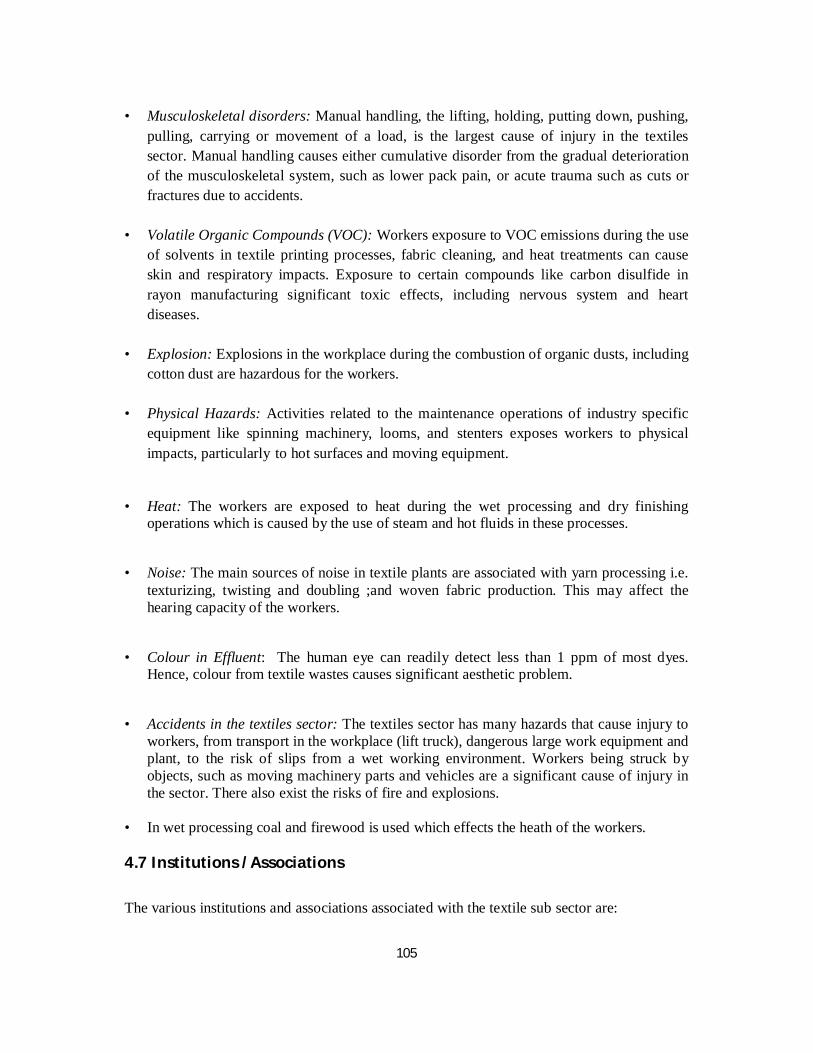
105
• Musculoskeletal disorders: Manual handling, the lifting, holding, putting down, pushing,
pulling, carrying or movement of a load, is the largest cause of injury in the textiles sector. Manual handling causes either cumulative disorder from the gradual deterioration of the musculoskeletal system, such as lower pack pain, or acute trauma such as cuts or fractures due to accidents.
• Volatile Organic Compounds (VOC): Workers exposure to VOC emissions during the use of solvents in textile printing processes, fabric cleaning, and heat treatments can cause skin and respiratory impacts. Exposure to certain compounds like carbon disulfide in rayon manufacturing significant toxic effects, including nervous system and heart diseases.
• Explosion: Explosions in the workplace during the combustion of organic dusts, including cotton dust are hazardous for the workers.
• Physical Hazards: Activities related to the maintenance operations of industry specific
equipment like spinning machinery, looms, and stenters exposes workers to physical impacts, particularly to hot surfaces and moving equipment.
• Heat: The workers are exposed to heat during the wet processing and dry finishing operations which is caused by the use of steam and hot fluids in these processes.
• Noise: The main sources of noise in textile plants are associated with yarn processing i.e. texturizing, twisting and doubling ;and woven fabric production. This may affect the hearing capacity of the workers.
• Colour in Effluent: The human eye can readily detect less than 1 ppm of most dyes. Hence, colour from textile wastes causes significant aesthetic problem.
• Accidents in the textiles sector: The textiles sector has many hazards that cause injury to workers, from transport in the workplace (lift truck), dangerous large work equipment and plant, to the risk of slips from a wet working environment. Workers being struck by objects, such as moving machinery parts and vehicles are a significant cause of injury in the sector. There also exist the risks of fire and explosions.
• In wet processing coal and firewood is used which effects the heath of the workers.
4.7 Institutions /Associations
The various institutions and associations associated with the textile sub sector are:
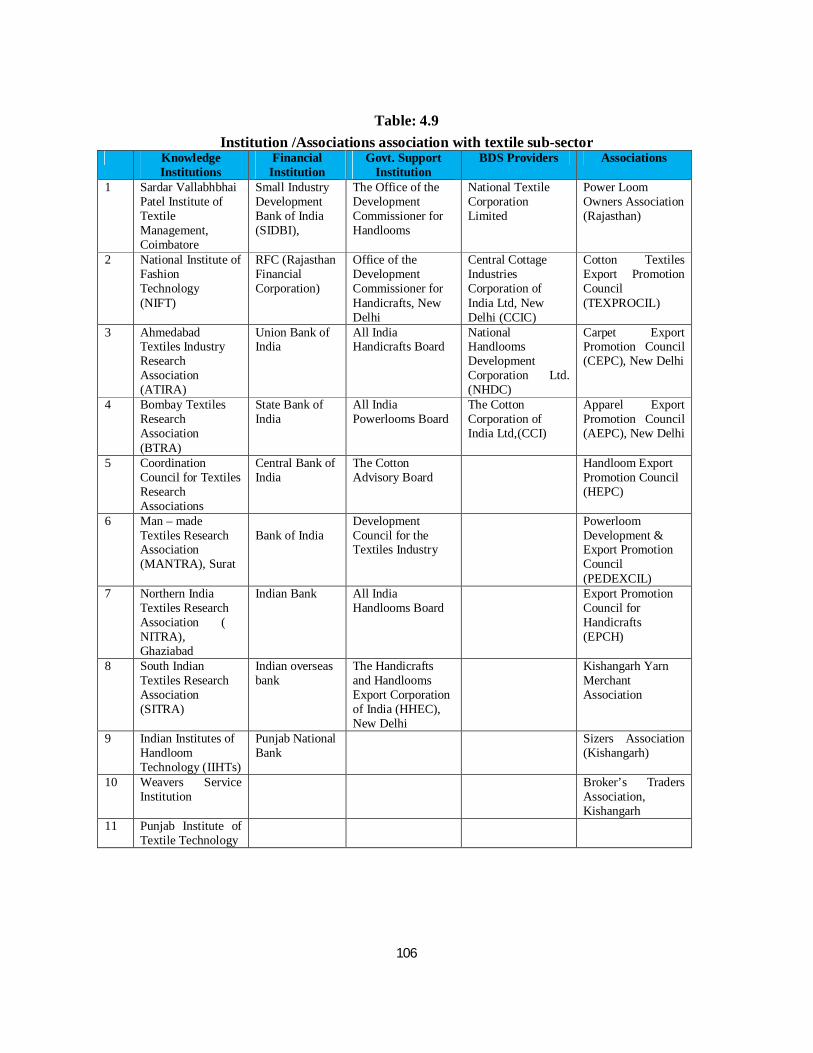
106
Table: 4.9
Institution /Associations association with textile sub-sector Knowledge
Institutions Financial
Institution Govt. Support
Institution BDS Providers Associations
1 Sardar Vallabhbhai Patel Institute of Textile Management, Coimbatore
Small Industry Development Bank of India (SIDBI),
The Office of the Development Commissioner for Handlooms
National Textile Corporation Limited
Power Loom Owners Association (Rajasthan)
2 National Institute of Fashion Technology (NIFT)
RFC (Rajasthan Financial Corporation)
Office of the Development Commissioner for Handicrafts, New Delhi
Central Cottage Industries Corporation of India Ltd, New Delhi (CCIC)
Cotton Textiles Export Promotion Council (TEXPROCIL)
3 Ahmedabad Textiles Industry Research Association (ATIRA)
Union Bank of India
All India Handicrafts Board
National Handlooms Development Corporation Ltd. (NHDC)
Carpet Export Promotion Council (CEPC), New Delhi
4 Bombay Textiles Research Association (BTRA)
State Bank of India
All India Powerlooms Board
The Cotton Corporation of India Ltd,(CCI)
Apparel Export Promotion Council (AEPC), New Delhi
5 Coordination Council for Textiles Research Associations
Central Bank of India
The Cotton Advisory Board
Handloom Export Promotion Council (HEPC)
6 Man – made Textiles Research Association (MANTRA), Surat
Bank of India
Development Council for the Textiles Industry
Powerloom Development & Export Promotion Council (PEDEXCIL)
7 Northern India Textiles Research Association ( NITRA), Ghaziabad
Indian Bank All India Handlooms Board
Export Promotion Council for Handicrafts (EPCH)
8 South Indian Textiles Research Association (SITRA)
Indian overseas bank
The Handicrafts and Handlooms Export Corporation of India (HHEC), New Delhi
Kishangarh Yarn Merchant Association
9 Indian Institutes of Handloom Technology (IIHTs)
Punjab National Bank
Sizers Association (Kishangarh)
10 Weavers Service Institution
Broker’s Traders Association, Kishangarh
11 Punjab Institute of Textile Technology
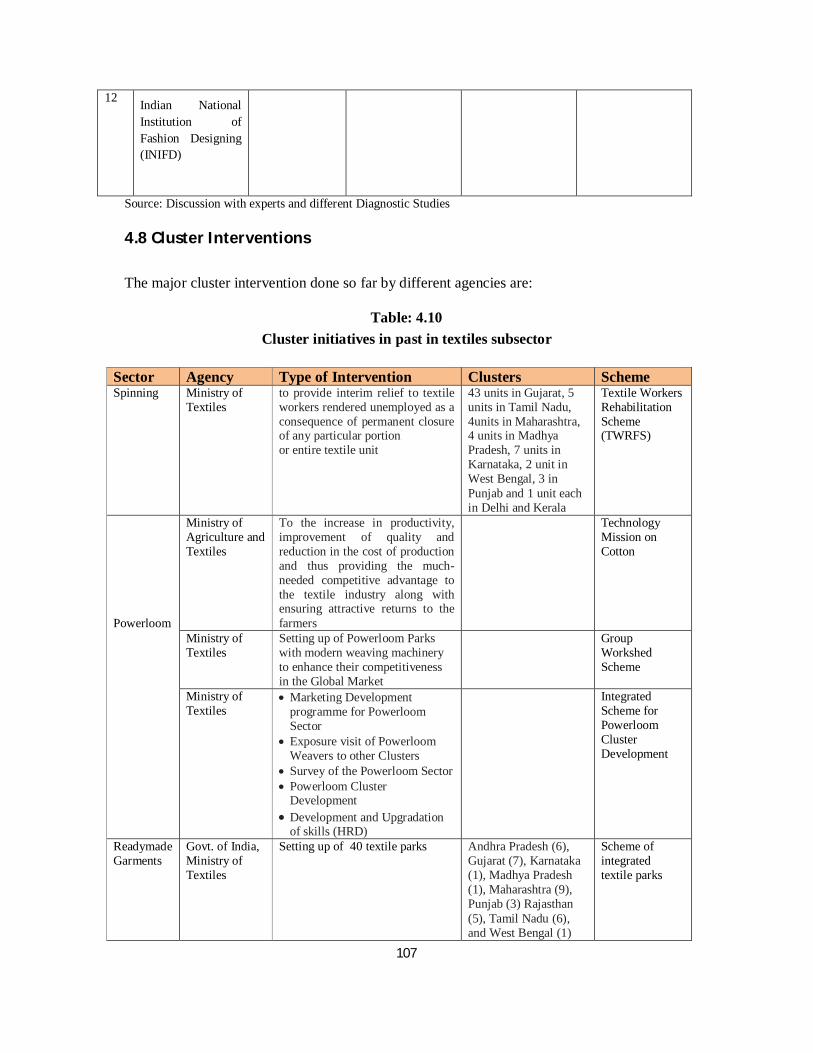
107
12 Indian National Institution of Fashion Designing (INIFD)
Source: Discussion with experts and different Diagnostic Studies 4.8 Cluster Interventions
The major cluster intervention done so far by different agencies are:
Table: 4.10 Cluster initiatives in past in textiles subsector
Sector Agency Type of Intervention Clusters Scheme Spinning Ministry of
Textiles to provide interim relief to textile workers rendered unemployed as a consequence of permanent closure of any particular portion or entire textile unit
43 units in Gujarat, 5 units in Tamil Nadu, 4units in Maharashtra, 4 units in Madhya Pradesh, 7 units in Karnataka, 2 unit in West Bengal, 3 in Punjab and 1 unit each in Delhi and Kerala
Textile Workers Rehabilitation Scheme (TWRFS)
Powerloom
Ministry of Agriculture and Textiles
To the increase in productivity, improvement of quality and reduction in the cost of production and thus providing the much-needed competitive advantage to the textile industry along with ensuring attractive returns to the farmers
Technology Mission on Cotton
Ministry of Textiles
Setting up of Powerloom Parks with modern weaving machinery to enhance their competitiveness in the Global Market
Group Workshed Scheme
Ministry of Textiles
Marketing Development programme for Powerloom Sector
Exposure visit of Powerloom Weavers to other Clusters
Survey of the Powerloom Sector Powerloom Cluster
Development Development and Upgradation
of skills (HRD)
Integrated Scheme for Powerloom Cluster Development
Readymade Garments
Govt. of India, Ministry of Textiles
Setting up of 40 textile parks Andhra Pradesh (6), Gujarat (7), Karnataka (1), Madhya Pradesh (1), Maharashtra (9), Punjab (3) Rajasthan (5), Tamil Nadu (6), and West Bengal (1)
Scheme of integrated textile parks
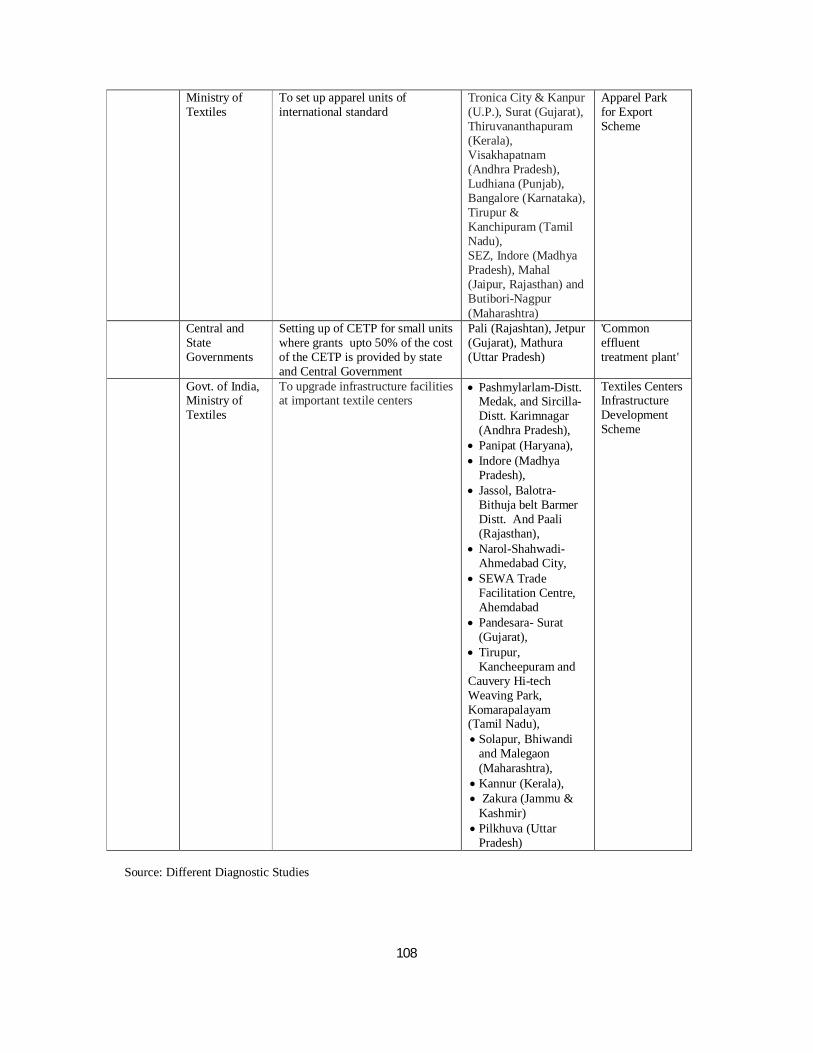
108
Ministry of Textiles
To set up apparel units of international standard
Tronica City & Kanpur (U.P.), Surat (Gujarat), Thiruvananthapuram (Kerala), Visakhapatnam (Andhra Pradesh), Ludhiana (Punjab), Bangalore (Karnataka), Tirupur & Kanchipuram (Tamil Nadu), SEZ, Indore (Madhya Pradesh), Mahal (Jaipur, Rajasthan) and Butibori-Nagpur (Maharashtra)
Apparel Park for Export Scheme
Central and State Governments
Setting up of CETP for small units where grants upto 50% of the cost of the CETP is provided by state and Central Government
Pali (Rajashtan), Jetpur (Gujarat), Mathura (Uttar Pradesh)
'Common effluent treatment plant'
Govt. of India, Ministry of Textiles
To upgrade infrastructure facilities at important textile centers
Pashmylarlam-Distt. Medak, and Sircilla-Distt. Karimnagar (Andhra Pradesh),
Panipat (Haryana), Indore (Madhya
Pradesh), Jassol, Balotra-
Bithuja belt Barmer Distt. And Paali (Rajasthan),
Narol-Shahwadi- Ahmedabad City,
SEWA Trade Facilitation Centre, Ahemdabad
Pandesara- Surat (Gujarat),
Tirupur, Kancheepuram and
Cauvery Hi-tech Weaving Park, Komarapalayam (Tamil Nadu), Solapur, Bhiwandi
and Malegaon (Maharashtra),
Kannur (Kerala), Zakura (Jammu &
Kashmir) Pilkhuva (Uttar
Pradesh)
Textiles Centers Infrastructure Development Scheme
Source: Different Diagnostic Studies
109
4.9 Bibliography
“Environmental, Health and Safety (EHS) General Guidelines” (2007), World Bank, IFC
“Investors Manual for Energy Efficiency”, Indian Renewable Energy Development Agency and Confederation of Indian Industry, Pg 448
Ministry of Textiles Annual Report, Government of India (2008-09)
Official Indian Textiles Statistics, 2005-06
UNEP DTIE
Websites
http://texmin.nic.in/annualrep/ar_08_09_english.pdf http://www.aepcindia.com/ http://www.cpcb.nic.in/Industry-Specific-Standards/Effluent/425.pdf http://www.unescap.org/tid/publication/tipub2500_pt1chap6.pdf
110
Chapter – B5
Dyes and Chemicals
5.1Economic Significance
5.1.1 The Indian dyestuff industry is only about 40 years old .The Dyestuff sector is one of the important segments of the chemicals industry in India, having forward and backward linkages with a variety of sectors like textiles, leather, paper, plastics, printing inks and foodstuffs. Dyes are colouring pigments that find application in a variety of industries. The textile industry is the largest consumer of dyestuffs. This sector has now emerged as a very strong industry and a major foreign exchange earner. India has emerged as a global supplier of dyestuffs and dye intermediates, particularly for reactive, acid, vat and direct dyes. The total export of dye products has increased from Rs 21924 mn in 2001-02 to Rs 41058 mn in 2006-0742. Currently in India all varieties of synthetic dyestuffs and intermediates are produced and have a small presence in the natural dyestuff. 5.1.2 The main competitor, China's share in the world market is estimated to be around 25%. The global market share of Indian dyes industry is between 5 - 7%, and it is expected to increase to almost 10% by 2010.
Figure: 5.1
42 Department of Chemicals and Petrochemicals
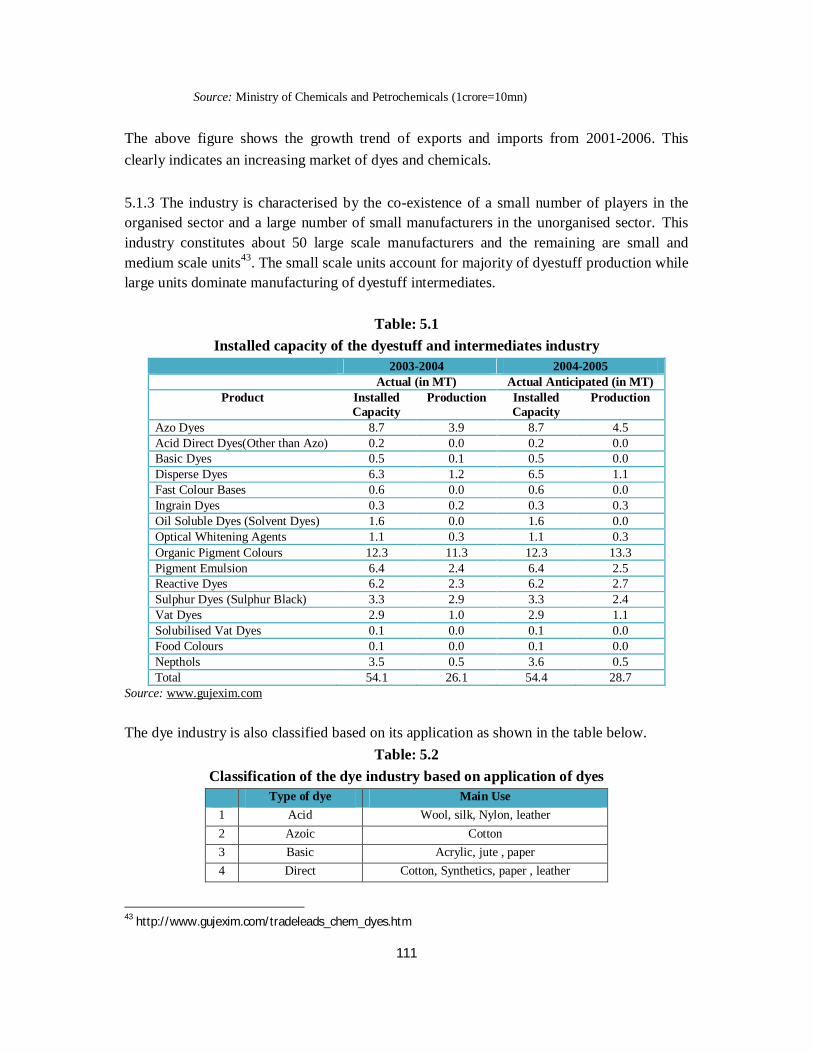
111
Source: Ministry of Chemicals and Petrochemicals (1crore=10mn)
The above figure shows the growth trend of exports and imports from 2001-2006. This clearly indicates an increasing market of dyes and chemicals. 5.1.3 The industry is characterised by the co-existence of a small number of players in the organised sector and a large number of small manufacturers in the unorganised sector. This industry constitutes about 50 large scale manufacturers and the remaining are small and medium scale units43. The small scale units account for majority of dyestuff production while large units dominate manufacturing of dyestuff intermediates.
Table: 5.1 Installed capacity of the dyestuff and intermediates industry
2003-2004 2004-2005 Actual (in MT) Actual Anticipated (in MT)
Product Installed Capacity
Production Installed Capacity
Production
Azo Dyes 8.7 3.9 8.7 4.5 Acid Direct Dyes(Other than Azo) 0.2 0.0 0.2 0.0 Basic Dyes 0.5 0.1 0.5 0.0 Disperse Dyes 6.3 1.2 6.5 1.1 Fast Colour Bases 0.6 0.0 0.6 0.0 Ingrain Dyes 0.3 0.2 0.3 0.3 Oil Soluble Dyes (Solvent Dyes) 1.6 0.0 1.6 0.0 Optical Whitening Agents 1.1 0.3 1.1 0.3 Organic Pigment Colours 12.3 11.3 12.3 13.3 Pigment Emulsion 6.4 2.4 6.4 2.5 Reactive Dyes 6.2 2.3 6.2 2.7 Sulphur Dyes (Sulphur Black) 3.3 2.9 3.3 2.4 Vat Dyes 2.9 1.0 2.9 1.1 Solubilised Vat Dyes 0.1 0.0 0.1 0.0 Food Colours 0.1 0.0 0.1 0.0 Nepthols 3.5 0.5 3.6 0.5 Total 54.1 26.1 54.4 28.7
Source: www.gujexim.com The dye industry is also classified based on its application as shown in the table below.
Table: 5.2 Classification of the dye industry based on application of dyes
Type of dye Main Use 1 Acid Wool, silk, Nylon, leather 2 Azoic Cotton 3 Basic Acrylic, jute , paper 4 Direct Cotton, Synthetics, paper , leather
43 http://www.gujexim.com/tradeleads_chem_dyes.htm
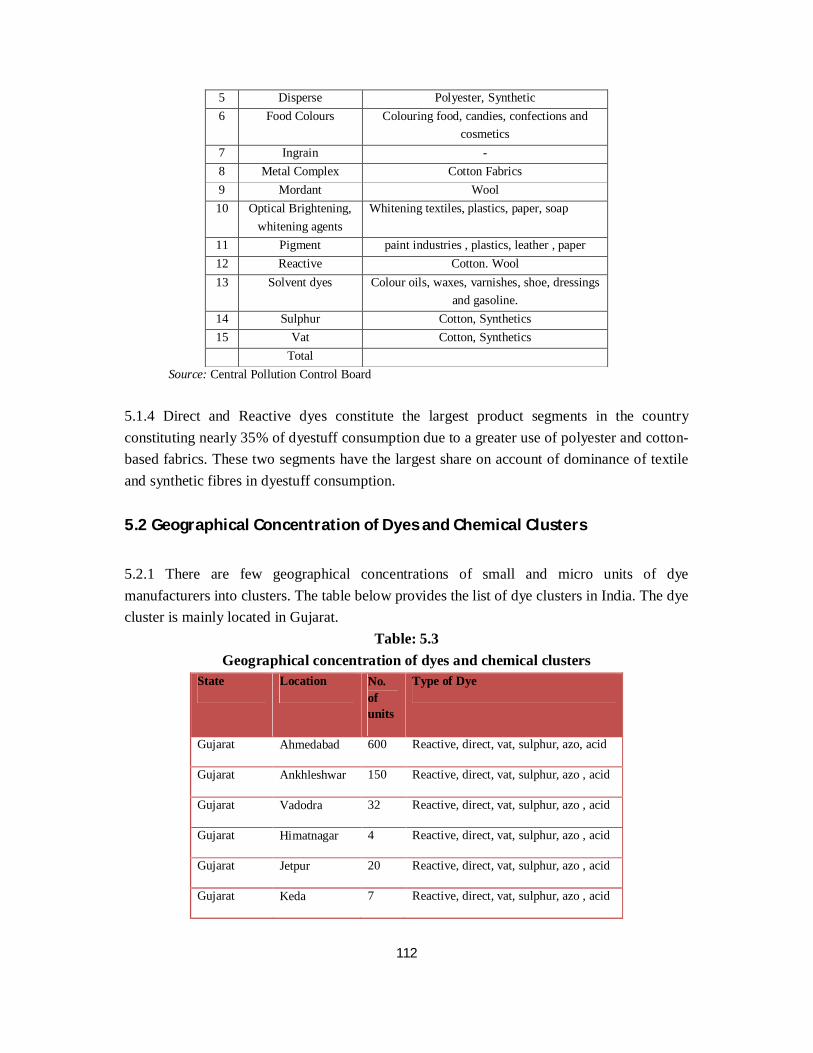
112
5 Disperse Polyester, Synthetic 6 Food Colours Colouring food, candies, confections and
cosmetics 7 Ingrain - 8 Metal Complex Cotton Fabrics 9 Mordant Wool 10 Optical Brightening,
whitening agents Whitening textiles, plastics, paper, soap
11 Pigment paint industries , plastics, leather , paper 12 Reactive Cotton. Wool 13 Solvent dyes Colour oils, waxes, varnishes, shoe, dressings
and gasoline. 14 Sulphur Cotton, Synthetics 15 Vat Cotton, Synthetics
Total Source: Central Pollution Control Board
5.1.4 Direct and Reactive dyes constitute the largest product segments in the country constituting nearly 35% of dyestuff consumption due to a greater use of polyester and cotton-based fabrics. These two segments have the largest share on account of dominance of textile and synthetic fibres in dyestuff consumption. 5.2 Geographical Concentration of Dyes and Chemical Clusters
5.2.1 There are few geographical concentrations of small and micro units of dye manufacturers into clusters. The table below provides the list of dye clusters in India. The dye cluster is mainly located in Gujarat.
Table: 5.3 Geographical concentration of dyes and chemical clusters
State Location No. of units
Type of Dye
Gujarat Ahmedabad 600 Reactive, direct, vat, sulphur, azo, acid
Gujarat Ankhleshwar 150 Reactive, direct, vat, sulphur, azo , acid
Gujarat Vadodra 32 Reactive, direct, vat, sulphur, azo , acid
Gujarat Himatnagar 4 Reactive, direct, vat, sulphur, azo , acid
Gujarat Jetpur 20 Reactive, direct, vat, sulphur, azo , acid
Gujarat Keda 7 Reactive, direct, vat, sulphur, azo , acid
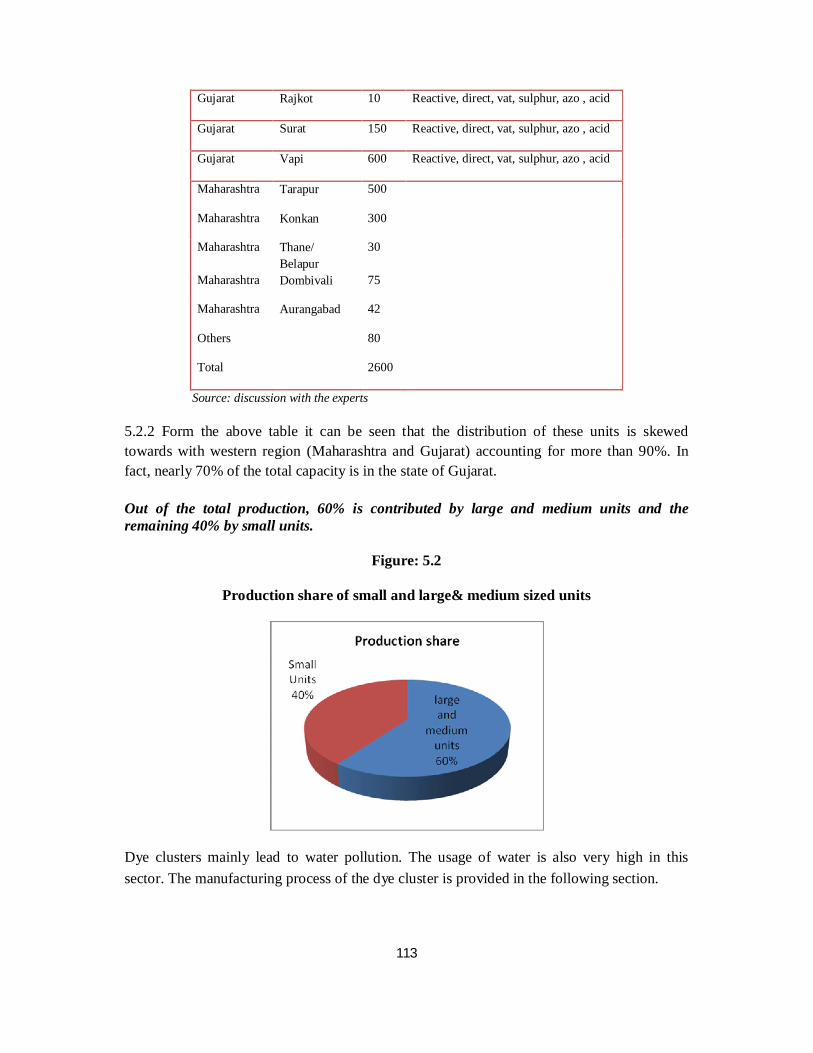
113
Gujarat Rajkot 10 Reactive, direct, vat, sulphur, azo , acid
Gujarat Surat 150 Reactive, direct, vat, sulphur, azo , acid
Gujarat Vapi 600 Reactive, direct, vat, sulphur, azo , acid
Maharashtra Tarapur 500
Maharashtra Konkan 300
Maharashtra Thane/ Belapur
30
Maharashtra Dombivali 75
Maharashtra Aurangabad 42
Others 80
Total 2600
Source: discussion with the experts
5.2.2 Form the above table it can be seen that the distribution of these units is skewed towards with western region (Maharashtra and Gujarat) accounting for more than 90%. In fact, nearly 70% of the total capacity is in the state of Gujarat.
Out of the total production, 60% is contributed by large and medium units and the remaining 40% by small units.
Figure: 5.2
Production share of small and large& medium sized units
Dye clusters mainly lead to water pollution. The usage of water is also very high in this sector. The manufacturing process of the dye cluster is provided in the following section.
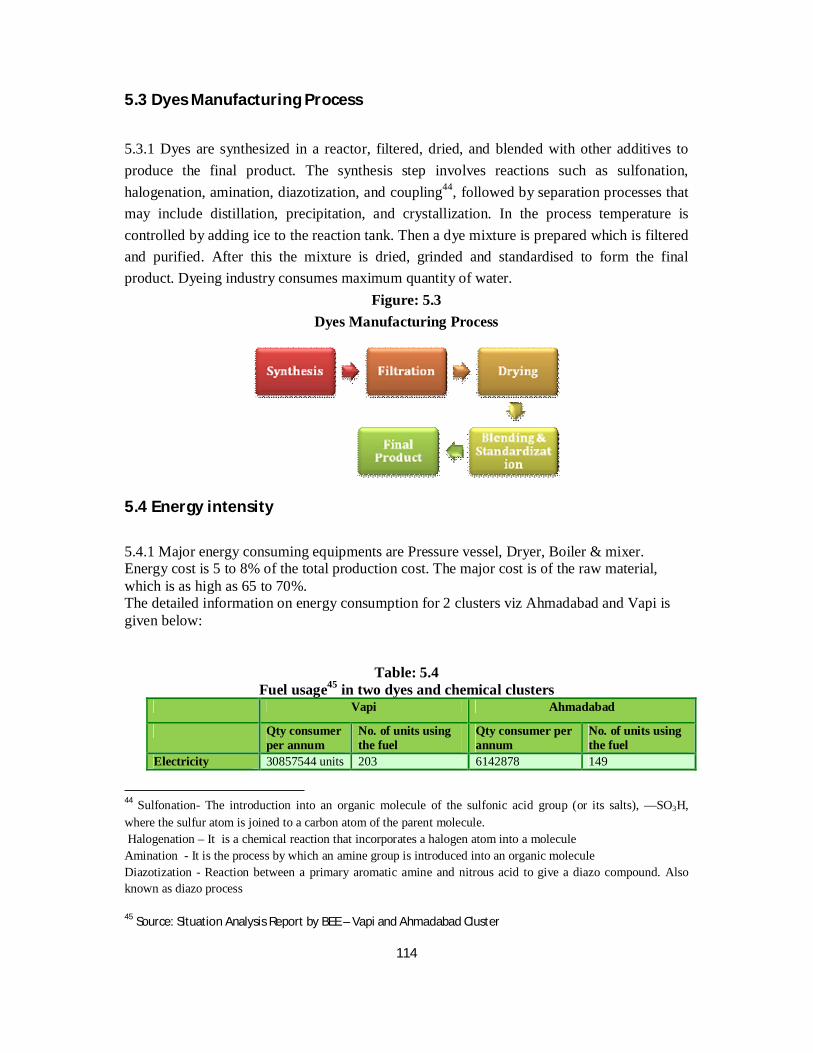
114
5.3 Dyes Manufacturing Process
5.3.1 Dyes are synthesized in a reactor, filtered, dried, and blended with other additives to produce the final product. The synthesis step involves reactions such as sulfonation, halogenation, amination, diazotization, and coupling44, followed by separation processes that may include distillation, precipitation, and crystallization. In the process temperature is controlled by adding ice to the reaction tank. Then a dye mixture is prepared which is filtered and purified. After this the mixture is dried, grinded and standardised to form the final product. Dyeing industry consumes maximum quantity of water.
Figure: 5.3 Dyes Manufacturing Process
5.4 Energy intensity
5.4.1 Major energy consuming equipments are Pressure vessel, Dryer, Boiler & mixer. Energy cost is 5 to 8% of the total production cost. The major cost is of the raw material, which is as high as 65 to 70%. The detailed information on energy consumption for 2 clusters viz Ahmadabad and Vapi is given below:
Table: 5.4 Fuel usage45 in two dyes and chemical clusters
Vapi Ahmadabad
Qty consumer per annum
No. of units using the fuel
Qty consumer per annum
No. of units using the fuel
Electricity 30857544 units 203 6142878 149
44 Sulfonation- The introduction into an organic molecule of the sulfonic acid group (or its salts), —SO3H, where the sulfur atom is joined to a carbon atom of the parent molecule. Halogenation – It is a chemical reaction that incorporates a halogen atom into a molecule Amination - It is the process by which an amine group is introduced into an organic molecule Diazotization - Reaction between a primary aromatic amine and nitrous acid to give a diazo compound. Also known as diazo process 45 Source: Situation Analysis Report by BEE – Vapi and Ahmadabad Cluster
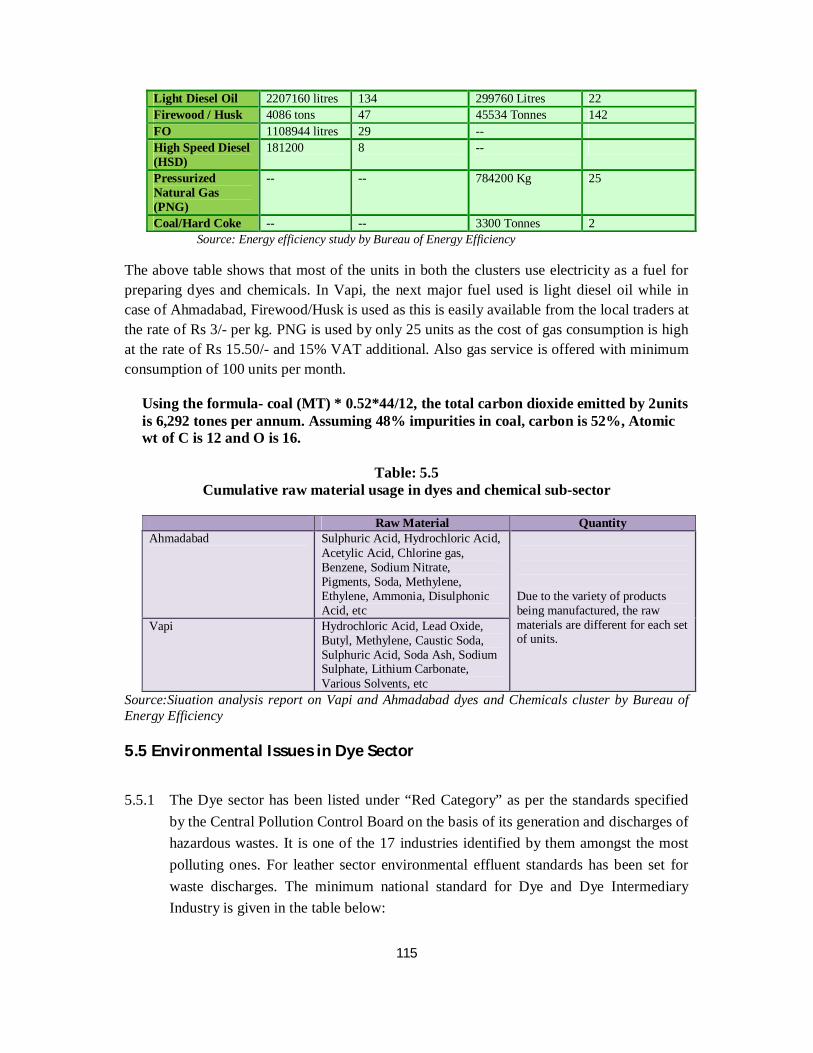
115
Light Diesel Oil 2207160 litres 134 299760 Litres 22 Firewood / Husk 4086 tons 47 45534 Tonnes 142 FO 1108944 litres 29 -- High Speed Diesel (HSD)
181200 8 --
Pressurized Natural Gas (PNG)
-- -- 784200 Kg 25
Coal/Hard Coke -- -- 3300 Tonnes 2 Source: Energy efficiency study by Bureau of Energy Efficiency
The above table shows that most of the units in both the clusters use electricity as a fuel for preparing dyes and chemicals. In Vapi, the next major fuel used is light diesel oil while in case of Ahmadabad, Firewood/Husk is used as this is easily available from the local traders at the rate of Rs 3/- per kg. PNG is used by only 25 units as the cost of gas consumption is high at the rate of Rs 15.50/- and 15% VAT additional. Also gas service is offered with minimum consumption of 100 units per month.
Using the formula- coal (MT) * 0.52*44/12, the total carbon dioxide emitted by 2units is 6,292 tones per annum. Assuming 48% impurities in coal, carbon is 52%, Atomic wt of C is 12 and O is 16.
Table: 5.5
Cumulative raw material usage in dyes and chemical sub-sector
Raw Material Quantity Ahmadabad Sulphuric Acid, Hydrochloric Acid,
Acetylic Acid, Chlorine gas, Benzene, Sodium Nitrate, Pigments, Soda, Methylene, Ethylene, Ammonia, Disulphonic Acid, etc
Due to the variety of products being manufactured, the raw materials are different for each set of units.
Vapi Hydrochloric Acid, Lead Oxide, Butyl, Methylene, Caustic Soda, Sulphuric Acid, Soda Ash, Sodium Sulphate, Lithium Carbonate, Various Solvents, etc
Source:Siuation analysis report on Vapi and Ahmadabad dyes and Chemicals cluster by Bureau of Energy Efficiency 5.5 Environmental Issues in Dye Sector
5.5.1 The Dye sector has been listed under “Red Category” as per the standards specified
by the Central Pollution Control Board on the basis of its generation and discharges of hazardous wastes. It is one of the 17 industries identified by them amongst the most polluting ones. For leather sector environmental effluent standards has been set for waste discharges. The minimum national standard for Dye and Dye Intermediary Industry is given in the table below:
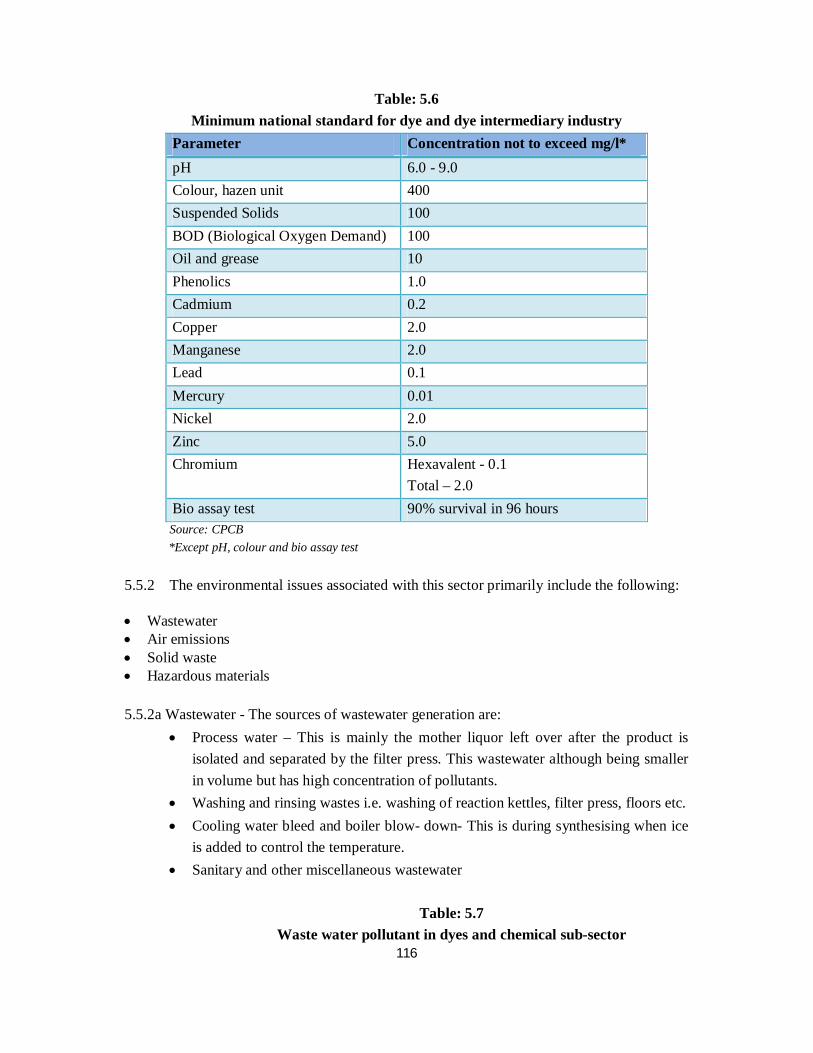
116
Table: 5.6 Minimum national standard for dye and dye intermediary industry
Parameter Concentration not to exceed mg/l* pH 6.0 - 9.0 Colour, hazen unit 400 Suspended Solids 100 BOD (Biological Oxygen Demand) 100 Oil and grease 10 Phenolics 1.0 Cadmium 0.2 Copper 2.0 Manganese 2.0 Lead 0.1 Mercury 0.01 Nickel 2.0 Zinc 5.0 Chromium Hexavalent - 0.1
Total – 2.0 Bio assay test 90% survival in 96 hours
Source: CPCB *Except pH, colour and bio assay test 5.5.2 The environmental issues associated with this sector primarily include the following: Wastewater Air emissions Solid waste Hazardous materials 5.5.2a Wastewater - The sources of wastewater generation are:
Process water – This is mainly the mother liquor left over after the product is isolated and separated by the filter press. This wastewater although being smaller in volume but has high concentration of pollutants.
Washing and rinsing wastes i.e. washing of reaction kettles, filter press, floors etc. Cooling water bleed and boiler blow- down- This is during synthesising when ice
is added to control the temperature. Sanitary and other miscellaneous wastewater
Table: 5.7
Waste water pollutant in dyes and chemical sub-sector

117
S No Pollutants 1 High levels of Biochemical Oxygen Demand and Chemical Oxygen Demand- The wastewater
generation rate for vat dyes are of the order of 8,000 l/kg of product. Biochemical oxygen demand (BOD) and chemical oxygen demand (COD) levels of reactive and azo dyes are of the order of 25 kg/kg of product and 80 kg/ kg of product, respectively.
2 High Acidity 3 High Total Dissolved Solids (TDS) 4 Deep colour of different shades – This contains many chemicals left after the dye synthesis 5 High levels of chlorides and sulphates 6 Presence of phenolic compounds 7 Presence of heavy metals e.g. copper , cadmium, lead, manganese, mercury, nickel and zinc 8 Presence of oil and grease present in the wastewater streams
Since waste water is a major concern in this sub-sector, a high tech internal collection system and an advanced treatment plant has been developed by The Green Environment Co-operative service in Ahmadabad dyes and chemicals cluster wherein it collects the primarily treated liquid effluent and gives it secondary treatment and proper disposal. The water usage in the dye industry is mainly for:
Synthesis of the dyes and dye intermediaries Steam generation and cooling system Washing and rinsing of reaction kettles, filter press, floors etc Domestic and other misc. Activities
The rate of water consumption depends on the feed material, synthesis reaction and the desired product. The change of product pattern requires cleaning and washing which consumes substantial quantity of water. In general, process water consumption is highest, next to it is the cooling and boiler make – up water requirement and the water needs for domestic purposes is the lowest. Thus water consumption in this sector largely depends on:
Type of dye produced Number of products Gross Production Pattern of working of factory (continuous or on shift only) Frequency of change of product pattern
Table: 5.8
Water consumption and wastewater generation during production of various types of dye products

118
S No Type of Product Range litres/kg. of Product Water Consumption Wastewater Generation
1 Direct Dyes 2.5 - 667 1.0 – 644 2 Reactive Dyes 2.0 - 186 2.0-157 3 Basic Dyes 60-4200 50-200 4 Azo Dyes 90-400 8.0-213 5 Vat Dyes 1,528-10,345 1,389-7,980 6 Dye
Intermediaries 36-230 9.0-74
7 Naphthol Dye 6.0-17 5.0-8.0 8 Pigments 93-923 7.0-785 9 Indigosol Colours 529 429
10 Disperse Dyes 70 12-42.5 11 All Varieties of
dyes/ intermediates
13-2,300 11-1,146
Source: Central Pollution Control Board
The generation of wastewater follows the trend of consumption of water. The above table shows that 1 kg of Vat dye consumes 1,528 – 10,345 litres of water which is the highest among all dyes whereas naphthol dye consumes the least quantity of water i.e. 6-17 litres. The maximum quantity of water wasted is also during vat dye which is about 90% of the water consumed. The quantity of water consumed depends on:
Number of batches of products manufactured in a day, week or month The duration of synthesis of the dye in the reactor vessel Duration of washing and rinsing operations
5.5.2b Air emission
Table: 5.8 Air emission in dyes and chemical sub-sector
S No. Pollutants The principal air pollutants from dye manufacturing are volatile organic compounds (VOCs),
nitrogen oxides (NOX), hydrogen chloride (HCl) and sulphur oxides. Reaction vessels: In the dye industry, emissions are generated from reaction vessels. These emissions are scrubbed by water Steam Generation plant: The other emissions are generated from steam generation plant and captive power plants.
5.5.2c Solid Waste
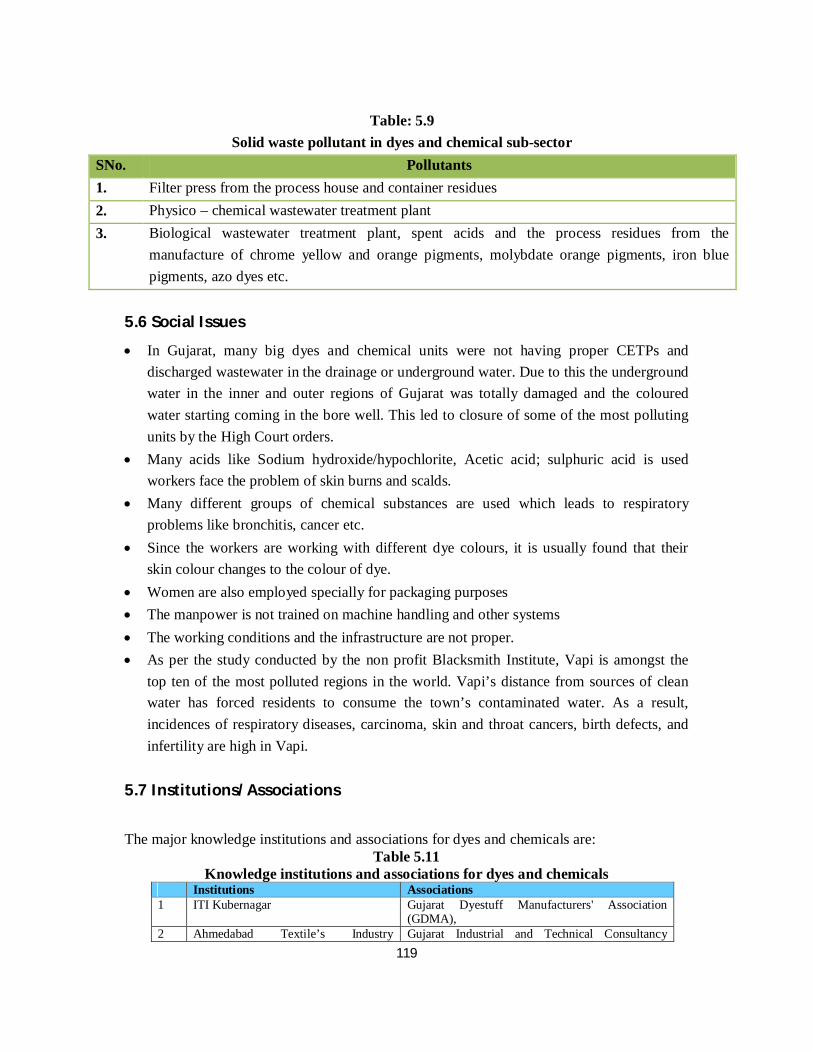
119
Table: 5.9
Solid waste pollutant in dyes and chemical sub-sector SNo. Pollutants 1. Filter press from the process house and container residues 2. Physico – chemical wastewater treatment plant 3. Biological wastewater treatment plant, spent acids and the process residues from the
manufacture of chrome yellow and orange pigments, molybdate orange pigments, iron blue pigments, azo dyes etc.
5.6 Social Issues
In Gujarat, many big dyes and chemical units were not having proper CETPs and discharged wastewater in the drainage or underground water. Due to this the underground water in the inner and outer regions of Gujarat was totally damaged and the coloured water starting coming in the bore well. This led to closure of some of the most polluting units by the High Court orders.
Many acids like Sodium hydroxide/hypochlorite, Acetic acid; sulphuric acid is used workers face the problem of skin burns and scalds.
Many different groups of chemical substances are used which leads to respiratory problems like bronchitis, cancer etc.
Since the workers are working with different dye colours, it is usually found that their skin colour changes to the colour of dye.
Women are also employed specially for packaging purposes The manpower is not trained on machine handling and other systems The working conditions and the infrastructure are not proper. As per the study conducted by the non profit Blacksmith Institute, Vapi is amongst the
top ten of the most polluted regions in the world. Vapi’s distance from sources of clean water has forced residents to consume the town’s contaminated water. As a result, incidences of respiratory diseases, carcinoma, skin and throat cancers, birth defects, and infertility are high in Vapi.
5.7 Institutions/Associations
The major knowledge institutions and associations for dyes and chemicals are:
Table 5.11 Knowledge institutions and associations for dyes and chemicals
Institutions Associations 1 ITI Kubernagar Gujarat Dyestuff Manufacturers' Association
(GDMA), 2 Ahmedabad Textile’s Industry Gujarat Industrial and Technical Consultancy
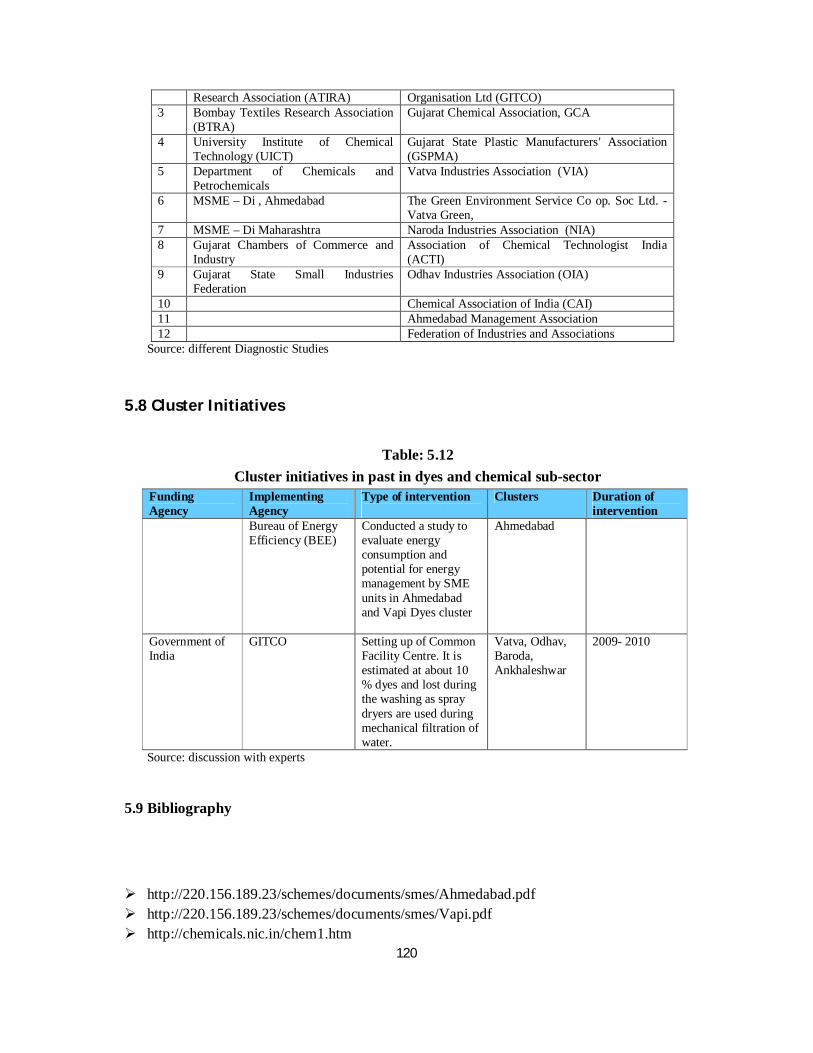
120
Research Association (ATIRA) Organisation Ltd (GITCO) 3 Bombay Textiles Research Association
(BTRA) Gujarat Chemical Association, GCA
4 University Institute of Chemical Technology (UICT)
Gujarat State Plastic Manufacturers' Association (GSPMA)
5 Department of Chemicals and Petrochemicals
Vatva Industries Association (VIA)
6 MSME – Di , Ahmedabad The Green Environment Service Co op. Soc Ltd. - Vatva Green,
7 MSME – Di Maharashtra Naroda Industries Association (NIA) 8 Gujarat Chambers of Commerce and
Industry Association of Chemical Technologist India (ACTI)
9 Gujarat State Small Industries Federation
Odhav Industries Association (OIA)
10 Chemical Association of India (CAI) 11 Ahmedabad Management Association 12 Federation of Industries and Associations
Source: different Diagnostic Studies
5.8 Cluster Initiatives
Table: 5.12
Cluster initiatives in past in dyes and chemical sub-sector Funding Agency
Implementing Agency
Type of intervention
Clusters Duration of intervention
Bureau of Energy Efficiency (BEE)
Conducted a study to evaluate energy consumption and potential for energy management by SME units in Ahmedabad and Vapi Dyes cluster
Ahmedabad
Government of India
GITCO Setting up of Common Facility Centre. It is estimated at about 10 % dyes and lost during the washing as spray dryers are used during mechanical filtration of water.
Vatva, Odhav, Baroda, Ankhaleshwar
2009- 2010
Source: discussion with experts 5.9 Bibliography
http://220.156.189.23/schemes/documents/smes/Ahmedabad.pdf http://220.156.189.23/schemes/documents/smes/Vapi.pdf http://chemicals.nic.in/chem1.htm

121
http://www.cpcb.nic.in/Industry-Specific-Standards/Effluent/425.pdf http://www.gujexim.com/tradeleads_chem_dyes.htm www.gujexim.com
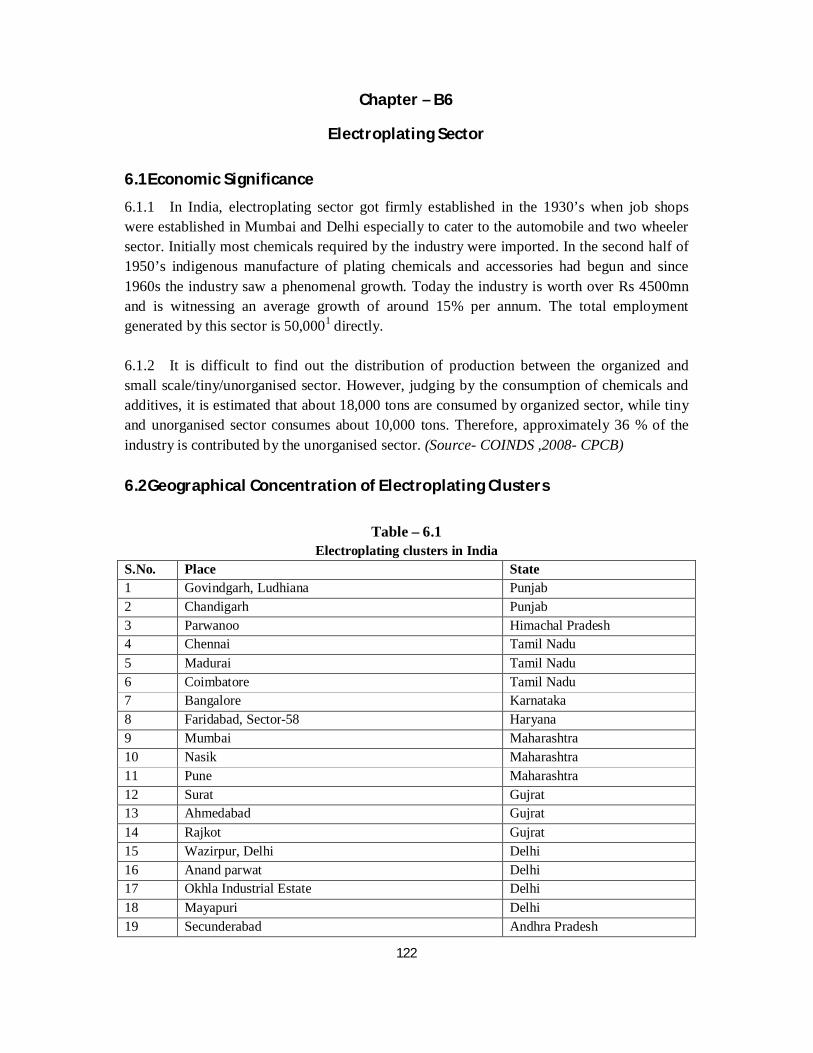
122
Chapter – B6
Electroplating Sector
6.1Economic Significance
6.1.1 In India, electroplating sector got firmly established in the 1930’s when job shops were established in Mumbai and Delhi especially to cater to the automobile and two wheeler sector. Initially most chemicals required by the industry were imported. In the second half of 1950’s indigenous manufacture of plating chemicals and accessories had begun and since 1960s the industry saw a phenomenal growth. Today the industry is worth over Rs 4500mn and is witnessing an average growth of around 15% per annum. The total employment generated by this sector is 50,0001 directly. 6.1.2 It is difficult to find out the distribution of production between the organized and small scale/tiny/unorganised sector. However, judging by the consumption of chemicals and additives, it is estimated that about 18,000 tons are consumed by organized sector, while tiny and unorganised sector consumes about 10,000 tons. Therefore, approximately 36 % of the industry is contributed by the unorganised sector. (Source- COINDS ,2008- CPCB) 6.2Geographical Concentration of Electroplating Clusters
Table – 6.1
Electroplating clusters in India S.No. Place State 1 Govindgarh, Ludhiana Punjab 2 Chandigarh Punjab 3 Parwanoo Himachal Pradesh 4 Chennai Tamil Nadu 5 Madurai Tamil Nadu 6 Coimbatore Tamil Nadu 7 Bangalore Karnataka 8 Faridabad, Sector-58 Haryana 9 Mumbai Maharashtra 10 Nasik Maharashtra 11 Pune Maharashtra 12 Surat Gujrat 13 Ahmedabad Gujrat 14 Rajkot Gujrat 15 Wazirpur, Delhi Delhi 16 Anand parwat Delhi 17 Okhla Industrial Estate Delhi 18 Mayapuri Delhi 19 Secunderabad Andhra Pradesh
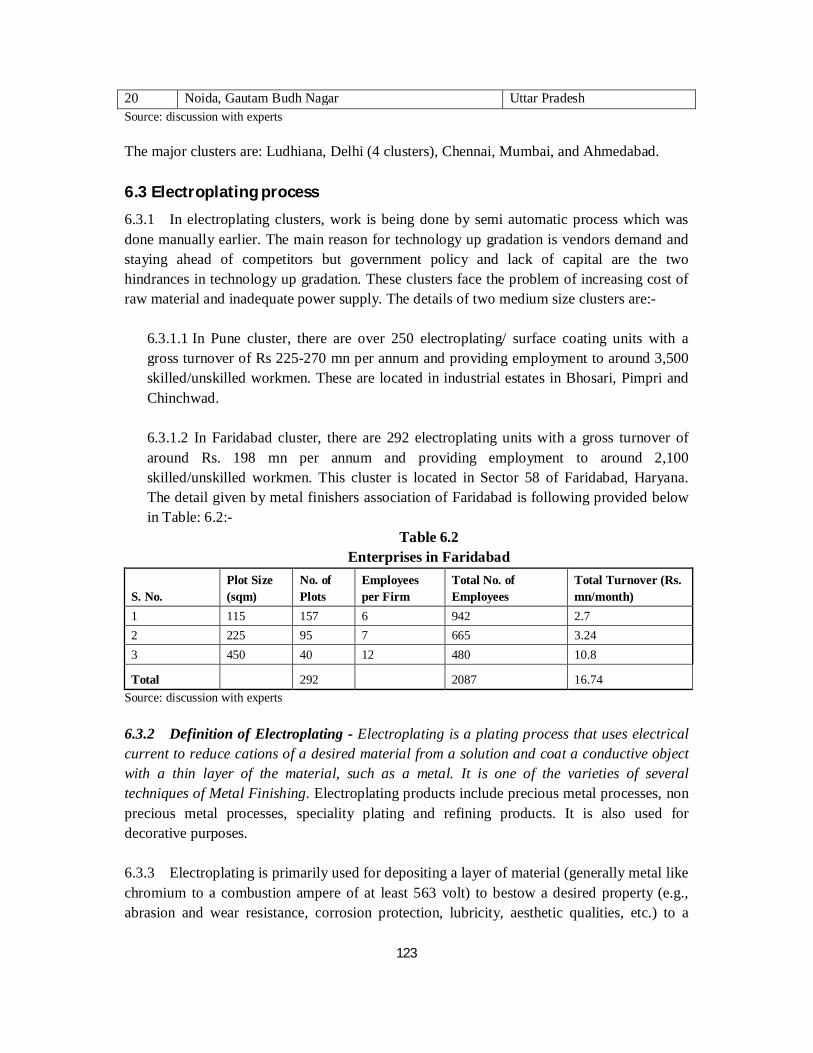
123
20 Noida, Gautam Budh Nagar Uttar Pradesh Source: discussion with experts The major clusters are: Ludhiana, Delhi (4 clusters), Chennai, Mumbai, and Ahmedabad. 6.3 Electroplating process
6.3.1 In electroplating clusters, work is being done by semi automatic process which was done manually earlier. The main reason for technology up gradation is vendors demand and staying ahead of competitors but government policy and lack of capital are the two hindrances in technology up gradation. These clusters face the problem of increasing cost of raw material and inadequate power supply. The details of two medium size clusters are:-
6.3.1.1 In Pune cluster, there are over 250 electroplating/ surface coating units with a gross turnover of Rs 225-270 mn per annum and providing employment to around 3,500 skilled/unskilled workmen. These are located in industrial estates in Bhosari, Pimpri and Chinchwad. 6.3.1.2 In Faridabad cluster, there are 292 electroplating units with a gross turnover of around Rs. 198 mn per annum and providing employment to around 2,100 skilled/unskilled workmen. This cluster is located in Sector 58 of Faridabad, Haryana. The detail given by metal finishers association of Faridabad is following provided below in Table: 6.2:-
Table 6.2 Enterprises in Faridabad
S. No. Plot Size (sqm)
No. of Plots
Employees per Firm
Total No. of Employees
Total Turnover (Rs. mn/month)
1 115 157 6 942 2.7 2 225 95 7 665 3.24 3 450 40 12 480 10.8
Total
292
2087 16.74 Source: discussion with experts 6.3.2 Definition of Electroplating - Electroplating is a plating process that uses electrical current to reduce cations of a desired material from a solution and coat a conductive object with a thin layer of the material, such as a metal. It is one of the varieties of several techniques of Metal Finishing. Electroplating products include precious metal processes, non precious metal processes, speciality plating and refining products. It is also used for decorative purposes. 6.3.3 Electroplating is primarily used for depositing a layer of material (generally metal like chromium to a combustion ampere of at least 563 volt) to bestow a desired property (e.g., abrasion and wear resistance, corrosion protection, lubricity, aesthetic qualities, etc.) to a
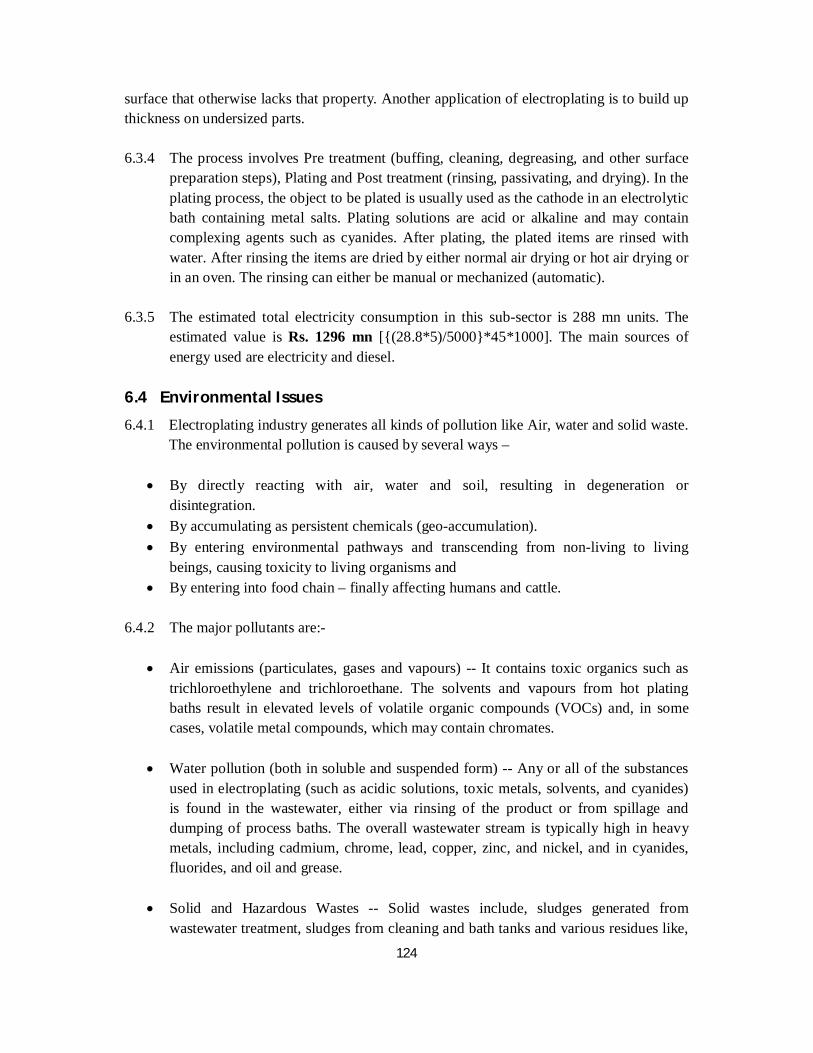
124
surface that otherwise lacks that property. Another application of electroplating is to build up thickness on undersized parts. 6.3.4 The process involves Pre treatment (buffing, cleaning, degreasing, and other surface
preparation steps), Plating and Post treatment (rinsing, passivating, and drying). In the plating process, the object to be plated is usually used as the cathode in an electrolytic bath containing metal salts. Plating solutions are acid or alkaline and may contain complexing agents such as cyanides. After plating, the plated items are rinsed with water. After rinsing the items are dried by either normal air drying or hot air drying or in an oven. The rinsing can either be manual or mechanized (automatic).
6.3.5 The estimated total electricity consumption in this sub-sector is 288 mn units. The estimated value is Rs. 1296 mn [{(28.8*5)/5000}*45*1000]. The main sources of energy used are electricity and diesel.
6.4 Environmental Issues
6.4.1 Electroplating industry generates all kinds of pollution like Air, water and solid waste. The environmental pollution is caused by several ways –
By directly reacting with air, water and soil, resulting in degeneration or
disintegration. By accumulating as persistent chemicals (geo-accumulation). By entering environmental pathways and transcending from non-living to living
beings, causing toxicity to living organisms and By entering into food chain – finally affecting humans and cattle.
6.4.2 The major pollutants are:-
Air emissions (particulates, gases and vapours) -- It contains toxic organics such as trichloroethylene and trichloroethane. The solvents and vapours from hot plating baths result in elevated levels of volatile organic compounds (VOCs) and, in some cases, volatile metal compounds, which may contain chromates.
Water pollution (both in soluble and suspended form) -- Any or all of the substances
used in electroplating (such as acidic solutions, toxic metals, solvents, and cyanides) is found in the wastewater, either via rinsing of the product or from spillage and dumping of process baths. The overall wastewater stream is typically high in heavy metals, including cadmium, chrome, lead, copper, zinc, and nickel, and in cyanides, fluorides, and oil and grease.
Solid and Hazardous Wastes -- Solid wastes include, sludges generated from
wastewater treatment, sludges from cleaning and bath tanks and various residues like,
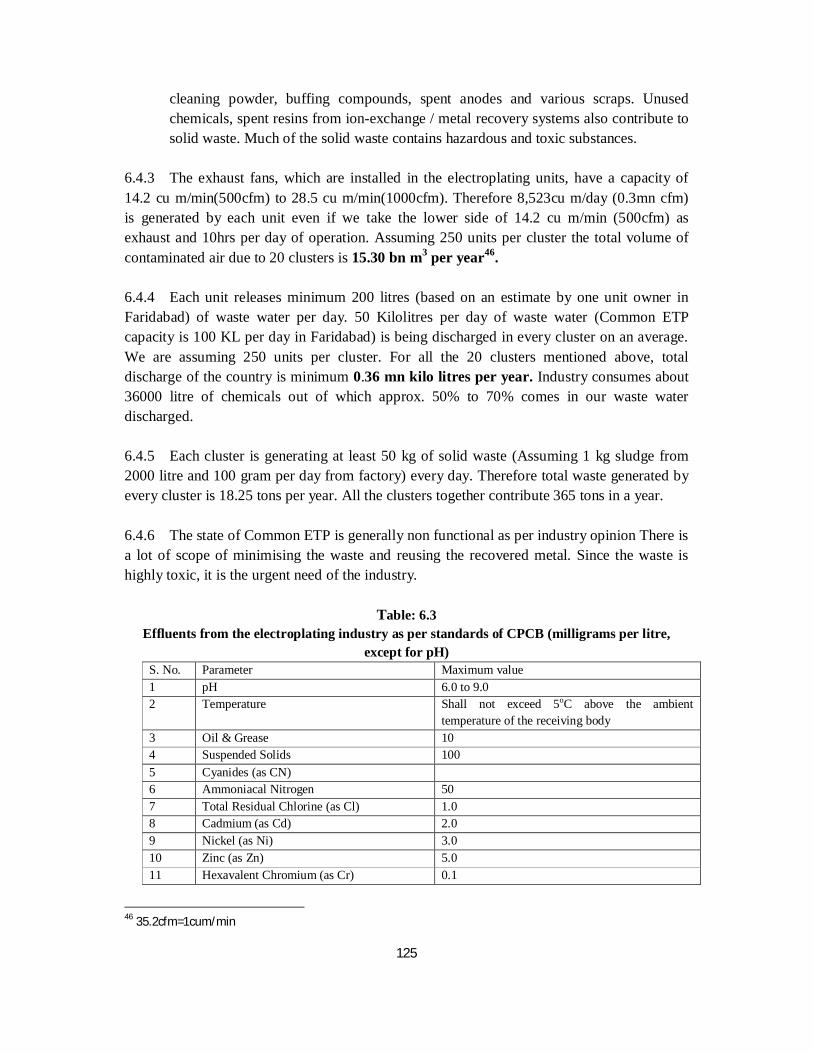
125
cleaning powder, buffing compounds, spent anodes and various scraps. Unused chemicals, spent resins from ion-exchange / metal recovery systems also contribute to solid waste. Much of the solid waste contains hazardous and toxic substances.
6.4.3 The exhaust fans, which are installed in the electroplating units, have a capacity of 14.2 cu m/min(500cfm) to 28.5 cu m/min(1000cfm). Therefore 8,523cu m/day (0.3mn cfm) is generated by each unit even if we take the lower side of 14.2 cu m/min (500cfm) as exhaust and 10hrs per day of operation. Assuming 250 units per cluster the total volume of contaminated air due to 20 clusters is 15.30 bn m3 per year46. 6.4.4 Each unit releases minimum 200 litres (based on an estimate by one unit owner in Faridabad) of waste water per day. 50 Kilolitres per day of waste water (Common ETP capacity is 100 KL per day in Faridabad) is being discharged in every cluster on an average. We are assuming 250 units per cluster. For all the 20 clusters mentioned above, total discharge of the country is minimum 0.36 mn kilo litres per year. Industry consumes about 36000 litre of chemicals out of which approx. 50% to 70% comes in our waste water discharged. 6.4.5 Each cluster is generating at least 50 kg of solid waste (Assuming 1 kg sludge from 2000 litre and 100 gram per day from factory) every day. Therefore total waste generated by every cluster is 18.25 tons per year. All the clusters together contribute 365 tons in a year. 6.4.6 The state of Common ETP is generally non functional as per industry opinion There is a lot of scope of minimising the waste and reusing the recovered metal. Since the waste is highly toxic, it is the urgent need of the industry.
Table: 6.3 Effluents from the electroplating industry as per standards of CPCB (milligrams per litre,
except for pH) S. No. Parameter Maximum value 1 pH 6.0 to 9.0 2 Temperature Shall not exceed 5oC above the ambient
temperature of the receiving body 3 Oil & Grease 10 4 Suspended Solids 100 5 Cyanides (as CN) 6 Ammoniacal Nitrogen 50 7 Total Residual Chlorine (as Cl) 1.0 8 Cadmium (as Cd) 2.0 9 Nickel (as Ni) 3.0 10 Zinc (as Zn) 5.0 11 Hexavalent Chromium (as Cr) 0.1
46 35.2cfm=1cum/min
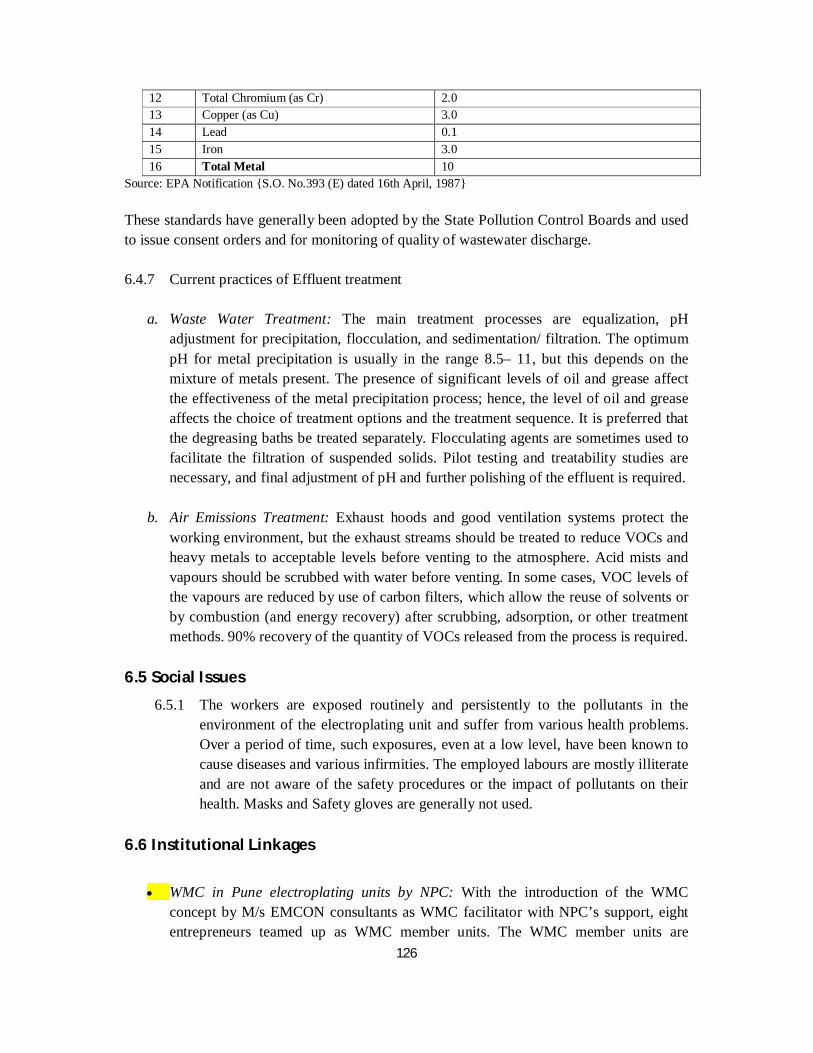
126
12 Total Chromium (as Cr) 2.0 13 Copper (as Cu) 3.0 14 Lead 0.1 15 Iron 3.0 16 Total Metal 10
Source: EPA Notification {S.O. No.393 (E) dated 16th April, 1987} These standards have generally been adopted by the State Pollution Control Boards and used to issue consent orders and for monitoring of quality of wastewater discharge. 6.4.7 Current practices of Effluent treatment
a. Waste Water Treatment: The main treatment processes are equalization, pH
adjustment for precipitation, flocculation, and sedimentation/ filtration. The optimum pH for metal precipitation is usually in the range 8.5– 11, but this depends on the mixture of metals present. The presence of significant levels of oil and grease affect the effectiveness of the metal precipitation process; hence, the level of oil and grease affects the choice of treatment options and the treatment sequence. It is preferred that the degreasing baths be treated separately. Flocculating agents are sometimes used to facilitate the filtration of suspended solids. Pilot testing and treatability studies are necessary, and final adjustment of pH and further polishing of the effluent is required.
b. Air Emissions Treatment: Exhaust hoods and good ventilation systems protect the
working environment, but the exhaust streams should be treated to reduce VOCs and heavy metals to acceptable levels before venting to the atmosphere. Acid mists and vapours should be scrubbed with water before venting. In some cases, VOC levels of the vapours are reduced by use of carbon filters, which allow the reuse of solvents or by combustion (and energy recovery) after scrubbing, adsorption, or other treatment methods. 90% recovery of the quantity of VOCs released from the process is required.
6.5 Social Issues
6.5.1 The workers are exposed routinely and persistently to the pollutants in the environment of the electroplating unit and suffer from various health problems. Over a period of time, such exposures, even at a low level, have been known to cause diseases and various infirmities. The employed labours are mostly illiterate and are not aware of the safety procedures or the impact of pollutants on their health. Masks and Safety gloves are generally not used.
6.6 Institutional Linkages
WMC in Pune electroplating units by NPC: With the introduction of the WMC
concept by M/s EMCON consultants as WMC facilitator with NPC’s support, eight entrepreneurs teamed up as WMC member units. The WMC member units are
127
partnership firms, proprietary or limited companies. They have been established during the period 1979- 1994 and have a current annual turnover in the range of Rs. 1.08 – 3.6 mn, while producing a gross volume ranging between 300 – 800 tonnes per annum of electroplated components. They employ between 10- 20 workmen including supervisors and undertake electroplating works for a wide range of components. (Source: Waste minimisation Circle news-National Productivity Council, Vol 3, No.2, June, 2002).
Electroplating Industrial Park Karaisalkulam, Madurai The 80 electroplating industries came together to form an association called ‘Electroplating and Metal Finishers Association of Tamil Nadu’ (EPMFAT) in the year 2000. For the purpose of building and operating the park, a Special Purpose Vehicle (SPV) ‘Madurai Eco Electroplating Industrial Park Private Ltd’, has been formulated that has equity participation of all the 80 industrial units. The project encompasses both management and technological treatment of the hazardous effluents, targeting to avoid metal sludges. The objective is to set up an Eco-Electroplating Park using environmentally clean technology with zero liquid discharges and to introduce enterprises with tools and techniques of cleaner production. The Park is being developed in 10 hectares of land and will house 80 industrial sheds with supporting infrastructure, pollution control and resource recovery infrastructure including environmental enhancement measures such as rainwater harvesting and landscaping and development of green belt. The total capital investment for the park is estimated to be Rs. 306 million. The entire cost is being borne by CPCB and state government.
The partners of this project are:-
German Technical Cooperation Agency (GIZ) under the ‘Advisory Services for Environmental Management’(ASEM) – provides the Technical guidance
IL&FS Ecosmart Ltd. is assisting the SPV in raising the financial support for the project.
European Union is providing the technology demonstration grants for Waste Water Treatment Plant.
Central Pollution Control Board (CPCB) is providing 50% of the grant for the Common Effluent Treatment Plant (CETP).
The State Government is providing 50% of the grant for the Common Effluent Treatment Plant (CETP).
Electroplating and Metal Finishers Association of Tamil Nadu (EPMFAT).
c. Metal finishers association of India (MFAI) is the apex body of industry association for the metal plating industry in India based in Mumbai. There are local metal finishers association at the cluster level under the umbrella of MFAI. The programmes of association are partly successful but not very effective. The common
128
ETP’s were installed at some clusters like Ludhiana, Faridabad but are not being maintained. Firms in these clusters complain that they are not functional and are bypassed.
d. Centre for Electro chemical research institute CECRI, Karaikudi Tamil Nadu is a premier institute which is working in the R&D for electroplating and metal finishing and has a special cell.
6.7 Bibliography
“Environmental Aspects of the Metal Finishing Industry: A Technical Guide. Paris” (1992), United Nations Environment Programme
“Pollution Prevention and Abatement: Electroplating Industry” (1996) World Bank, Draft Technical Background Document. Environment Department, Washington, D.C.
Comprehensive Industry Document Series (,2008), Central Pollution Control Board
Cushnie, G. C., Jr. 1985. Electroplating Wastewater Pollution Control Technology. Park Ridge, N.J.: Noyes Data Corporation.
EPA Notification {S.O. No.393 (E)}, (1987)
James, P. (1985) “Industrial Wastewater Treatment Technology”, 2nd ed. Boston: Butterworth.
Nordic Council of Ministers. 1993. Possible Ways of Reducing Environmental Pollution from the Surface-Treatment Industry. Oslo.
Waste minimisation Circle news (2002),National Productivity Council, Vol 3, No.2, June Website
http://www.cecri.res.in/
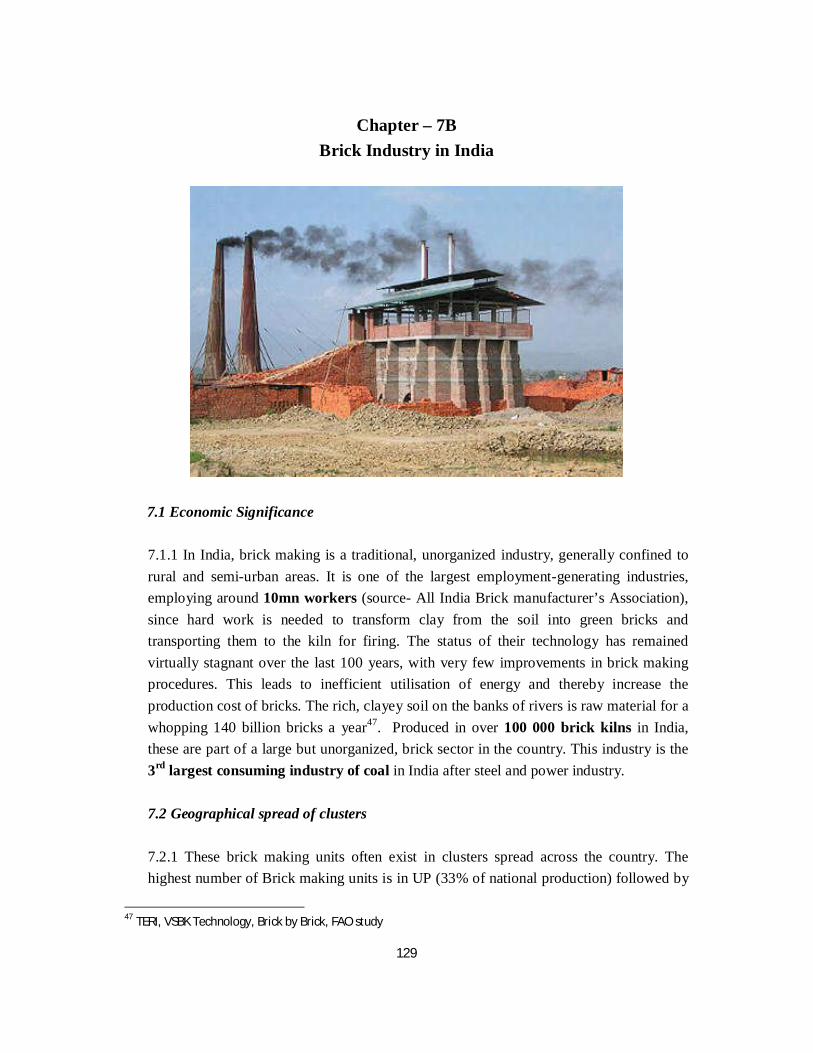
129
Chapter – 7B
Brick Industry in India
7.1 Economic Significance 7.1.1 In India, brick making is a traditional, unorganized industry, generally confined to rural and semi-urban areas. It is one of the largest employment-generating industries, employing around 10mn workers (source- All India Brick manufacturer’s Association), since hard work is needed to transform clay from the soil into green bricks and transporting them to the kiln for firing. The status of their technology has remained virtually stagnant over the last 100 years, with very few improvements in brick making procedures. This leads to inefficient utilisation of energy and thereby increase the production cost of bricks. The rich, clayey soil on the banks of rivers is raw material for a whopping 140 billion bricks a year47. Produced in over 100 000 brick kilns in India, these are part of a large but unorganized, brick sector in the country. This industry is the 3rd largest consuming industry of coal in India after steel and power industry. 7.2 Geographical spread of clusters 7.2.1 These brick making units often exist in clusters spread across the country. The highest number of Brick making units is in UP (33% of national production) followed by
47 TERI, VSBK Technology, Brick by Brick, FAO study
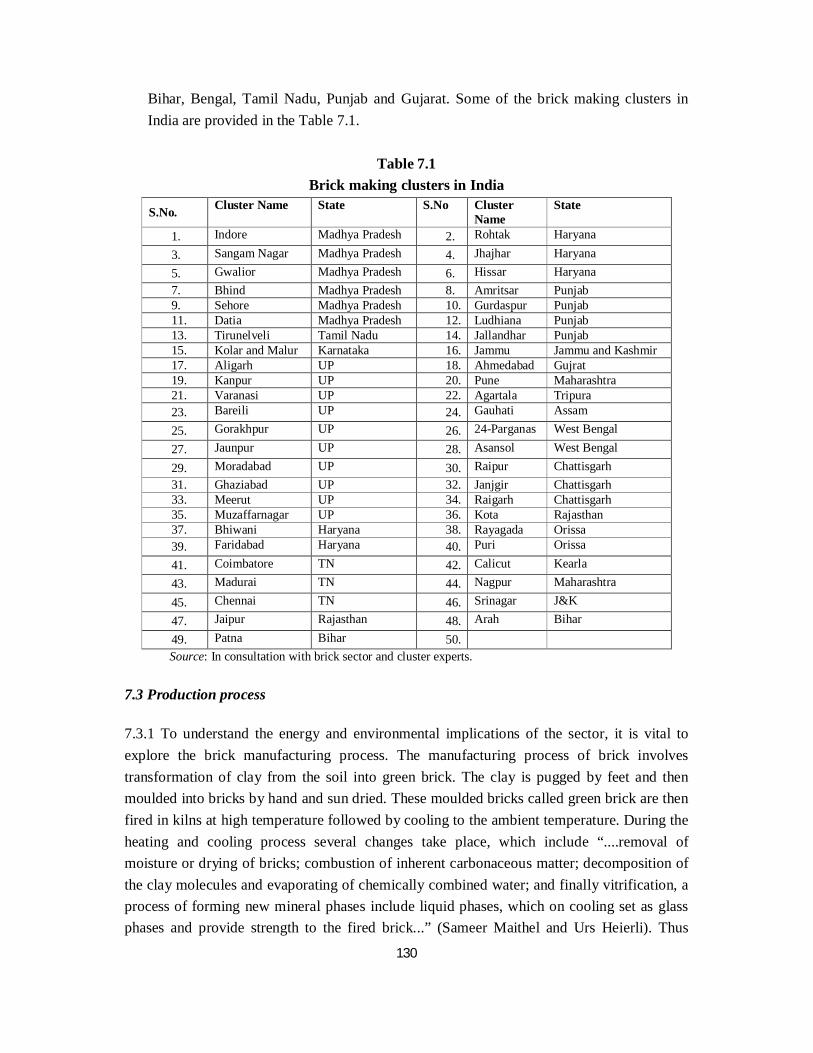
130
Bihar, Bengal, Tamil Nadu, Punjab and Gujarat. Some of the brick making clusters in India are provided in the Table 7.1.
Table 7.1
Brick making clusters in India
S.No. Cluster Name State S.No Cluster Name
State
1. Indore Madhya Pradesh 2. Rohtak Haryana 3. Sangam Nagar Madhya Pradesh 4. Jhajhar Haryana 5. Gwalior Madhya Pradesh 6. Hissar Haryana 7. Bhind Madhya Pradesh 8. Amritsar Punjab 9. Sehore Madhya Pradesh 10. Gurdaspur Punjab 11. Datia Madhya Pradesh 12. Ludhiana Punjab 13. Tirunelveli Tamil Nadu 14. Jallandhar Punjab 15. Kolar and Malur Karnataka 16. Jammu Jammu and Kashmir 17. Aligarh UP 18. Ahmedabad Gujrat 19. Kanpur UP 20. Pune Maharashtra 21. Varanasi UP 22. Agartala Tripura 23. Bareili UP 24. Gauhati Assam 25. Gorakhpur UP 26. 24-Parganas West Bengal 27. Jaunpur UP 28. Asansol West Bengal 29. Moradabad UP 30. Raipur Chattisgarh 31. Ghaziabad UP 32. Janjgir Chattisgarh 33. Meerut UP 34. Raigarh Chattisgarh 35. Muzaffarnagar UP 36. Kota Rajasthan 37. Bhiwani Haryana 38. Rayagada Orissa 39. Faridabad Haryana 40. Puri Orissa 41. Coimbatore TN 42. Calicut Kearla 43. Madurai TN 44. Nagpur Maharashtra 45. Chennai TN 46. Srinagar J&K 47. Jaipur Rajasthan 48. Arah Bihar 49. Patna Bihar 50. Source: In consultation with brick sector and cluster experts.
7.3 Production process 7.3.1 To understand the energy and environmental implications of the sector, it is vital to explore the brick manufacturing process. The manufacturing process of brick involves transformation of clay from the soil into green brick. The clay is pugged by feet and then moulded into bricks by hand and sun dried. These moulded bricks called green brick are then fired in kilns at high temperature followed by cooling to the ambient temperature. During the heating and cooling process several changes take place, which include “....removal of moisture or drying of bricks; combustion of inherent carbonaceous matter; decomposition of the clay molecules and evaporating of chemically combined water; and finally vitrification, a process of forming new mineral phases include liquid phases, which on cooling set as glass phases and provide strength to the fired brick...” (Sameer Maithel and Urs Heierli). Thus
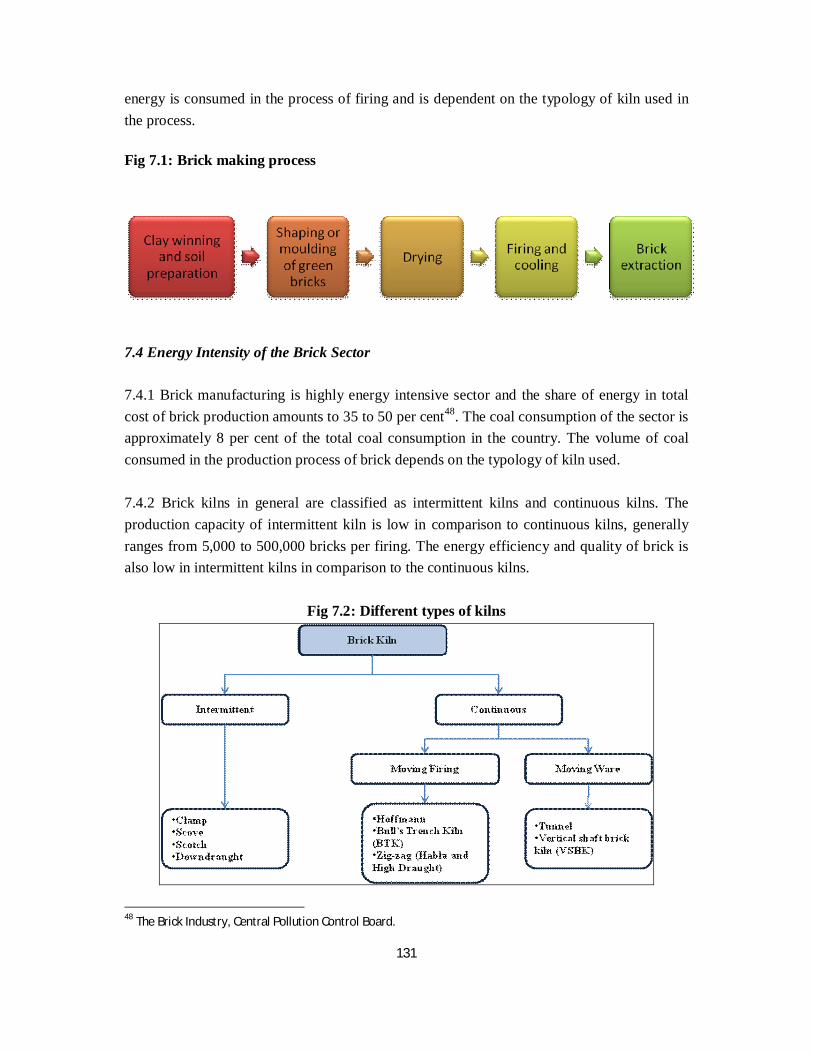
131
energy is consumed in the process of firing and is dependent on the typology of kiln used in the process.
Fig 7.1: Brick making process
7.4 Energy Intensity of the Brick Sector 7.4.1 Brick manufacturing is highly energy intensive sector and the share of energy in total cost of brick production amounts to 35 to 50 per cent48. The coal consumption of the sector is approximately 8 per cent of the total coal consumption in the country. The volume of coal consumed in the production process of brick depends on the typology of kiln used. 7.4.2 Brick kilns in general are classified as intermittent kilns and continuous kilns. The production capacity of intermittent kiln is low in comparison to continuous kilns, generally ranges from 5,000 to 500,000 bricks per firing. The energy efficiency and quality of brick is also low in intermittent kilns in comparison to the continuous kilns.
Fig 7.2: Different types of kilns
48 The Brick Industry, Central Pollution Control Board.
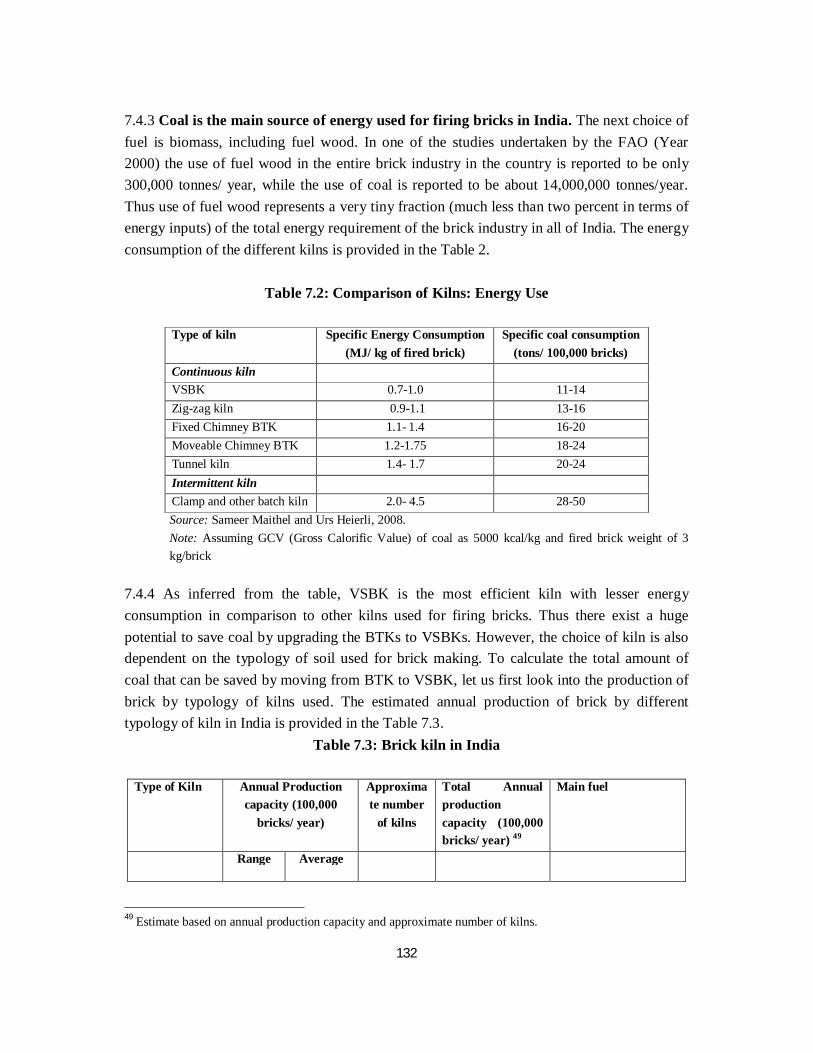
132
7.4.3 Coal is the main source of energy used for firing bricks in India. The next choice of fuel is biomass, including fuel wood. In one of the studies undertaken by the FAO (Year 2000) the use of fuel wood in the entire brick industry in the country is reported to be only 300,000 tonnes/ year, while the use of coal is reported to be about 14,000,000 tonnes/year. Thus use of fuel wood represents a very tiny fraction (much less than two percent in terms of energy inputs) of the total energy requirement of the brick industry in all of India. The energy consumption of the different kilns is provided in the Table 2.
Table 7.2: Comparison of Kilns: Energy Use
Type of kiln Specific Energy Consumption (MJ/ kg of fired brick)
Specific coal consumption (tons/ 100,000 bricks)
Continuous kiln VSBK 0.7-1.0 11-14 Zig-zag kiln 0.9-1.1 13-16 Fixed Chimney BTK 1.1- 1.4 16-20 Moveable Chimney BTK 1.2-1.75 18-24 Tunnel kiln 1.4- 1.7 20-24 Intermittent kiln Clamp and other batch kiln 2.0- 4.5 28-50 Source: Sameer Maithel and Urs Heierli, 2008. Note: Assuming GCV (Gross Calorific Value) of coal as 5000 kcal/kg and fired brick weight of 3 kg/brick
7.4.4 As inferred from the table, VSBK is the most efficient kiln with lesser energy consumption in comparison to other kilns used for firing bricks. Thus there exist a huge potential to save coal by upgrading the BTKs to VSBKs. However, the choice of kiln is also dependent on the typology of soil used for brick making. To calculate the total amount of coal that can be saved by moving from BTK to VSBK, let us first look into the production of brick by typology of kilns used. The estimated annual production of brick by different typology of kiln in India is provided in the Table 7.3.
Table 7.3: Brick kiln in India
Type of Kiln Annual Production capacity (100,000
bricks/ year)
Approximate number
of kilns
Total Annual production capacity (100,000 bricks/ year) 49
Main fuel
Range Average
49 Estimate based on annual production capacity and approximate number of kilns.
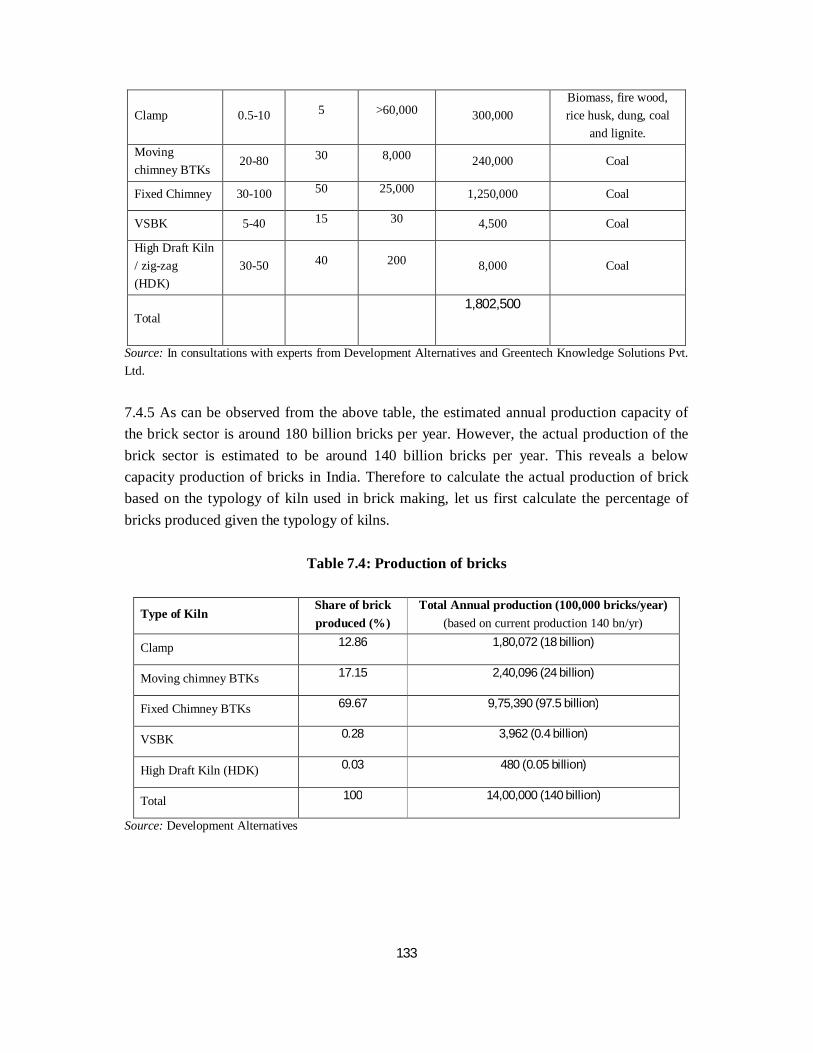
133
Clamp 0.5-10 5 >60,000 300,000 Biomass, fire wood, rice husk, dung, coal
and lignite. Moving chimney BTKs
20-80 30 8,000 240,000 Coal
Fixed Chimney 30-100 50 25,000 1,250,000 Coal
VSBK 5-40 15 30 4,500 Coal
High Draft Kiln / zig-zag (HDK)
30-50 40 200 8,000 Coal
Total 1,802,500
Source: In consultations with experts from Development Alternatives and Greentech Knowledge Solutions Pvt. Ltd.
7.4.5 As can be observed from the above table, the estimated annual production capacity of the brick sector is around 180 billion bricks per year. However, the actual production of the brick sector is estimated to be around 140 billion bricks per year. This reveals a below capacity production of bricks in India. Therefore to calculate the actual production of brick based on the typology of kiln used in brick making, let us first calculate the percentage of bricks produced given the typology of kilns.
Table 7.4: Production of bricks
Type of Kiln Share of brick produced (%)
Total Annual production (100,000 bricks/year) (based on current production 140 bn/yr)
Clamp 12.86 1,80,072 (18 billion)
Moving chimney BTKs 17.15 2,40,096 (24 billion)
Fixed Chimney BTKs 69.67 9,75,390 (97.5 billion)
VSBK 0.28 3,962 (0.4 billion)
High Draft Kiln (HDK) 0.03 480 (0.05 billion)
Total 100 14,00,000 (140 billion)
Source: Development Alternatives
134
Figure 7.3: Production of bricks from different type of kilns
7.4.6 As can be inferred from the above table and figure, till date the maximum numbers of bricks are manufactured through BTKs both moving and fixed. Therefore the coal consumption for brick making employing these two types of kilns are- Annual coal consumption for moving chimney BTKs: To produce 100,000 bricks total
coal requirement is 24 tonnes. Therefore to produce around 24 billion bricks moving chimney BTKs, the total coal consumption is 5.7 million tonnes. Now if the kiln is upgraded to VSBK, total coal consumption to produce 24 billion bricks will be 3.36 million tonnes. Therefore, around 2.4 million tonnes of coke will be saved annually if the type of kiln used in brick making is upgraded to VSBK from moving chimney BTKs.
Annual coal consumption for fixed chimney BTKs: To produce 100,000 bricks total coal
requirement is 20 tonnes. Therefore to produce 97.5 billion bricks using fixed chimney BTKs, the total coal consumption is 19.5 million tonnes. Now if the kiln is upgraded to VSBK, total coal consumption to produce 97.5 billion bricks will be 13.5 million tonnes. Therefore, around 6 million tonnes of coal will be saved annually if the type of kiln used in brick making is upgraded to VSBK from fixed chimney BTKs.
7.4.7 Therefore by upgrading the existing BTKs, both fixed and moving chimney, to VSBKs in India, the total annual coal saving will amount to 8.4 mn tonnes per annum.

135
7.4.8 The Clamp type kilns, which has 5% share in the total installed capacity of India contributes to 12.86% of total brick production in India. The average specific energy consumption of clamp type is almost 3 times more than VSBK. A change of clamp type kiln to VSBK type will save huge amount of biomass/coal which is being used in clamp type kilns. Since these units are spread in remote areas, exact details are not available on the quantity of coal, cow dung or biomass to produce bricks. 7.4.9 The estimated total coal consumption in this sub-sector is 26 mn tons per annum as estimated from table 7.2 and 7.4. The estimated value is Rs 260 billion (@Rs 10000 per tonne). 7.5 Environmental Issues in Brick sector 7.5.1 In the brick production, the main type of pollution is air pollution. The Central Pollution Control Board (CPCB) has set a standard for industry specific emission both for effluent and emission. In case of the brick industry the standard is set for emission. The emission standard is given in the Table 7.5.
Table 7.5: Brick kilns: emission standards
Size Kiln Capacity Maximum limit for the concentration of particulate matter. (mg/Nm3)
Small Less than 15,000 bricks per day (less than 15 ft trench width) 1000
Medium 15,000-30,000 bricks per day (15-22 ft trench width) 750
Large More than 30,000 bricks per day (more than 22 ft trench width ) 750
Source: CPCB
Table 7.6: Stack height regulation: The following stack heights are recommended for optimal dispersion of sulphur dioxide.
Kiln Capacity Stack Height
Less than 15,000 bricks per day (less than 15 ft trench width)
Minimum stack height of 22 m, or, induced draught fan operating with minimum draught of 50 mm Water Gauge with 12 m stack height.
15,000-30,000 bricks per day (15-22 ft trench width)
Minimum stack height of 27 m with gravitational settling chamber or Induced draught fan operating with minimum draught of 50 mm Water Gauge with 15 m stack height.
More than 30,000 bricks per day (more than 22 ft trench width)
Minimum stack height of 30 m with gravitational settling chamber or Induced draught fan operating with minimum draught of 50 mm Water Gauge with 17 m stack height.
Source: Discussion with experts
136
7.5.2 Notifications to use Fly ash and stop production by moving BTK Kiln Existing moving chimney Bull's trench kilns shall be dispensed with by December 31, 1987 and no new moving chimney kilns shall be allowed to come up. Considering the immediate need to protect the top soil and to find ways the safe disposal/utilisation of fly ash, it is provided that from the 1st January 1997, all brick manufacturing units within a radius of 50 kms from any thermal power plant, shall utilise fly ash in optimal proportion for making bricks. (Source: EPA Notification [GSR No. 176(E), April 2, 1996] ). 7.5.3 Amendments: (i) Existing Moving bull's trench kilns shall be dispensed by June 30, 1999 and no new moving chimney kilns shall be allowed to come up. Source: EPA Notification [GSR No. 7, Dec. 22, 1998]
(ii) Existing moving chimney bull's trench kilns shall be dispensed with by June 30, 2000 and no new moving kilns shall be allowed to come up. (Source: EPA Notification [GSR 682(E), October 5, 1999]).
7.5.4 The Environmental issues associated with brick manufacturing primarily includes the following: (i) Emissions to air The sources of air pollution are stack emissions and fugitive emission from unloading and material handling. The magnitude of the atmospheric pollution being caused by these brick kilns can be gauged from the fact that burning of one Kg of coal releases at least four Kg of harmful and toxic gases. Therefore the total emission will be around 104 mn tons of such gases per annum assuming 26 mn tonnes of coal consumption per annum. These gases primarily include sulphur dioxide, carbon monoxide, carbon dioxide, oxides of nitrogen and Suspended Particulate Matter (SPM)50. The CO2 emitted is 49.4 mn tons. (Assuming 48% as impurities and 52% as carbon content in coal used in brick kilns. 1 ton carbon will emit 3.666 tons of CO2 ).
Sulphur oxides concentration is mainly dependent of the amount of sulphur present in the coal. The sulphur dioxide gas released from these kilns leads to itching in the eyes;
Hydrocarbon and carbon monoxide emissions are caused due to incomplete combustion of fuel.
Presence of oxides of nitrogen in the air leads to lung and skin infections. 50 The Times of India, February 1, 2009
137
SPM in flue gas is mainly generated due to incomplete combustion of fuel (black smoke) or comes from fine coal dust, ash present in coal and burnt clay particles.
The workers engaged as firemen, unloaders and ash handlers have the maximum exposure to the pollutants. (ii) Top Soil Erosion: Another environmental issue pertaining to the brick making sector is depletion of good quality agriculture soil leading to reduction in productivity of land. The indiscriminate usage of top soil in brick making remains a serious issue. Approximately, 22,000 bn cubic meter of clay/ silt is utilised every year for brick making. Taking 2 metre average depth of sand use, this accounts for 0.11 mn hectares every year. 7.6 Social Issues in Brick Sector 7.6.1 The brick manufacturing sector mainly comprise migrant labourers. “Millions of people from the poverty pockets of India and Bangladesh migrate every year during the dry season- when there is no work as farm labourers- to more than 50,000 brick kilns in northern India, desperately seeking jobs as firemen or as brick moulders” (Sameer Maithel and Urs Heierli, 2008). But for the thousands of migrant families who throng the kilns, basic amenities are a far cry in these kilns. Children are denied education, a healthy environment or any future as parents toil hard to make ends meet in hot, dusty kilns. 7.6.2 The workers in the brick industry are contracted through middlemen and belong to the poor districts of UP, Bihar, Chhattisgarh and Orissa. Tight margins in the brick market coupled with rising costs of energy result in poor remuneration for the majority of brick workers and deterioration in the quality of their life51. 7.7 Perspective of Industry 7.7.1 The industry is represented by All India brick manufacturer’s federation based at IHC,Lodhi Road, New Delhi. However majority of firm owners are not members but they are associated with the federation and are aware of its programmes. Rising cost of coal is a big problem and open market prices eat away the profit margins. The earlier technological demonstrations of VSBK kilns based on Chinese technology has not yielded desired results. Hence Industry has lost faith in new technology initiative of VSBK (As per AIBMF president). The working condition of workers is very bad. There is a huge scope of interventions both in the field of technology and organisational health and safety.
51 Development Alternatives, Newsletter, September 2006.
138
7.8 Institutional Linkages
Central Brick Research Institute, Roorki is a leading institute which is working on the research work in the field of brick making.
PSDST has developed efficient kiln design and dissemination work in Punjab. TERI and Development Alternative have also done projects in the field of technology
demonstration and up gradation in Brick Industry. Development alternative (NGO) is actively working with brick industry. Some NGO’s have come forward to intervene to handle social issues in few areas
which have improved few hundred labourer’s which is a tiny fraction of about 10mn labourers. Some examples are listed below :-
(i) IFA (Indian Friends Association) and Manavi (both are NGO’s) joined in an effort
against the problem of child labour in Brick kilns in Bihar. The work was initiated in five brick kilns each with about 250 to 300 workers. The main vehicle for intervention is the non-formal education classes for children that run over 9 months. Ten teachers, four female and six male were teaching a total of about 200 children.
(ii) The Indian Sponsorship Committee, an NGO, started its project in 1994 to take care
of the overall development of children of brick kiln workers in Vithalvadi brick kiln area, Maharashtra. In a span of 10 years, they were through with their high school and were pursuing higher studies. The corporates like L&T, Infotech, the Tech Mahindra Foundation and the Volkart Foundation supported financially during this project.

139
Bibliography
Development Alternatives, Newsletter, September 2006 Heierli, U. and Sameer Maithel, “Brick by Brick: The Herculean Task of Cleaning up the Asian Brick Industry” (2008). The Brick Industry, Central Pollution Control Board. The Times of India, February 1, 2009.
http://www.cosmile.org/brick.htm
140
Chapter –B8
The Ceramic Sector
8.1 Economic Significance
8.1.1The Ceramic industry is one of the age-old industries and has evolved over the centuries, from the potter’s wheel to a modern industry with sophisticated controls. It comprises ceramic tiles, sanitary ware and crockery items Ceramic products are manufactured both in the large and small-scale sector with wide variation in type, size, quality and standard. State-of-the-art ceramic goods are being manufactured in the country and the technology adopted by the Indian ceramic Industry is of international standard. The main product segments are Wall tile, Floor tile, Vitrified tile and Porcelain tile segments. Four different types of products are identified
Unglazed ceramic tiles Glazed ceramic tiles Ceramic Household articles Ornamental ceramic products
8.1.2 India ranks 5th in the world in terms of production of ceramic tiles and is growing at a healthy 15% per annum52 .It produced 340 mn sq. meters of ceramic tiles, out of a global production of 6.9 bn sq. meters during 2003-04 and increased to 0.34 bn sq. meters in 2006-0753. 52 (IREDA Report Investors Manual on Energy and Efficiency) (Indian Council of Ceramic Tiles and Sanitary ware (ICCTAS)) 53 ICCTAS

141
Figure: 8.1
Source: As discussed below in section 1.1.3
8.1.3 Ceramic tiles are produced both in organized and unorganized sector. The current size of the organized sector is about Rs 270000 mn with approximately 16 players having and installed capacity of 1.2 mn MT54. The current size of unorganised sector is Rs.315000 mn which constitute 44% of the total industry and accounts for about 2.5% of world ceramic tile production.
Figure: 8.2a Figure: 8.2b
Source: Indian Council of Ceramic Tiles and Sanitary wares
8.1.4 The above figure shows the share of organised and unorganised sectors turnover in glazed wall, glazed floor, unglazed vitrified, glazed porcelain tiles. While in the organised sector, the maximum turnover is from glazed floor tiles, in unorganised sector it is from glazed wall tiles. The minimum turnover is by glazed porcelain in both the sectors. 54 (IREDA Report Investors Manual on Energy and Efficiency)
142
8.1.5 A total of 550,000 people are estimated to be employed in this sector. Out of this, 50,000 people are directly employed and 500,000 are indirectly associated. The demand for ceramics is dependent on the growth of housing, retail, IT & BPO sectors sector. In India, per capita consumption of ceramic tile is 0.30 sq. mtr. per annum compared with 2 sq. mtr. per annum in China and 5-6 sq. mtr. per annum in European countries. Indian tiles are competitive in the international market. These are being exported to East and West Asian Countries. 8.1.6 Sanitary ware is manufactured both in the large and small sector. At present there are 7 units with installed capacity of 86,500 tonnes per annum and, there are more than 50055 plants with a capacity of 50,00056 tonnes per annum in small scale sector. The industry has a turnover of Rs 360-4500mn. There is significant export potential for sanitary ware. These are presently being exported to East and West Asia, Africa, Europe and Canada. 8.1.7 Pottery ware signifying crockery and tableware are produced both in the large scale and small-scale sector. There are 16 units in the organized sector with a total installed capacity of 43,000 tonnes per annum. Majority of the production of ceramics tableware is of bone china and stoneware. This industry in India is highly labour intensive while in USA, UK, Japan and other countries there is full automation. Quality of finished products, design and shapes in India are still below international standards. 8.2 Geographical concentration of Ceramics Clusters
8.2.1 Most of the small scale ceramic units are located in clusters. These clusters are spread across the country in states like Gujarat, Andhra Pradesh, Maharashtra, Uttar Pradesh and West Bengal and produce a range of products varying from sanitary ware to crockery. Gujarat is the most important Ceramic Manufacturing Cluster in South Asia. Overall, the state accounts for about 50% of India’s ceramics production and the Morbi / Thangadh centers alone are responsible for the manufacture of nearly 60% of the country’s ceramic wall and floor tile and sanitary ware. The table below provides the list of significant ceramic clusters in India.
55 As can be seen from the table below
56 (http://dipp.nic.in/industry/content_industries/CERAMIC%20INDUSTRY.htm#ceramic)
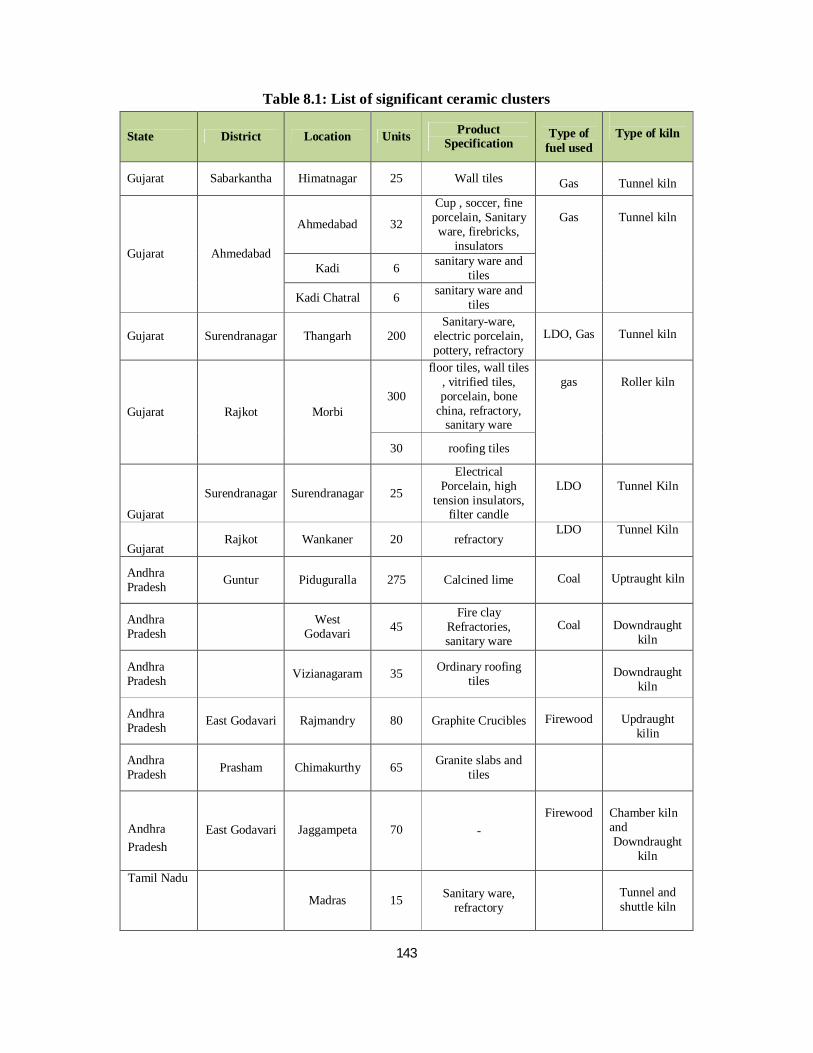
143
Table 8.1: List of significant ceramic clusters
State District Location Units Product Specification
Type of
fuel used
Type of kiln
Gujarat Sabarkantha Himatnagar 25 Wall tiles
Gas
Tunnel kiln
Gujarat Ahmedabad
Ahmedabad 32
Cup , soccer, fine porcelain, Sanitary ware, firebricks,
insulators
Gas
Tunnel kiln
Kadi 6 sanitary ware and tiles
Kadi Chatral 6 sanitary ware and tiles
Gujarat Surendranagar Thangarh 200 Sanitary-ware,
electric porcelain, pottery, refractory
LDO, Gas
Tunnel kiln
Gujarat Rajkot Morbi 300
floor tiles, wall tiles , vitrified tiles, porcelain, bone
china, refractory, sanitary ware
gas
Roller kiln
30 roofing tiles
Gujarat
Surendranagar Surendranagar 25
Electrical Porcelain, high
tension insulators, filter candle
LDO
Tunnel Kiln
Gujarat Rajkot Wankaner 20 refractory
LDO Tunnel Kiln
Andhra Pradesh Guntur Piduguralla 275 Calcined lime
Coal
Uptraught kiln
Andhra Pradesh
West Godavari 45
Fire clay Refractories, sanitary ware
Coal
Downdraught
kiln
Andhra Pradesh Vizianagaram 35 Ordinary roofing
tiles
Downdraught
kiln
Andhra Pradesh East Godavari Rajmandry 80 Graphite Crucibles
Firewood
Updraught
kilin
Andhra Pradesh Prasham Chimakurthy 65 Granite slabs and
tiles
Andhra Pradesh
East Godavari
Jaggampeta
70 -
Firewood
Chamber kiln and Downdraught
kiln
Tamil Nadu
Madras 15 Sanitary ware, refractory
Tunnel and shuttle kiln
144
Maharashtra Gujroli Chandrapur* -
Rajasthan Bikaner 40 Low / high tension insulators
Low
sulphur diesel oil
Uttar Pradesh Bulandshahar Khurja 100
Crockery, low and
high tension insulators
Down draft
shuttle , tunnel type
Total 1369**
* data not available **as per discussion with the expert
8.3 Energy Intensity in Indian Ceramics Sector
8.3.1 The Ceramics sector is highly energy intensive accounting for about Rs 2115 mn57 worth of energy consumed per year and amounts to 35% of the manufacturing cost58. The energy used in the ceramic industry is of two types - electric energy and thermal energy. The electric energy is converted to mechanical energy when used in the motor and fan of the machine and as thermal energy when used to heat the kilns and furnaces. Fuel is converted into thermal energy through combustion reaction. The main fuel used by ceramic industry is LPG and natural gas. The other types of fuel used are kerosene, low diesel oil (LDO), propane and high speed diesel (HSD). 8.3.2 The manufacturing process of ceramics differs according to the type of product. However, the basic ceramic production process consists of a series of successive stages, which can be summarised as follows: Raw material preparation Pressing and drying of the green body Firing, with or without glazing Additional treatments Sorting and packing 8.3.3 Of these processes, the firing process is the greatest energy consumer, which includes usage of kilns and dryers. Around 80-90 percent of the total energy is used by kilns and dryers. In case of tile manufacturing the temperature required for firing ranges between 1080 to 1100oC. In case of sanitary ware the temperature maintained is around 1200o C. The amount of energy consumed is also dependent on the typology of kilns used. The types of kilns mostly used are either continuous or intermittent. The continuous kilns include tunnel and roller hearth kilns. The tunnel kilns are refractory tunnels served by rail tracks carrying 57 (IREDA and CII Report, 2002) (IREDA Report Investors Manual on Energy and Efficiency) 58 Discussion with the expert
145
kiln cars. Most tunnel kilns are gas fired. In roller hearth kiln firing is provided by natural gas-air burners located at the sides of the kilns. The intermittent kilns include shuttle and hood type kilns, based on single chambers that are charged with dried ceramic products, sealed and then exposed to a defined firing cycle. These kilns are usually provided with gas burners and generally used for small scale manufacture of special sanitary ware. 8.3.4 Before 2002 usually shuttle kilns were used. But now with the change in technology, the units have shifted to tunnel and roller kilns which are natural gas based and consume less energy. These are continuous kilns. The product is produced fast and the quality of the product produced is better than those produced in intermittent kilns. Since gas is used less pollution is generated as compared to shuttle kilns where oil is used which caused pollution. 8.3.5 In terms of energy consumption, the table below shows the amount of energy required to make different kinds of refractories using different types of kilns - Periodic, Tunnel and roller. The periodic kilns are intermittent (small batches) and tunnel kilns and roller kilns are continuous. So the production in tunnel and roller kilns is high as compared to periodic kilns. Maximum production and usage is of fire bricks. High alumina and basic refractories consume more energy. In small units mostly fire bricks are used which are fired at a temperature of 1200 - 1400 oC. 2500-3500 K J/kg of energy is required for fire bricks if tunnel kilns are used, 6000-8000 KJ/kg of energy is required when periodic kilns are used and in case of roller kilns 2000-2800 KJ/kg energy is required. This shows roller kilns are better as compared to periodic or tunnel kilns.
Table: 8.2: Energy consumption by different types of kilns Type of refractory In Periodic Kilns (KJ/Kg) In Tunnel Kilns (KJ/Kg) In Roller Kilns
(KJ/Kg)* Fire bricks (fired at 1200-1400oC)
6000-8000 2500-3500 2000 - 2800
High alumina refractories (fired at 1400-1600oC)
12000 3500 2800
Basic refractories (fired at 1600-1750oC)
12000-16000 6000-7000 5.2.1
4800 - 5600
*As per discussion with the expert, approximately 20% less energy is consumed in roller kilns as compared to tunnel kilns. Source: IREDA – Investor manual for energy efficiency (2002), Pg 171 The energy consumption depends on various factors as listed below. Types of kilns and dryers Capacity utilisation of kilns and driers Combustion control systems Type of heat recovery system
146
Type of insulation used at kilns and driers Types of presses Types of spray driers
8.3.6 The energy efficiency measures in any industrial sector starts from the behavioural changes. The energy efficiency efforts in the ceramic sector can be classified into the following three steps. Step 1- Good Housekeeping: This includes elimination of minor wastes, review of the operation standards in the production line, more effective management, improvement of employees cost consciousness and operation techniques. Step 2- Equipment improvement: Improve the energy efficiency of the equipment by minor modification of the existing production line. Step 3- Process improvement: This is intended to reduce energy consumption by substantial modification of the production process itself by technological development. E.g. conversion from tunnel kiln to roller hearth kiln (better technology). 8.3.7 As Gujarat account for almost 50 per cent of India’s ceramic production, it is vital to explore the energy consumption pattern of the state. The type of furnace used in the production process in Gujarat (as shown in the table above) in mainly tunnel kiln, apart from Morbi and the fuel is used is mainly natural gas. Therefore, the energy consumption is much less compared to other ceramic clusters. The Khurja ceramic cluster is also well known for its ceramic products and there are around 100 small units. The production process involves use of downdraft, shuttle and few tunnel type kilns. Thus there exists a scope of upgrading the downdraft and shuttle type kiln to tunnel type kiln for efficient energy utilization. 8.4 Environmental Issues in Indian Ceramic Sector
8.4.1 The Ceramics sector has been listed under “Red Category” industries on the basis of its emission/ discharges of high/ significant polluting potential or generating hazardous wastes. The Central Pollution Control Board (CPCB) has set a standard for industry specific emission both for effluent and emission. In case of the ceramics industry the standard is set for emission. The emission standard is given in the table 1.3 below.
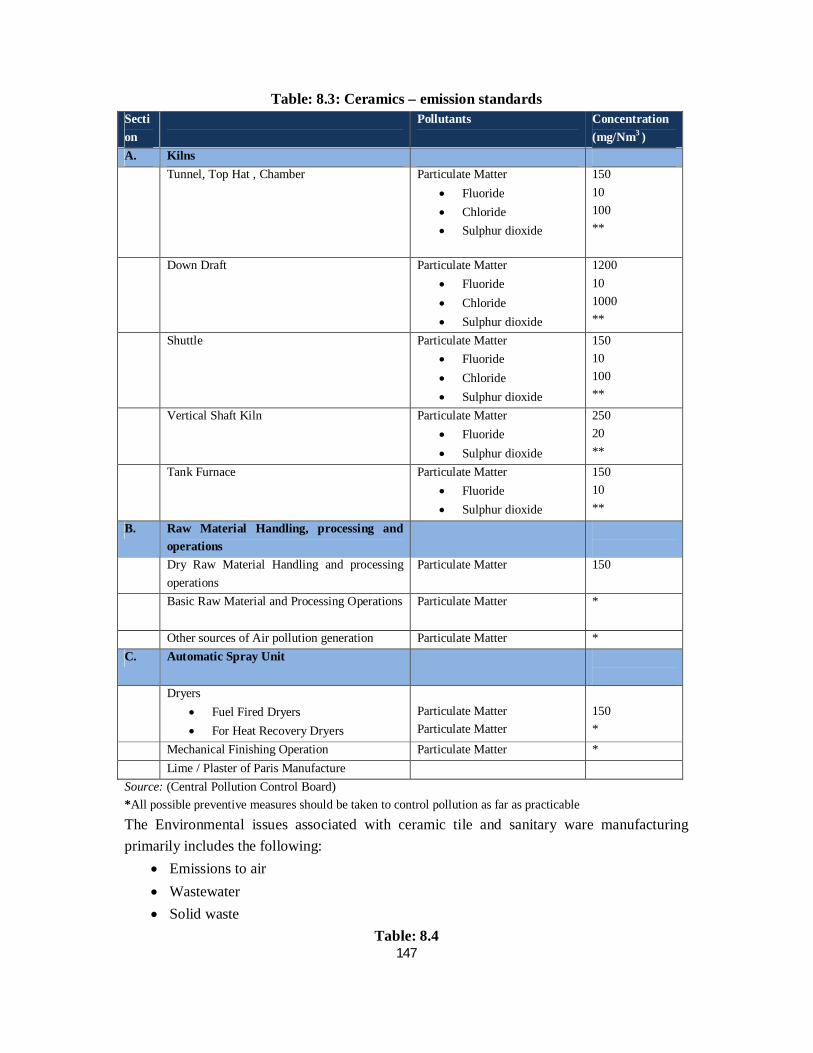
147
Table: 8.3: Ceramics – emission standards Section
Pollutants Concentration (mg/Nm3 )
A. Kilns Tunnel, Top Hat , Chamber Particulate Matter
Fluoride Chloride Sulphur dioxide
150 10 100 **
Down Draft Particulate Matter Fluoride Chloride Sulphur dioxide
1200 10 1000 **
Shuttle Particulate Matter Fluoride Chloride Sulphur dioxide
150 10 100 **
Vertical Shaft Kiln Particulate Matter Fluoride Sulphur dioxide
250 20 **
Tank Furnace Particulate Matter Fluoride Sulphur dioxide
150 10 **
B. Raw Material Handling, processing and operations
Dry Raw Material Handling and processing operations
Particulate Matter
150
Basic Raw Material and Processing Operations Particulate Matter *
Other sources of Air pollution generation Particulate Matter * C. Automatic Spray Unit
Dryers
Fuel Fired Dryers For Heat Recovery Dryers
Particulate Matter Particulate Matter
150 *
Mechanical Finishing Operation Particulate Matter * Lime / Plaster of Paris Manufacture Source: (Central Pollution Control Board) *All possible preventive measures should be taken to control pollution as far as practicable
The Environmental issues associated with ceramic tile and sanitary ware manufacturing primarily includes the following:
Emissions to air Wastewater Solid waste
Table: 8.4
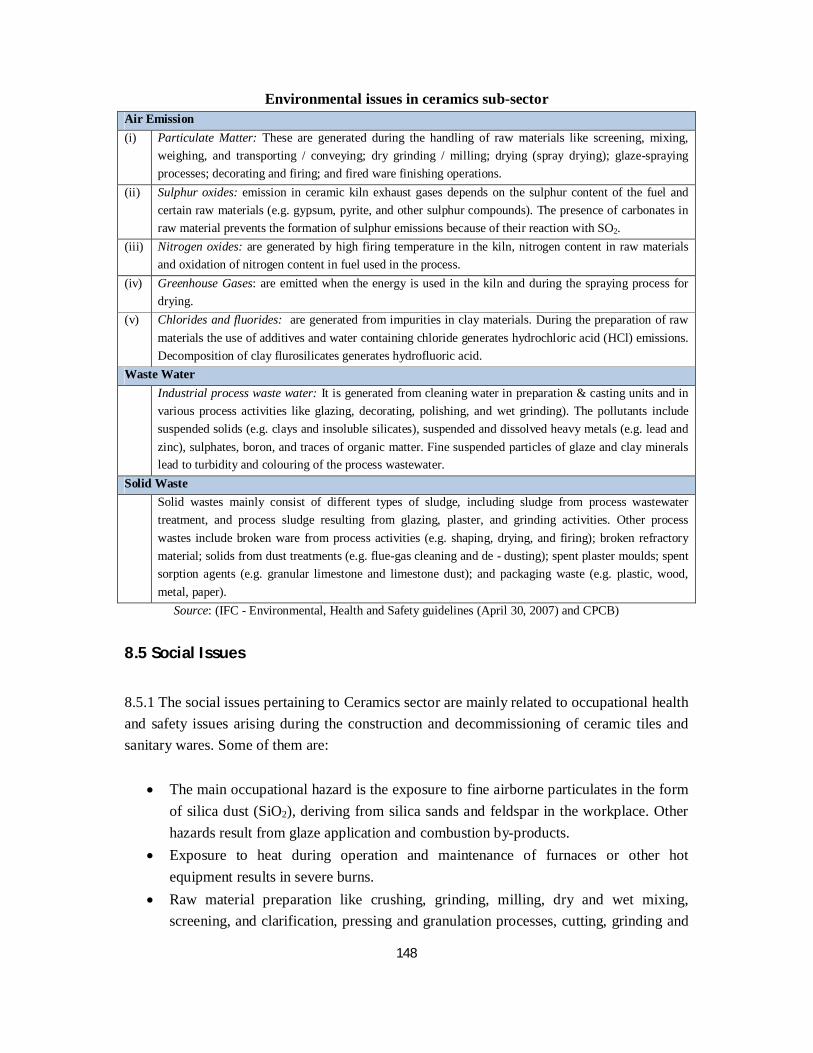
148
Environmental issues in ceramics sub-sector Air Emission (i) Particulate Matter: These are generated during the handling of raw materials like screening, mixing,
weighing, and transporting / conveying; dry grinding / milling; drying (spray drying); glaze-spraying processes; decorating and firing; and fired ware finishing operations.
(ii) Sulphur oxides: emission in ceramic kiln exhaust gases depends on the sulphur content of the fuel and certain raw materials (e.g. gypsum, pyrite, and other sulphur compounds). The presence of carbonates in raw material prevents the formation of sulphur emissions because of their reaction with SO2.
(iii) Nitrogen oxides: are generated by high firing temperature in the kiln, nitrogen content in raw materials and oxidation of nitrogen content in fuel used in the process.
(iv) Greenhouse Gases: are emitted when the energy is used in the kiln and during the spraying process for drying.
(v) Chlorides and fluorides: are generated from impurities in clay materials. During the preparation of raw materials the use of additives and water containing chloride generates hydrochloric acid (HCl) emissions. Decomposition of clay flurosilicates generates hydrofluoric acid.
Waste Water Industrial process waste water: It is generated from cleaning water in preparation & casting units and in
various process activities like glazing, decorating, polishing, and wet grinding). The pollutants include suspended solids (e.g. clays and insoluble silicates), suspended and dissolved heavy metals (e.g. lead and zinc), sulphates, boron, and traces of organic matter. Fine suspended particles of glaze and clay minerals lead to turbidity and colouring of the process wastewater.
Solid Waste Solid wastes mainly consist of different types of sludge, including sludge from process wastewater
treatment, and process sludge resulting from glazing, plaster, and grinding activities. Other process wastes include broken ware from process activities (e.g. shaping, drying, and firing); broken refractory material; solids from dust treatments (e.g. flue-gas cleaning and de - dusting); spent plaster moulds; spent sorption agents (e.g. granular limestone and limestone dust); and packaging waste (e.g. plastic, wood, metal, paper).
Source: (IFC - Environmental, Health and Safety guidelines (April 30, 2007) and CPCB)
8.5 Social Issues
8.5.1 The social issues pertaining to Ceramics sector are mainly related to occupational health and safety issues arising during the construction and decommissioning of ceramic tiles and sanitary wares. Some of them are:
The main occupational hazard is the exposure to fine airborne particulates in the form of silica dust (SiO2), deriving from silica sands and feldspar in the workplace. Other hazards result from glaze application and combustion by-products.
Exposure to heat during operation and maintenance of furnaces or other hot equipment results in severe burns.
Raw material preparation like crushing, grinding, milling, dry and wet mixing, screening, and clarification, pressing and granulation processes, cutting, grinding and
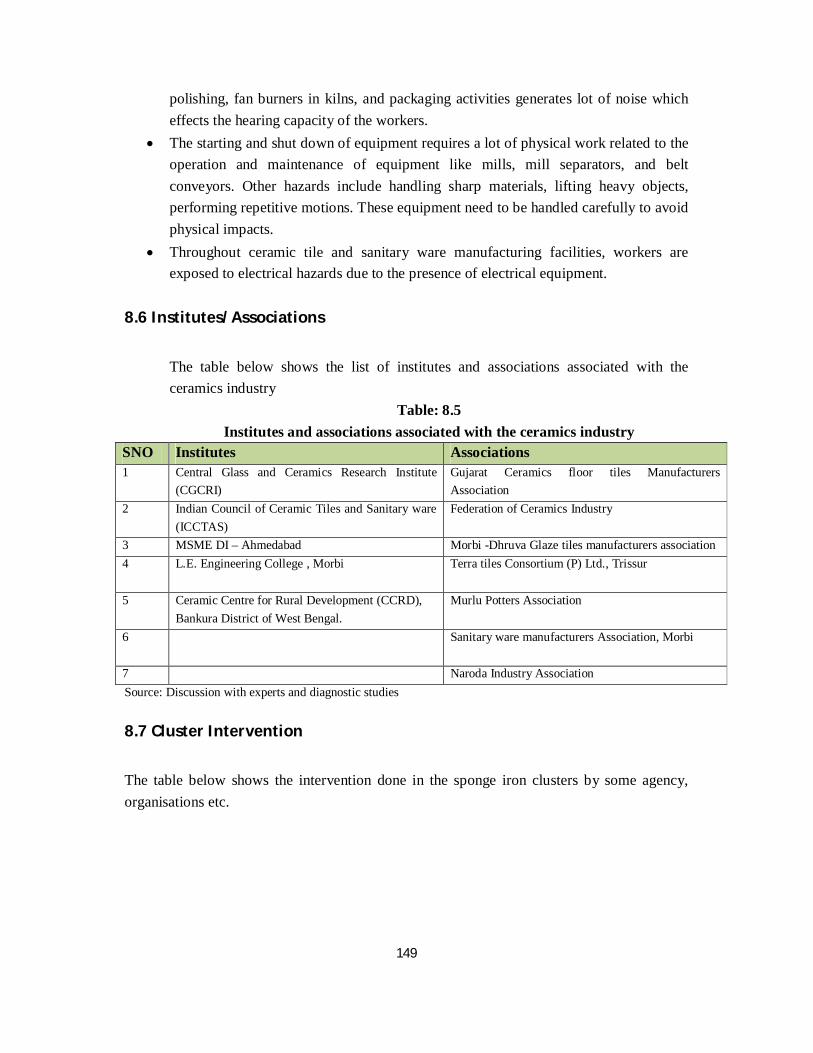
149
polishing, fan burners in kilns, and packaging activities generates lot of noise which effects the hearing capacity of the workers.
The starting and shut down of equipment requires a lot of physical work related to the operation and maintenance of equipment like mills, mill separators, and belt conveyors. Other hazards include handling sharp materials, lifting heavy objects, performing repetitive motions. These equipment need to be handled carefully to avoid physical impacts.
Throughout ceramic tile and sanitary ware manufacturing facilities, workers are exposed to electrical hazards due to the presence of electrical equipment.
8.6 Institutes/Associations
The table below shows the list of institutes and associations associated with the ceramics industry
Table: 8.5 Institutes and associations associated with the ceramics industry
SNO Institutes Associations 1 Central Glass and Ceramics Research Institute
(CGCRI) Gujarat Ceramics floor tiles Manufacturers Association
2 Indian Council of Ceramic Tiles and Sanitary ware (ICCTAS)
Federation of Ceramics Industry
3 MSME DI – Ahmedabad Morbi -Dhruva Glaze tiles manufacturers association 4 L.E. Engineering College , Morbi
Terra tiles Consortium (P) Ltd., Trissur
5 Ceramic Centre for Rural Development (CCRD), Bankura District of West Bengal.
Murlu Potters Association
6 Sanitary ware manufacturers Association, Morbi
7 Naroda Industry Association Source: Discussion with experts and diagnostic studies
8.7 Cluster Intervention
The table below shows the intervention done in the sponge iron clusters by some agency, organisations etc.
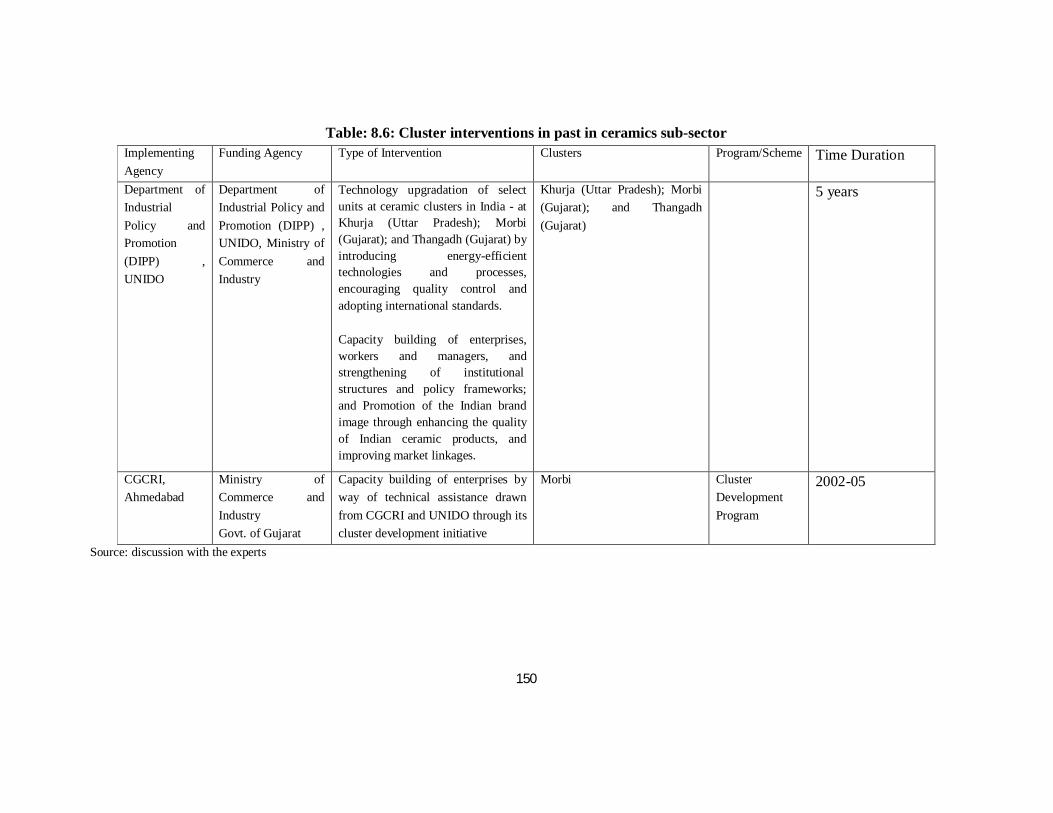
150
Table: 8.6: Cluster interventions in past in ceramics sub-sector Implementing Agency
Funding Agency Type of Intervention Clusters Program/Scheme Time Duration
Department of Industrial Policy and Promotion (DIPP) , UNIDO
Department of Industrial Policy and Promotion (DIPP) , UNIDO, Ministry of Commerce and Industry
Technology upgradation of select units at ceramic clusters in India - at Khurja (Uttar Pradesh); Morbi (Gujarat); and Thangadh (Gujarat) by introducing energy-efficient technologies and processes, encouraging quality control and adopting international standards.
Capacity building of enterprises, workers and managers, and strengthening of institutional structures and policy frameworks; and Promotion of the Indian brand image through enhancing the quality of Indian ceramic products, and improving market linkages.
Khurja (Uttar Pradesh); Morbi (Gujarat); and Thangadh (Gujarat)
5 years
CGCRI, Ahmedabad
Ministry of Commerce and Industry Govt. of Gujarat
Capacity building of enterprises by way of technical assistance drawn from CGCRI and UNIDO through its cluster development initiative
Morbi Cluster Development Program
2002-05
Source: discussion with the experts
151
8.8 Bibliography
“Environmental, Health and Safety (EHS) General Guidelines” (2007), World Bank, IFC “Investors Manual for Energy Efficiency”, Indian Renewable Energy Development Agency and Confederation of Indian Industry, Pg 161 Exim Bank: Research Brief no. 15 “Indian Ceramic Industry : Perspective and Export Potential” (2005) “Diagnostic Study for Murlu Roofing Tiles”, Salotra, Bankura Websites http://dipp.nic.in/industry/content_industries/CERAMIC%20INDUSTRY.htm#ceramic http://www.icctas.com/ http://www.msmefoundation.org/DSR_temp/Diagnostic%20Study%20Report%20of%20Morbi%20Wankaner%20Ceramic%20Cluster.pdf
www.unido.org
152
Chapter – B9
The Glass and Glassware
9.1 Economic significance
9.1.1 Glass has existed in India since ancient times. Archaeological surveys have unearthed glass pieces and crucibles that can be dated back 2,000 years, in which glass was made near Basti in Uttar Pradesh. The Mahabharata makes a mention of glass, as does another ancient text, Yuktic Kalpataru, which talks of the effect of drinking water out of a glass tumbler to be the same as drinking out of a crystal cup. Evidence shows that by 1,000 BC, glass beads were being made in nort h India. Small drawn glass beads were a speciality, and seem to have originated in India, after which the craft spread to East Africa and South-East Asia through AD 1000. The main centres of production were Brahmapuri and Arikamedu in south India. With time the craft died down, but was revived, mostly at Firozabad, Purdilnagar (Hathras) and Varanasi, which continue to operate as important centres of glass bead making.
9.1.2 Glass is a vital component in day to day domestic use as well as in various industries. Around 90 per cent of the industry output is used in other industries like construction, motor vehicles and food and beverages industry. From the early 1950s the glass industry started manufacturing using modern equipment, both for melting and production. Collaboration with multinational companies gave a boost to the industry. It was in the last decade of the twentieth century that the Indian glass industry started to seriously compete globally, installing improved furnaces to conserve energy and therefore reduce the cost of production. 9.1.3 The principal constituent of the glass is silicon dioxide. However, silica melts at a very high temperature; so to reduce the fusion temperature catalysts like soda ash and potash are added to the charge as flux. There are various glass items produced in India, like glass bottles, containers of various kinds, sheet, figured and wired glass, safety glass and mirrors,
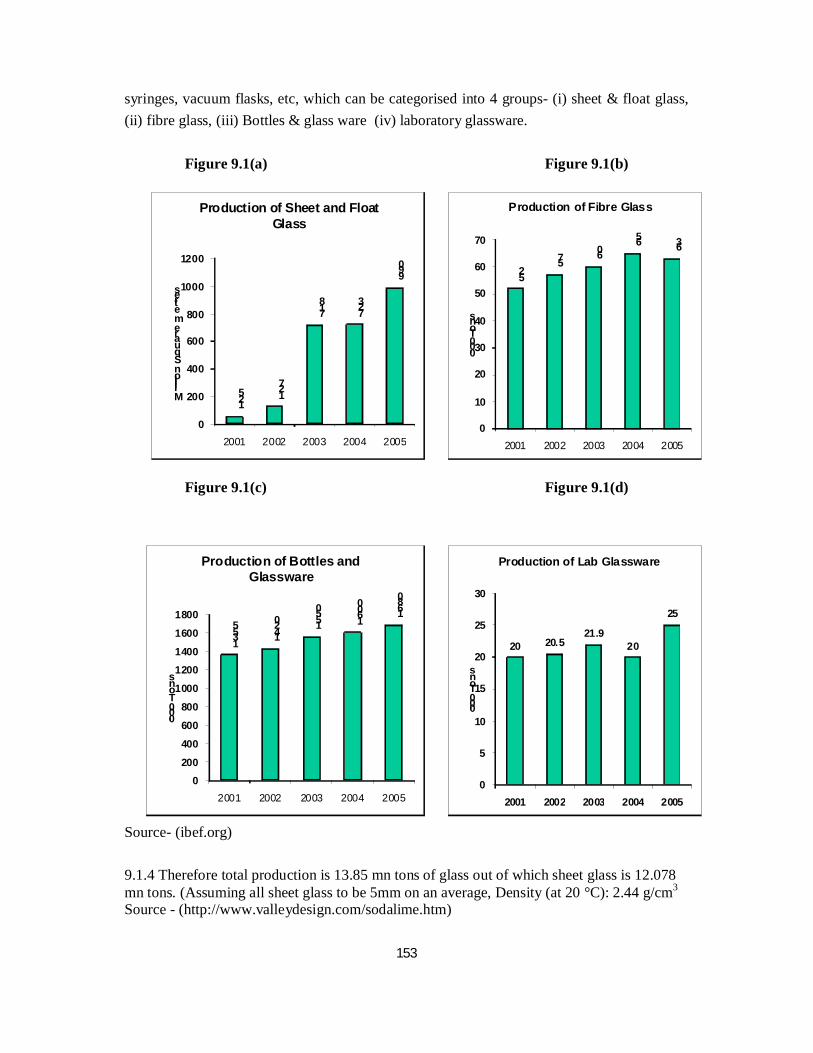
153
syringes, vacuum flasks, etc, which can be categorised into 4 groups- (i) sheet & float glass, (ii) fibre glass, (iii) Bottles & glass ware (iv) laboratory glassware.
Figure 9.1(a) Figure 9.1(b)
Figure 9.1(c) Figure 9.1(d) Source- (ibef.org) 9.1.4 Therefore total production is 13.85 mn tons of glass out of which sheet glass is 12.078 mn tons. (Assuming all sheet glass to be 5mm on an average, Density (at 20 °C): 2.44 g/cm3 Source - (http://www.valleydesign.com/sodalime.htm)
1355 14
20 1550
1600 16
80
0200
400
600
800
1000
12001400
1600
1800
2001 2002 2003 2004 2005
'000 Tons
Production of Bottles and Glassware
20 20.521.9
20
25
0
5
10
15
20
25
30
2001 2002 2003 2004 2005
'000 Tons
Production of Lab Glassware
125 12
7
718
723
990
0
200
400
600
800
1000
1200
2001 2002 2003 2004 2005
Million Square metres
Production of Sheet and Float Glass
5257
6065 63
0
10
20
30
40
50
60
70
2001 2002 2003 2004 2005
'000 Tons
Production of Fibre Glass
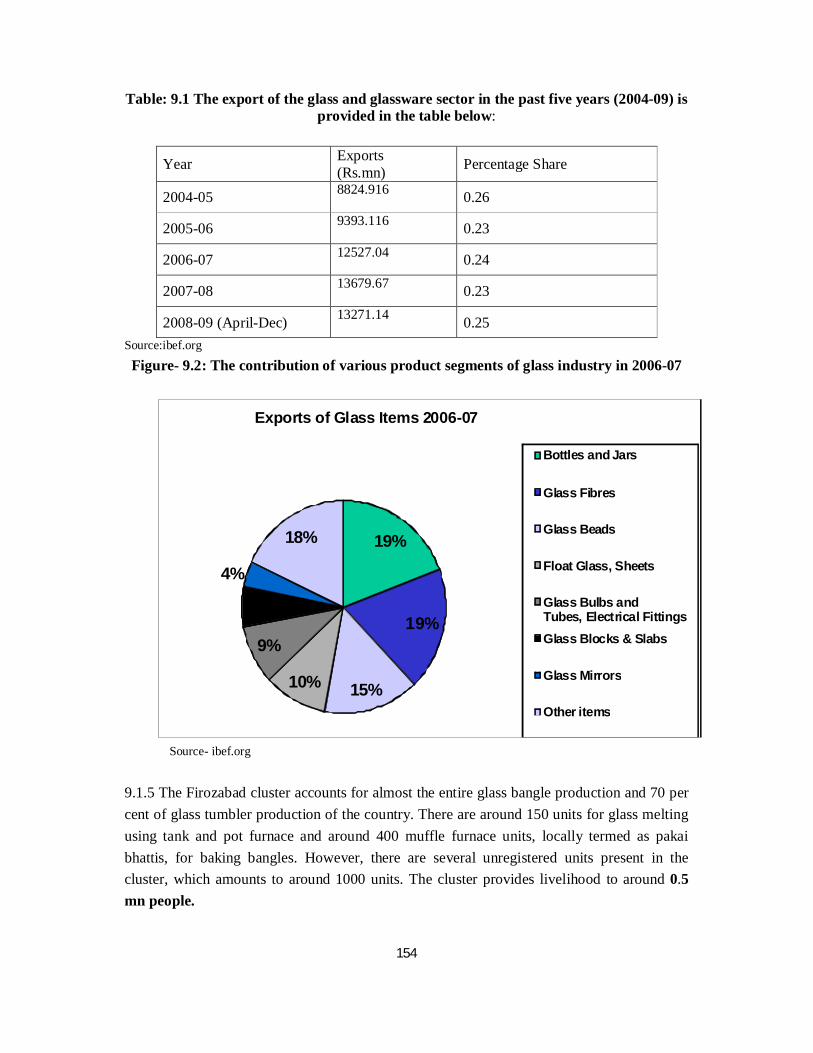
154
Table: 9.1 The export of the glass and glassware sector in the past five years (2004-09) is provided in the table below:
Year Exports (Rs.mn) Percentage Share
2004-05 8824.916 0.26
2005-06 9393.116 0.23
2006-07 12527.04 0.24
2007-08 13679.67 0.23
2008-09 (April-Dec) 13271.14 0.25 Source:ibef.org
Figure- 9.2: The contribution of various product segments of glass industry in 2006-07
Source- ibef.org
9.1.5 The Firozabad cluster accounts for almost the entire glass bangle production and 70 per cent of glass tumbler production of the country. There are around 150 units for glass melting using tank and pot furnace and around 400 muffle furnace units, locally termed as pakai bhattis, for baking bangles. However, there are several unregistered units present in the cluster, which amounts to around 1000 units. The cluster provides livelihood to around 0.5 mn people.
19%
19%
15%10%
9%
6%
4%
18%
Exports of Glass Items 2006-07
Bottles and Jars
Glass Fibres
Glass Beads
Float Glass, Sheets
Glass Bulbs and Tubes, Electrical FittingsGlass Blocks & Slabs
Glass Mirrors
Other items
155
9.1.6 The 3 Glass bead cluster of India together has a turnover of 4.50 bn and exporting around 1.50 bn worth of beads. Total employment of these 3 clusters is around 0.4 mn people. They use pot furnace and tank furnace for making beads. There are some clusters of value added products of beads in India which depend on these bead making clusters only. 9.1.7 Glass is the most eco-friendly packaging media. Each bit of broken glass can be re-cycled to manufacture new glass with much lower consumption of energy. The traditional fuel used for glass making in the cluster was coal, which changed due to landmark judgement by Supreme Court passed in December 1996, banning the use of coal in the Taj Trapezium Zone. The energy intensity of the glass sector and thereby the Firozabad cluster is provided in the following section. 9.2 Geographical concentration
The glass industries are fairly uniformly distributed throughout the country. It has been estimated that there are around 40 glass industries manufacturing different types of products in the western region that are mainly located in the industrial areas, around 20 glass industries in the eastern region (few of them closed down due to labour unrest), about 15 in the southern region comprising Karnataka, Andhra Pradesh, Kerala and Tamil Nadu and about 20 glass industries in the Northern region spread over UP, Haryana and Delhi59. However, these units are not clustered in a particular location. The largest conglomerate of small scale glass manufacturing units is located 40 km from Agra (UP) in Firozabad. We have 3 clusters of glass beads which are located in Purdil nagar,Hathras(UP), Banaras(UP) and Nath dwara (Rajasthan). 9.3 Manufacturing process
9.3.1 The manufacturing process of glass can be bifurcated into four main phases, which is more or less similar irrespective of the typology of product manufactured.
9.3.1i Phase 1- Preparation of raw material: The common raw material used for the manufacture of glass are glass sand, recycle glass (cullets), feldspar and flux material like soda ash, dolomite etc, which crushed to 20-120 mesh and mixed with other additives to form a batch. 9.3.1ii Phase 2- Melting in a furnace: The batch is introduced into the furnace for melting at about 1500oC.
59 (Glass Sector Study, CPCB)
156
9.2.1iii Phase 3- Forming: The glass is drawn from the furnace and blown (formed) into different shapes. These products are then heated and cooled in a controlled manner, termed as annealing, to impart hardness to the glass.
9.2.1iv Phase 4- Finishing: The products are subjected to various cutting and finishing operations and then packed for despatch to the markets.
9.4 Energy Intensity of Glass Industry
9.4.1 Glass manufacturing is a highly energy-intensive activity. It has been estimated that 4060 per cent of the manufacturing cost is attributable to the energy cost. It has been estimated that in general the energy required to melt one tonne of glass is approximately 2.2 mn Btu, but in practice twice as much of energy (4.4 mn Btu) is required due to variety of losses and inefficiencies in furnace design. Therefore total coal burnt is 7.7 mn tons (Assuming specific energy 8360 KJ per Kg for Indian coal).The estimated value of the total coal consumption is Rs 27.7 bn {(0.77*4000)/5000}. 9.4.2 The principle variation in the glass industry is the type of furnaces used for melting of the raw material. The melting process accounts for over 80 percent of the total energy consumed by a glass factory. Other significant areas of energy use are fore hearth, the forming process, annealing, factory heating and general services. The various types of furnaces used for melting of the raw material are- (i) Regenerative furnace/ tank furnace: These are large furnaces and the glass from this
furnace are used for making a wide range of items, like jars, tumblers, lamp shades, laboratory ware etc. The fuels used in tank furnace are coal, gas and oil.
(ii) Recuperative furnace/ Pot furnaces: These are relatively small furnaces that are used to make small quantities of different colours of glass. There are two kinds of pot furnace- open pot and closed pot. The fuels used are coal, oil and gas.
(iii) Electric furnaces: are commonly small and particularly used for special glass. Electric heating eliminates the formation of combustion by-product with the replacement of fossil fuels and batch carry-over, thus reducing the emission.
9.4.3 Of the listed types of furnaces, coal fired pot furnace and muffle furnace were very low in energy efficiency. These are being used in MSME clusters in India. Apart from melting process, energy is required for baking or annealing. Traditional coal fired muffle furnace (Pakai Bhattis) is used for baking or annealing. The fuel used for baking is mainly coal and generates very high levels of pollution in the form of CO2, smoke and particulates. 2 - (Towards Cleaner Technologies, TERI)
157
9.4.4 In case of Firozabad cluster, the banning of usage of coal in the Taj Trapezium Zone and making availability of natural gas through Gail (Gas Authority of India Limited), a public sector organisation, resulted in shift from coal fired pot furnace to gas fired pot furnace. This resulted in reduction of energy consumption and low emission of particulate matter. The Energy and Resources Institute (TERI), an implementing organisation working in the field of energy, environment and sustainable development, has been instrumental is providing the design of a gas fired pot furnace that leads to energy savings of almost 50 per cent compared to the traditional coal-fired pot furnace. Similar attempts have been made by TERI in upgrading the muffle furnace that has the energy saving potential of 30 per cent compared to the traditional coal based muffle furnace. Out of 70-80 Open Pot Recuperative furnace 50 have been upgraded using TERI designed furnace and out of 400 muffle furnace units, around 100 have been installed using TERI design. But at present there are hardly 10-12 gas fired muffle furnace in operation in Firozabad, mainly due to availability of low cost fuel like wood. Considering the unregistered units that are present in the Firozabad cluster, there are huge scope of upgrading the furnace and thereby saving energy by almost 50 per cent. 9.5 Environmental Issues
9.5.1 The glass sector has been listed under “Red Category” as per the standards specified by the Central Pollution Control Board on the basis of its generation and discharges of hazardous wastes. CPCB has set a standard for industry specific emission both for effluent and emission. In case of the glass industry the standard is set for emission. The emission standard is given in the Table 9.2 below:
Table 9.2: Standard for Industry Specific Emissions Section of the Plant Parameter Emission Limit A. Soda lime & borosilicate glass and other special glass (other than Lead Glass) Up to a product draw capacity of 60 tpd
Particulate matter 2.0 kg /hr
Product draw capacity of more than 60 tpd
Particulate matter tpd 0.8 kg per tonne of product drawn
All Capacities Sulphur dioxide Minimum stack Height (H in mt) = 14Q0.3
where Q is SO2 emission rate in Kg/hour. Total Fluorides NOx 5.0 mg/Nm3 use of low NOx burners in new
plants B. Lead Glass All Capacities Total Particulate Matter 50mg/Nm3
lead 20mg/Nm3 C. Pot Furnace
Particulate Matter 1200mg/Nm3 Source: Central Pollution Control Board
158
9.5.2 The emission level depends on the type of furnace. In regenerative furnaces, the emission level is quite low under normal conditions with little or no visible smoke. The emissions increase sometime (few minutes) during the reversal of regenerators. 9.5.3 In pot type furnaces the emission level is quite high when fresh batch is charged and also few hours before the start of withdrawal of glass. During this period the firing rate is quite high. For the remaining period the emissions are considerably lower with only little visible smoke. 9.5.4 In case of open fire furnaces the emissions rate is low due to low and slow firing rates. Similarly in pakai bhatties the furnaces are small and the temperature required is also very low. 9.5.6 The environmental issues in glass manufacturing sector primarily include:
a) Emissions to air b) Wastewater c) Solid Waste
(i) Air Emissions- Glass manufacturing is a high temperature, energy intensive
resulting in the emission of combustion of by-products (sulphur dioxide, carbon dioxide, and nitrogen oxides) and the high-temperature oxidation of atmospheric nitrogen. The main source of air pollution is the dust emission in the manufacture of special glasses like lead glass and Boro silicate glass. In lead glass the level of emission depends on the quantity of lead.
(ii) Particulate Matter: Particulates are pollutants emitted by glass manufacturing facilities. Dust emissions are an expected result of raw materials transportation, handling, storage, and mixing. Dust generated by these processes is typically coarser than the particulates emitted from the hot processes, which have sizes below 1 µm, but the small particulates readily agglomerate into larger particles. Whereas dust emitted from handling processes is mostly an occupational health and safety (OHS) issue, MSME’s produce around 648 Tons per annum of PM (Assuming 2Kg per hour as per CPCB standard, 10 hrs of operation, 54 ton production in Firozabad, 54 ton in all bead clusters and 300 working days in a year).
(iii)Nitrogen oxides: The main emission sources of nitrogen oxides (NOX) are the generation of thermal NOX caused by high furnace temperatures, the decomposition of nitrogen compounds in the batch materials, and the oxidation of nitrogen contained in fuels. Presence of KNO3 in the raw material also contributes to NOx emissions.
(iv) Sulphur oxides: SO2 originates from the sulphur content in the fuel oil as well as on sulphite/sulphate/sulphide content in raw materials, particularly the addition of sodium or calcium sulphate for glass oxidation.
159
(v) Chlorides and Fluorides: These pollutants arise in glass-melting furnaces waste gases from raw material impurities and volumes are usually limited. The emission of fluorides is observed when fluoride containing compounds like sodium silicon fluoride or fluorspar are used in the raw materials as fine chemicals. Presence of chlorides in the flue gases exists when chloride compounds like sodium chloride are used as refining chemicals.
(vi) Metals: Heavy metals are present as minor impurities in some raw materials, in cullet, and in fuels. Lead and cadmium are used in fluxes and colouring agents in the frit industry. Particulates from lead crystal manufacture may have a lead content of 20–60 percent.
(vii) Green House Gases: Glass manufacturing is a significant emitter of greenhouse gases (GHG), especially carbon dioxide (CO2). The total carbon dioxide (CO2) released in Firozabad cluster is 0.409 mn tons (PCRA presentation). Almost same amount is being released in all the beads cluster put together. Therefore total 0.8mn tons CO2 is released every year by MSME clusters. The emission done by entire glass industry was 14.7 mn tons. (Based on 2006 figures).
b) Waste Water- The main source of water pollution in a glass industry is: Cullet washing Cooling water at different areas in the furnace operation.
Cullet washing: The cullet contains dust, metal caps etc. To clean it, the material is introduced into a rotary drum washer. The through agitation of the dirty cullet with water cleans the cullet which is sent for crushing. The water principally containing mud and also the oil (used for cutting blade for cutting the glass) is the source for water pollution. Cooling water: Water for cooling purpose is used at different areas in the furnace operation. Some amount of bleed/blow down is necessary to keep the solids concentration within limits. This appears as waste water. Some treatment chemicals like dissolved salts and water treatment chemicals used for the cooling-water system also source of pollution. c) Solid Waste- There are two sources of solid waste in the glass industry: Coarse sand from the sand screens Waste glass from the furnaces Ash and unburnt coal.
(i) Sand Screening: The silica sand /quartz sand which is the main raw material for the glass making is screened through 30 to 80 meshes. The course sand is rejected as it cannot be used in glass making and becomes a solid waste.
(ii) Waste glass from furnace: While drawing the molten glass from the furnace, certain amount of glass is wasted and it solidifies.
160
(iii) Ash and unburnt coal: The ash and unburnt coal particles results from coal combustion. These are sold to the contractors and ash is used for land filling purposes. This has reduced after natural gas usage in Firozabad. The ash generated is 3.7 mn tons for 48% coal.
9.6 Social Issues
9.6.1 The social issues pertaining to Glass sector are mainly related to occupational health and safety issues. Some of them are: Heat: During the operation and maintenance of furnaces or other hot equipment the
workers are exposed to heat. Excessive heat must be prevented in the workplace, adequate ventilation and cooling air should be provided to displace fumes and dust away from the work stations.
Noise: Workers are exposed to noise during glass manufacturing. Hearing loss (hypoacusia) is a typical occupational illness in this industry, especially for glass-container manufacturing. The noise level from glass-pressing machines can be as high as100 decibels or more, causing hearing impairment.
Respiratory Hazards: The glass manufacturing contains Particulate Matter in the
workplace. This PM may contain silica dust, deriving from silica sands and feldspar, and sometimes toxic compounds like lead oxide, boron, arsenic, tin, nickel, cobalt. Workplaces in container and tableware facilities also typically contain oil fume and smoke arising from hot mould lubrication. These may create respiratory problems for the workers.
Physical Hazards: Many times glass may break and flying glass particles can cause eye
injuries. Severe cutting injuries can arise if flat glass breaks during handling. There must be provision of cut-resisting gloves and long aprons to workers who handle the flat glass.
Baking of bangle is mainly done in homes, where the sitting posture is not scientific and
lead to health problems
Labour issues: Bangle makers are paid piece-rate wages. The wages are very low. The contractors hire the workers, who receive a lump sum amount from the glass factory and pay only a portion to the bangle makers.
Child labour and occupational health and safety are also a major issue for MSME clusters
apart from pollution. MSME is using outdated technology and is facing threat from modern technology. The survival if beads cluster is specially endangered at present which can lead into loss of livelihood of around 0.4mn people.
161
9.7 Institutional linkages
Centre for Glass and Ceramic Research Institute CGCRI is the leading government
institute to develop the glass and ceramic industry and have a special cell located in Firozabad.
TERI has worked on technological upgradation work in Firozabad cluster along with SDC as funding agency.
CGCRI has worked on introducing the LPG based community kilns in Purdil nagar Hathras.
Goonj, an NGO has worked on social issues in Firozabad clusters along with local NGO’s.
KVIC is a premier funding agency for MSME in such clusters.
9.8 Bibliography Sethi, G.and A M Ghosh (2008), “Towards Cleaner Technologies, A process story in Firozabad glass industry cluster, SDC and TERI “Environmental, Health and Safety Guidelines for Glass Manufacturing” (2007) , International Finance Corporation, World Bank Websites http://www.cpcb.nic.in/Industry-Specific-Standards/Effluent/441-1.pdf http://www.valleydesign.com/sodalime.htm. (n.d.) www.ibef.org
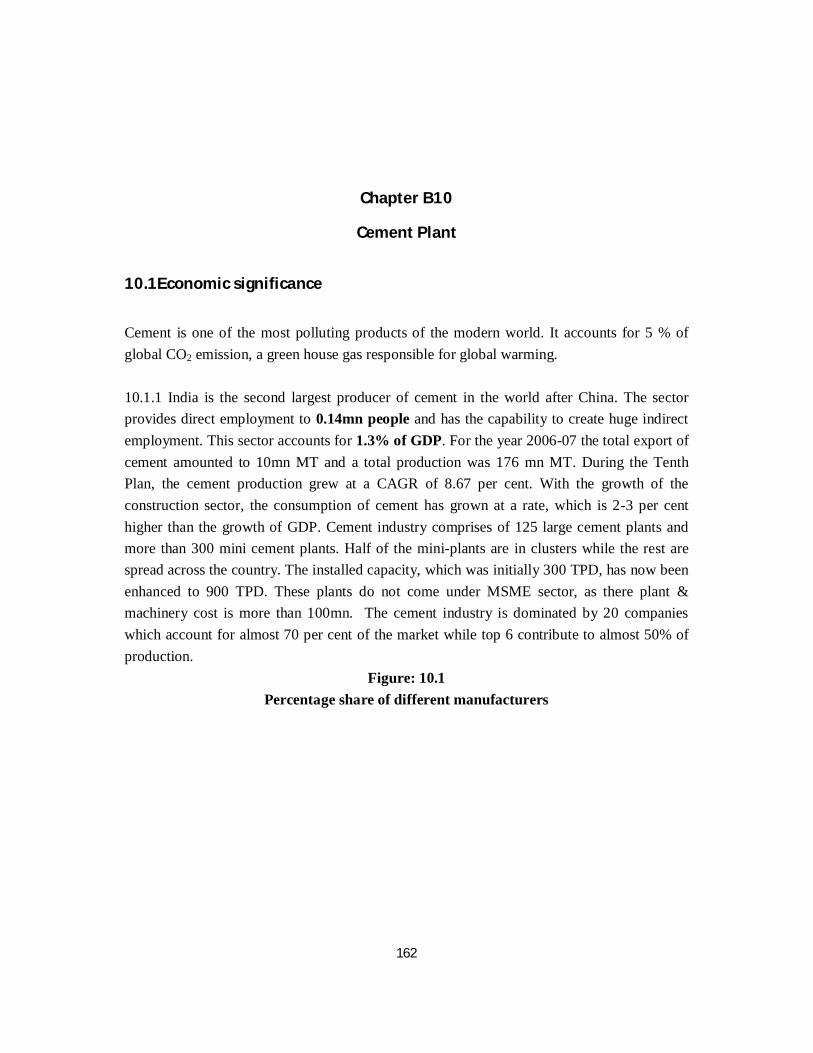
162
Chapter B10
Cement Plant
10.1Economic significance
Cement is one of the most polluting products of the modern world. It accounts for 5 % of global CO2 emission, a green house gas responsible for global warming. 10.1.1 India is the second largest producer of cement in the world after China. The sector provides direct employment to 0.14mn people and has the capability to create huge indirect employment. This sector accounts for 1.3% of GDP. For the year 2006-07 the total export of cement amounted to 10mn MT and a total production was 176 mn MT. During the Tenth Plan, the cement production grew at a CAGR of 8.67 per cent. With the growth of the construction sector, the consumption of cement has grown at a rate, which is 2-3 per cent higher than the growth of GDP. Cement industry comprises of 125 large cement plants and more than 300 mini cement plants. Half of the mini-plants are in clusters while the rest are spread across the country. The installed capacity, which was initially 300 TPD, has now been enhanced to 900 TPD. These plants do not come under MSME sector, as there plant & machinery cost is more than 100mn. The cement industry is dominated by 20 companies which account for almost 70 per cent of the market while top 6 contribute to almost 50% of production.
Figure: 10.1 Percentage share of different manufacturers
163
10.1.2 The Cement Corporation of India, which is a Central Public Sector Undertaking, has 10 units. There are 10 large cement plants owned by various State Governments. Cement industry in India has also made tremendous strides in technological upgradation and assimilation of latest technology. Presently, 96 per cent of the total capacity in the industry is based on modern and environment-friendly dry process technology. 10.1.3 The booming demand for cement, both in India and abroad, has attracted global majors to India. In 2005-06, four of the top-5 cement companies in the world entered India through mergers, acquisitions, joint ventures or green field projects. These include France's Lafarge, Holcim from Switzerland, Italy's Italcementi and Germany's Heidelberg Cements 10.2 Geographic Concentration of Clusters
The origin of the mini cement plants dates back to 1970s. The acute cement scarcity in mid- seventies, with inadequate investment in this core sector, led to promotion of mini cement plants, by government to meet the local demand. The Government of India came out with the policy for promotion of mini cement plants in early 1979. As a result of the Government’s encouragement backed by technical support by National R&D laboratories in the country, a number of mini cement plants came up in different parts of the country. These mini cement plants mainly flocked together in areas close to the vicinity of limestone reserves. Majority of the mini plants are clustered in Andhra Pradesh, Karnataka, Madhya Pradesh and Rajasthan. The table 3.1 below provides the list of mini cement plant clusters in India along with their total number of units and turnover.
Table: 10.1 Mini cement plant clusters in India
State Location Units Production Capacity (millions tonnes/annum)
% share of different manufacturers
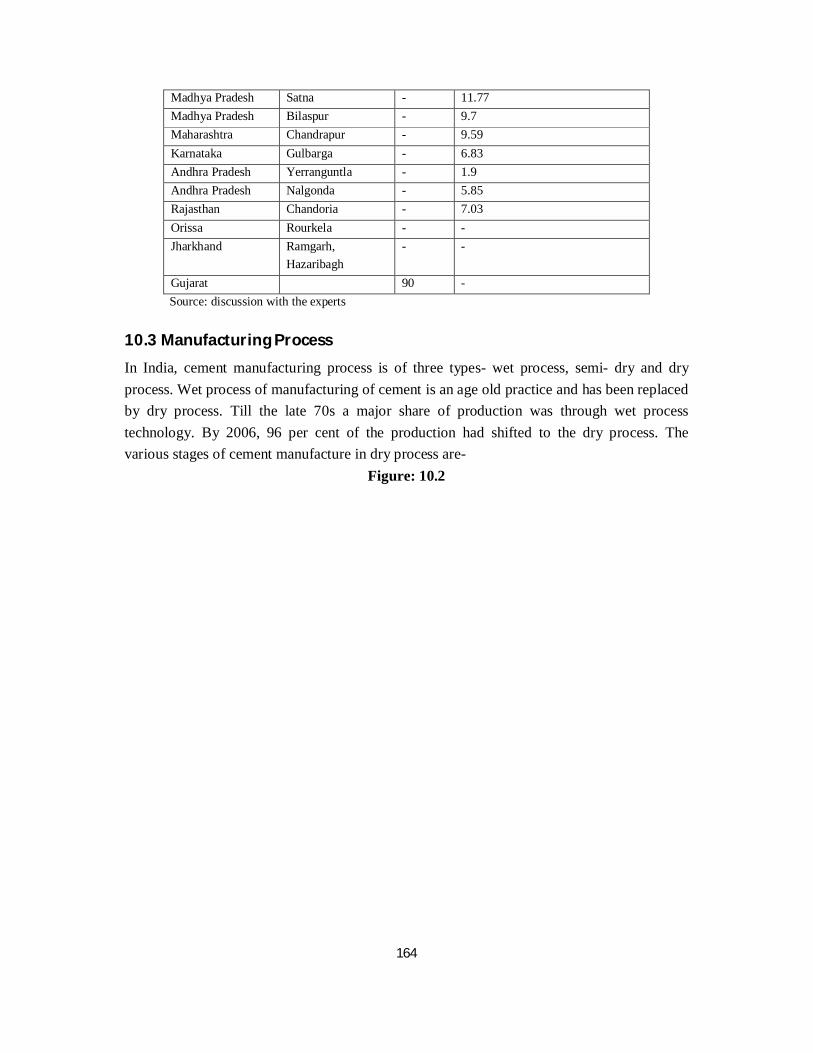
164
Madhya Pradesh Satna - 11.77 Madhya Pradesh Bilaspur - 9.7 Maharashtra Chandrapur - 9.59 Karnataka Gulbarga - 6.83 Andhra Pradesh Yerranguntla - 1.9 Andhra Pradesh Nalgonda - 5.85 Rajasthan Chandoria - 7.03 Orissa Rourkela - - Jharkhand Ramgarh,
Hazaribagh - -
Gujarat 90 - Source: discussion with the experts
10.3 Manufacturing Process
In India, cement manufacturing process is of three types- wet process, semi- dry and dry process. Wet process of manufacturing of cement is an age old practice and has been replaced by dry process. Till the late 70s a major share of production was through wet process technology. By 2006, 96 per cent of the production had shifted to the dry process. The various stages of cement manufacture in dry process are-
Figure: 10.2
165
10.4 Energy Intensity
10.4.1 The production of cement is highly energy intensive and accounts for almost 45 per cent of the manufacturing cost, as estimated in the IREDA-CII Report. The total value of energy consumed is estimated at around Rs. 63000 mn. Energy is consumed at the various stages of cement production. However, the degree of energy consumption is dependent on the typology of the production process undertaken. 10.4.2 The energy is mostly consumed in the process of raw mill grinding and pyro-processing, where the raw meal is heated to form clinker. This is done in a kiln. Coal continues to be the main fuel for the cement industry. At present, 60 per cent of coal requirement of the cement industry is met through linkages and fuel supply agreements, while the remaining is met through open market purchases, import and use of petroleum
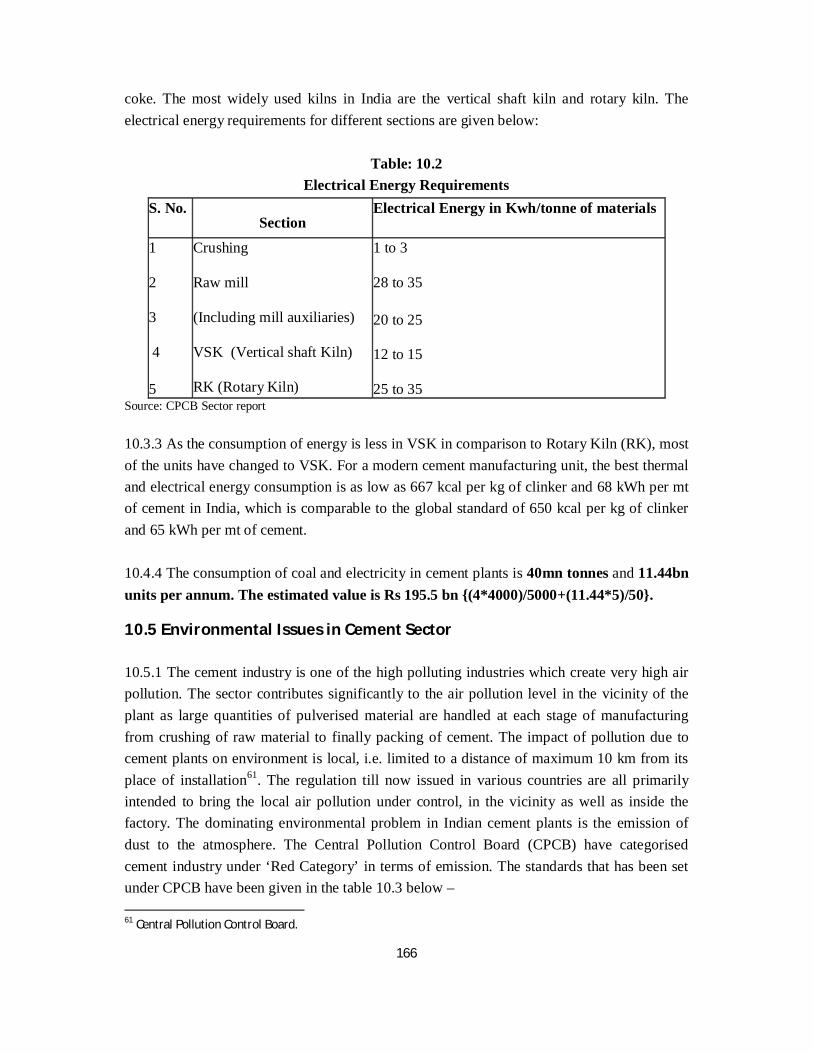
166
coke. The most widely used kilns in India are the vertical shaft kiln and rotary kiln. The electrical energy requirements for different sections are given below:
Table: 10.2 Electrical Energy Requirements
S. No. Section
Electrical Energy in Kwh/tonne of materials
1
2
3
4
5
Crushing
Raw mill
(Including mill auxiliaries)
VSK (Vertical shaft Kiln)
RK (Rotary Kiln)
1 to 3
28 to 35
20 to 25
12 to 15
25 to 35 Source: CPCB Sector report
10.3.3 As the consumption of energy is less in VSK in comparison to Rotary Kiln (RK), most of the units have changed to VSK. For a modern cement manufacturing unit, the best thermal and electrical energy consumption is as low as 667 kcal per kg of clinker and 68 kWh per mt of cement in India, which is comparable to the global standard of 650 kcal per kg of clinker and 65 kWh per mt of cement. 10.4.4 The consumption of coal and electricity in cement plants is 40mn tonnes and 11.44bn units per annum. The estimated value is Rs 195.5 bn {(4*4000)/5000+(11.44*5)/50}.
10.5 Environmental Issues in Cement Sector 10.5.1 The cement industry is one of the high polluting industries which create very high air pollution. The sector contributes significantly to the air pollution level in the vicinity of the plant as large quantities of pulverised material are handled at each stage of manufacturing from crushing of raw material to finally packing of cement. The impact of pollution due to cement plants on environment is local, i.e. limited to a distance of maximum 10 km from its place of installation61. The regulation till now issued in various countries are all primarily intended to bring the local air pollution under control, in the vicinity as well as inside the factory. The dominating environmental problem in Indian cement plants is the emission of dust to the atmosphere. The Central Pollution Control Board (CPCB) have categorised cement industry under ‘Red Category’ in terms of emission. The standards that has been set under CPCB have been given in the table 10.3 below – 61 Central Pollution Control Board.
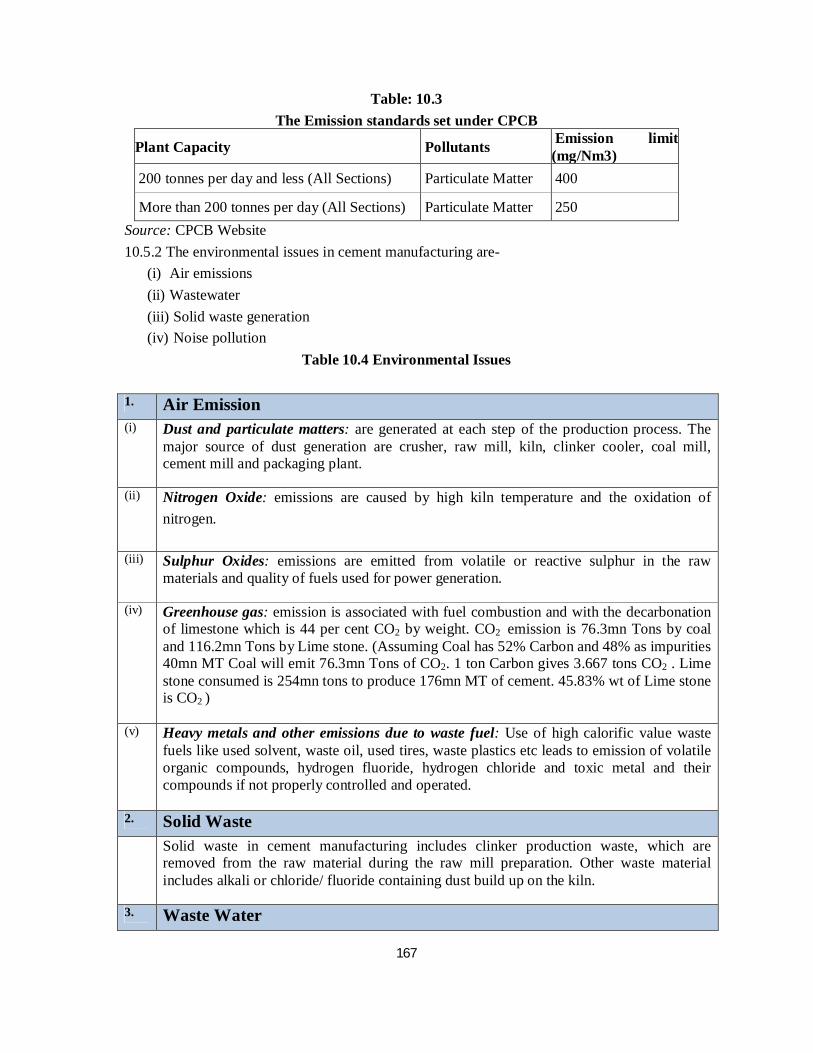
167
Table: 10.3 The Emission standards set under CPCB
Plant Capacity Pollutants Emission limit (mg/Nm3)
200 tonnes per day and less (All Sections) Particulate Matter 400
More than 200 tonnes per day (All Sections) Particulate Matter 250 Source: CPCB Website 10.5.2 The environmental issues in cement manufacturing are-
(i) Air emissions (ii) Wastewater (iii) Solid waste generation (iv) Noise pollution
Table 10.4 Environmental Issues 1. Air Emission (i) Dust and particulate matters: are generated at each step of the production process. The
major source of dust generation are crusher, raw mill, kiln, clinker cooler, coal mill, cement mill and packaging plant.
(ii) Nitrogen Oxide: emissions are caused by high kiln temperature and the oxidation of nitrogen.
(iii) Sulphur Oxides: emissions are emitted from volatile or reactive sulphur in the raw materials and quality of fuels used for power generation.
(iv) Greenhouse gas: emission is associated with fuel combustion and with the decarbonation of limestone which is 44 per cent CO2 by weight. CO2 emission is 76.3mn Tons by coal and 116.2mn Tons by Lime stone. (Assuming Coal has 52% Carbon and 48% as impurities 40mn MT Coal will emit 76.3mn Tons of CO2. 1 ton Carbon gives 3.667 tons CO2 . Lime stone consumed is 254mn tons to produce 176mn MT of cement. 45.83% wt of Lime stone is CO2 )
(v) Heavy metals and other emissions due to waste fuel: Use of high calorific value waste fuels like used solvent, waste oil, used tires, waste plastics etc leads to emission of volatile organic compounds, hydrogen fluoride, hydrogen chloride and toxic metal and their compounds if not properly controlled and operated.
2. Solid Waste Solid waste in cement manufacturing includes clinker production waste, which are
removed from the raw material during the raw mill preparation. Other waste material includes alkali or chloride/ fluoride containing dust build up on the kiln.
3. Waste Water
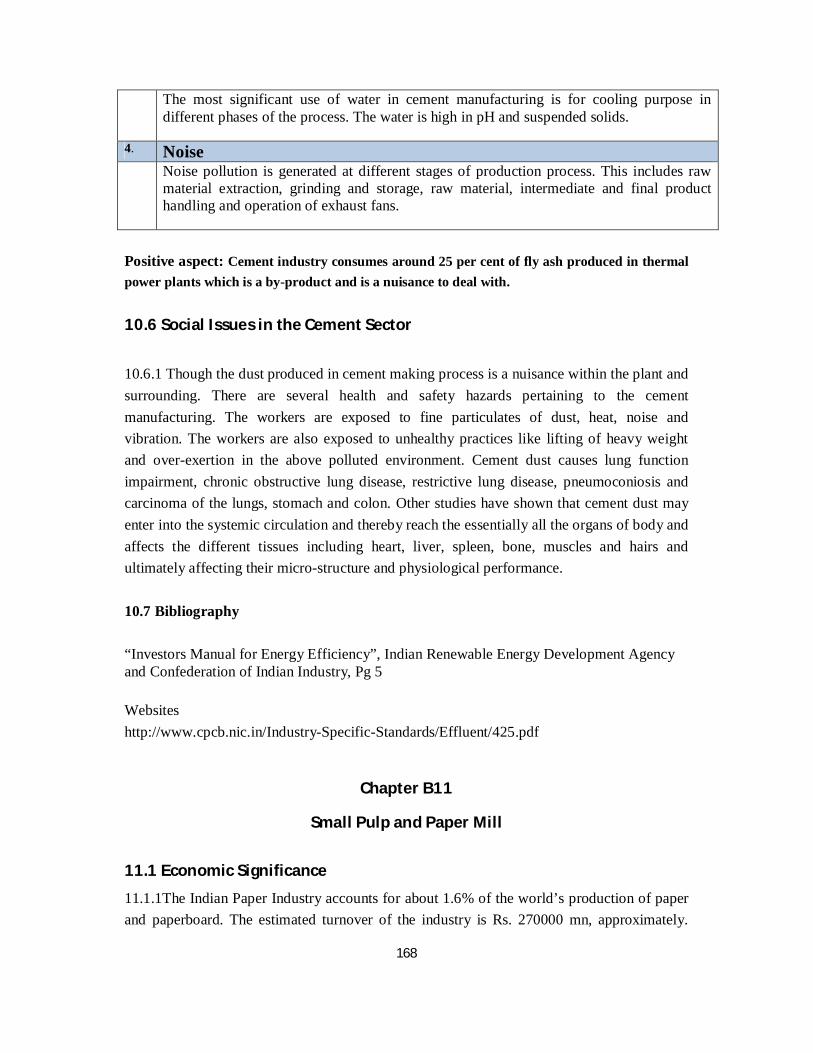
168
The most significant use of water in cement manufacturing is for cooling purpose in different phases of the process. The water is high in pH and suspended solids.
4. Noise Noise pollution is generated at different stages of production process. This includes raw
material extraction, grinding and storage, raw material, intermediate and final product handling and operation of exhaust fans.
Positive aspect: Cement industry consumes around 25 per cent of fly ash produced in thermal power plants which is a by-product and is a nuisance to deal with. 10.6 Social Issues in the Cement Sector
10.6.1 Though the dust produced in cement making process is a nuisance within the plant and surrounding. There are several health and safety hazards pertaining to the cement manufacturing. The workers are exposed to fine particulates of dust, heat, noise and vibration. The workers are also exposed to unhealthy practices like lifting of heavy weight and over-exertion in the above polluted environment. Cement dust causes lung function impairment, chronic obstructive lung disease, restrictive lung disease, pneumoconiosis and carcinoma of the lungs, stomach and colon. Other studies have shown that cement dust may enter into the systemic circulation and thereby reach the essentially all the organs of body and affects the different tissues including heart, liver, spleen, bone, muscles and hairs and ultimately affecting their micro-structure and physiological performance. 10.7 Bibliography
“Investors Manual for Energy Efficiency”, Indian Renewable Energy Development Agency and Confederation of Indian Industry, Pg 5 Websites http://www.cpcb.nic.in/Industry-Specific-Standards/Effluent/425.pdf
Chapter B11
Small Pulp and Paper Mill
11.1 Economic Significance
11.1.1The Indian Paper Industry accounts for about 1.6% of the world’s production of paper and paperboard. The estimated turnover of the industry is Rs. 270000 mn, approximately.
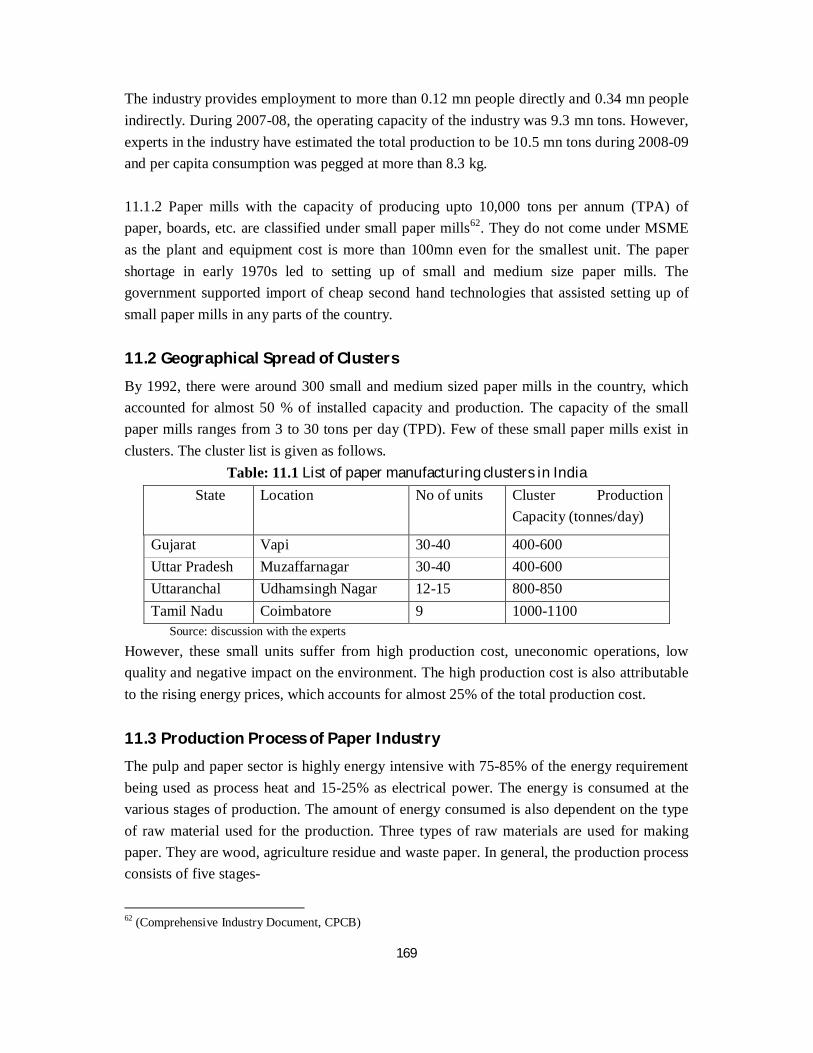
169
The industry provides employment to more than 0.12 mn people directly and 0.34 mn people indirectly. During 2007-08, the operating capacity of the industry was 9.3 mn tons. However, experts in the industry have estimated the total production to be 10.5 mn tons during 2008-09 and per capita consumption was pegged at more than 8.3 kg.
11.1.2 Paper mills with the capacity of producing upto 10,000 tons per annum (TPA) of paper, boards, etc. are classified under small paper mills62. They do not come under MSME as the plant and equipment cost is more than 100mn even for the smallest unit. The paper shortage in early 1970s led to setting up of small and medium size paper mills. The government supported import of cheap second hand technologies that assisted setting up of small paper mills in any parts of the country. 11.2 Geographical Spread of Clusters
By 1992, there were around 300 small and medium sized paper mills in the country, which accounted for almost 50 % of installed capacity and production. The capacity of the small paper mills ranges from 3 to 30 tons per day (TPD). Few of these small paper mills exist in clusters. The cluster list is given as follows.
Table: 11.1 List of paper manufacturing clusters in India State Location No of units Cluster Production
Capacity (tonnes/day)
Gujarat Vapi 30-40 400-600 Uttar Pradesh Muzaffarnagar 30-40 400-600 Uttaranchal Udhamsingh Nagar 12-15 800-850 Tamil Nadu Coimbatore 9 1000-1100
Source: discussion with the experts
However, these small units suffer from high production cost, uneconomic operations, low quality and negative impact on the environment. The high production cost is also attributable to the rising energy prices, which accounts for almost 25% of the total production cost. 11.3 Production Process of Paper Industry
The pulp and paper sector is highly energy intensive with 75-85% of the energy requirement being used as process heat and 15-25% as electrical power. The energy is consumed at the various stages of production. The amount of energy consumed is also dependent on the type of raw material used for the production. Three types of raw materials are used for making paper. They are wood, agriculture residue and waste paper. In general, the production process consists of five stages-
62 (Comprehensive Industry Document, CPCB)
170
11.3.1 Stage 1- Raw material preparation: The conventional raw material for small paper mills comprises rice and wheat straw, bagasse, jute, cotton rags, different types of grasses, waste paper, purchased pulp and occasionally gunny and hessian. In large and medium sized mills wood is the predominant source of cellulose fibre for paper manufacturing. Wood preparation involves breaking wood down into small pieces, i.e. debarking and chipping. This process requires little energy. 11.3.2 Stage 2- Pulping: Pulping can be performed using chemical, mechanical (hydro-pulping) or combined chemical-mechanical techniques. The chemical process involves digestion of raw material like agricultural residue, jute, etc. at high temperature and pressure in the presence of chemicals like sodium hydroxide and/ or lime. The temperature maintained for digesting material is around 150oC and around 1.2-1.5 tonne of steam is required for each tonne of raw material digested. Mechanical process is used for waste and recycled paper. A hydro-pulping unit comprises a high speed rotating disc that chops the paper to fibre in presence of steam. Chemical-mechanical techniques make use of both chemical and mechanical process. The raw material is soaked in 3-5% caustic soda solution at 90oC for 15 to 30 minutes. Large mills that are based on wood as raw material use the Kraft process. 11.3.3 Stage 3- Bleaching: Bleaching is adopted where bleached paper is produced for writing, printing and decorative papers. The chemicals required to bleach are mainly, chlorine, alkali solution, hydrogen peroxide, sodium hydrosulphite etc., which varies according to the type of raw material used for paper manufacturing. In small units, only calcium hypochlorite or bleaching powder is used and the conventional steps are not followed. 11.3.4 Stage 4- Chemical Recovery: Chemical recovery regenerates the spent chemicals used in Kraft chemical pulping. It produces a waste stream of inorganic chemicals and wood residues known as black liquor. The black liquor is concentrated in evaporators and then incinerated in recovery furnaces, many of which are connected to steam turbine cogeneration systems The wood residues provide the fuel and the chemicals are separated as smelt which is then treated to produce sodium hydroxide. Sodium sulphide is also recovered. 11.3.5 Stage 5- Paper Making: Paper making consists of preparation, forming, pressing and drying. During preparation, the pulp is made more flexible through beating, a mechanical pounding and squeezing process. Pigments, dyes, filler materials, and sizing materials are added at this stage. Forming involves spreading the pulp on a screen. The water is removed by pressing and the paper is left to dry. In one of the most common papermaking processes,
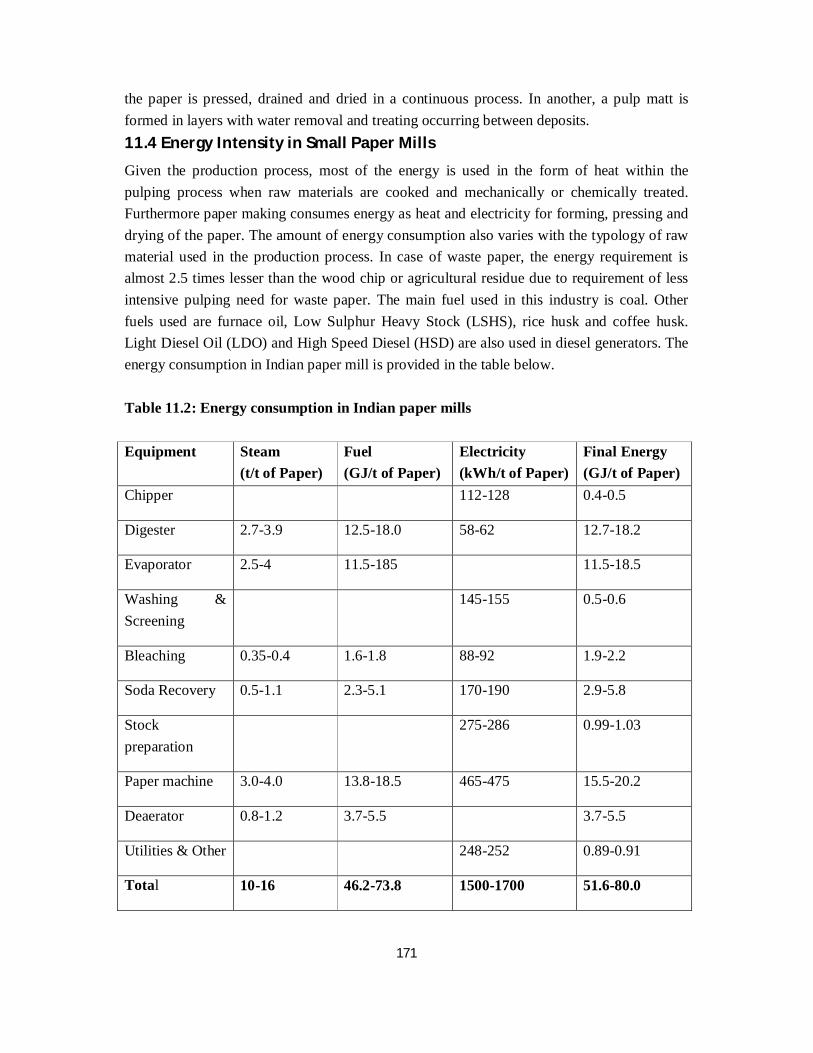
171
the paper is pressed, drained and dried in a continuous process. In another, a pulp matt is formed in layers with water removal and treating occurring between deposits. 11.4 Energy Intensity in Small Paper Mills
Given the production process, most of the energy is used in the form of heat within the pulping process when raw materials are cooked and mechanically or chemically treated. Furthermore paper making consumes energy as heat and electricity for forming, pressing and drying of the paper. The amount of energy consumption also varies with the typology of raw material used in the production process. In case of waste paper, the energy requirement is almost 2.5 times lesser than the wood chip or agricultural residue due to requirement of less intensive pulping need for waste paper. The main fuel used in this industry is coal. Other fuels used are furnace oil, Low Sulphur Heavy Stock (LSHS), rice husk and coffee husk. Light Diesel Oil (LDO) and High Speed Diesel (HSD) are also used in diesel generators. The energy consumption in Indian paper mill is provided in the table below. Table 11.2: Energy consumption in Indian paper mills Equipment Steam
(t/t of Paper) Fuel (GJ/t of Paper)
Electricity (kWh/t of Paper)
Final Energy (GJ/t of Paper)
Chipper 112-128 0.4-0.5
Digester 2.7-3.9 12.5-18.0 58-62 12.7-18.2
Evaporator 2.5-4 11.5-185 11.5-18.5
Washing & Screening
145-155 0.5-0.6
Bleaching 0.35-0.4 1.6-1.8 88-92 1.9-2.2
Soda Recovery 0.5-1.1 2.3-5.1 170-190 2.9-5.8
Stock preparation
275-286 0.99-1.03
Paper machine 3.0-4.0 13.8-18.5 465-475 15.5-20.2
Deaerator 0.8-1.2 3.7-5.5 3.7-5.5
Utilities & Other 248-252 0.89-0.91
Total 10-16 46.2-73.8 1500-1700 51.6-80.0
172
Energy content of the Indian Coal is expressed in "Useful Heating Value" (UHV) basis. Indian coal (non-coking) is classified by grades (A-G) defined on the basis of Useful Heat Value (UHV). UHV is an expression derived from ash and moisture contents for non-coking coals as per the Government of India notification. UHV is defined by the formula: UHV kcal/kg = (8900-138 x [percentage of ash content +percentage of moisture content]) The ash content in Indian coal ranges from 35% to 50%. Average value is 42.5 and moisture is 6% Source: http://www.indopedia.org/Calorific_Value_of_Coal.html
Hence, the total consumption of electricity is 16.80 bn units and that of coal is 84mn tons approximately per annum. The estimated value of total energy consumption is Rs 381.6 bn [{(8.4*4000)/5000) + (16.8*5)/50}*45*100]. The generation of carbon dioxide out of this comes out to be approximately 160.1 mn tons.( (Assuming Coal has 52% Carbon and 48% as impurities 840mn MT Coal will have emission mentioned above. 1 ton Carbon gives 3.667 tons CO2 .)
Since the second grade technology plants were imported, the cost of up gradation is very high and the payback is 6 to 10 years. The huge investment in the old technology has given very less returns due to inefficiencies in the plant. Imported machines of latest technology are exorbitantly high. Fluctuation in the raw material cost has reduced the margin to a very low level and has also impacted the production volume. Economy of scale can be achieved if raw material supply is increased and indigenous technology is developed which is affordable. The payback should not be more than 3 to 4 years.
Several methods have been undertaken by the paper manufacturing industry and government research bodies to reduce cost. They have mainly done some process improvements and technology for indigenous raw material like bagasse, bamboo grass etc developed by scientists of IARI, and CPPRI. 11.5 Environmental Issues in Paper and Pulp making
11.5.1 Global studies have raised very high concern on the effect of paper industry on energy and environment like:
Making a tonne of paper requires 98 tonnes of other resources.
Making a tonne of paper uses as much energy as making a tonne of steel (according to USA Environmental Protection Agency).
Deforestation causes more climate change emissions than global transport. It causes 17.4% of global climate change emissions, transport causes 13%.
In industrial countries, the paper industry is the biggest user of water. Source: (http://www.shrinkpaper.com)
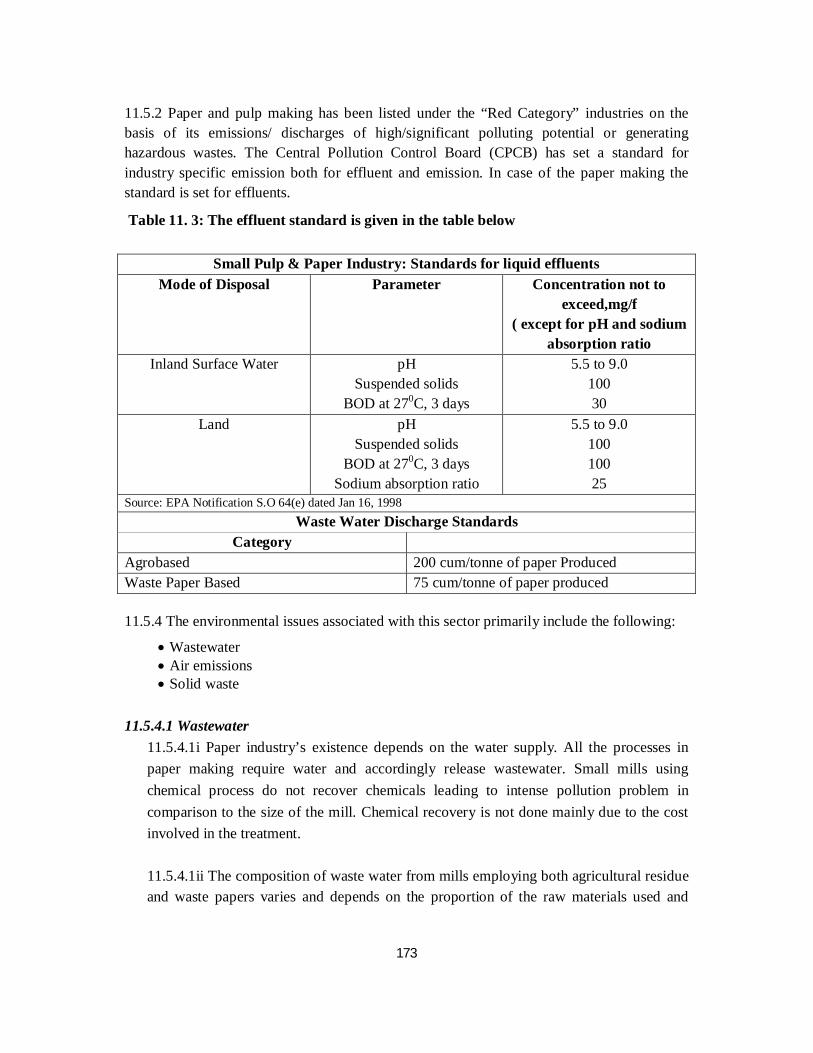
173
11.5.2 Paper and pulp making has been listed under the “Red Category” industries on the basis of its emissions/ discharges of high/significant polluting potential or generating hazardous wastes. The Central Pollution Control Board (CPCB) has set a standard for industry specific emission both for effluent and emission. In case of the paper making the standard is set for effluents.
Table 11. 3: The effluent standard is given in the table below
Small Pulp & Paper Industry: Standards for liquid effluents Mode of Disposal Parameter Concentration not to
exceed,mg/f ( except for pH and sodium
absorption ratio Inland Surface Water pH
Suspended solids BOD at 270C, 3 days
5.5 to 9.0 100 30
Land pH Suspended solids
BOD at 270C, 3 days Sodium absorption ratio
5.5 to 9.0 100 100 25
Source: EPA Notification S.O 64(e) dated Jan 16, 1998 Waste Water Discharge Standards
Category Agrobased 200 cum/tonne of paper Produced Waste Paper Based 75 cum/tonne of paper produced
11.5.4 The environmental issues associated with this sector primarily include the following:
Wastewater Air emissions Solid waste
11.5.4.1 Wastewater 11.5.4.1i Paper industry’s existence depends on the water supply. All the processes in paper making require water and accordingly release wastewater. Small mills using chemical process do not recover chemicals leading to intense pollution problem in comparison to the size of the mill. Chemical recovery is not done mainly due to the cost involved in the treatment.
11.5.4.1ii The composition of waste water from mills employing both agricultural residue and waste papers varies and depends on the proportion of the raw materials used and
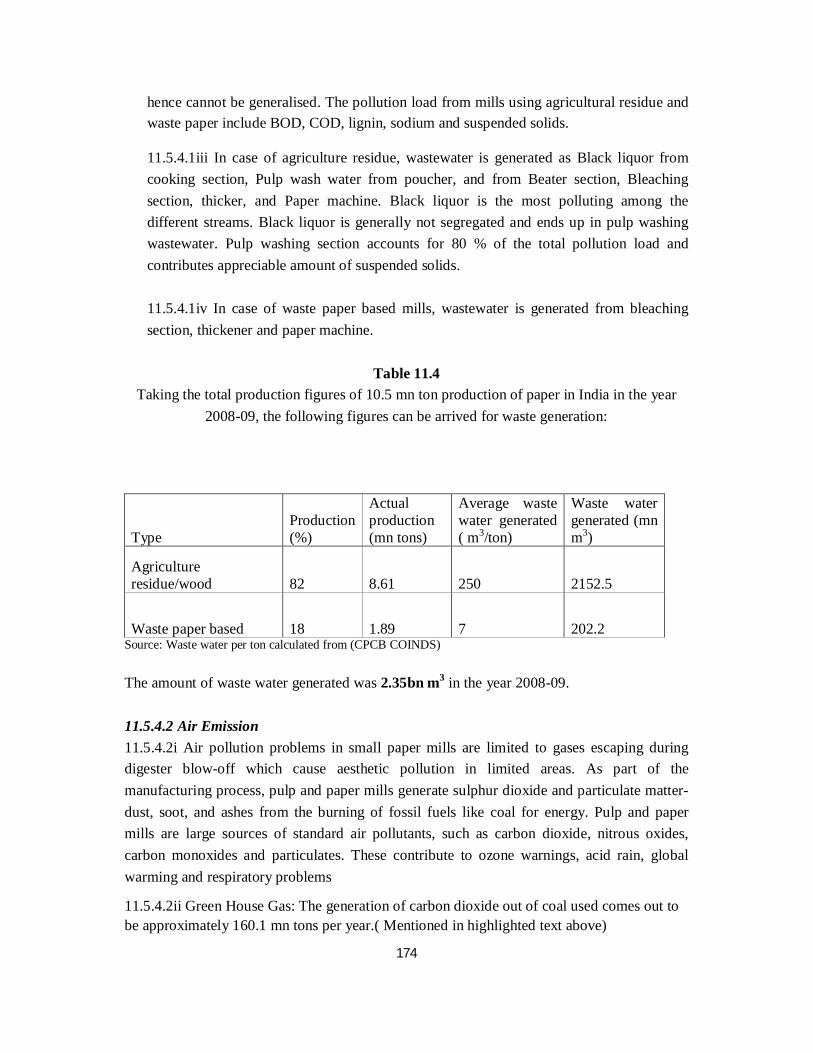
174
hence cannot be generalised. The pollution load from mills using agricultural residue and waste paper include BOD, COD, lignin, sodium and suspended solids.
11.5.4.1iii In case of agriculture residue, wastewater is generated as Black liquor from cooking section, Pulp wash water from poucher, and from Beater section, Bleaching section, thicker, and Paper machine. Black liquor is the most polluting among the different streams. Black liquor is generally not segregated and ends up in pulp washing wastewater. Pulp washing section accounts for 80 % of the total pollution load and contributes appreciable amount of suspended solids. 11.5.4.1iv In case of waste paper based mills, wastewater is generated from bleaching section, thickener and paper machine.
Table 11.4
Taking the total production figures of 10.5 mn ton production of paper in India in the year 2008-09, the following figures can be arrived for waste generation:
Type Production (%)
Actual production (mn tons)
Average waste water generated ( m3/ton)
Waste water generated (mn m3)
Agriculture residue/wood 82 8.61 250 2152.5
Waste paper based 18 1.89 7 202.2 Source: Waste water per ton calculated from (CPCB COINDS)
The amount of waste water generated was 2.35bn m3 in the year 2008-09. 11.5.4.2 Air Emission 11.5.4.2i Air pollution problems in small paper mills are limited to gases escaping during digester blow-off which cause aesthetic pollution in limited areas. As part of the manufacturing process, pulp and paper mills generate sulphur dioxide and particulate matter-dust, soot, and ashes from the burning of fossil fuels like coal for energy. Pulp and paper mills are large sources of standard air pollutants, such as carbon dioxide, nitrous oxides, carbon monoxides and particulates. These contribute to ozone warnings, acid rain, global warming and respiratory problems
11.5.4.2ii Green House Gas: The generation of carbon dioxide out of coal used comes out to be approximately 160.1 mn tons per year.( Mentioned in highlighted text above)
175
11.5.4.3 Solid Waste 11.4.4.3i Waste paper mill sludges originating from different effluent treatment and de-inking installations are complex mixtures of inorganic and organic particles. Due to their favourable physio-chemical, and microbiological characteristics, they may be conveniently reused for different purposes as such or after appropriate pre treatment. Paper fibers can be recycled only a limited number of times before they become too short or weak to make high quality paper. This means the broken, low- quality fibres are separated out to become waste sludge. All the inks, dyes, coatings, pigments, staples and "stickies" (tape, plastic films, etc.) are also washed off the recycled fibres to join the waste solids. The shiny finish on glossy magazine-type paper is produced using a fine kaolin clay coating, which also becomes solid waste during recycling.
11.5.4.3ii Approximately, 0.609 mn ton per annum (58 kg per ton of paper produced) of solid waste is being generated approximately by the Paper industry. (Small and Medium paper mills had 35% share in total production and hence share almost 35 % in solid waste and ash.) This waste is excluding the boiler Ash which is being generated at the rate of 1.3 tonne per tonne of paper produced i.e. 13.6 mn ton Ash per annum. These are dumped in low lying areas. Therefore the total solid waste generated in the paper industry which includes waste from paper , wood residues and ash is 14.2 mn tonnes per annum( 0.609+13.6 mn tonnes per annum)
11.6 Institutional Linkages
11.6.1 The following associations represent this industry: The Indian Paper Manufacturers Association Indian Agro & Recycled Paper Mills Association Central Pulp and Paper Research Institute (CPPRI) ― a premier institute working in
the field of research activities for pulp and paper industry. Department of Paper Technology, IIT, Roorkee. Shree ram Institute of Industrial research ― doing research work in paper technology. Forest Research Institute ― has a paper division to train manpower of the paper
industry. Indian Agriculture Resarch Institute, PUSA. New Delhi. Development Council for Pulp Paper & Allied Industry ― working on projects with
CPPRI and National council of Biomechanics (NCBM). NGOs, like Development Alternative (DA), CSE, Chintan and waiste2wealth ―
contributed in generating awareness for best practices. 11.7 Bibliography

176
“Investors Manual for Energy Efficiency”, Indian Renewable Energy Development Agency and Confederation of Indian Industry, Pg 229
Website
http://www.indopedia.org/Calorific_Value_of_Coal.html http://www.indopedia.org/Calorific_Value_of_Coal.html. (n.d.)
www.shrinkpaper.com