Embed Size (px)
Citation preview

Business Research Methods
William G. Zikmund
Chapter 23
Bivariate Analysis: Measures of Associations

Copyright © 2000 by Harcourt, Inc.
All rights reserved. Requests for permission to make copies of any part
of the work should be mailed to the following address: Permissions
Department, Harcourt, Inc., 6277 Sea Harbor Drive, Orlando, Florida
32887-6777.
Copyright © 2000 by Harcourt, Inc. All rights reserved.
Measures of association
• A general term that refers to a number of bivariate statistical techniques used to measure the strength of a relationship between two variables.

Copyright © 2000 by Harcourt, Inc. All rights reserved.
RELATIONSHIPS AMONG VARIABLES
• CORRELATION ANALYSIS
• BIVARIATE REGRESSION ANALYSIS
Copyright © 2000 by Harcourt, Inc. All rights reserved.
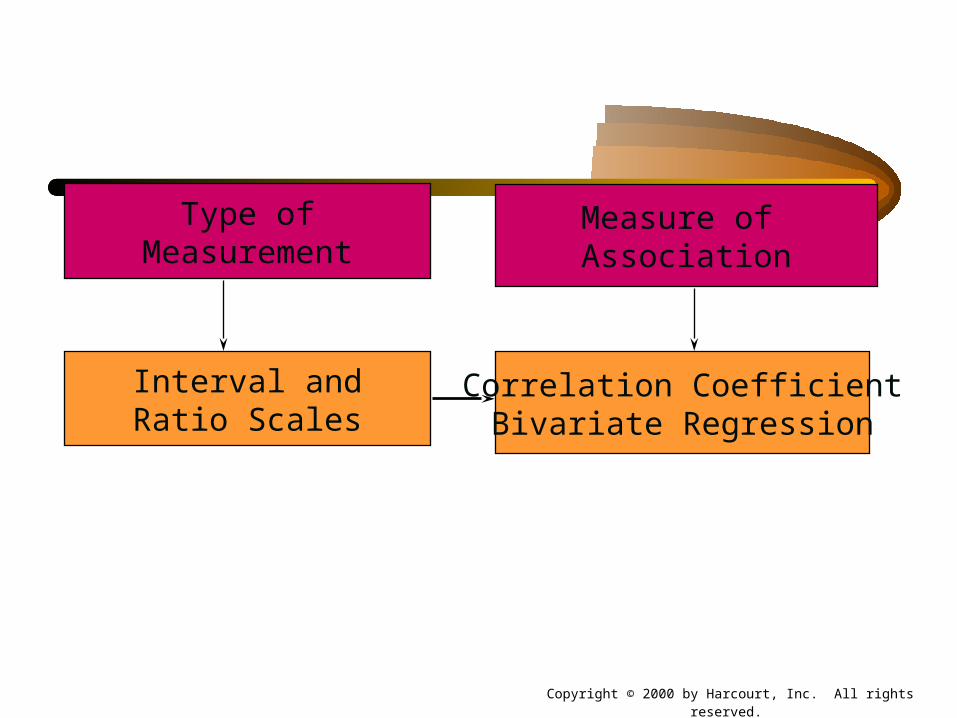
Type ofMeasurement
Measure of Association
Interval andRatio Scales
Correlation CoefficientBivariate Regression

Copyright © 2000 by Harcourt, Inc. All rights reserved.
Type ofMeasurement
Measure of Association
Ordinal Scales Chi-squareRank Correlation
Copyright © 2000 by Harcourt, Inc. All rights reserved.
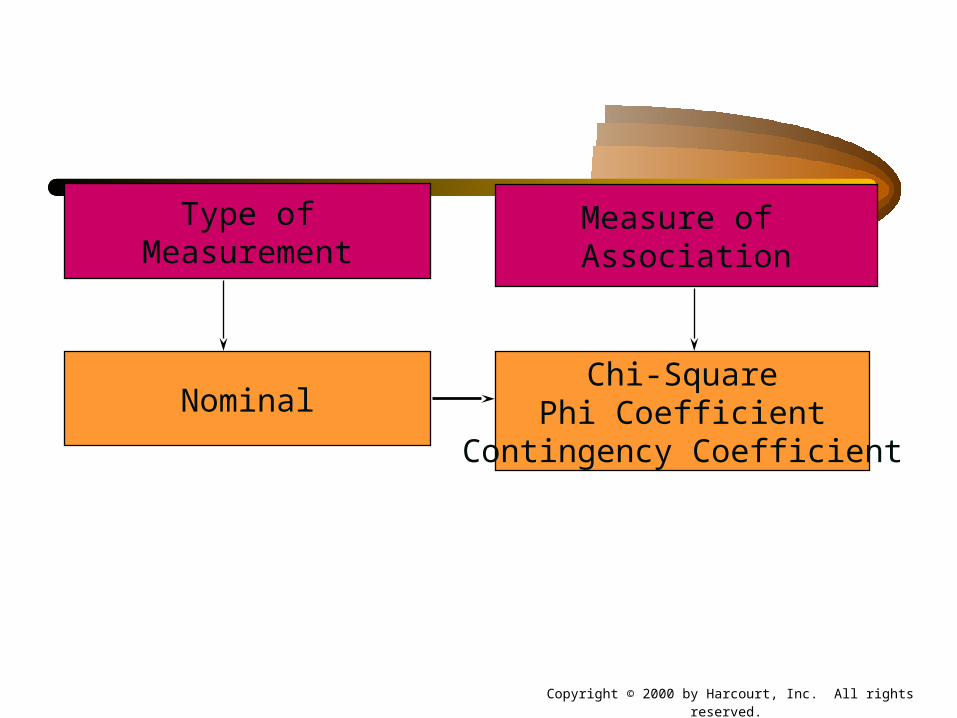
Type ofMeasurement
Measure of Association
NominalChi-Square
Phi CoefficientContingency Coefficient

Copyright © 2000 by Harcourt, Inc. All rights reserved.
Correlation coefficient
• A statistical measure of the covariation or association between two variables.
• Are dollar sales associated with advertising dollar expenditures?

The Correlation coefficient for two variables, X and Y is
xyrCopyright © 2000 by Harcourt, Inc. All rights reserved.
Copyright © 2000 by Harcourt, Inc. All rights reserved.
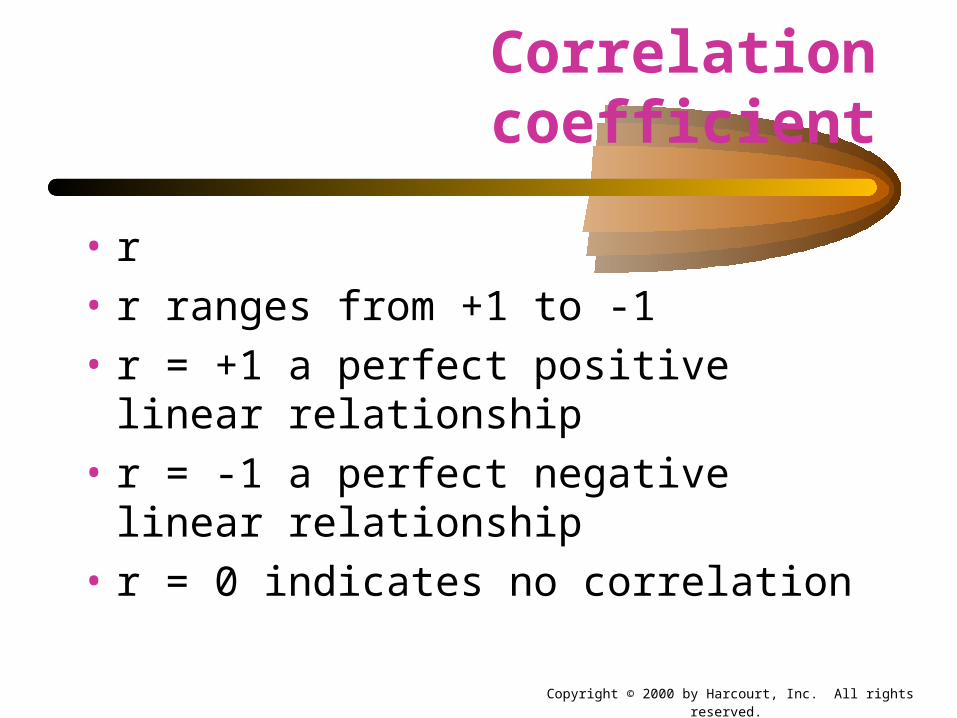
Correlation coefficient
• r
• r ranges from +1 to -1
• r = +1 a perfect positive linear relationship
• r = -1 a perfect negative linear relationship
• r = 0 indicates no correlation
Copyright © 2000 by Harcourt, Inc. All rights reserved.
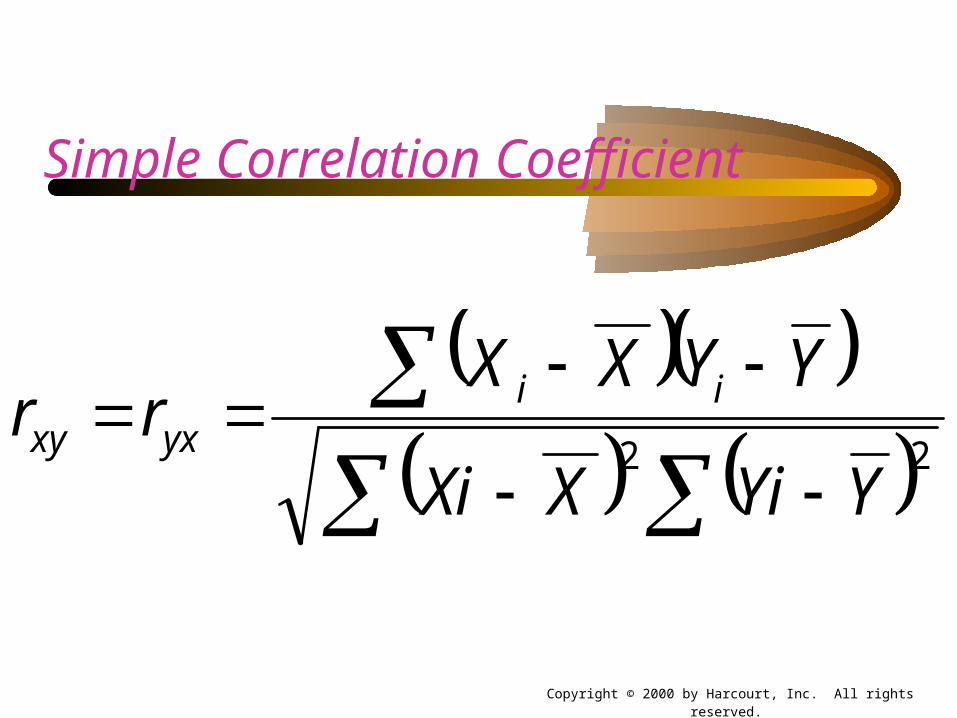
22YYiXXi
YYXXrr ii
yxxy
Simple Correlation Coefficient

Copyright © 2000 by Harcourt, Inc. All rights reserved.
22yx
xyyxxy rr
Simple Correlation Coefficient

Copyright © 2000 by Harcourt, Inc. All rights reserved.
Simple Correlation Coefficient -alternative method
= Variance of X
= Variance of Y
= Covariance of X and Y
2x2y
xy

X
Y CORRELATION PATTERNS
NO CORRELATION
Copyright © 2000 by Harcourt, Inc. All rights reserved.
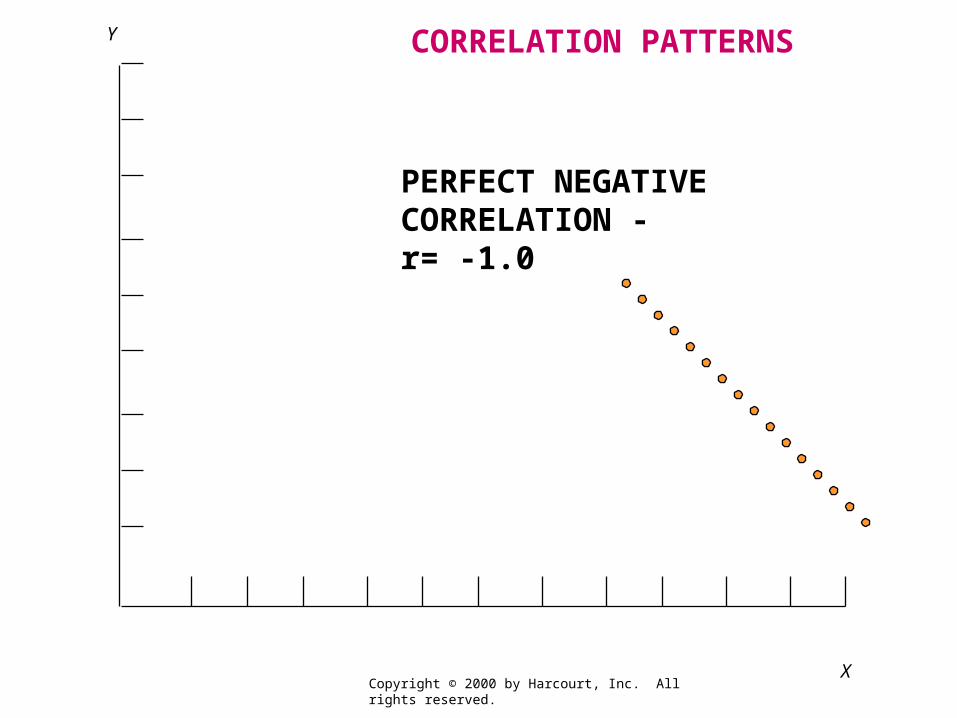
X
Y CORRELATION PATTERNS
PERFECT NEGATIVECORRELATION - r= -1.0
Copyright © 2000 by Harcourt, Inc. All rights reserved.

X
Y CORRELATION PATTERNS
A HIGH POSITIVE CORRELATIONr = +.98
Copyright © 2000 by Harcourt, Inc. All rights reserved.

Copyright © 2000 by Harcourt, Inc. All rights reserved.
589.5837.17
3389.6r
712.99
3389.6 635.
Calculation of r

Copyright © 2000 by Harcourt, Inc. All rights reserved.
Variance
variance2
Total
Explainedr
Coefficient of Determination

Copyright © 2000 by Harcourt, Inc. All rights reserved.
CORRELATION DOES NOT MEAN CAUSATION
• high correlation
• rooster’s crow and the rising of the sun
• rooster does not cause the sun to rise
• teachers’ salaries and the consumption of liquor
• co-vary because they are both influenced by a third variable

Copyright © 2000 by Harcourt, Inc. All rights reserved.
Correlation matrix
• The standard form for reporting correlation results.

Copyright © 2000 by Harcourt, Inc. All rights reserved.
CORRELATION MATRIX
Var1 Var2 Var3
Var1 1.0 0.45 0.31
Var2 0.45 1.0 0.10
Var3 0.31 0.10 1.0
Copyright © 2000 by Harcourt, Inc. All rights reserved.
Walkup’s First Laws of Statistics
• Law No. 1
• Everything correlates with everything, especially when the same individual defines the variables to be correlated.
• Law No. 2
• It won’t help very much to find a good correlation between the variable you are interested in and some other variable that you don’t understand any better.
Copyright © 2000 by Harcourt, Inc. All rights reserved.
Walkup’s First Laws of Statistics
• Law No. 3
• Unless you can think of a logical reason why two variables should be connected as cause and effect, it doesn’t help much to find a correlation between them. In Columbus, Ohio, the mean monthly rainfall correlates very nicely with the number of letters in the names of the months!
Copyright © 2000 by Harcourt, Inc. All rights reserved.
REGRESSION
Going back to previous conditionsGoing back to previous conditions Tall men’s sonsTall men’s sons
DICTIONARYDICTIONARYDEFINITIONDEFINITION
GOING OR GOING OR MOVINGMOVINGBACKWARDBACKWARD

Copyright © 2000 by Harcourt, Inc. All rights reserved.
BIVARIATE REGRESSION
• A MEASURE OF LINEAR ASSOCIATION THAT INVESTIGATES A STRAIGHT LINE RELATIONSHIP
• USEFUL IN FORECASTING

Copyright © 2000 by Harcourt, Inc. All rights reserved.
Bivariate linear regression
• A measure of linear association that investigates a straight-line relationship
• Y = a + X
• where
• Y is the dependent variable
• X is the independent variable
• a and are two constants to be estimated
Copyright © 2000 by Harcourt, Inc. All rights reserved.
Y intercept
a
An intercepted segment of a line
The point at which a regression line intercepts the Y-axis

Copyright © 2000 by Harcourt, Inc. All rights reserved.
Slope
The inclination of a regression line as
compared to a base line
Rise over run
- notation for “a change in”
160
150
140
130
120
110
100
90
80
70 80 90 100 110 120 130 140 150 160 170 180 190X
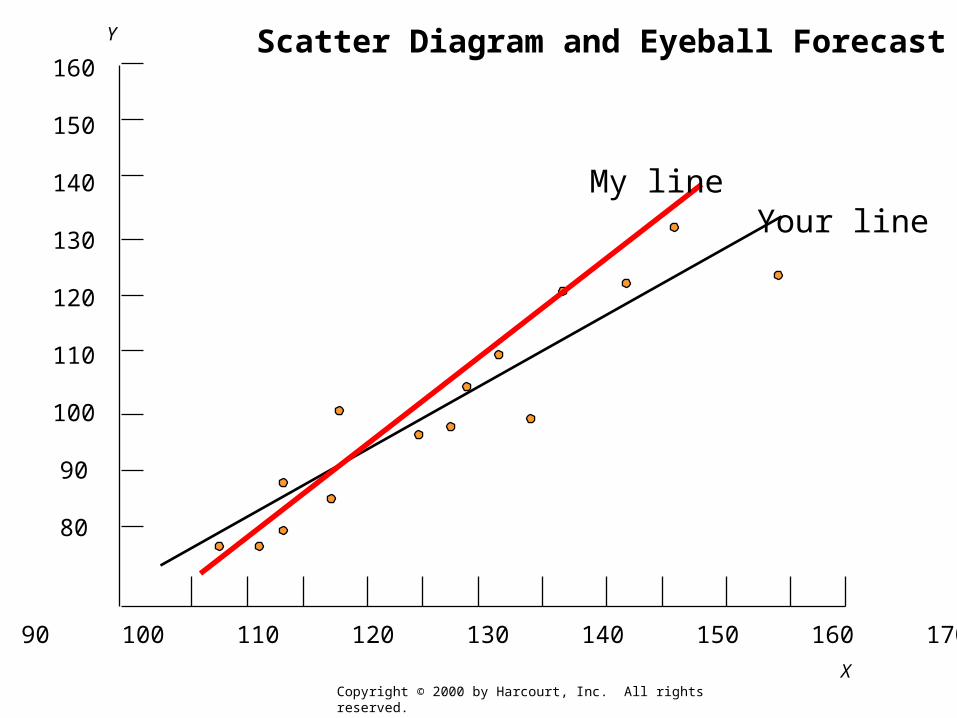
Y Scatter Diagram and Eyeball Forecast
My lineYour line
Copyright © 2000 by Harcourt, Inc. All rights reserved.
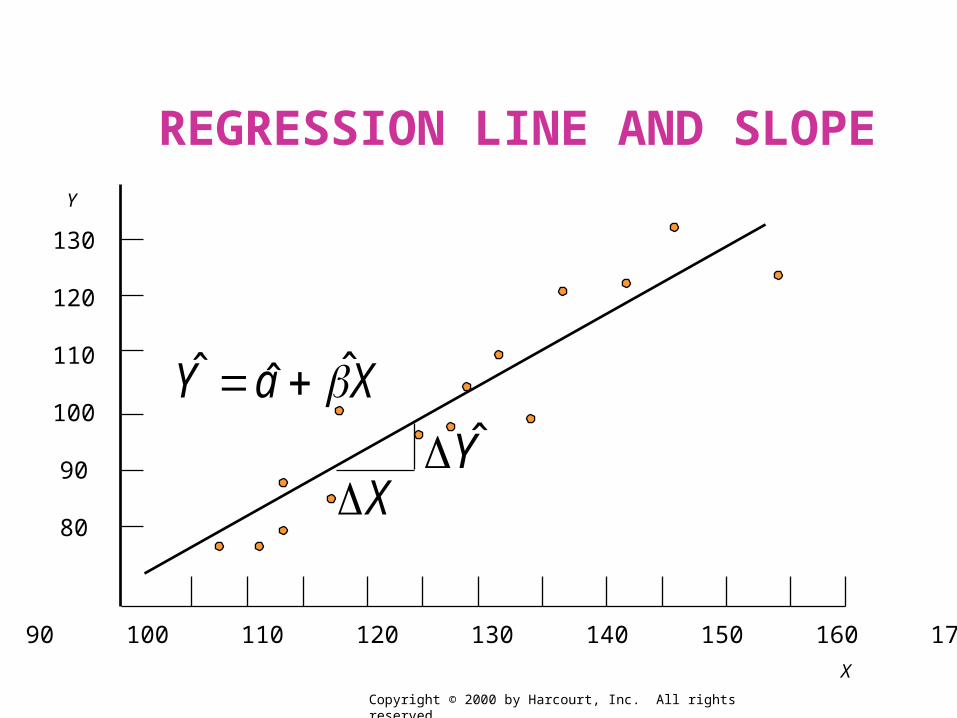
130
120
110
100
90
80
80 90 100 110 120 130 140 150 160 170 180 190X
Y
YX
XaY ˆˆ
REGRESSION LINE AND SLOPE
Copyright © 2000 by Harcourt, Inc. All rights reserved.
160
150
140
130
120
110
100
90
80
70 80 90 100 110 120 130 140 150 160 170 180 190X
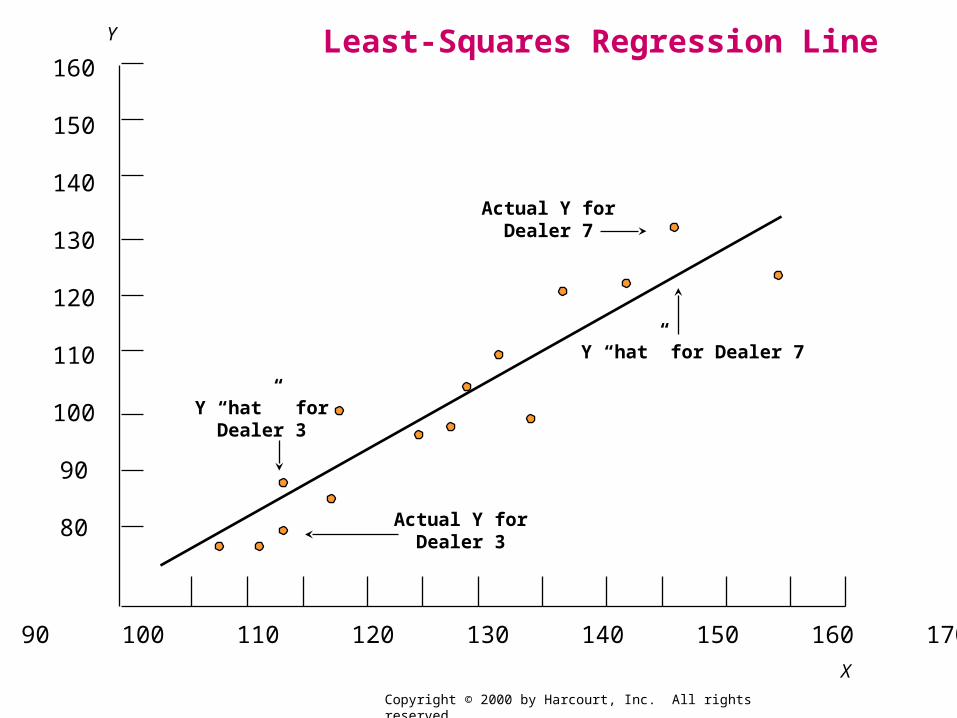
Y
Y “hat” forDealer 3
Actual Y forDealer 7
Y “hat” for Dealer 7
Actual Y forDealer 3
Least-Squares Regression Line
Copyright © 2000 by Harcourt, Inc. All rights reserved.

130
120
110
100
90
80
80 90 100 110 120 130 140 150 160 170 180 190X
Y
}}
{Deviation not explained
Total deviation
Deviation explained by the regression
Y
Scatter Diagram of Explained and Unexplained Variation
Copyright © 2000 by Harcourt, Inc. All rights reserved.
Copyright © 2000 by Harcourt, Inc. All rights reserved.
The least-square method
• uses the criterion of attempting to make the least amount of total error in prediction of Y from X. More technically, the procedure used in the least-squares method generates a straight line that minimizes the sum of squared deviations of the actual values from this predicted regression line.

Copyright © 2000 by Harcourt, Inc. All rights reserved.
The least-square method
• A relatively simple mathematical technique that ensures that the straight line will most closely represent the relationship between X and Y.
Copyright © 2000 by Harcourt, Inc. All rights reserved.
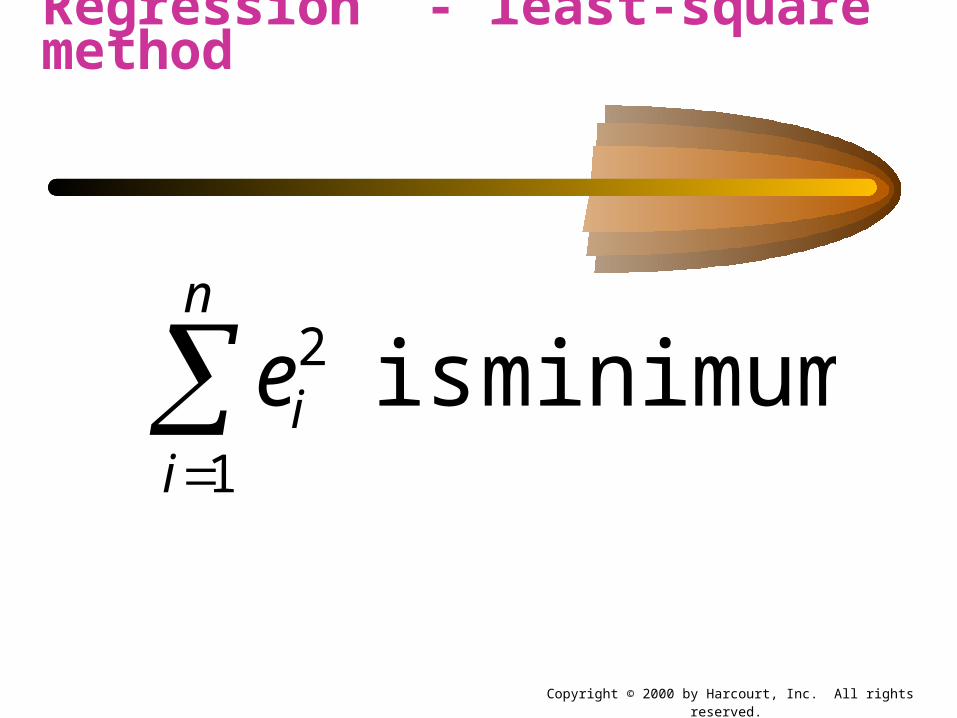
n
iie
1
2 minimumis
Regression - least-square method

Copyright © 2000 by Harcourt, Inc. All rights reserved.
= - (The “residual”)
= actual value of the dependent variable
= estimated value of the dependent variable (Y hat)
n = number of observations
i = number of the observation
ie iY iY
iY
iY

Copyright © 2000 by Harcourt, Inc. All rights reserved.
The logic behind the least-squares technique
• No straight line can completely represent every dot in the scatter diagram
• There will be a discrepancy between most of the actual scores (each dot) and the predicted score
• Uses the criterion of attempting to make the least amount of total error in prediction of Y from X

Copyright © 2000 by Harcourt, Inc. All rights reserved.
XYa ˆ
Bivariate Regression

Copyright © 2000 by Harcourt, Inc. All rights reserved.
22
ˆ
XXn
YXXYn
Bivariate Regression

Copyright © 2000 by Harcourt, Inc. All rights reserved.
= estimated slope of the line (the “regression coefficient”)
= estimated intercept of the y axis
= dependent variable
= mean of the dependent variable
= independent variable
= mean of the independent variable
= number of observations
X
Y
n
a
Y
X

Copyright © 2000 by Harcourt, Inc. All rights reserved.
625,515,3759,24515
875,806,2345,19315ˆ
625,515,3385,686,3
875,806,2175,900,2
760,170
300,93 54638.
Copyright © 2000 by Harcourt, Inc. All rights reserved.
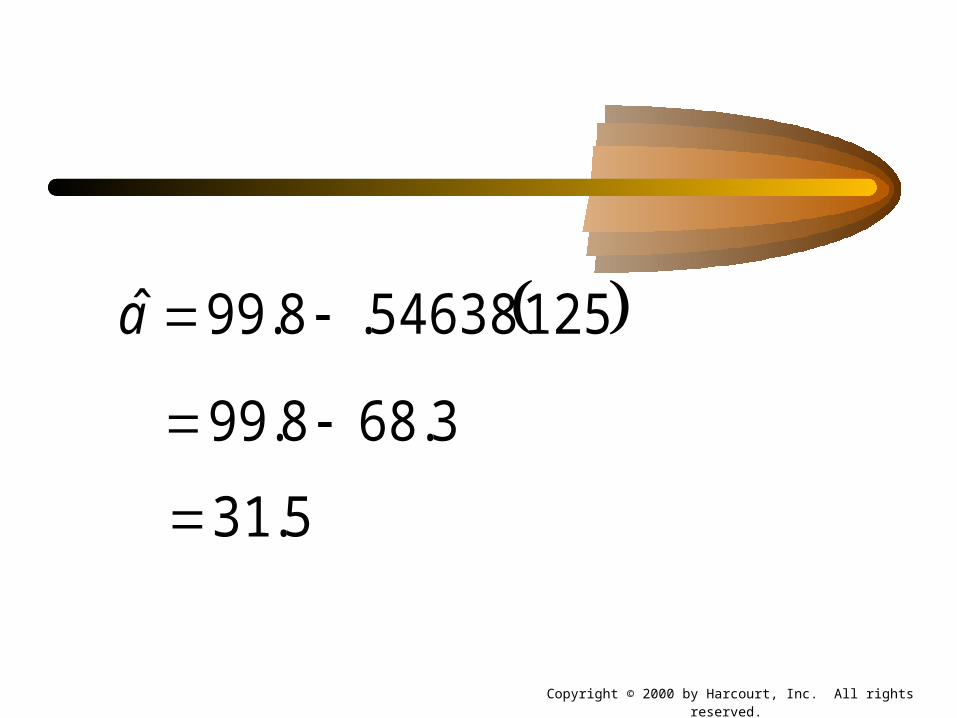
12554638.8.99ˆ a
3.688.99
5.31

Copyright © 2000 by Harcourt, Inc. All rights reserved.
12554638.8.99ˆ a
3.688.99
5.31

Copyright © 2000 by Harcourt, Inc. All rights reserved.
XY 546.5.31ˆ
89546.5.31
6.485.31
1.80

Copyright © 2000 by Harcourt, Inc. All rights reserved.
XY 546.5.31ˆ
89546.5.31
6.485.31
1.80

Copyright © 2000 by Harcourt, Inc. All rights reserved.
165546.5.31ˆ
129) value Y (Actual 7Dealer
7
Y6.121
95546.5.31ˆ
)80 value Y (Actual 3Dealer
3
Y4.83
Copyright © 2000 by Harcourt, Inc. All rights reserved.
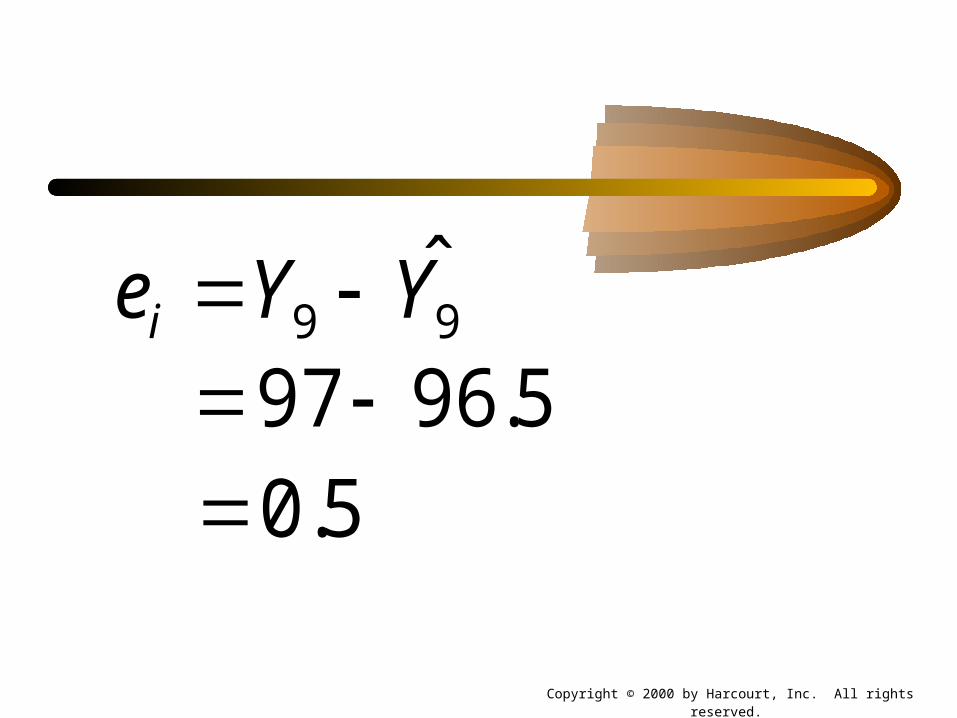
99 YYei 5.9697
5.0

Copyright © 2000 by Harcourt, Inc. All rights reserved.
165546.5.31ˆ
129) value Y (Actual 7Dealer
7
Y6.121
95546.5.31ˆ
)80 value Y (Actual 3Dealer
3
Y4.83

Copyright © 2000 by Harcourt, Inc. All rights reserved.
99 YYei 5.9697
5.0

Copyright © 2000 by Harcourt, Inc. All rights reserved.
119546.5.319 Y

Copyright © 2000 by Harcourt, Inc. All rights reserved.
F-test (regression)
• A procedure to determine whether there is more variability explained by the regression or unexplained by the regression.
• Analysis of variance summary table

Copyright © 2000 by Harcourt, Inc. All rights reserved.
Total deviation can be partitioned into two parts
• Total deviation equals
• Deviation explained by the regression plus
• Deviation unexplained by the regression

Copyright © 2000 by Harcourt, Inc. All rights reserved.
“We are always acting on what has just finished happening. It happened at least 1/30th of a second ago.We think we’re in
the present, but we aren’t. The present we know is only a movie of the past.”
Tom Wolfe in The Electric Kool-Aid Acid Test
.
Copyright © 2000 by Harcourt, Inc. All rights reserved.
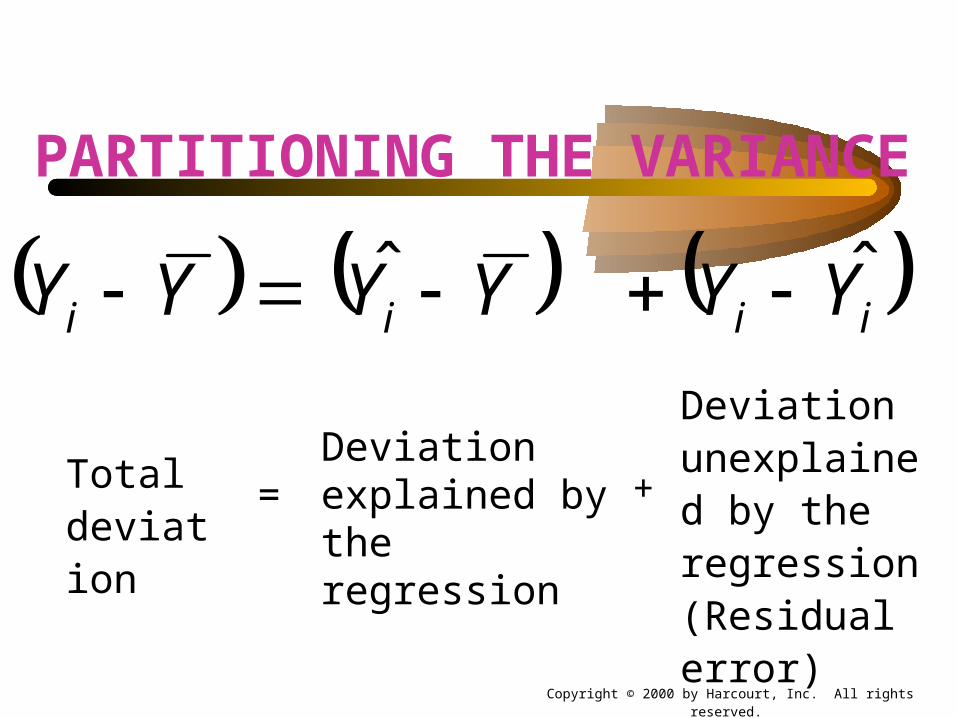
iiii YYYYYY ˆ ˆ
PARTITIONING THE VARIANCE
Total deviation
=Deviation explained by the regression
Deviation unexplained by the regression (Residual error)
+

Copyright © 2000 by Harcourt, Inc. All rights reserved.
= Mean of the total group
= Value predicted with regression equation
= Actual value
Y
Y
iY

Copyright © 2000 by Harcourt, Inc. All rights reserved.
222 ˆ ˆ iiii YYYYYY
Total variation explained
=Explained variation
Unexplained variation (residual)
+
Copyright © 2000 by Harcourt, Inc. All rights reserved.
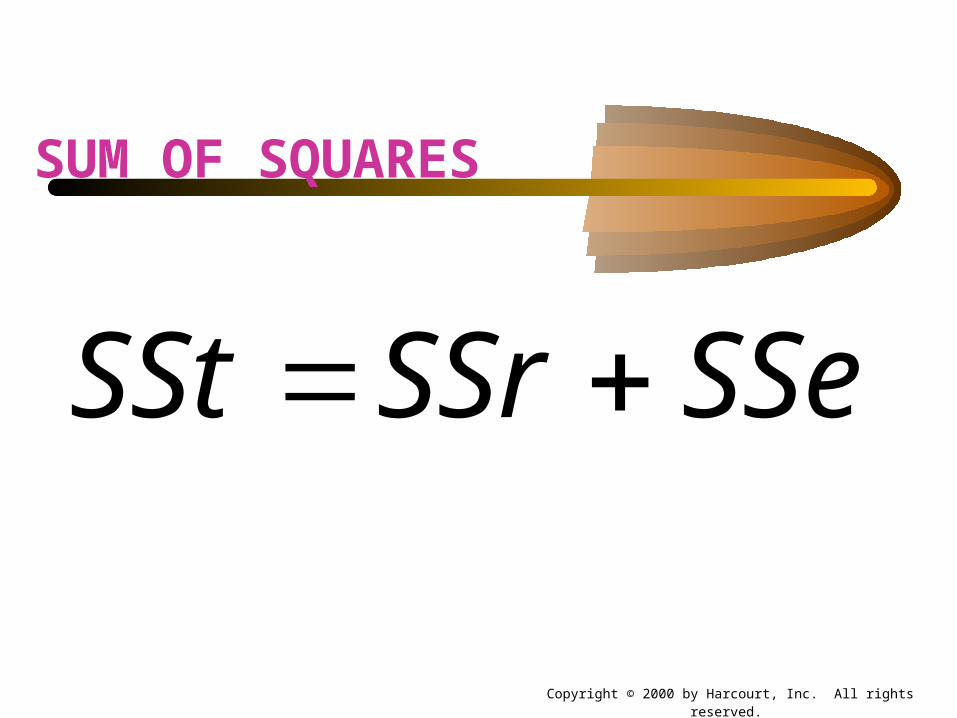
SSeSSrSSt
SUM OF SQUARES

Copyright © 2000 by Harcourt, Inc. All rights reserved.
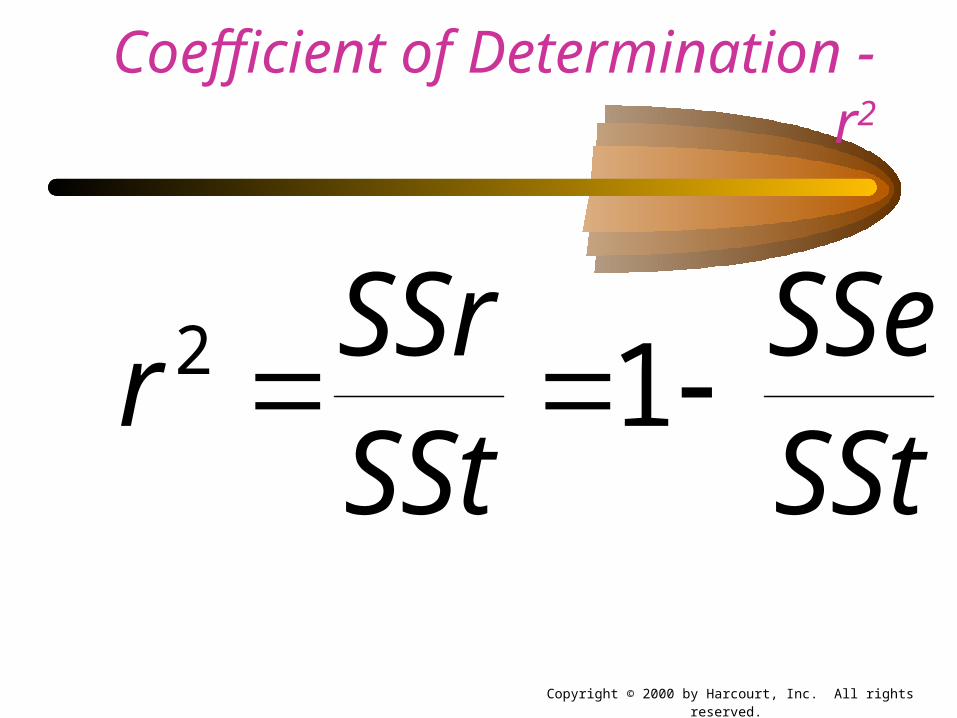
Coefficient of Determination - r2
• the proportion of variance in Y that is explained by X (or vice versa)
• A measure obtained by squaring the correlation coefficient; that proportion of the total variance of a variable that is accounted for by knowing the value of another variable.
Copyright © 2000 by Harcourt, Inc. All rights reserved.
Coefficient of Determination - r2
SStSSe
SStSSr
r 12
Copyright © 2000 by Harcourt, Inc. All rights reserved.
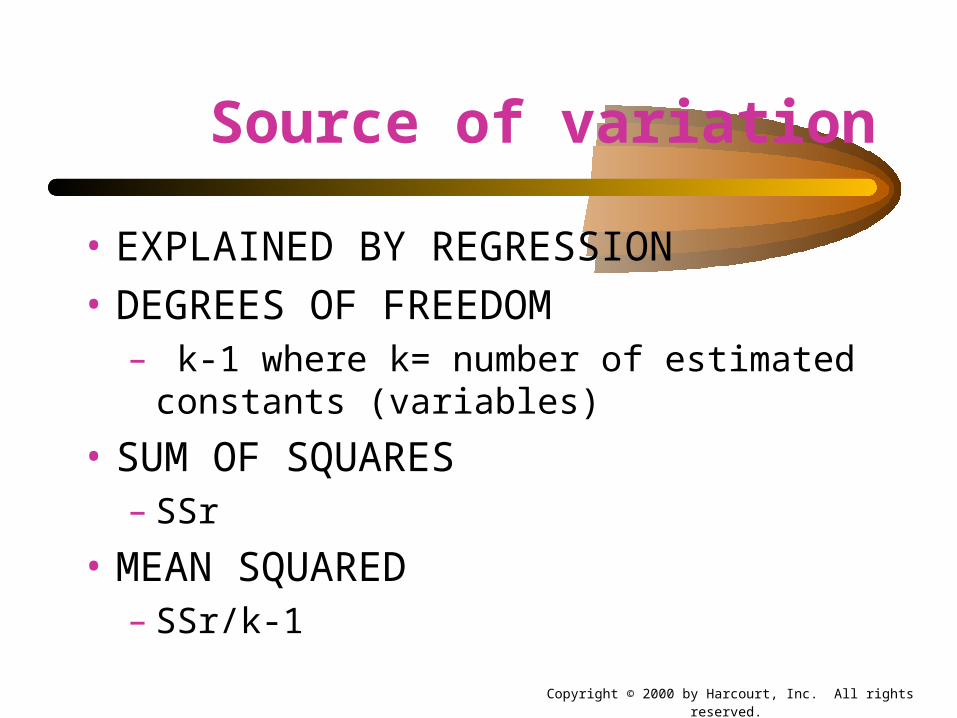
Source of variation
• EXPLAINED BY REGRESSION
• DEGREES OF FREEDOM– k-1 where k= number of estimated constants
(variables)
• SUM OF SQUARES – SSr
• MEAN SQUARED– SSr/k-1
Copyright © 2000 by Harcourt, Inc. All rights reserved.
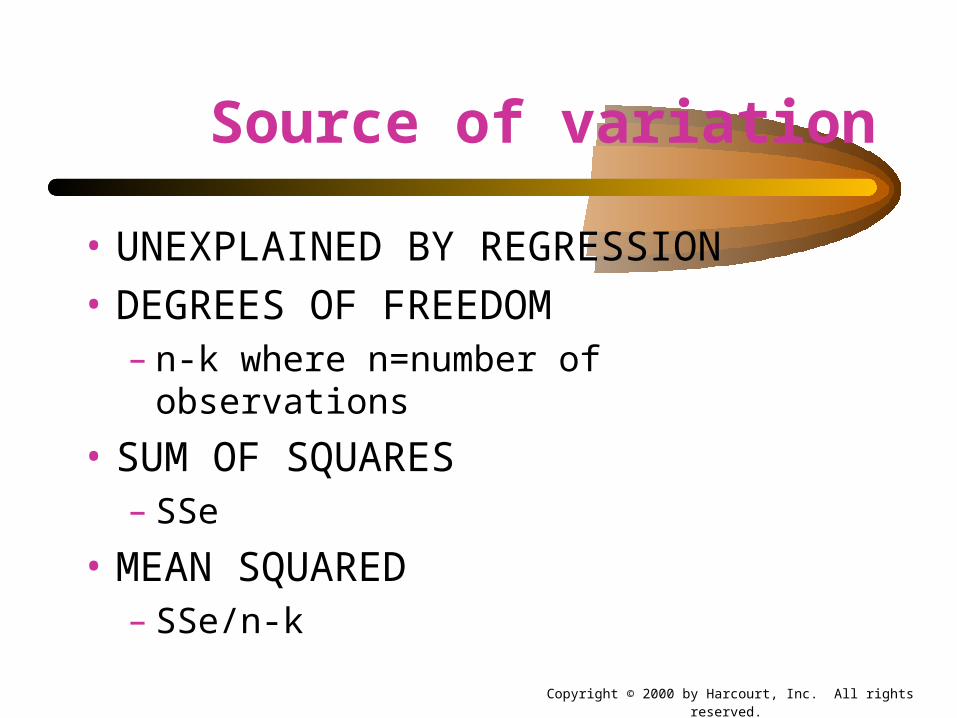
Source of variation
• UNEXPLAINED BY REGRESSION
• DEGREES OF FREEDOM– n-k where n=number of observations
• SUM OF SQUARES – SSe
• MEAN SQUARED– SSe/n-k

Copyright © 2000 by Harcourt, Inc. All rights reserved.
r2 in the example
875.4.882,3
49.398,32 r
Copyright © 2000 by Harcourt, Inc. All rights reserved.
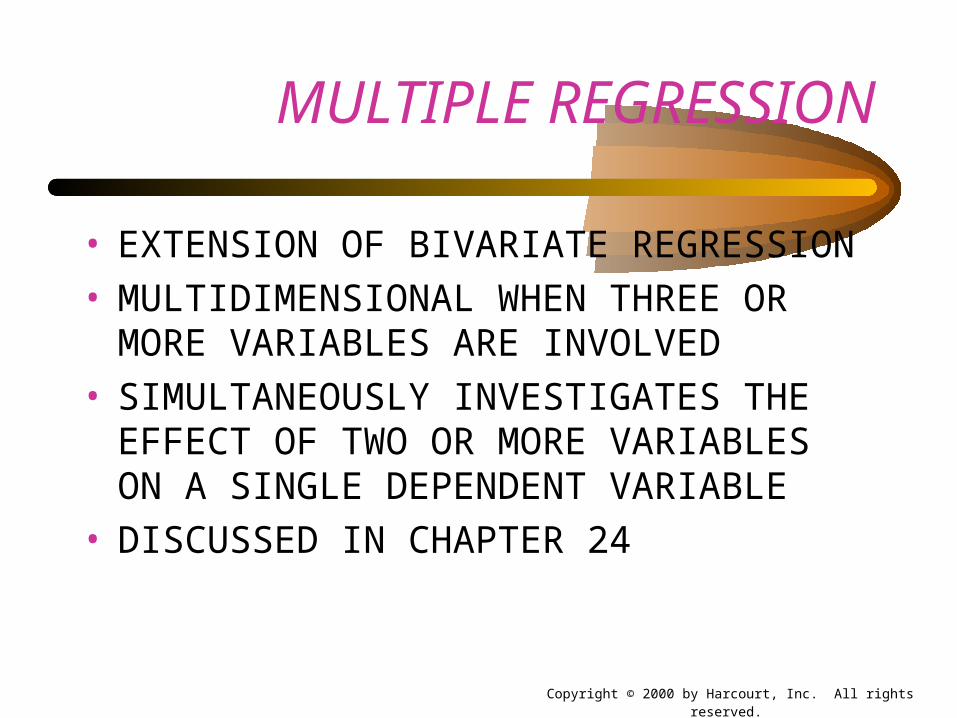
MULTIPLE REGRESSION
• EXTENSION OF BIVARIATE REGRESSION• MULTIDIMENSIONAL WHEN THREE OR
MORE VARIABLES ARE INVOLVED• SIMULTANEOUSLY INVESTIGATES THE
EFFECT OF TWO OR MORE VARIABLES ON A SINGLE DEPENDENT VARIABLE
• DISCUSSED IN CHAPTER 24