Embed Size (px)
Citation preview

Business Report for Fiscal 2009From April 1, 2009, to March 31, 2010
010_0178002982207.indd 1 2010/08/18 11:03:31

Consolidated Financial Review
■Business EnvironmentAlthough the Japanese economy during fiscal 2009 showed some signs of recovery, including progress in inventory adjustments and recovery of exports, the situation remained challenging with continued slump in consumer spending.
■Financial PerformanceUnder these circumstances, our Group had worked to achieve its target profits and strengthen its business structure, based on its policy of improving profitability and increasing overseas sales.
Net sales increased ¥4,317 million or 4.0% to ¥112,037 million compared with the previous year due to the continued growth of sales in Asia despite the impact of the global economic recession.
Gross profit fell ¥567 million or 4.3% to ¥12,761 million due to the decline in gross profit ratio by 1.0 percentage points resulting from weak consumer spending and stronger price awareness by consumers. Thanks to a decrease in selling and general administrative expenses, operating income grew by ¥30 million or 1.8% to ¥1,694 million. Ordinary income declined ¥53 million or 4.2% to ¥1,211 million due to the lower equity in earnings of affiliates. Net income increased ¥411 million, or 99.0%, to ¥827 million.
(Textile business)• Sales of highly functional yarn and it’s textiles for
inner wear increased greatly. Additionally, although sales of inner wear, socks and pantyhose were extremely slow due to slumping consumption, sales have remained strong for our proposals of lingerie and foundation designs based on consumer needs.
• The women’s apparel business faced challenges: although we enhanced our retail business in order to improve revenues, we were unable to escape the effects of the weaker demand. Similarly, revenues from outer wear OEM business remained low, due to falling consumer confidence. Export sales of piece goods for outer wear to Europe and Korea also remained low, due to the continued poor market conditions and strong yen.
As a result of the above, overall net sales for the Textile business increased ¥7,943 million or 9.6% to ¥90,865 million compared with the previous year, and operating income increased ¥408 million or 32.7% to ¥1,658 million.
(Non-textile business)• Sales of machinery and equipment, and industrial
materials such as resin, continued to be low due to continued production adjustments and slumping capital investment. Additionally, sales of chemical
1
010_0178002982207.indd 1 2010/08/18 11:03:38

products in the US declined due to the delayed recovery of the semiconductor market. Meanwhile, sales of raw materials highly differentiated in function for cosmetics remained strong.
• Although sales of products related to plastic-model paints remained strong, sales of toys and furniture fell.
As a result of the above, overall net sales for the Non-textile business decreased ¥3,626 million or 14.6% to ¥21,171 million compared with the previous year, and operating income decreased ¥340 million or 29.5% to ¥812 million.
■Tasks for the FutureThe Group will further improve its business and cost structures. Furthermore, the Group will strive to achieve short-term profit to resume dividend payment as early as possible, while simultaneously aiming to form a basis for medium-term business growth.
1. Improvement in profitability: The Group will promote functional cooperation among the Group companies aiming to build differentiating capabilities and position ourselves apart from the competitors. Such efforts include the development of original products, and offering unique functionality, including cost reductions.
At the same time, the Group will discontinue unprofitable businesses and find new customers in order to improve its profitability.
2. Expansion of overseas markets: The Group will share marketing information across the entire Group on potential markets primarily in the emerging economies of Asia with outstanding growth, as well as markets in the Americas and Europe, and strengthen marketing functions of the overseas operational bases in each region to develop a global supply chain system.
3. Enhancement of risk management: The Group will review all risk factors that may affect the achievement of the Group’s profit plan. At the same time, the Group will enhance its risk management system and improve risk awareness across the entire Group to ensure that the Group will be able to take appropriate actions according to the results of proper analysis and evaluation.
In the nanotechnology business, our materials development using “Carbere,” which is proprietary cup-stacked carbon nanotubes, has been producing some positive results in the fields of composite materials and paint. We will speed up the pace of commercialization in closer cooperation with business partners.
2
010_0178002982207.indd 2 2010/08/18 11:03:38

Textile 90,865 (81.1%)
Non-textile 21,171 (18.9%)
112,037
Financial Performance (Consolidated)
Net Sales (Millions of yen) Ordinary Income (Millions of yen)
Net Assets (Millions of yen) Net Income (Millions of yen)
2009 1,211
2008 1,265
2007 114,932 2007 749
2007 444
2008 107,719
2009 112,037
2009 10,465 2009 827
2008 415
2007 10,020
2008 9,287
Composition of Sales (Consolidated) (Millions of yen)
3
010_0178002982207.indd 3 2010/08/18 11:03:38

Textile 66,170 (81.0%)
Non-textile 15,530 (19.0%)
Textile Fabrics 7,284 (8.9%)
Machinery, Chemicals and Scientific Instruments12,536 (15.3%)
81,701 81,701Inner-wear apparel7,760 (9.5%)
Outer-wear apparel 23,073 (28.3%)
Plastic models and Others2,994 (3.7%)
Sales by Type of Transaction (Non-consolidated)
Exports14,408 (17.6%)
Imports18,203 (22.3%)
Domestic49,089 (60.1%)
Textile Materials28,052 (34.3%)
Financial Performance (Non-consolidated)
Net Sales (Millions of yen)
Net Assets (Millions of yen) Net Income (Millions of yen)
2008 757
2009 451
2008 525
2009 487
2007 96,139 2007 423
2007 8,315 2007 373
2008 86,856
2009 81,701
2008 8,217
2009 9,027
Composition of Sales (Non-consolidated) (Millions of yen)
Ordinary Income (Millions of yen)
4
010_0178002982207.indd 4 2010/08/18 11:03:39

Consolidated Financial Statements
Consolidated Balance Sheets
(Millions of yen)
2009From April 1, 2009,to March 31, 2010
2008From April 1, 2008,to March 31, 2009
Cash flows from operating activities 3,141 573
Cash flows from investing activities (159) (612)Cash flows from financing activities (1,550) (291)Effect of exchange rate changes on cash and cash equivalents 17 (110)
Net increase (decrease) in cash and cash equivalents 1,448 (440)
Cash and cash equivalents at the beginning of the year 8,389 8,888
Decrease in cash and cash equivalents due to exclusion of subsidiaries from consolidation — (58)
Cash and cash equivalents at the end of the year 9,838 8,389
Consolidated Statements of Cash Flows
2009As of March 31, 2010
2008As of March 31, 2009
AssetsCurrent assets 42,968 42,710
Cash and cash equivalents 9,838 8,389Trade notes and accounts receivable 24,709 24,359Inventories 7,777 8,961 Other current assets 1,104 1,474Allowance for doubtful accounts (461) (475)
Fixed assets 11,001 11,240Tangible fixed assets 5,688 5,686
Land 3,615 3,634Other tangible fixed assets 2,072 2,052
Intangible fixed assets 81 136Goodwill — 60Other intangible assets 81 76
Investments and other assets 5,232 5,417Investment securities 2,189 1,936Other investments 3,042 3,481
Total assets 53,970 53,951
LiabilitiesCurrent liabilities 41,448 42,692
Trade notes and accounts payable 16,869 16,217Short-term loans payable 21,747 23,341Current portion of long-term loans payable 122 75Income taxes payable 236 105Reserve for bonuses 324 272Reserve for extraordinary loss on withdrawal from business 49 298
Other current liabilities 2,096 2,381Long-term liabilities 2,056 1,971
Long-term loans payable 582 528Reserve for retirement benefits 1,318 1,297Other long-term liabilities 155 145
Total liabilities 43,504 44,663
Net assetsShareholders’ equity 11,306 10,480
Common stock 7,186 7,186Capital surplus 908 908Retained earnings 3,264 2,436Treasury stock (52) (51)
Valuation and translation adjustments (932) (1,286)Net unrealized gain on other securities (407) (714)Deferred gains or losses on hedges 3 (15)Foreign currency translation adjustment (528) (555)
Minority interests 90 93
Total net assets 10,465 9,287
Total liabilities and net assets 53,970 53,951
(Millions of yen) (Millions of yen)2009
From April 1, 2009,to March 31, 2010
2008From April 1, 2008,to March 31, 2009
Net sales 112,037 107,719
Cost of sales 99,275 94,389
Gross profit 12,761 13,329
Selling and general administrative expenses 11,067 11,665
Operating income 1,694 1,664
Non-operating income 282 455
Non-operating expenses 764 854
Ordinary income 1,211 1,265
Extraordinary gains 55 106
Gain on sales of investment securities 0 43
Other extraordinary gains 55 63
Extraordinary losses 136 848Loss on bad debt and provision for doubtful accounts 71 63
Loss on devaluation of investment securities 58 352
Extraordinary loss on withdrawal from business — 387
Other extraordinary losses 6 45
Income before income taxes 1,131 523
Income taxes-current 314 181
Income taxes-deferred (16) (167)
Minority interests 4 93
Net income 827 415
Consolidated Statements of Income
5
010_0178002982207.indd 5 2010/08/18 11:03:40
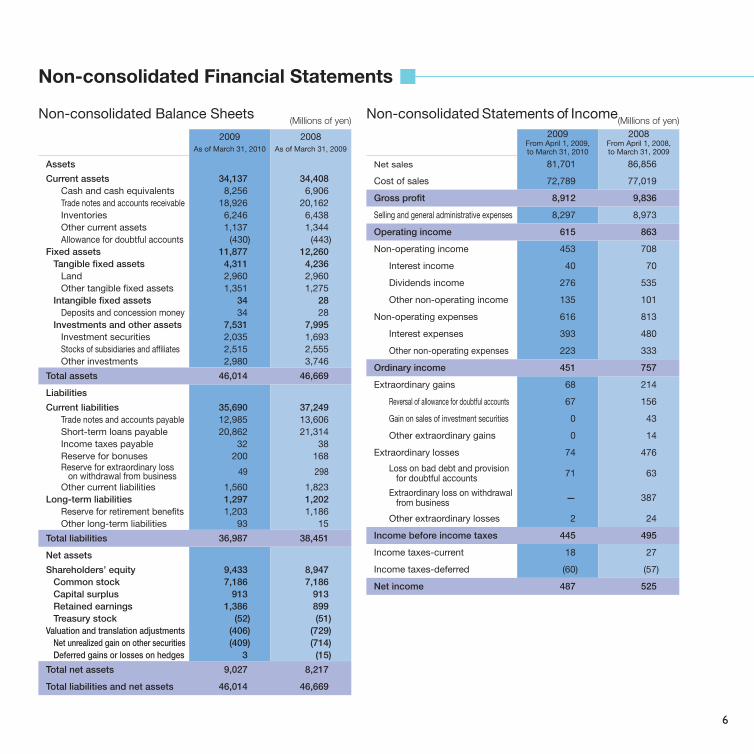
Non-consolidated Balance Sheets
2009As of March 31, 2010
2008As of March 31, 2009
Assets
Current assets 34,137 34,408Cash and cash equivalents 8,256 6,906Trade notes and accounts receivable 18,926 20,162Inventories 6,246 6,438Other current assets 1,137 1,344Allowance for doubtful accounts (430) (443)
Fixed assets 11,877 12,260Tangible fixed assets 4,311 4,236
Land 2,960 2,960Other tangible fixed assets 1,351 1,275
Intangible fixed assets 34 28Deposits and concession money 34 28
Investments and other assets 7,531 7,995Investment securities 2,035 1,693Stocks of subsidiaries and affiliates 2,515 2,555Other investments 2,980 3,746
Total assets 46,014 46,669
Liabilities
Current liabilities 35,690 37,249Trade notes and accounts payable 12,985 13,606Short-term loans payable 20,862 21,314Income taxes payable 32 38Reserve for bonuses 200 168Reserve for extraordinary loss on withdrawal from business 49 298
Other current liabilities 1,560 1,823Long-term liabilities 1,297 1,202
Reserve for retirement benefits 1,203 1,186Other long-term liabilities 93 15
Total liabilities 36,987 38,451
Net assets
Shareholders’ equity 9,433 8,947Common stock 7,186 7,186Capital surplus 913 913Retained earnings 1,386 899Treasury stock (52) (51)
Valuation and translation adjustments (406) (729)Net unrealized gain on other securities (409) (714)Deferred gains or losses on hedges 3 (15)
Total net assets 9,027 8,217
Total liabilities and net assets 46,014 46,669
(Millions of yen)
Non-consolidated Financial Statements
(Millions of yen)2009
From April 1, 2009,to March 31, 2010
2008From April 1, 2008,to March 31, 2009
Net sales 81,701 86,856
Cost of sales 72,789 77,019
Gross profit 8,912 9,836
Selling and general administrative expenses 8,297 8,973
Operating income 615 863
Non-operating income 453 708
Interest income 40 70
Dividends income 276 535
Other non-operating income 135 101
Non-operating expenses 616 813
Interest expenses 393 480
Other non-operating expenses 223 333
Ordinary income 451 757
Extraordinary gains 68 214
Reversal of allowance for doubtful accounts 67 156
Gain on sales of investment securities 0 43
Other extraordinary gains 0 14
Extraordinary losses 74 476
Loss on bad debt and provision for doubtful accounts 71 63
Extraordinary loss on withdrawal from business — 387
Other extraordinary losses 2 24
Income before income taxes 445 495
Income taxes-current 18 27
Income taxes-deferred (60) (57)
Net income 487 525
Non-consolidated Statements of Income
6
010_0178002982207.indd 6 2010/08/18 11:03:40

Corporate Overview (as of March 31, 2010)
In addition to the principal textile businesses handling products ranging from yarn to garments, the Group is engaged in non-textile businesses including machinery, chemicals and other merchandise.
Business segment Principal merchandise
Textile businessNatural yarn and synthetic fiber, textile, inner wear, socks, women’s wear, men’s wear, etc.
Non-textile businessMachinery, chemicals, scientific instruments, paper tubes, plastic models and related products, fireworks, property management services, etc.
Principal Businesses
Head Office 3-1, Kudan-minami 2-chome, Chiyoda-ku, Tokyo
Osaka Branch OMM Bldg., 7-31, Otemae 1-chome, Chuo-ku, Osaka
Offices Yanagibashi (Taito-ku, Tokyo), Gotanda (Shinagawa-ku, Tokyo), Fukuoka (Hakata-ku, Fukuoka), Hokuriku (Fukui-shi, Fukui),Nano Carbon Development Center (Kawasaki-ku, Kawasaki)
Overseas office Shanghai
Overseas subsidiaries
and affiliates
Subsidiaries in New York, Dusseldorf, Sao Paulo, Hong Kong, Beijing, Shanghai,
Shenzhen and Seoul; joint venture companies elsewhere
Offices
CreditorBalances of borrowings
(Millions of yen)
The Mizuho Bank, Ltd. 7,176
The Bank of Tokyo-Mitsubishi UFJ, Ltd. 7,176
The Norinchukin Bank 2,900
Sumitomo Mitsui Banking Corporation 1,700
Major Creditors
7
010_0178002982207.indd 7 2010/08/18 11:03:42

Shares
(1) Total number of shares authorized to be issued: 200,000,000 shares(2) Total number of shares issued and outstanding: 64,371,191 shares (excluding 278,524 treasury stocks)(3) Number of shareholders: 7,679(4) Major shareholders (Top 10)
Shareholder’s name
Investment in the Companyby the Shareholders
Number of shares(Thousand shares)
Shareholding(%)
Gunze Ltd. 9,321 14.48The Mizuho Bank, Ltd. 3,182 4.94The Bank of Tokyo-Mitsubishi UFJ, Ltd. 3,172 4.93Nippon Life Insurance Company 2,586 4.02Toray Industries, Inc. 1,982 3.08The Master Trust Bank of Japan, Ltd. (Trust Account) 1,730 2.69Nipponkoa Insurance Co., Ltd. 1,119 1.74JPMorgan Chase Bank 385107 702 1.09Japan Securities Finance Co., Ltd. 682 1.06GSI Creos Customers’ Stockholding Association 628 0.98
Notes: Shareholding is calculated by excluding 278,524 treasury stocks and rounded off to two decimal places.
Notes:1. Figures shown above exclude employees transferred from the Group to outside the Group, but include employees transferred to the
Group from outside the Group.2. Figures shown above exclude 121 persons of contract workers, foreign national employees overseas, and employees transferred
outside the Group.3. “Corporate (common)” figures denote the number of employees who do not belong to any specific business segment.
Business segment Number of employees Change from the end of the previous fiscal year
Textile business 229 15
Non-textile business 173 1
Corporate (common) 102 —
Total 504 16
Employees
Number of employees of GSI Creos Group
8
010_0178002982207.indd 8 2010/08/18 11:03:42
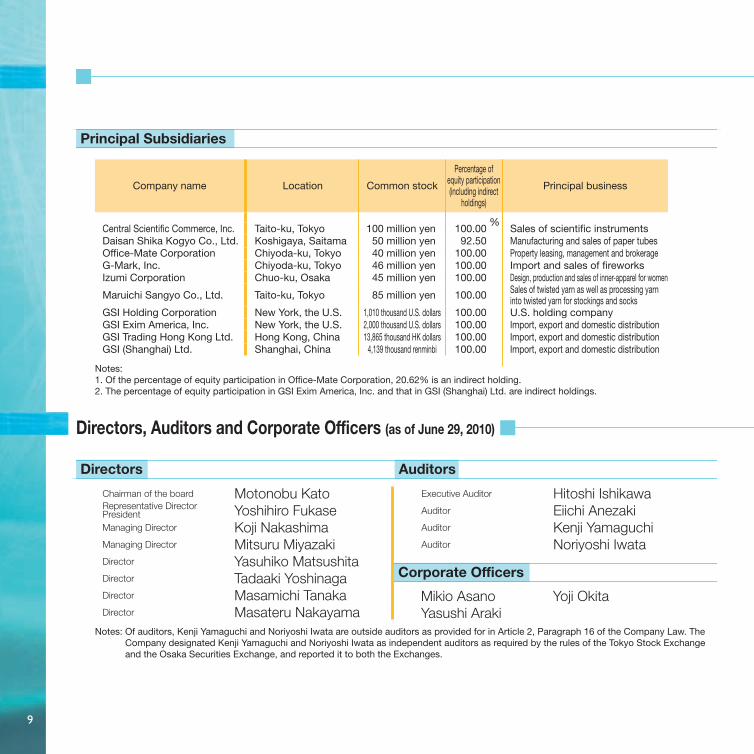
Notes:1. Of the percentage of equity participation in Office-Mate Corporation, 20.62% is an indirect holding.2. The percentage of equity participation in GSI Exim America, Inc. and that in GSI (Shanghai) Ltd. are indirect holdings.
Principal Subsidiaries
Company name Location Common stock
Percentage of equity participation (including indirect
holdings)
Principal business
%Central Scientific Commerce, Inc. Taito-ku, Tokyo 100 million yen 100.00 Sales of scientific instrumentsDaisan Shika Kogyo Co., Ltd. Koshigaya, Saitama 50 million yen 92.50 Manufacturing and sales of paper tubesOffice-Mate Corporation Chiyoda-ku, Tokyo 40 million yen 100.00 Property leasing, management and brokerageG-Mark, Inc. Chiyoda-ku, Tokyo 46 million yen 100.00 Import and sales of fireworksIzumi Corporation Chuo-ku, Osaka 45 million yen 100.00 Design, production and sales of inner-apparel for women
Maruichi Sangyo Co., Ltd. Taito-ku, Tokyo 85 million yen 100.00 Sales of twisted yarn as well as processing yarn into twisted yarn for stockings and socks
GSI Holding Corporation New York, the U.S. 1,010 thousand U.S. dollars 100.00 U.S. holding companyGSI Exim America, Inc. New York, the U.S. 2,000 thousand U.S. dollars 100.00 Import, export and domestic distributionGSI Trading Hong Kong Ltd. Hong Kong, China 13,865 thousand HK dollars 100.00 Import, export and domestic distributionGSI (Shanghai) Ltd. Shanghai, China 4,139 thousand renminbi 100.00 Import, export and domestic distribution
Directors, Auditors and Corporate Officers (as of June 29, 2010)
Directors Auditors
Notes: Of auditors, Kenji Yamaguchi and Noriyoshi Iwata are outside auditors as provided for in Article 2, Paragraph 16 of the Company Law. The Company designated Kenji Yamaguchi and Noriyoshi Iwata as independent auditors as required by the rules of the Tokyo Stock Exchange and the Osaka Securities Exchange, and reported it to both the Exchanges.
Chairman of the board Motonobu KatoRepresentative DirectorPresident Yoshihiro FukaseManaging Director Koji NakashimaManaging Director Mitsuru MiyazakiDirector Yasuhiko MatsushitaDirector Tadaaki YoshinagaDirector Masamichi TanakaDirector Masateru Nakayama
Executive Auditor Hitoshi IshikawaAuditor Eiichi AnezakiAuditor Kenji YamaguchiAuditor Noriyoshi Iwata
Mikio Asano Yoji OkitaYasushi Araki
Corporate Officers
9
010_0178002982207.indd 9 2010/08/18 11:03:44

In November 2008, we opened the first retail store “Cross Site” in the city of Yokohama. We then began opening stores primarily in non-metropolitan cities, and by the end of March 2010 had opened a total of 20 stores. Cross Site targets shoppers in their 40s to 60s, and offers select brands of women’s apparel, with a focus on the company brands NONA and dusol-ciel.
A product planning team, a buyer team, and store managers collaborate to respond to increasingly diverse customer lifestyles, changes in fashion trends and differences in needs due to regional characteristics. The stores offer products that meet local customers’ needs, by offering both company brands and third-party products. Based on this philosophy, Cross Site stores are being opened nationwide. The aims of our retail business are to ensure sales in an environment of declining sales channels to specialty stores, and at the same time ascertaining market needs directly, and reflecting these in product design.
Moving forward, we will increase profitability by selling more company-brand products. In addition, we will make effective use of information on fashion trends gained from our retail stores in order to design and produce company-brand products, and we will also use this information for other companies' apparel that we supply as an OEM. Through these actions, we will grow our outer wear business.
Topics
■ Nationwide Roll-out of “Cross Site” Chain of Women’s Apparel Stores
Store Locations
One of the pictures on the cover page is of the Yokohama Kannai store.
10
010_0178002982207.indd 10 2010/08/18 11:03:44

010_0178002982207.indd 11 2010/08/18 11:03:44