Embed Size (px)
Citation preview
Business Processes
Chapter 4
Copyright © 2013 Pearson Education, Inc. publishing as Prentice Hall 4 - 2
4 Chapter Objectives
Be able to:• Explain what a business process is and how the business perspective differs from a
traditional, functional perspective. • Create process maps for a business process and use them to understand and
diagnose a process. • Calculate and interpret some common measures of process performance. • Discuss the importance of benchmarking and distinguish between competitive
benchmarking and process benchmarking. • Describe the Six Sigma methodology, including the steps of the DMAIC process. • Use and interpret some common continuous improvement tools. • Explain what the Supply-Chain Operations Reference (SCOR) model is and why it is
important to businesses.
Copyright © 2013 Pearson Education, Inc. publishing as Prentice Hall 4 - 3
4 Business Processes
Process – A set of logically related tasks or activities performed to achieve a defined business outcome. Primary process – A process that addresses the main
value-added activities of an organization. Development process – A process that seeks to improve
the performance of primary and support processes. Support process – A process that performs necessary,
albeit not value added activities.
© 2010 APICS Dictionary
Copyright © 2013 Pearson Education, Inc. publishing as Prentice Hall 4 - 4
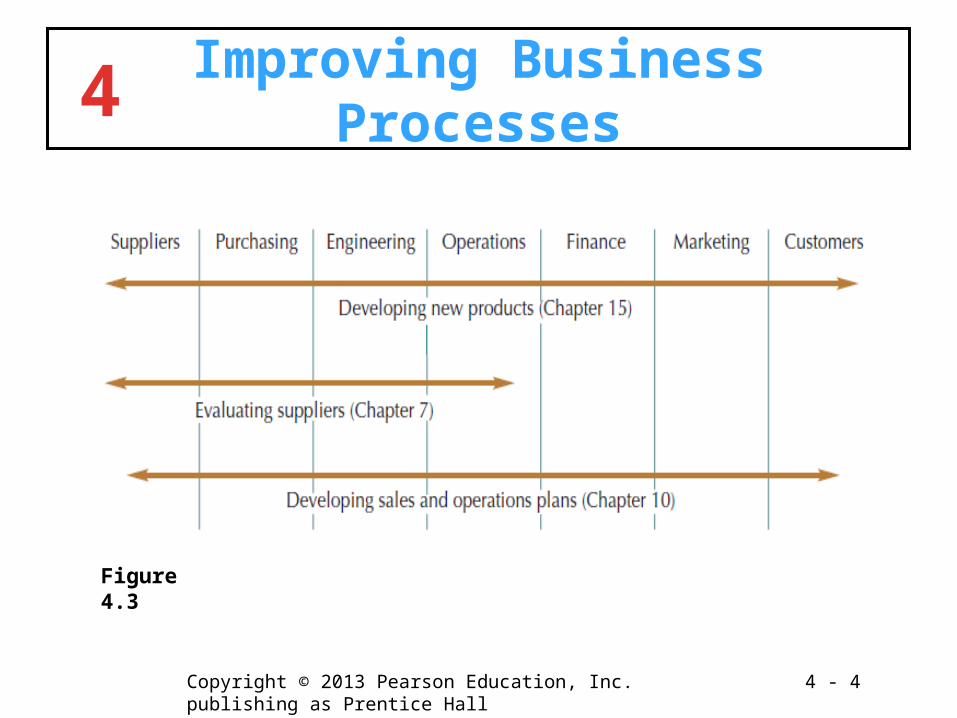
4 Improving Business Processes
Figure 4.3
Copyright © 2013 Pearson Education, Inc. publishing as Prentice Hall 4 - 5
4 Mapping Business Processes
Mapping – The process of developing graphic representations of the organizational relationships and/or activities that make up a business process.
Process Map – A detailed map that identifies the specific activities that make up the informational, physical, and/or monetary flow of a process.
Copyright © 2013 Pearson Education, Inc. publishing as Prentice Hall 4 - 6
4 Purposes of Mapping
Create a common understanding of the processes, activities, and results.
Define the boundary of the process.
Provide a baseline to measure the impact of improvement efforts.

Copyright © 2013 Pearson Education, Inc. publishing as Prentice Hall 4 - 7
4 Process Mapping Guidelines Identify the entity that will serve as your focal
point. Customer? Order? Item?
Identify clear boundaries and starting and ending points.
Keep it simple Does this detail add any insight? Do we need to map every exception condition?
Copyright © 2013 Pearson Education, Inc. publishing as Prentice Hall 4 - 8
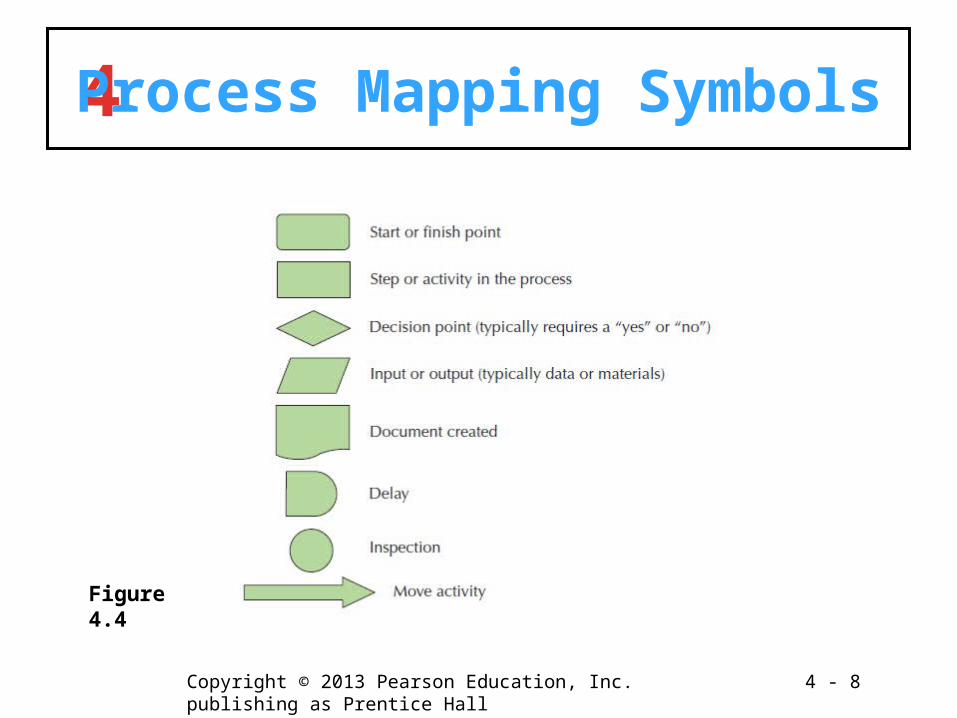
4 Process Mapping Symbols
Figure 4.4
Copyright © 2013 Pearson Education, Inc. publishing as Prentice Hall 4 - 9
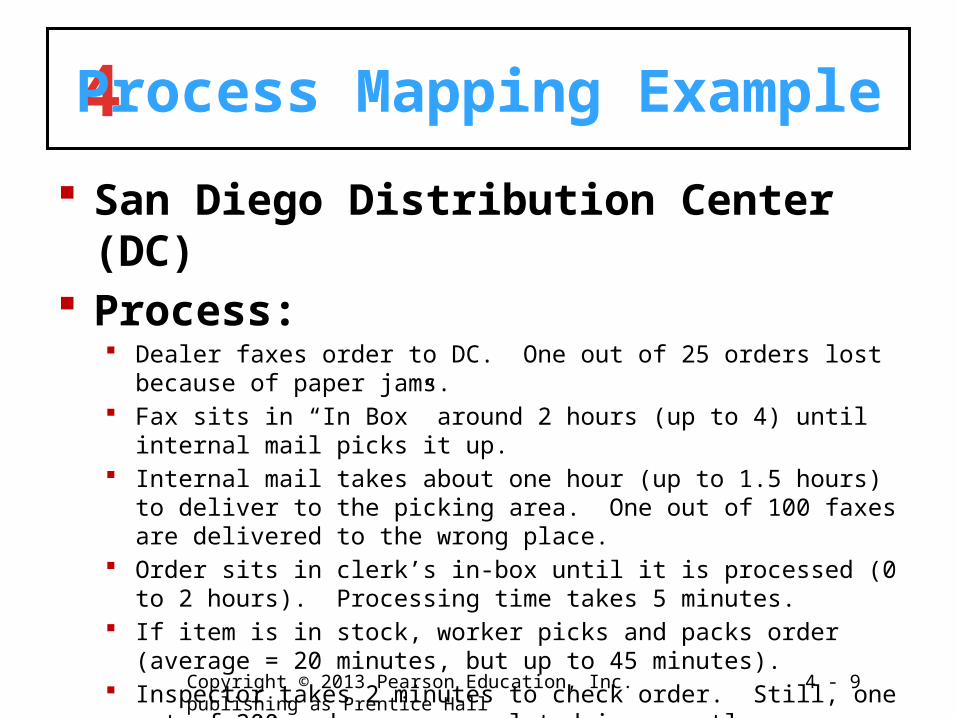
4 Process Mapping Example
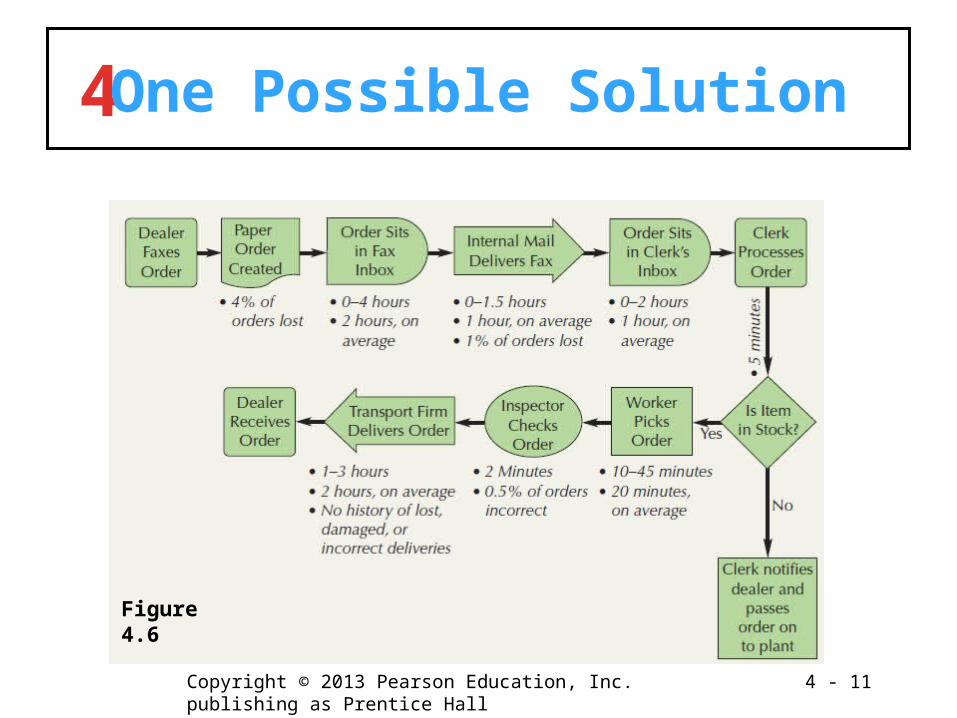
San Diego Distribution Center (DC) Process:
Dealer faxes order to DC. One out of 25 orders lost because of paper jams. Fax sits in “In Box” around 2 hours (up to 4) until internal mail picks it up. Internal mail takes about one hour (up to 1.5 hours) to deliver to the picking
area. One out of 100 faxes are delivered to the wrong place. Order sits in clerk’s in-box until it is processed (0 to 2 hours). Processing time
takes 5 minutes. If item is in stock, worker picks and packs order (average = 20 minutes, but up
to 45 minutes). Inspector takes 2 minutes to check order. Still, one out of 200 orders are
completed incorrectly. Transport firm delivers order (1 to 3 hours).
Copyright © 2013 Pearson Education, Inc. publishing as Prentice Hall 4 - 10
4 Let’s Map the Process!
What is the focal point of the mapping effort?
What are the boundaries of the process map?
What detail is missing from this simple example?
Copyright © 2013 Pearson Education, Inc. publishing as Prentice Hall 4 - 11
4 One Possible Solution
Figure 4.6
Copyright © 2013 Pearson Education, Inc. publishing as Prentice Hall 4 - 12
4 Guidelines for Process Improvement
Examine each delay symbol Cause, Length, Possible to Reduce?
Examine each activity symbol Necessary? What is the value? How can we
prevent errors? Examine each decision symbol
Can it be eliminated? Look for loops
Would better quality eliminate them? Costs?
Copyright © 2013 Pearson Education, Inc. publishing as Prentice Hall 4 - 13
4 Swim Lane Process Maps
Swim lane process map – A process map that graphically arranges the process steps so that the user can see who is responsible for each step.
Copyright © 2013 Pearson Education, Inc. publishing as Prentice Hall 4 - 14
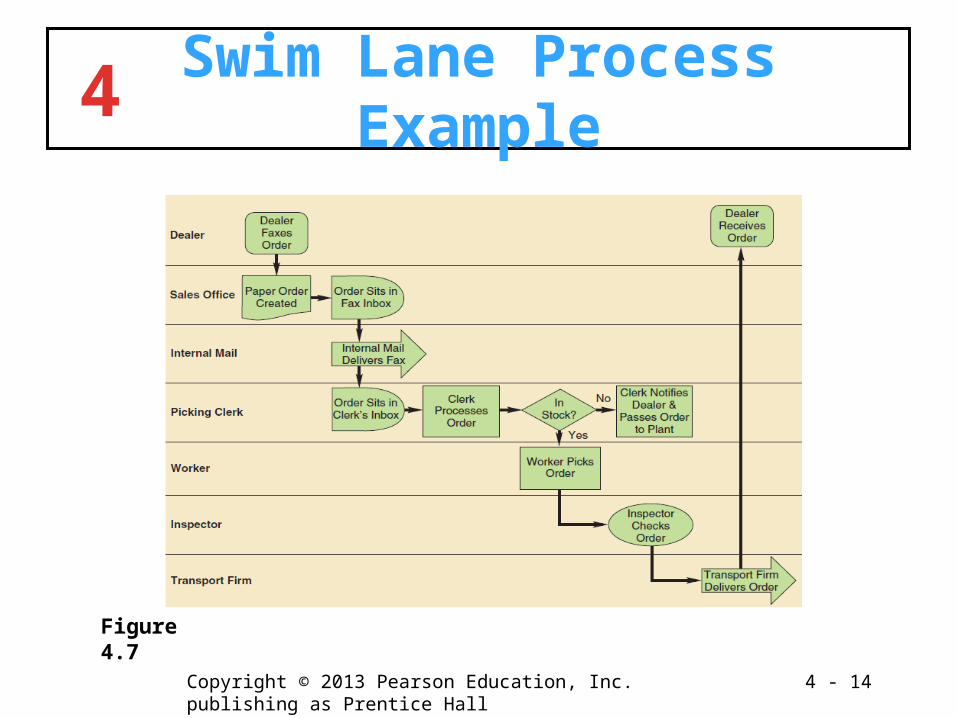
4 Swim Lane Process Example
Figure 4.7
Copyright © 2013 Pearson Education, Inc. publishing as Prentice Hall 4 - 15
4 Measuring Process Performance
Quality
Cost
Time
Flexibility
Copyright © 2013 Pearson Education, Inc. publishing as Prentice Hall 4 - 16
4 Productivity
Productivity – A measure of process performance.
Productivity = Outputs Inputs
Copyright © 2013 Pearson Education, Inc. publishing as Prentice Hall 4 - 17
4 Productivity
Single-factor productivity – A productivity score that measures output levels relative to single input.
Multifactor productivity – A productivity score that measures output levels relative to more than one input.
Copyright © 2013 Pearson Education, Inc. publishing as Prentice Hall 4 - 18
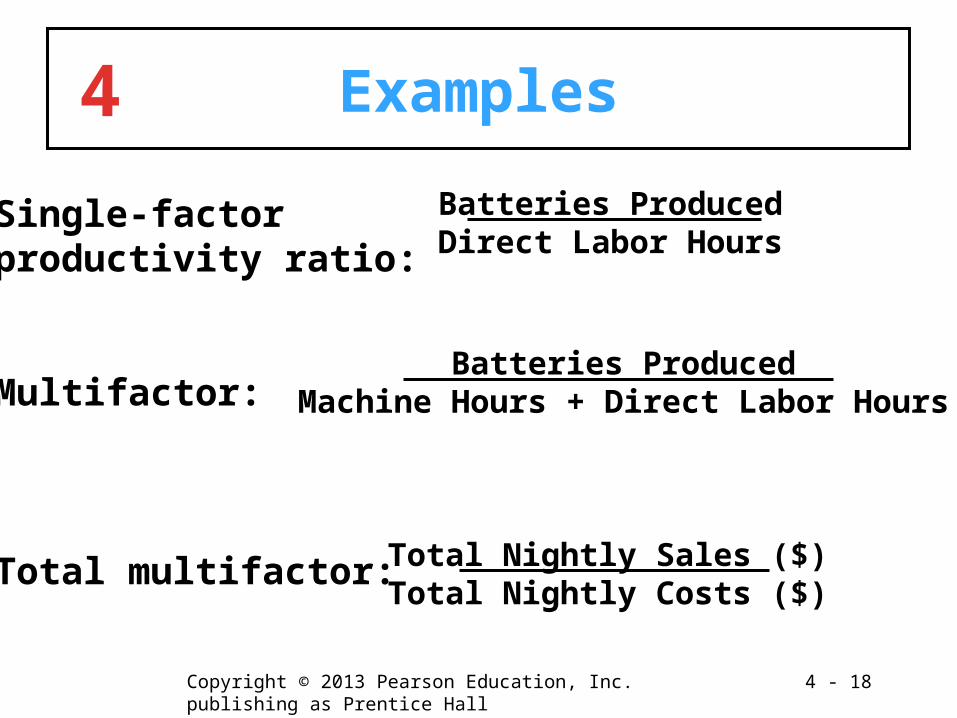
4 Examples
Batteries ProducedMachine Hours + Direct Labor Hours
Total Nightly Sales ($)Total Nightly Costs ($)
Batteries ProducedDirect Labor Hours
Single-factorproductivity ratio:
Multifactor:
Total multifactor:
Copyright © 2013 Pearson Education, Inc. publishing as Prentice Hall 4 - 19
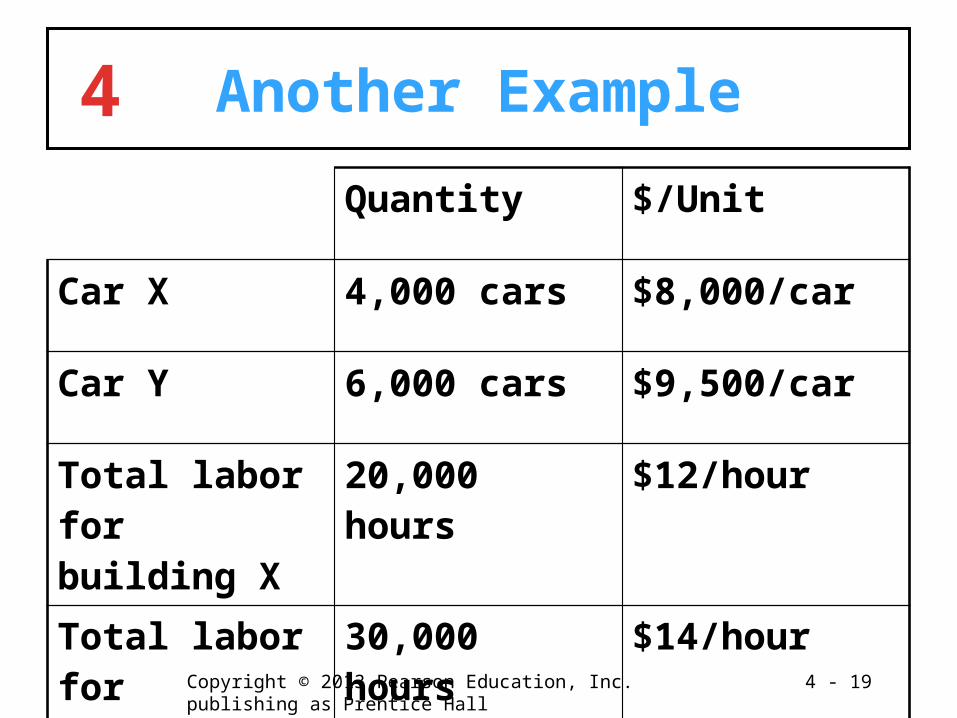
4 Another ExampleQuantity $/Unit
Car X 4,000 cars $8,000/car
Car Y 6,000 cars $9,500/car
Total labor for building X
20,000 hours $12/hour
Total labor for building Y
30,000 hours $14/hour
Copyright © 2013 Pearson Education, Inc. publishing as Prentice Hall 4 - 20
4 Productivity Example
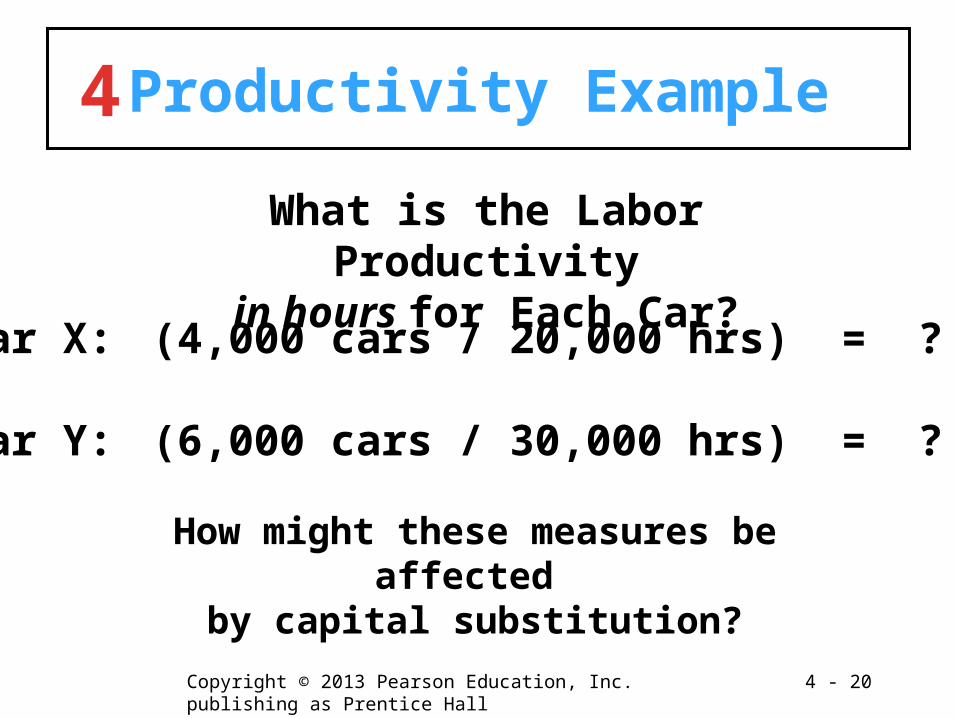
Car X: (4,000 cars / 20,000 hrs) = ?
Car Y: (6,000 cars / 30,000 hrs) = ?
How might these measures be affected by capital substitution?
What is the Labor Productivityin hours for Each Car?
Copyright © 2013 Pearson Education, Inc. publishing as Prentice Hall 4 - 21
4 Productivity Example
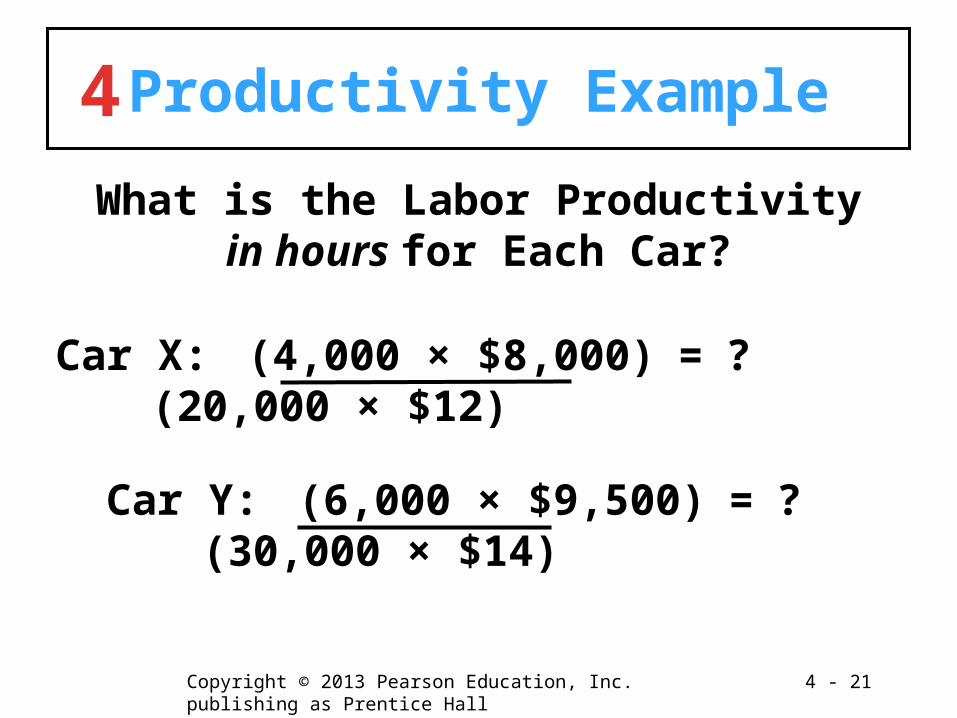
What is the Labor Productivityin hours for Each Car?
Car X: (4,000 × $8,000)= ?(20,000 × $12)
Car Y: (6,000 × $9,500) = ?(30,000 × $14)
Copyright © 2013 Pearson Education, Inc. publishing as Prentice Hall 4 - 22
4 Productivity Example
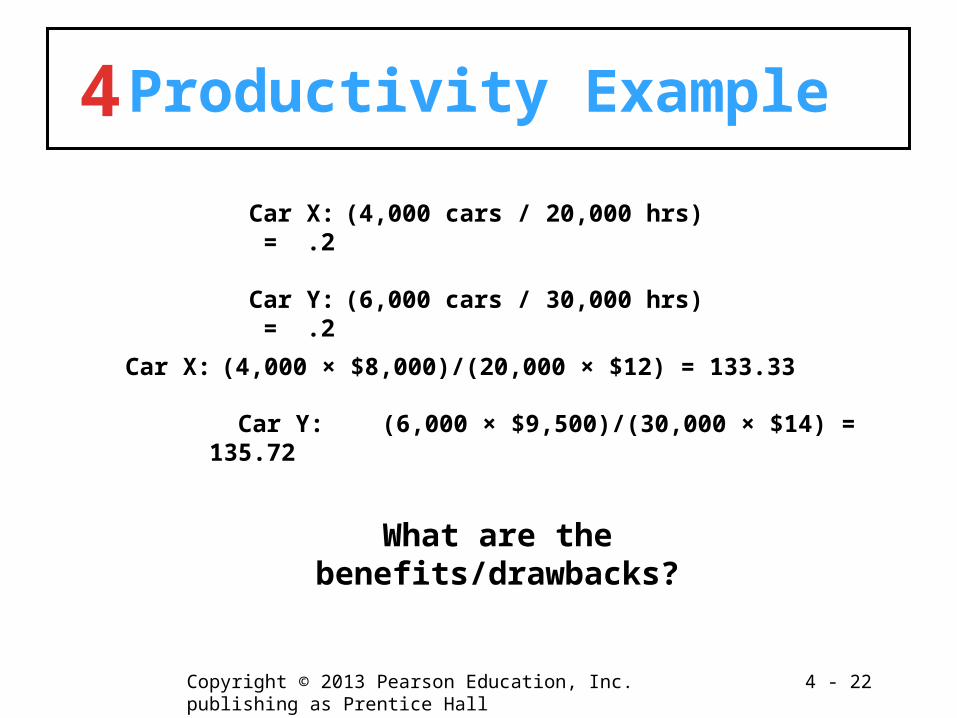
Car X: (4,000 cars / 20,000 hrs) = .2
Car Y: (6,000 cars / 30,000 hrs) = .2
Car X: (4,000 × $8,000)/(20,000 × $12) = 133.33
Car Y: (6,000 × $9,500)/(30,000 × $14) = 135.72
What are the benefits/drawbacks?
Copyright © 2013 Pearson Education, Inc. publishing as Prentice Hall 4 - 23
4 Efficiency
Efficiency – A measure of process performance; the ratio of actual outputs to standard outputs.
Standard output – An estimate of what should be produced, given a certain level of resources.
Copyright © 2013 Pearson Education, Inc. publishing as Prentice Hall 4 - 24
4 Efficiency
Efficiency = 100% (actual outputs / standard outputs)
OR: Efficiency = 100% (standard time/actual time) for one unit
Copyright © 2013 Pearson Education, Inc. publishing as Prentice Hall 4 - 25
4 Cycle Time
Cycle Time – The total elapsed time needed to complete a business process.
Percent Value-Added Time – The percentage of total cycle time that is spent on activities that actually provide value.
Percent Value-Added Time = 100% (value-added time)/(total cycle time)
Copyright © 2013 Pearson Education, Inc. publishing as Prentice Hall 4 - 26
4 Benchmarking
Benchmarking – The process of identifying, understanding, and adapting outstanding practices from within the same organization or from other businesses to help improve performance.
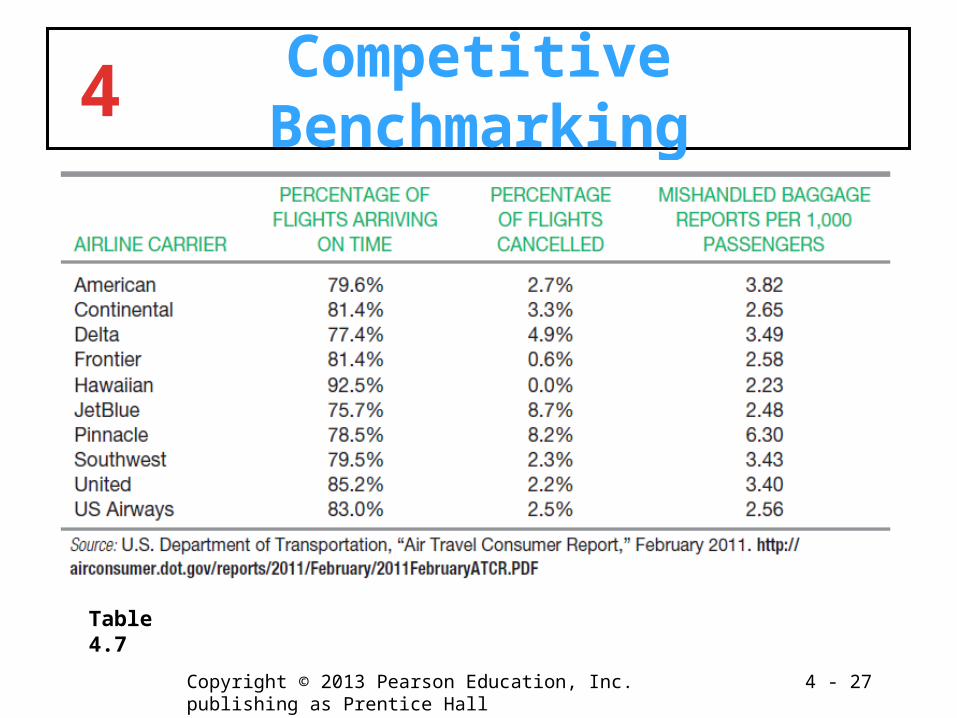
Competitive Benchmarking – The comparison of an organization’s processes with those of competing organizations.
Copyright © 2013 Pearson Education, Inc. publishing as Prentice Hall 4 - 27
4 Competitive Benchmarking
Table 4.7
Copyright © 2013 Pearson Education, Inc. publishing as Prentice Hall 4 - 28
4 The Six Sigma Methodology
Six Sigma – A business improvement methodology that focuses an organization on: Understanding and managing customer requirements Aligning key business processes to achieve those requirements Utilizing rigorous data analysis to understand and ultimately minimize
variation in those processes Driving rapid and sustainable improvement to the business processes.
Copyright © 2013 Pearson Education, Inc. publishing as Prentice Hall 4 - 29
4 Six Sigma People
Champion
Master Black Belt
Black Belt
Green Belt
Team Members
Copyright © 2013 Pearson Education, Inc. publishing as Prentice Hall 4 - 30
4 Six Sigma Methodology
DMAIC Define the goals of the improvement activity Measure the existing process Analyze the process Improve the process Control the new process
DMADV Define, Measure, Analyze, Design, Verify (Ch 15)
Copyright © 2013 Pearson Education, Inc. publishing as Prentice Hall 4 - 31
4 Continuous Improvement Tools
Root cause analysis Cause-and-effect diagrams Five Whys
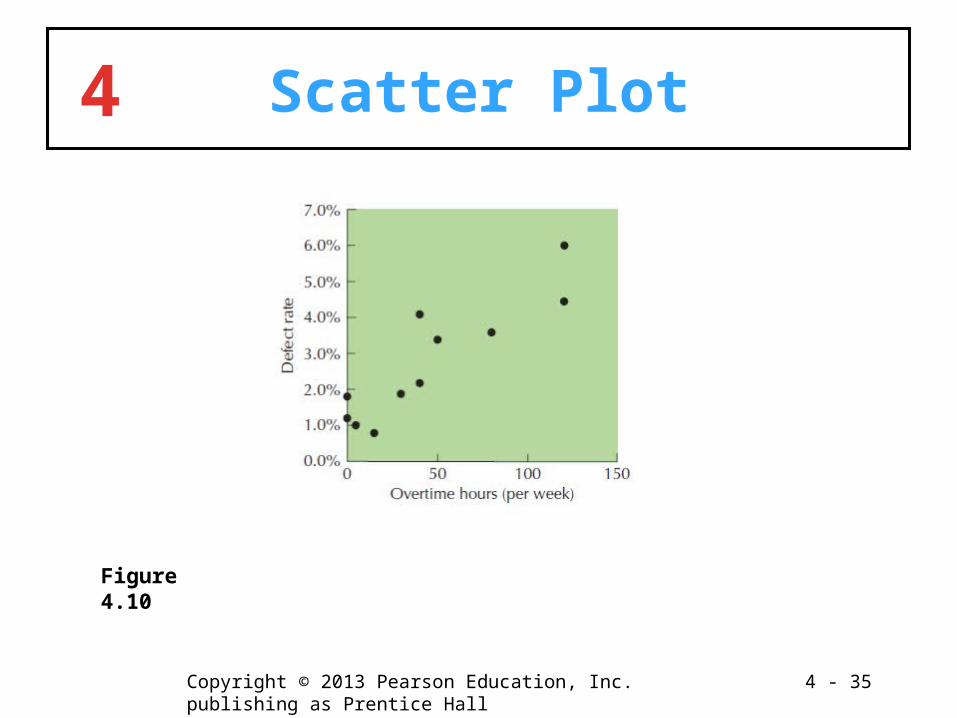
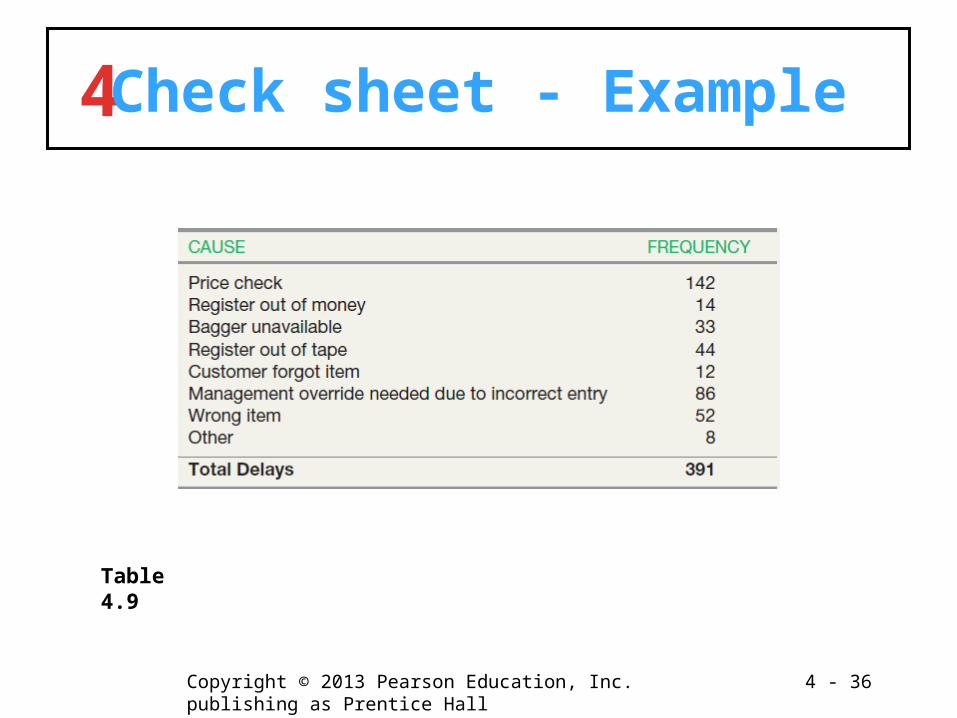
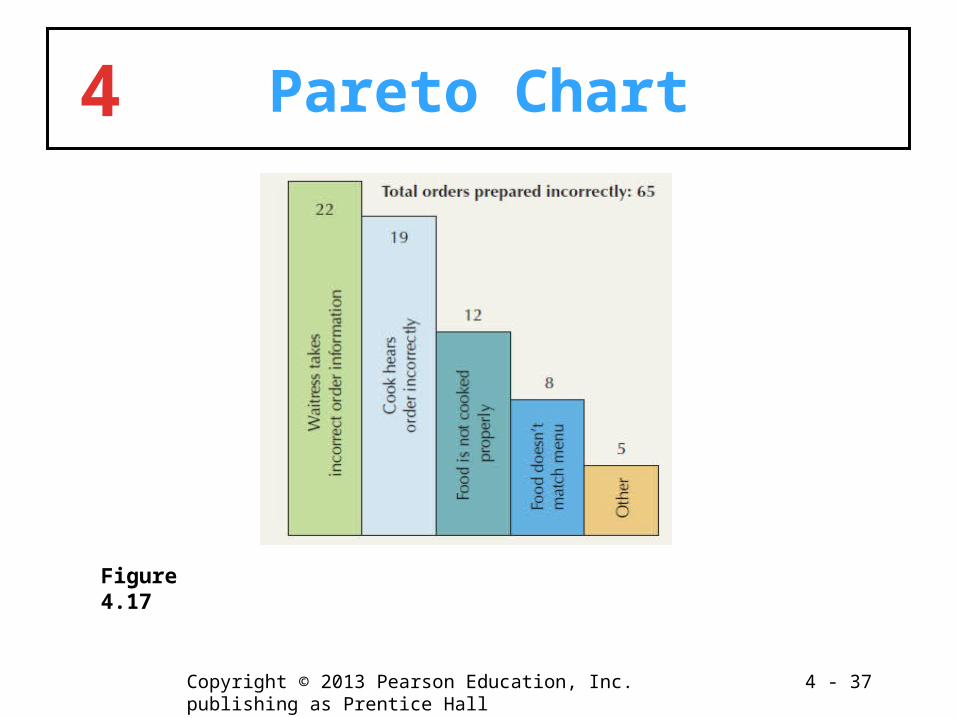
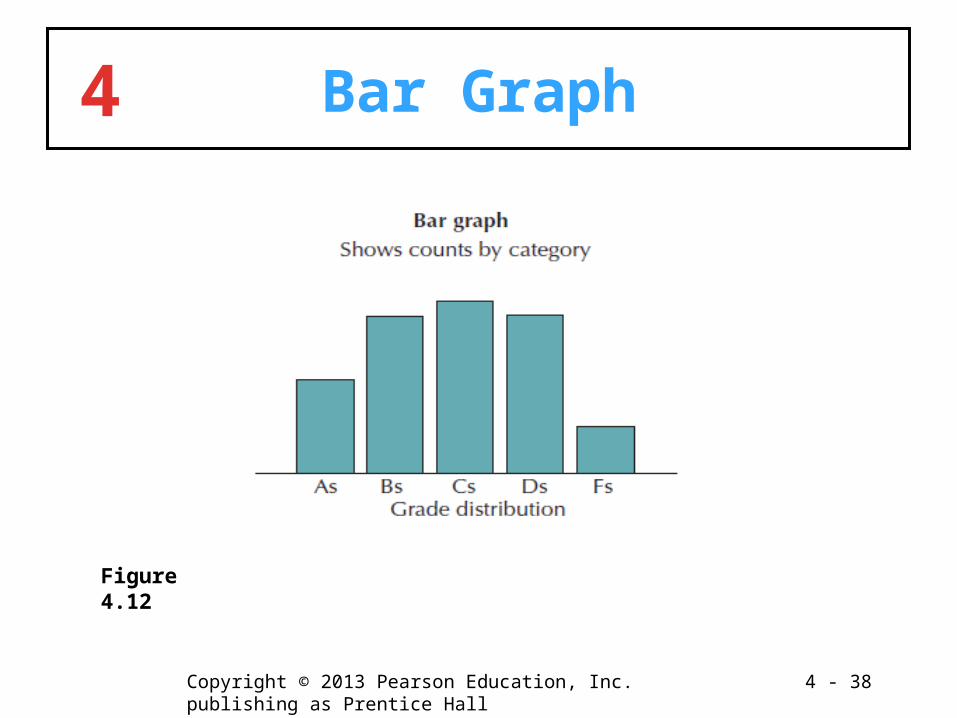
Scatter plot Check sheet Pareto Chart Run Chart Bar Chart Histogram
Copyright © 2013 Pearson Education, Inc. publishing as Prentice Hall 4 - 32
4 Root Cause Analysis
Root cause analysis – A process by which organizations brainstorm about possible causes of problems and then narrow the focus to a root case.
Copyright © 2013 Pearson Education, Inc. publishing as Prentice Hall 4 - 33
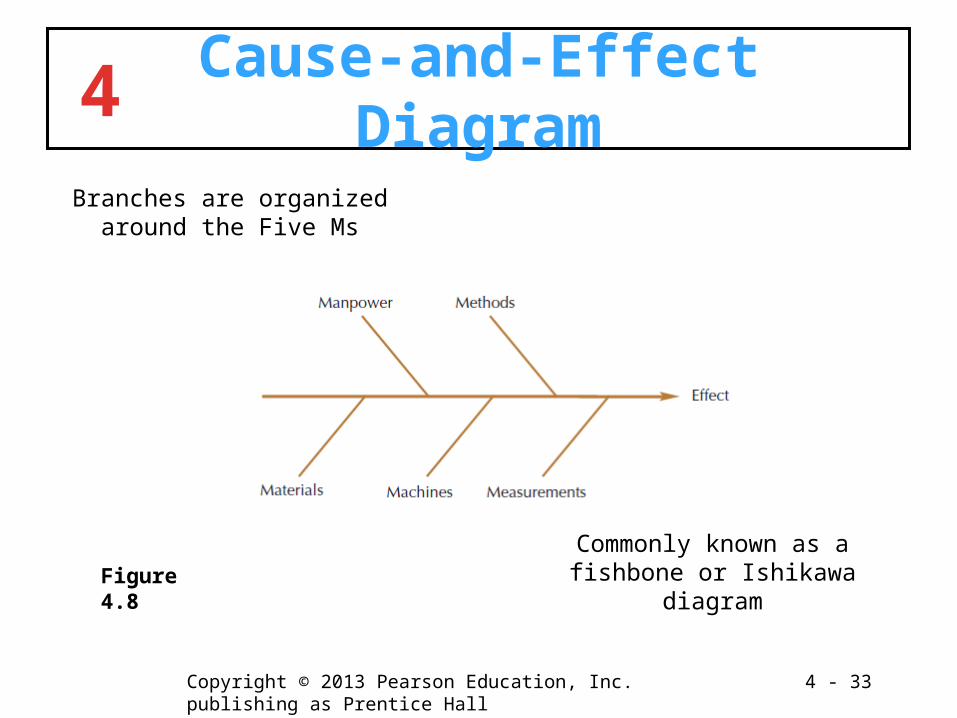
4 Cause-and-Effect Diagram
Figure 4.8Commonly known as a fishbone or
Ishikawa diagram
Branches are organized around the Five Ms
Copyright © 2013 Pearson Education, Inc. publishing as Prentice Hall 4 - 34
4 Five Whys
Five Whys - An approach used in root cause analysis to brainstorm successive answers to the question “why is this a cause of the original problem?”
Copyright © 2013 Pearson Education, Inc. publishing as Prentice Hall 4 - 35
4 Scatter Plot
Figure 4.10
Copyright © 2013 Pearson Education, Inc. publishing as Prentice Hall 4 - 36
4 Check sheet - Example
Table 4.9
Copyright © 2013 Pearson Education, Inc. publishing as Prentice Hall 4 - 37
4 Pareto Chart
Figure 4.17
Copyright © 2013 Pearson Education, Inc. publishing as Prentice Hall 4 - 38
4 Bar Graph
Figure 4.12
Copyright © 2013 Pearson Education, Inc. publishing as Prentice Hall 4 - 39
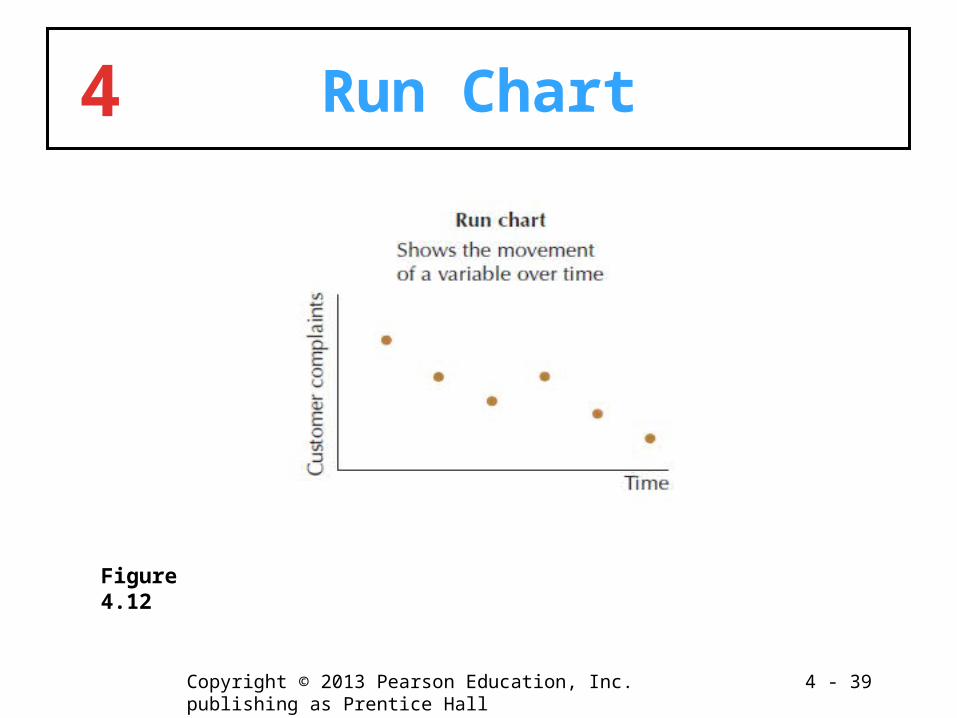
4 Run Chart
Figure 4.12
Copyright © 2013 Pearson Education, Inc. publishing as Prentice Hall 4 - 40
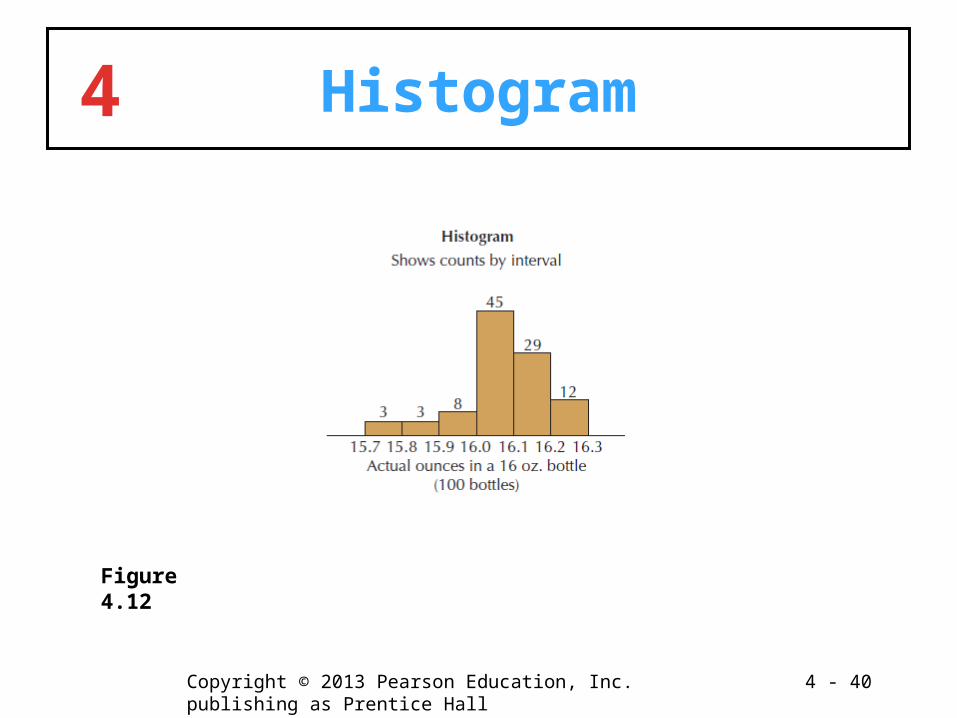
4 Histogram
Figure 4.12
Copyright © 2013 Pearson Education, Inc. publishing as Prentice Hall 4 - 41
4 Understanding Variability
How Standardized Should Processes Be? Some consider tools such as process mapping and DMAIC
to be “overused” and applied in environments where variation is valued.
Four Types of Processes Mass processes – same output every time Mass customization – controlled variation Artistic processes – variability in process and outputs are
valued Nascent (broken) process – mismatch between customer
wants and process deliverable
Copyright © 2013 Pearson Education, Inc. publishing as Prentice Hall 4 - 42
4 Business Process Reengineering (BPR)
Business Process Reengineering – A procedure that involves the fundamental rethinking and radical redesign of business processes to achieve dramatic organizational improvements in cost, quality, service, and speed. © 2010 APICS Dictionary
Copyright © 2013 Pearson Education, Inc. publishing as Prentice Hall 4 - 43
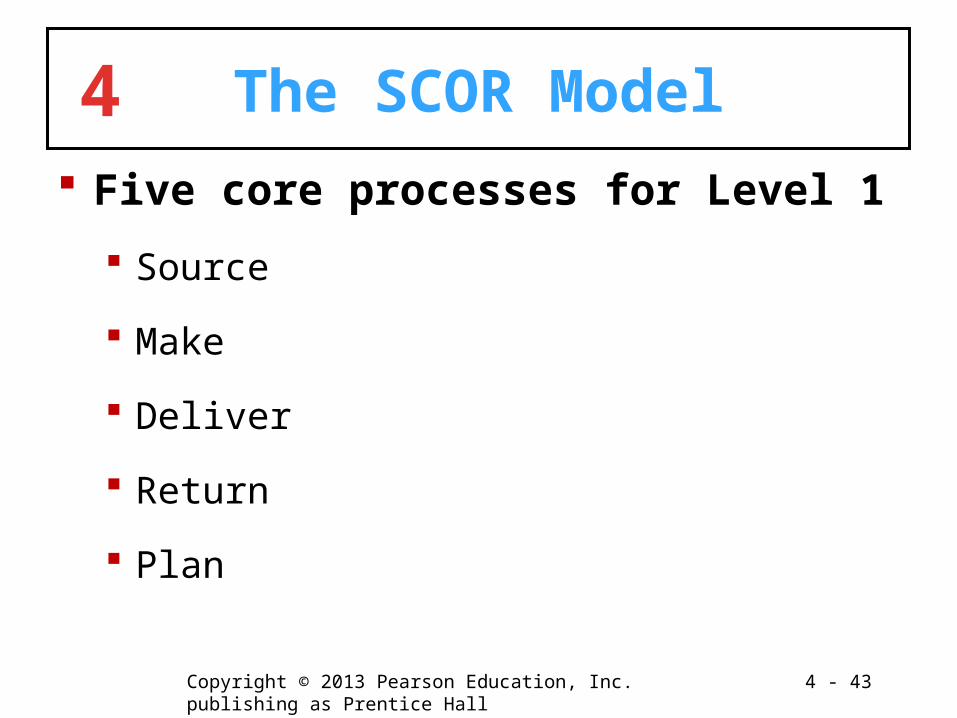
4 The SCOR Model Five core processes for Level 1
Source
Make
Deliver
Return
Plan
Copyright © 2013 Pearson Education, Inc. publishing as Prentice Hall 4 - 44
4 The SCOR Model
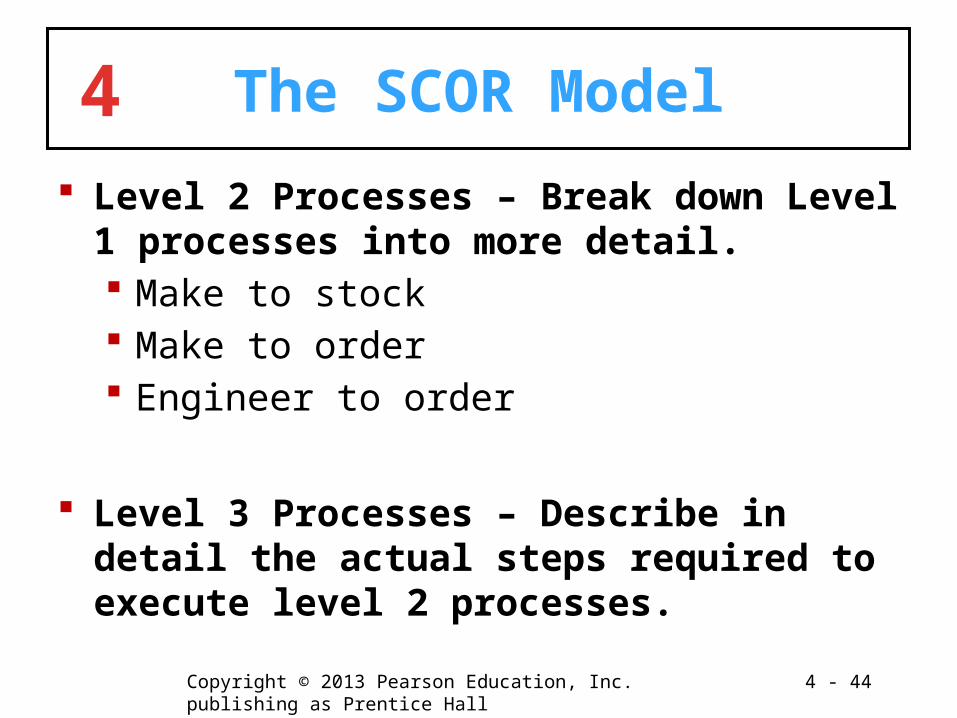
Level 2 Processes – Break down Level 1 processes into more detail. Make to stock Make to order Engineer to order
Level 3 Processes – Describe in detail the actual steps required to execute level 2 processes.
Copyright © 2013 Pearson Education, Inc. publishing as Prentice Hall 4 - 45
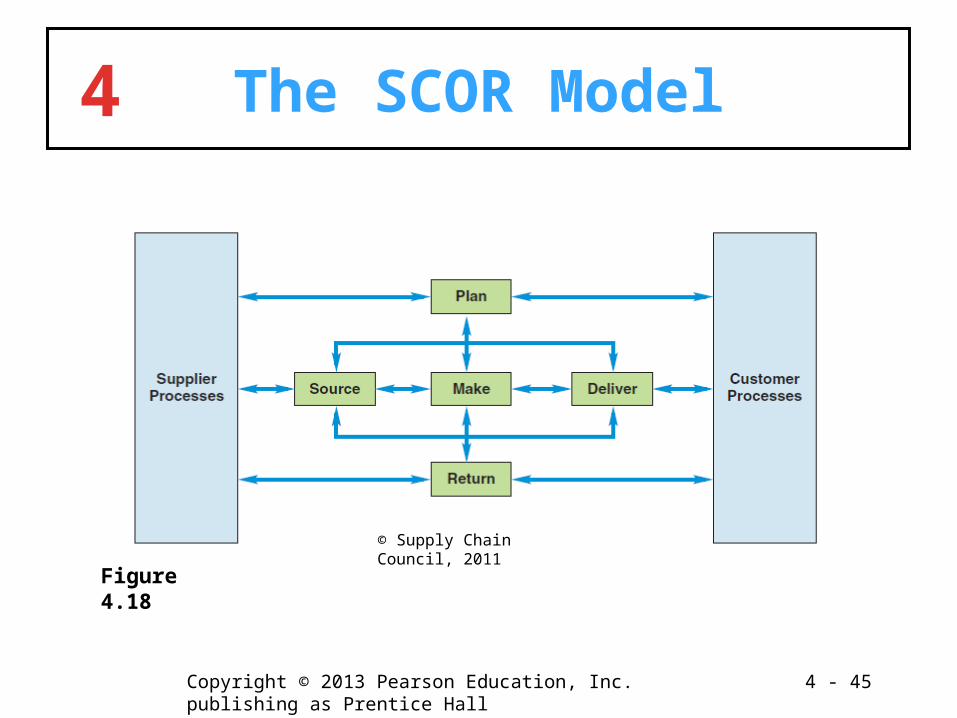
4 The SCOR Model
© Supply Chain Council, 2011
Figure 4.18
4 - 46Copyright © 2013 Pearson Education, Inc. publishing as Prentice Hall
Business Processes Case Study
Swim Lane Process Map for a Medical Procedure
Copyright © 2013 Pearson Education, Inc. publishing as Prentice Hall 3 - 47
All rights reserved. No part of this publication may be reproduced, stored in a retrieval system, or transmitted, in any form or by any means, electronic, mechanical, photocopying, recording, or
otherwise, without the prior written permission of the publisher. Printed in the United States of America.