Embed Size (px)
Citation preview
Business Process Servicesand how they’re transformingthe way we work
Contents1. Executive Summary
2. About this Paper
4. Business Change Moves to a New Agenda – Process Evolution
7. Technology Accelerates Process Transformation
11. The More Effective Delivery Route
15. Conclusion: Looking to the Way Ahead
June 2013 Cognizant 1
Executive Summary
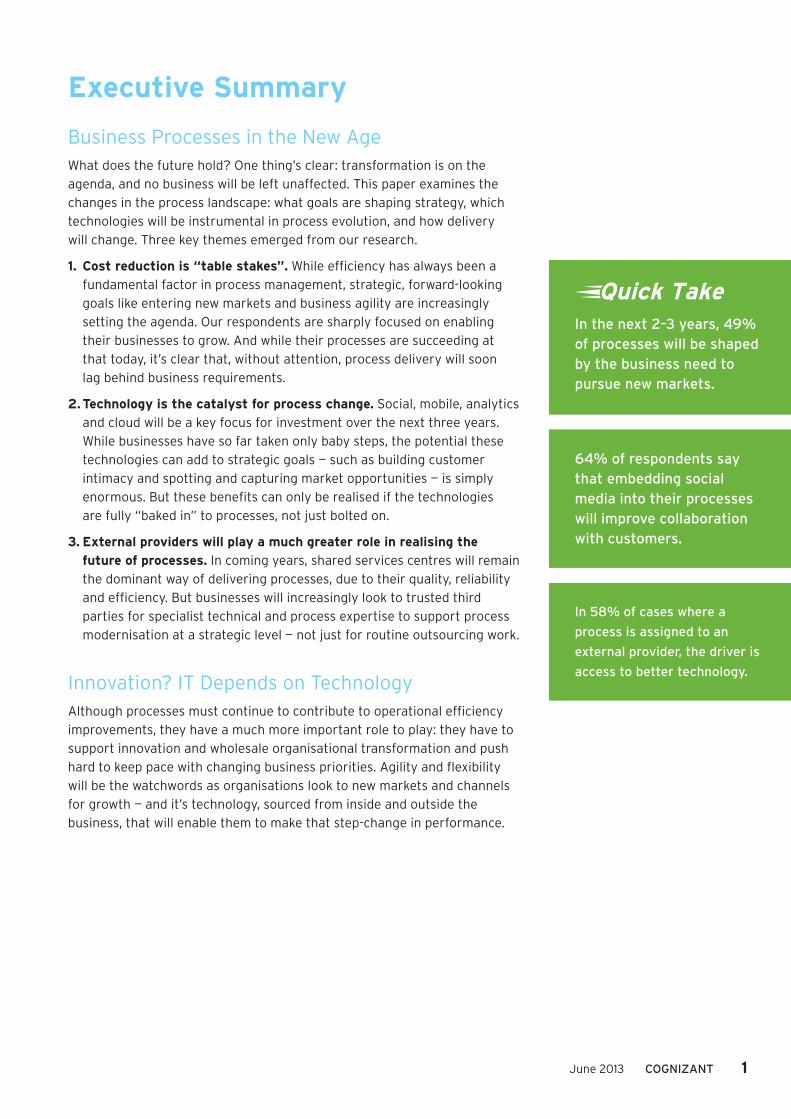
Business Processes in the New AgeWhat does the future hold? One thing’s clear: transformation is on the agenda, and no business will be left unaffected. This paper examines the changes in the process landscape: what goals are shaping strategy, which technologies will be instrumental in process evolution, and how delivery will change. Three key themes emerged from our research.
1. Cost reduction is “table stakes”. While efficiency has always been a fundamental factor in process management, strategic, forward-looking goals like entering new markets and business agility are increasingly setting the agenda. Our respondents are sharply focused on enabling their businesses to grow. And while their processes are succeeding at that today, it’s clear that, without attention, process delivery will soon lag behind business requirements.
2. Technology is the catalyst for process change. Social, mobile, analytics and cloud will be a key focus for investment over the next three years. While businesses have so far taken only baby steps, the potential these technologies can add to strategic goals — such as building customer intimacy and spotting and capturing market opportunities — is simply enormous. But these benefits can only be realised if the technologies are fully “baked in” to processes, not just bolted on.
3. External providers will play a much greater role in realising the future of processes. In coming years, shared services centres will remain the dominant way of delivering processes, due to their quality, reliability and efficiency. But businesses will increasingly look to trusted third parties for specialist technical and process expertise to support process modernisation at a strategic level — not just for routine outsourcing work.
Innovation? IT Depends on TechnologyAlthough processes must continue to contribute to operational efficiency improvements, they have a much more important role to play: they have to support innovation and wholesale organisational transformation and push hard to keep pace with changing business priorities. Agility and flexibility will be the watchwords as organisations look to new markets and channels for growth — and it’s technology, sourced from inside and outside the business, that will enable them to make that step-change in performance.
in the next 2–3 years, 49% of processes will be shaped by the business need to pursue new markets.
64% of respondents say that embedding social media into their processes will improve collaboration with customers.
in 58% of cases where a process is assigned to an external provider, the driver is access to better technology.
Quick Take
2 BuSinESS ProCESS SErviCES June 2013
About this Paperit’s clear to anybody involved in it and business that we are in a time of transformation: disruptive technologies like cloud, mobility and “big data” analytics are changing how we interact with each other, do our jobs, and run core business functions. But how will this affect the way that organisations manage their business processes?
Senior Process Owners, Telling it Like it isIn late 2012 and early 2013, Cognizant set out to answer this question. We conducted a global study of organisations reporting revenues of £325 million or more, asking them about 22 core business processes related to their vertical sectors, ranging from new product development to claims processing, customer support and accounting.
The study included 92 European managers, from European-headquartered organisations. Many respondents were familiar with multiple processes; we asked about each separately, giving us a total of 303 responses from Europe.
Business Process Services by SectorThis research produced a clear picture of the state of business processes in large European fi rms today: their use of external providers and shared services centres; their adoption of major new technologies; and their plans for the future to keep their processes relevant and effective.
This report summarises and contextualises our fi ndings. It’s relevant to any process owner within large organisations in any sector, but particularly the European fi nance, health and insurance industries.
June 2013 Cognizant 3
OtherManager
Director
C-suite, SVP or VP
34%
57%
6%
3%
Figure 1
Figure 2
4%
15% 47%
4% 29%
>£6.5 billion
£0.65-£1.2 billion £320-£649 million
£3-£6.4 billion £1.3-£2.9 billion
Figure 3
100 %
80 %
%60%
40 %
20 %%
0%
64%
49% 48% 45%
34%24%
10%
Costreduction
Newmarkets
Agilityand
flexibility
New channelsto market
Operatingrisk
Migrate fromcapex to opex
financing
Talent
Business Goals That Will Shape Process Performance In Next 2-3 YearsCosts will always be a key driver, but accessing new markets, creating operational agilityand new channels will become critical business goals
40% 50 %30 %20 %10 %0 %0 %10 %20 %30 %40 %50 %
21% 18%Very Well
(5)
46% 38%Well(4)
27% 34%Fairly Well
(3)
1 % 4%Poorly
(2)
1 % 2 %Very Poorly
(1)
How well processes meet todays requirements? How well will they meet in the next 2-3 years?
If left unchanged processes will soon start to lag behind
Figure 4
Figure 5
The Unstoppable Growth Of SMAC Stack™SMAC Stack will become critical catalyst for driving process innovation
Software as a Service
Business process platforms
Business analytics
Public social media
Mobile tools for employees
Cloud infrastructure
Enterprise social media
53%
45%
43%
41%
32%
32%
28%
56%
44%
37%
34%
33%
25%
21%
Figure 6
40% 50 % 60% 70 % 80%30 %20 %10 %0 %
64%Collaborate with customers
63%
60%
58%
Identify market opportunities
Market your products/services
Collaborate with colleagues
54%Collaborate with suppliers
46%Monitor reputation
43%Monitor competitors
Objectives Of Social Media ImplementationBetter Customer Collaboration and Tapping New Markets will dictate technology spend
50 %
60%
70 %
40 %
30 %
%20 %
0%
10 %%
54%52%
50%49%
48% 46%43%
Iden
tify
cro
ss-s
ellin
g op
port
unit
ies
Pri
ce p
rodu
cts
and
serv
ices
Rea
ct t
o cu
stom
er d
eman
d
Iden
tify
mar
ket
oppo
rtun
itie
s
Seg
men
t cu
stom
ers
Iden
tify
fra
ud a
nd/o
r w
aste
Neg
otia
te w
ith
supp
liers
Importance Of AnalyticsAnalytics will support greater market penetration and agile customer responsiveness
Analytics is being used to drive sales andstrong market presence, either integrated as
apart of shared services group or throughindividual business groups.
Figure 7
Figure 8
Bulk of the work handled by:Centralisation and process consolidation through internal shared services groups
16%72%
10%
2%
An internal shared services group
An external services provider
Employees, not part of shared services
Don’t know
10%Less of the work
47%About the same
4%Don’t know
39%More of the work
Figure 9
80 %60 %40 %20 %0 %0 %20 %40 %60 %80 %
70% 57%Higher quality/
reliability
62% 45%Lower cost
62% 58%Better
technology
35%More capacity
27%Broader
functionality
30%More modern
approach
34%Greater ease
of use
Internal External
Reliability and Costs key for why more work will be handled in houseMore then cost savings, external shared services provider could be a catalyst for implementation of newer and innovative technology
53%
46%
45%
43%
Drivers for Internal / External Shared Services Centre
Figure 10
Currently used 2–3 years later
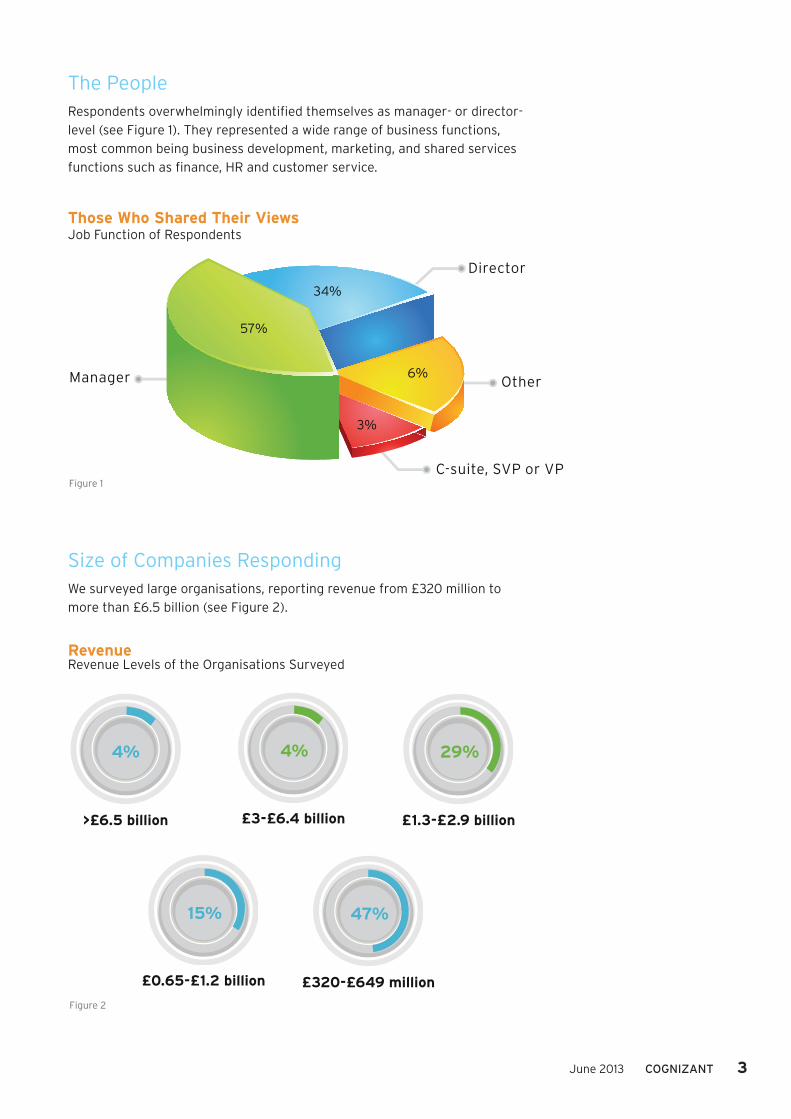
The PeopleRespondents overwhelmingly identifi ed themselves as manager- or director-level (see Figure 1). They represented a wide range of business functions, most common being business development, marketing, and shared services functions such as fi nance, HR and customer service.
Those Who Shared Their viewsJob Function of Respondents
Size of Companies RespondingWe surveyed large organisations, reporting revenue from £320 million to more than £6.5 billion (see Figure 2).
revenueRevenue Levels of the Organisations Surveyed
4 BuSinESS ProCESS SErviCES June 2013
Business Change Moves to a new Agenda – Process EvolutionWhether it’s accounts payable or product development, all processes have to be fi t for purpose today — and innovate to keep the business prospering as the market environment and business strategy evolves.
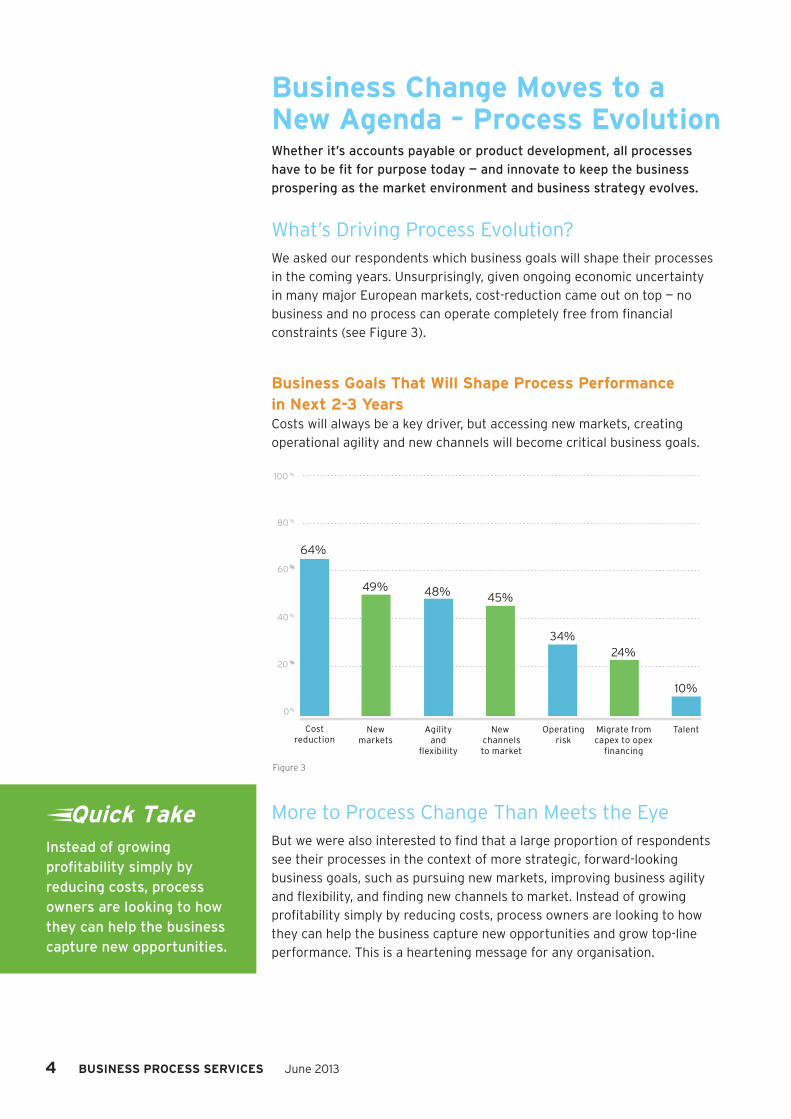
What’s Driving Process Evolution?We asked our respondents which business goals will shape their processes in the coming years. Unsurprisingly, given ongoing economic uncertainty in many major European markets, cost-reduction came out on top — no business and no process can operate completely free from fi nancial constraints (see Figure 3).
Business Goals That Will Shape Process Performance in next 2-3 YearsCosts will always be a key driver, but accessing new markets, creating operational agility and new channels will become critical business goals.
More to Process Change Than Meets the EyeBut we were also interested to fi nd that a large proportion of respondents see their processes in the context of more strategic, forward-looking business goals, such as pursuing new markets, improving business agility and fl exibility, and fi nding new channels to market. Instead of growing profi tability simply by reducing costs, process owners are looking to how they can help the business capture new opportunities and grow top-line performance. This is a heartening message for any organisation.
OtherManager
Director
C-suite, SVP or VP
34%
57%
6%
3%
Figure 1
Figure 2
4%
15% 47%
4% 29%
>£6.5 billion
£0.65-£1.2 billion £320-£649 million
£3-£6.4 billion £1.3-£2.9 billion
Figure 3
100 %
80 %
%60%
40 %
20 %%
0%
64%
49% 48% 45%
34%24%
10%
Costreduction
Newmarkets
Agilityand
flexibility
New channelsto market
Operatingrisk
Migrate fromcapex to opex
financing
Talent
Business Goals That Will Shape Process Performance In Next 2-3 YearsCosts will always be a key driver, but accessing new markets, creating operational agilityand new channels will become critical business goals
40% 50 %30 %20 %10 %0 %0 %10 %20 %30 %40 %50 %
21% 18%Very Well
(5)
46% 38%Well(4)
27% 34%Fairly Well
(3)
1 % 4%Poorly
(2)
1 % 2 %Very Poorly
(1)
How well processes meet todays requirements? How well will they meet in the next 2-3 years?
If left unchanged processes will soon start to lag behind
Figure 4
Figure 5
The Unstoppable Growth Of SMAC Stack™SMAC Stack will become critical catalyst for driving process innovation
Software as a Service
Business process platforms
Business analytics
Public social media
Mobile tools for employees
Cloud infrastructure
Enterprise social media
53%
45%
43%
41%
32%
32%
28%
56%
44%
37%
34%
33%
25%
21%
Figure 6
40% 50 % 60% 70 % 80%30 %20 %10 %0 %
64%Collaborate with customers
63%
60%
58%
Identify market opportunities
Market your products/services
Collaborate with colleagues
54%Collaborate with suppliers
46%Monitor reputation
43%Monitor competitors
Objectives Of Social Media ImplementationBetter Customer Collaboration and Tapping New Markets will dictate technology spend
50 %
60%
70 %
40 %
30 %
%20 %
0%
10 %%
54%52%
50%49%
48% 46%43%
Iden
tify
cro
ss-s
ellin
g op
port
unit
ies
Pri
ce p
rodu
cts
and
serv
ices
Rea
ct t
o cu
stom
er d
eman
d
Iden
tify
mar
ket
oppo
rtun
itie
s
Seg
men
t cu
stom
ers
Iden
tify
fra
ud a
nd/o
r w
aste
Neg
otia
te w
ith
supp
liers
Importance Of AnalyticsAnalytics will support greater market penetration and agile customer responsiveness
Analytics is being used to drive sales andstrong market presence, either integrated as
apart of shared services group or throughindividual business groups.
Figure 7
Figure 8
Bulk of the work handled by:Centralisation and process consolidation through internal shared services groups
16%72%
10%
2%
An internal shared services group
An external services provider
Employees, not part of shared services
Don’t know
10%Less of the work
47%About the same
4%Don’t know
39%More of the work
Figure 9
80 %60 %40 %20 %0 %0 %20 %40 %60 %80 %
70% 57%Higher quality/
reliability
62% 45%Lower cost
62% 58%Better
technology
35%More capacity
27%Broader
functionality
30%More modern
approach
34%Greater ease
of use
Internal External
Reliability and Costs key for why more work will be handled in houseMore then cost savings, external shared services provider could be a catalyst for implementation of newer and innovative technology
53%
46%
45%
43%
Drivers for Internal / External Shared Services Centre
Figure 10
Currently used 2–3 years later
instead of growing profi tability simply by reducing costs, process owners are looking to how they can help the business capture new opportunities.
Quick Take
June 2013 Cognizant 5
One respondent from a multinational insurer explained the focus on growth in his sector: “In the commercial insurance space we have more clients going out of business than going into business right now, so providers are trying to tackle the same customers and we’re trying to offer product expansions to attract them back or to keep them. We’re so busy on new product adoption, new products… and how to retain that business [without] spending as much time on the backroom”.
Not all Drivers are Created EqualThree business goals scored low in our survey: reducing risk; switching capex to opex; and increasing access to talent. Clearly not all objectives can get equal attention, but some industry players may be surprised to see these factors score low. What’s the explanation?
• risk: Conventional wisdom states that managing process risk is a major focus, particularly in fi nance and insurance industries, where there’s a signifi cant burden of compliance, high expectations for accuracy, and the constant threat of fraud — but following the 2008 fi nancial crisis, most organisations have put measures in place to manage risks, and are now focusing on competing and growing successfully.
• Capex: The benefi ts of opex are a major focus area for many service providers (especially cloud vendors), which are convinced that potential customers are put off by the need to make up-front investments in people and assets to perform processes. But the overall cost profi le is clearly much more important in reality.
• Talent: As multinationals expand into new markets and look to innovate and freshen their businesses after a period of consolidation, it would be natural to expect talent acquisition to be a high priority, but it ranked dead last — perhaps because many departments still see this as a pure Human Resources issue.
The Industry ViewThere are clear differences between the three sectors we surveyed. In fi ve of the six banking and capital markets processes that respondents told us about, new markets was the most important driver: the banking industry feels that it’s emerged from its crisis and is ready to look ahead. Contrastingly, in all nine health insurance processes, cost reduction was the most important or joint most important driver, refl ecting the continuing huge costs of fraud, administrative expenses, and the growing cost of patient care. Property, casualty and life insurance providers (our largest base of respondents) were in between, voting for a mix of cost reduction and new markets as their most important goals across the seven process areas that we asked about.
6 BuSinESS ProCESS SErviCES June 2013
Rising to the Challenge of the Present While in the past, process optimisation has been strongly tied to effi ciency goals, our results show that organisations are acknowledging the importance of their process capabilities in supporting business transformation and growth initiatives — initiatives that may evolve rapidly, requiring real agility and the ability to do things differently.
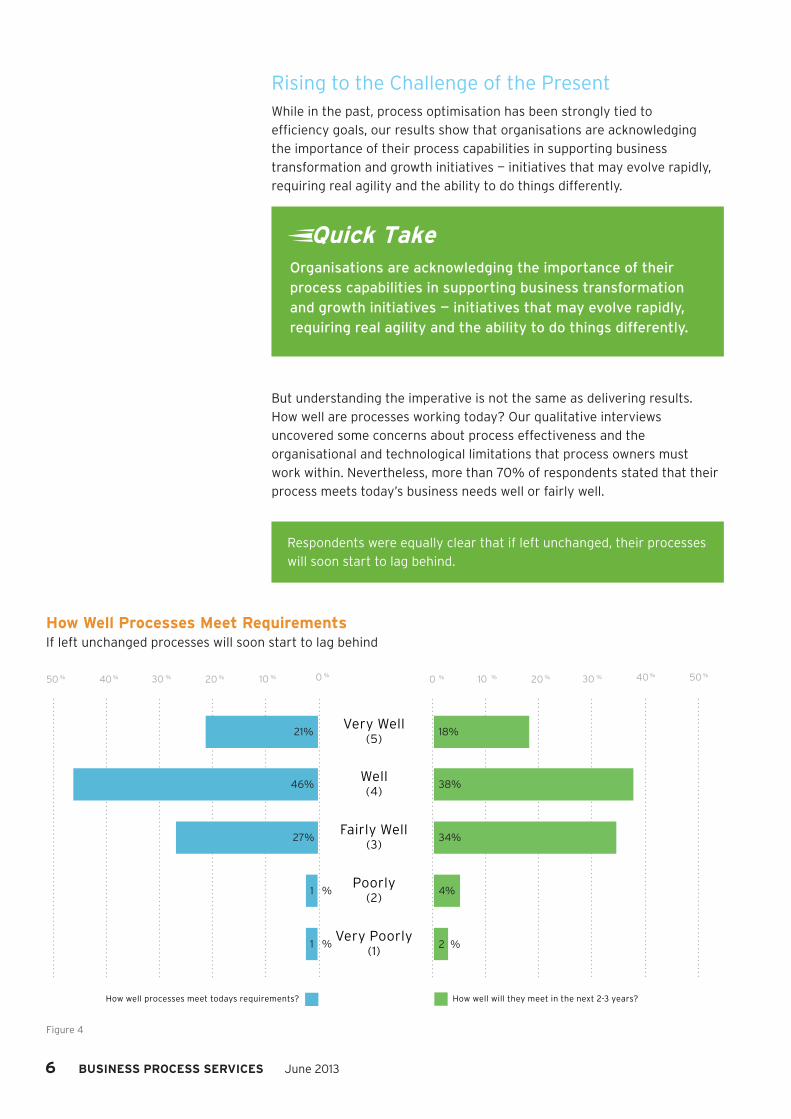
But understanding the imperative is not the same as delivering results. How well are processes working today? Our qualitative interviews uncovered some concerns about process effectiveness and the organisational and technological limitations that process owners must work within. Nevertheless, more than 70% of respondents stated that their process meets today’s business needs well or fairly well.
Respondents were equally clear that if left unchanged, their processes will soon start to lag behind.
OtherManager
Director
C-suite, SVP or VP
34%
57%
6%
3%
Figure 1
Figure 2
4%
15% 47%
4% 29%
>£6.5 billion
£0.65-£1.2 billion £320-£649 million
£3-£6.4 billion £1.3-£2.9 billion
Figure 3
100 %
80 %
%60%
40 %
20 %%
0%
64%
49% 48% 45%
34%24%
10%
Costreduction
Newmarkets
Agilityand
flexibility
New channelsto market
Operatingrisk
Migrate fromcapex to opex
financing
Talent
Business Goals That Will Shape Process Performance In Next 2-3 YearsCosts will always be a key driver, but accessing new markets, creating operational agilityand new channels will become critical business goals
40% 50 %30 %20 %10 %0 %0 %10 %20 %30 %40 %50 %
21% 18%Very Well
(5)
46% 38%Well(4)
27% 34%Fairly Well
(3)
1 % 4%Poorly
(2)
1 % 2 %Very Poorly
(1)
How well processes meet todays requirements? How well will they meet in the next 2-3 years?
If left unchanged processes will soon start to lag behind
Figure 4
Figure 5
The Unstoppable Growth Of SMAC Stack™SMAC Stack will become critical catalyst for driving process innovation
Software as a Service
Business process platforms
Business analytics
Public social media
Mobile tools for employees
Cloud infrastructure
Enterprise social media
53%
45%
43%
41%
32%
32%
28%
56%
44%
37%
34%
33%
25%
21%
Figure 6
40% 50 % 60% 70 % 80%30 %20 %10 %0 %
64%Collaborate with customers
63%
60%
58%
Identify market opportunities
Market your products/services
Collaborate with colleagues
54%Collaborate with suppliers
46%Monitor reputation
43%Monitor competitors
Objectives Of Social Media ImplementationBetter Customer Collaboration and Tapping New Markets will dictate technology spend
50 %
60%
70 %
40 %
30 %
%20 %
0%
10 %%
54%52%
50%49%
48% 46%43%
Iden
tify
cro
ss-s
ellin
g op
port
unit
ies
Pri
ce p
rodu
cts
and
serv
ices
Rea
ct t
o cu
stom
er d
eman
d
Iden
tify
mar
ket
oppo
rtun
itie
s
Seg
men
t cu
stom
ers
Iden
tify
fra
ud a
nd/o
r w
aste
Neg
otia
te w
ith
supp
liers
Importance Of AnalyticsAnalytics will support greater market penetration and agile customer responsiveness
Analytics is being used to drive sales andstrong market presence, either integrated as
apart of shared services group or throughindividual business groups.
Figure 7
Figure 8
Bulk of the work handled by:Centralisation and process consolidation through internal shared services groups
16%72%
10%
2%
An internal shared services group
An external services provider
Employees, not part of shared services
Don’t know
10%Less of the work
47%About the same
4%Don’t know
39%More of the work
Figure 9
80 %60 %40 %20 %0 %0 %20 %40 %60 %80 %
70% 57%Higher quality/
reliability
62% 45%Lower cost
62% 58%Better
technology
35%More capacity
27%Broader
functionality
30%More modern
approach
34%Greater ease
of use
Internal External
Reliability and Costs key for why more work will be handled in houseMore then cost savings, external shared services provider could be a catalyst for implementation of newer and innovative technology
53%
46%
45%
43%
Drivers for Internal / External Shared Services Centre
Figure 10
Currently used 2–3 years later
organisations are acknowledging the importance of their process capabilities in supporting business transformation and growth initiatives — initiatives that may evolve rapidly, requiring real agility and the ability to do things differently.
Quick Take
How Well Processes Meet requirementsIf left unchanged processes will soon start to lag behind
June 2013 Cognizant 7
Technology Accelerates Process Transformationtechnology is the toolkit that process owners can use to respond to the changes they face, by improving their processes’ performance and adaptability.
We asked respondents which technologies their company uses to help perform each process. We asked them to pick from broad categories of the most popular current and emerging technologies, giving examples of each.
The only technology used in more than half of processes today was software as a service (SaaS), reflecting its huge popularity in areas such as CRM and ERP. SaaS is a relatively mature product, which has been on the market for longer than some of the other technologies, and it’s been easy for individual business units and process owners to bypass shared services centres and the IT department to solve their own technology and process issues with SaaS on an ad hoc basis.
Looking ahead, SaaS starts to score lower: process owners will move on to the next level of SaaS, managed services and business process as a service (BPaaS). They’re starting to evaluate broader platform-based processes that involve SaaS wrapped in a package of services.
Second to SaaS came business process platforms. This high score perhaps reflects the maturity, scope and complexity of processes across the large multinational businesses we surveyed, and the awareness of process managers that they need standardised and automated ways to orchestrate and adapt their process environment over time. One respondent from financial services commented: “We’re starting to make some forays into business process platforms and I do think there’s a significant amount of value in it, but it takes time to be able to map out what your real processes are today and to figure out how to streamline the processes”.
the only technology used in more than half of processes today was software as a service (SaaS), reflecting its huge popularity in areas such as CRM and ERP.
Quick Take
8 BuSinESS ProCESS SErviCES June 2013
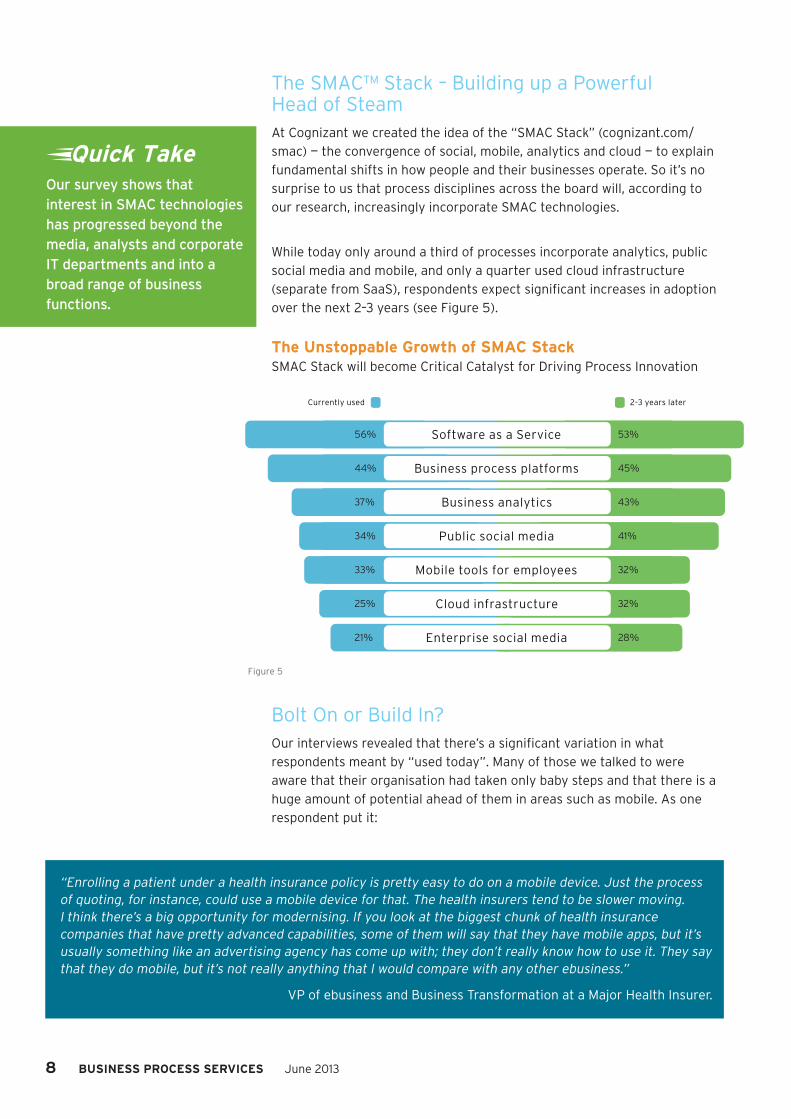
The SMAC™ Stack – Building up a Powerful Head of SteamAt Cognizant we created the idea of the “SMAC Stack” (cognizant.com/smac) — the convergence of social, mobile, analytics and cloud — to explain fundamental shifts in how people and their businesses operate. So it’s no surprise to us that process disciplines across the board will, according to our research, increasingly incorporate SMAC technologies.
While today only around a third of processes incorporate analytics, public social media and mobile, and only a quarter used cloud infrastructure (separate from SaaS), respondents expect signifi cant increases in adoption over the next 2–3 years (see Figure 5).
The unstoppable Growth of SMAC StackSMAC Stack will become Critical Catalyst for Driving Process Innovation
Bolt On or Build In?Our interviews revealed that there’s a signifi cant variation in what respondents meant by “used today”. Many of those we talked to were aware that their organisation had taken only baby steps and that there is a huge amount of potential ahead of them in areas such as mobile. As one respondent put it:
“Enrolling a patient under a health insurance policy is pretty easy to do on a mobile device. Just the process of quoting, for instance, could use a mobile device for that. The health insurers tend to be slower moving. I think there’s a big opportunity for modernising. If you look at the biggest chunk of health insurance companies that have pretty advanced capabilities, some of them will say that they have mobile apps, but it’s usually something like an advertising agency has come up with; they don’t really know how to use it. They say that they do mobile, but it’s not really anything that I would compare with any other ebusiness.”
VP of ebusiness and Business Transformation at a Major Health Insurer.
OtherManager
Director
C-suite, SVP or VP
34%
57%
6%
3%
Figure 1
Figure 2
4%
15% 47%
4% 29%
>£6.5 billion
£0.65-£1.2 billion £320-£649 million
£3-£6.4 billion £1.3-£2.9 billion
Figure 3
100 %
80 %
%60%
40 %
20 %%
0%
64%
49% 48% 45%
34%24%
10%
Costreduction
Newmarkets
Agilityand
flexibility
New channelsto market
Operatingrisk
Migrate fromcapex to opex
financing
Talent
Business Goals That Will Shape Process Performance In Next 2-3 YearsCosts will always be a key driver, but accessing new markets, creating operational agilityand new channels will become critical business goals
40% 50 %30 %20 %10 %0 %0 %10 %20 %30 %40 %50 %
21% 18%Very Well
(5)
46% 38%Well(4)
27% 34%Fairly Well
(3)
1 % 4%Poorly
(2)
1 % 2 %Very Poorly
(1)
How well processes meet todays requirements? How well will they meet in the next 2-3 years?
If left unchanged processes will soon start to lag behind
Figure 4
Figure 5
The Unstoppable Growth Of SMAC Stack™SMAC Stack will become critical catalyst for driving process innovation
Software as a Service
Business process platforms
Business analytics
Public social media
Mobile tools for employees
Cloud infrastructure
Enterprise social media
53%
45%
43%
41%
32%
32%
28%
56%
44%
37%
34%
33%
25%
21%
Figure 6
40% 50 % 60% 70 % 80%30 %20 %10 %0 %
64%Collaborate with customers
63%
60%
58%
Identify market opportunities
Market your products/services
Collaborate with colleagues
54%Collaborate with suppliers
46%Monitor reputation
43%Monitor competitors
Objectives Of Social Media ImplementationBetter Customer Collaboration and Tapping New Markets will dictate technology spend
50 %
60%
70 %
40 %
30 %
%20 %
0%
10 %%
54%52%
50%49%
48% 46%43%
Iden
tify
cro
ss-s
ellin
g op
port
unit
ies
Pri
ce p
rodu
cts
and
serv
ices
Rea
ct t
o cu
stom
er d
eman
d
Iden
tify
mar
ket
oppo
rtun
itie
s
Seg
men
t cu
stom
ers
Iden
tify
fra
ud a
nd/o
r w
aste
Neg
otia
te w
ith
supp
liers
Importance Of AnalyticsAnalytics will support greater market penetration and agile customer responsiveness
Analytics is being used to drive sales andstrong market presence, either integrated as
apart of shared services group or throughindividual business groups.
Figure 7
Figure 8
Bulk of the work handled by:Centralisation and process consolidation through internal shared services groups
16%72%
10%
2%
An internal shared services group
An external services provider
Employees, not part of shared services
Don’t know
10%Less of the work
47%About the same
4%Don’t know
39%More of the work
Figure 9
80 %60 %40 %20 %0 %0 %20 %40 %60 %80 %
70% 57%Higher quality/
reliability
62% 45%Lower cost
62% 58%Better
technology
35%More capacity
27%Broader
functionality
30%More modern
approach
34%Greater ease
of use
Internal External
Reliability and Costs key for why more work will be handled in houseMore then cost savings, external shared services provider could be a catalyst for implementation of newer and innovative technology
53%
46%
45%
43%
Drivers for Internal / External Shared Services Centre
Figure 10
Currently used 2–3 years later
our survey shows that interest in SMaC technologies has progressed beyond the media, analysts and corporate it departments and into a broad range of business functions.
Quick Take
June 2013 Cognizant 9
OtherManager
Director
C-suite, SVP or VP
34%
57%
6%
3%
Figure 1
Figure 2
4%
15% 47%
4% 29%
>£6.5 billion
£0.65-£1.2 billion £320-£649 million
£3-£6.4 billion £1.3-£2.9 billion
Figure 3
100 %
80 %
%60%
40 %
20 %%
0%
64%
49% 48% 45%
34%24%
10%
Costreduction
Newmarkets
Agilityand
flexibility
New channelsto market
Operatingrisk
Migrate fromcapex to opex
financing
Talent
Business Goals That Will Shape Process Performance In Next 2-3 YearsCosts will always be a key driver, but accessing new markets, creating operational agilityand new channels will become critical business goals
40% 50 %30 %20 %10 %0 %0 %10 %20 %30 %40 %50 %
21% 18%Very Well
(5)
46% 38%Well(4)
27% 34%Fairly Well
(3)
1 % 4%Poorly
(2)
1 % 2 %Very Poorly
(1)
How well processes meet todays requirements? How well will they meet in the next 2-3 years?
If left unchanged processes will soon start to lag behind
Figure 4
Figure 5
The Unstoppable Growth Of SMAC Stack™SMAC Stack will become critical catalyst for driving process innovation
Software as a Service
Business process platforms
Business analytics
Public social media
Mobile tools for employees
Cloud infrastructure
Enterprise social media
53%
45%
43%
41%
32%
32%
28%
56%
44%
37%
34%
33%
25%
21%
Figure 6
40% 50 % 60% 70 % 80%30 %20 %10 %0 %
64%Collaborate with customers
63%
60%
58%
Identify market opportunities
Market your products/services
Collaborate with colleagues
54%Collaborate with suppliers
46%Monitor reputation
43%Monitor competitors
Objectives Of Social Media ImplementationBetter Customer Collaboration and Tapping New Markets will dictate technology spend
50 %
60%
70 %
40 %
30 %
%20 %
0%
10 %%
54%52%
50%49%
48% 46%43%
Iden
tify
cro
ss-s
ellin
g op
port
unit
ies
Pri
ce p
rodu
cts
and
serv
ices
Rea
ct t
o cu
stom
er d
eman
d
Iden
tify
mar
ket
oppo
rtun
itie
s
Seg
men
t cu
stom
ers
Iden
tify
fra
ud a
nd/o
r w
aste
Neg
otia
te w
ith
supp
liers
Importance Of AnalyticsAnalytics will support greater market penetration and agile customer responsiveness
Analytics is being used to drive sales andstrong market presence, either integrated as
apart of shared services group or throughindividual business groups.
Figure 7
Figure 8
Bulk of the work handled by:Centralisation and process consolidation through internal shared services groups
16%72%
10%
2%
An internal shared services group
An external services provider
Employees, not part of shared services
Don’t know
10%Less of the work
47%About the same
4%Don’t know
39%More of the work
Figure 9
80 %60 %40 %20 %0 %0 %20 %40 %60 %80 %
70% 57%Higher quality/
reliability
62% 45%Lower cost
62% 58%Better
technology
35%More capacity
27%Broader
functionality
30%More modern
approach
34%Greater ease
of use
Internal External
Reliability and Costs key for why more work will be handled in houseMore then cost savings, external shared services provider could be a catalyst for implementation of newer and innovative technology
53%
46%
45%
43%
Drivers for Internal / External Shared Services Centre
Figure 10
Currently used 2–3 years later
Cognizant has argued that organisational success depends not just on “bolting on” or dabbling in technologies such as SMAC, but in integrating them in to core processes. While there’s certainly a role for experimentation and careful piloting of new initiatives, particularly when it comes to critical core processes, reengineering is the only way to see the full benefi ts.
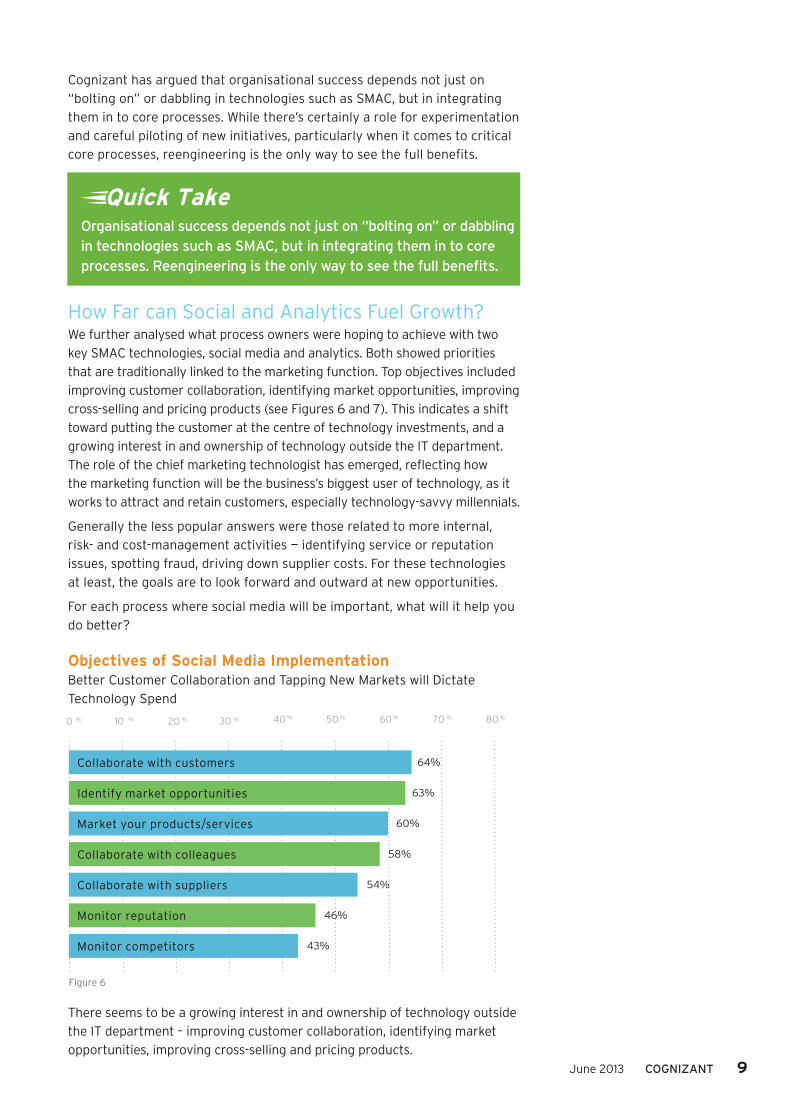
How Far can Social and Analytics Fuel Growth?We further analysed what process owners were hoping to achieve with two key SMAC technologies, social media and analytics. Both showed priorities that are traditionally linked to the marketing function. Top objectives included improving customer collaboration, identifying market opportunities, improving cross-selling and pricing products (see Figures 6 and 7). This indicates a shift toward putting the customer at the centre of technology investments, and a growing interest in and ownership of technology outside the IT department. The role of the chief marketing technologist has emerged, refl ecting how the marketing function will be the business’s biggest user of technology, as it works to attract and retain customers, especially technology-savvy millennials.
Generally the less popular answers were those related to more internal, risk- and cost-management activities — identifying service or reputation issues, spotting fraud, driving down supplier costs. For these technologies at least, the goals are to look forward and outward at new opportunities.
For each process where social media will be important, what will it help you do better?
objectives of Social Media implementationBetter Customer Collaboration and Tapping New Markets will Dictate Technology Spend
There seems to be a growing interest in and ownership of technology outside the IT department – improving customer collaboration, identifying market opportunities, improving cross-selling and pricing products.
OtherManager
Director
C-suite, SVP or VP
34%
57%
6%
3%
Figure 1
Figure 2
4%
15% 47%
4% 29%
>£6.5 billion
£0.65-£1.2 billion £320-£649 million
£3-£6.4 billion £1.3-£2.9 billion
Figure 3
100 %
80 %
%60%
40 %
20 %%
0%
64%
49% 48% 45%
34%24%
10%
Costreduction
Newmarkets
Agilityand
flexibility
New channelsto market
Operatingrisk
Migrate fromcapex to opex
financing
Talent
Business Goals That Will Shape Process Performance In Next 2-3 YearsCosts will always be a key driver, but accessing new markets, creating operational agilityand new channels will become critical business goals
40% 50 %30 %20 %10 %0 %0 %10 %20 %30 %40 %50 %
21% 18%Very Well
(5)
46% 38%Well(4)
27% 34%Fairly Well
(3)
1 % 4%Poorly
(2)
1 % 2 %Very Poorly
(1)
How well processes meet todays requirements? How well will they meet in the next 2-3 years?
If left unchanged processes will soon start to lag behind
Figure 4
Figure 5
The Unstoppable Growth Of SMAC Stack™SMAC Stack will become critical catalyst for driving process innovation
Software as a Service
Business process platforms
Business analytics
Public social media
Mobile tools for employees
Cloud infrastructure
Enterprise social media
53%
45%
43%
41%
32%
32%
28%
56%
44%
37%
34%
33%
25%
21%
Figure 6
40% 50 % 60% 70 % 80%30 %20 %10 %0 %
64%Collaborate with customers
63%
60%
58%
Identify market opportunities
Market your products/services
Collaborate with colleagues
54%Collaborate with suppliers
46%Monitor reputation
43%Monitor competitors
Objectives Of Social Media ImplementationBetter Customer Collaboration and Tapping New Markets will dictate technology spend
50 %
60%
70 %
40 %
30 %
%20 %
0%
10 %%
54%52%
50%49%
48% 46%43%
Iden
tify
cro
ss-s
ellin
g op
port
unit
ies
Pri
ce p
rodu
cts
and
serv
ices
Rea
ct t
o cu
stom
er d
eman
d
Iden
tify
mar
ket
oppo
rtun
itie
s
Seg
men
t cu
stom
ers
Iden
tify
fra
ud a
nd/o
r w
aste
Neg
otia
te w
ith
supp
liers
Importance Of AnalyticsAnalytics will support greater market penetration and agile customer responsiveness
Analytics is being used to drive sales andstrong market presence, either integrated as
apart of shared services group or throughindividual business groups.
Figure 7
Figure 8
Bulk of the work handled by:Centralisation and process consolidation through internal shared services groups
16%72%
10%
2%
An internal shared services group
An external services provider
Employees, not part of shared services
Don’t know
10%Less of the work
47%About the same
4%Don’t know
39%More of the work
Figure 9
80 %60 %40 %20 %0 %0 %20 %40 %60 %80 %
70% 57%Higher quality/
reliability
62% 45%Lower cost
62% 58%Better
technology
35%More capacity
27%Broader
functionality
30%More modern
approach
34%Greater ease
of use
Internal External
Reliability and Costs key for why more work will be handled in houseMore then cost savings, external shared services provider could be a catalyst for implementation of newer and innovative technology
53%
46%
45%
43%
Drivers for Internal / External Shared Services Centre
Figure 10
Currently used 2–3 years later
organisational success depends not just on “bolting on” or dabbling in technologies such as SMaC, but in integrating them in to core processes. Reengineering is the only way to see the full benefi ts.
Quick Take
10 BuSinESS ProCESS SErviCES June 2013
“There’s a big budget multi-year effort around the management of client data, and how we can use it intelligently to market to the client. We are starting to track how many products and services a client signs up for in their fi rst 6 months, and comparing that against a baseline profi le of services taken by similar clients. We can use this data to adjust our “default” service options and to promote appropriate services to each client. Analytics is a way to get clients exposed to the full breadth and depth of services that we have.”
Director at a Large Brokerage.
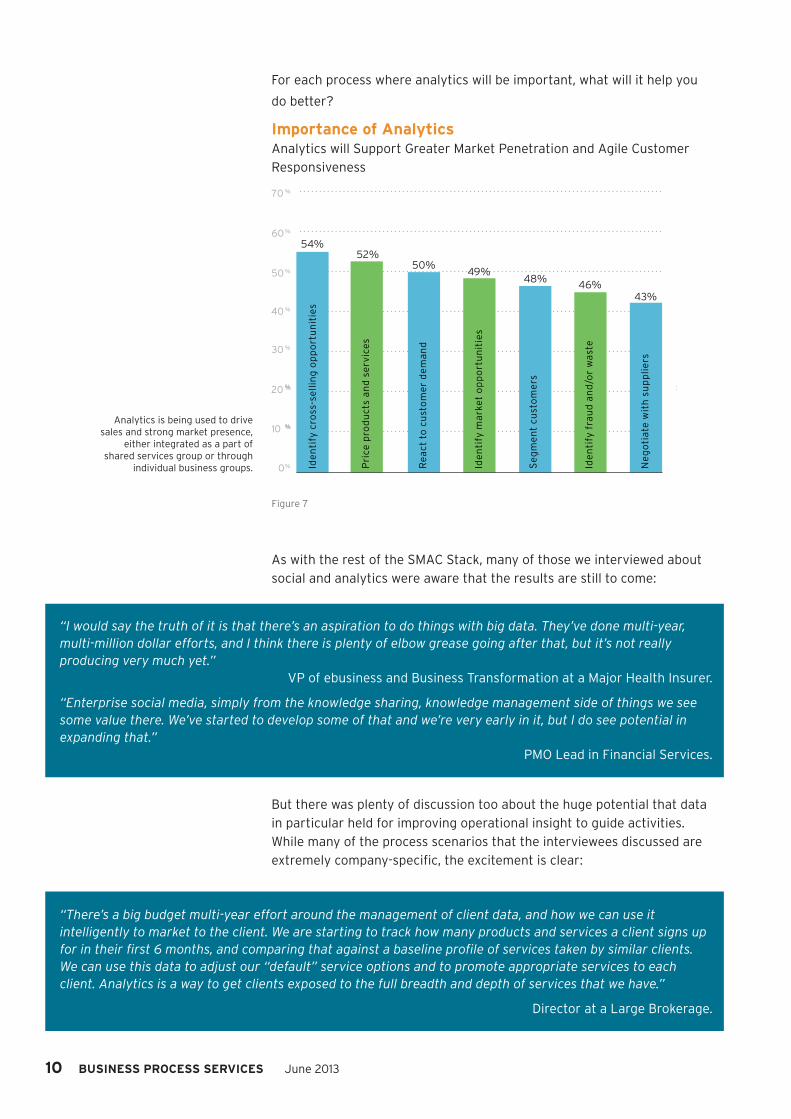
For each process where analytics will be important, what will it help you
do better?
importance of AnalyticsAnalytics will Support Greater Market Penetration and Agile Customer Responsiveness
As with the rest of the SMAC Stack, many of those we interviewed about social and analytics were aware that the results are still to come:
But there was plenty of discussion too about the huge potential that data in particular held for improving operational insight to guide activities. While many of the process scenarios that the interviewees discussed are extremely company-specifi c, the excitement is clear:
Analytics is being used to drive sales and strong market presence,
either integrated as a part of shared services group or through
individual business groups.
OtherManager
Director
C-suite, SVP or VP
34%
57%
6%
3%
Figure 1
Figure 2
4%
15% 47%
4% 29%
>£6.5 billion
£0.65-£1.2 billion £320-£649 million
£3-£6.4 billion £1.3-£2.9 billion
Figure 3
100 %
80 %
%60%
40 %
20 %%
0%
64%
49% 48% 45%
34%24%
10%
Costreduction
Newmarkets
Agilityand
flexibility
New channelsto market
Operatingrisk
Migrate fromcapex to opex
financing
Talent
Business Goals That Will Shape Process Performance In Next 2-3 YearsCosts will always be a key driver, but accessing new markets, creating operational agilityand new channels will become critical business goals
40% 50 %30 %20 %10 %0 %0 %10 %20 %30 %40 %50 %
21% 18%Very Well
(5)
46% 38%Well(4)
27% 34%Fairly Well
(3)
1 % 4%Poorly
(2)
1 % 2 %Very Poorly
(1)
How well processes meet todays requirements? How well will they meet in the next 2-3 years?
If left unchanged processes will soon start to lag behind
Figure 4
Figure 5
The Unstoppable Growth Of SMAC Stack™SMAC Stack will become critical catalyst for driving process innovation
Software as a Service
Business process platforms
Business analytics
Public social media
Mobile tools for employees
Cloud infrastructure
Enterprise social media
53%
45%
43%
41%
32%
32%
28%
56%
44%
37%
34%
33%
25%
21%
Figure 6
40% 50 % 60% 70 % 80%30 %20 %10 %0 %
64%Collaborate with customers
63%
60%
58%
Identify market opportunities
Market your products/services
Collaborate with colleagues
54%Collaborate with suppliers
46%Monitor reputation
43%Monitor competitors
Objectives Of Social Media ImplementationBetter Customer Collaboration and Tapping New Markets will dictate technology spend
50 %
60%
70 %
40 %
30 %
%20 %
0%
10 %%
54%52%
50%49%
48% 46%43%
Iden
tify
cro
ss-s
ellin
g op
port
unit
ies
Pri
ce p
rodu
cts
and
serv
ices
Rea
ct t
o cu
stom
er d
eman
d
Iden
tify
mar
ket
oppo
rtun
itie
s
Seg
men
t cu
stom
ers
Iden
tify
fra
ud a
nd/o
r w
aste
Neg
otia
te w
ith
supp
liers
Importance Of AnalyticsAnalytics will support greater market penetration and agile customer responsiveness
Analytics is being used to drive sales andstrong market presence, either integrated as
apart of shared services group or throughindividual business groups.
Figure 7
Figure 8
Bulk of the work handled by:Centralisation and process consolidation through internal shared services groups
16%72%
10%
2%
An internal shared services group
An external services provider
Employees, not part of shared services
Don’t know
10%Less of the work
47%About the same
4%Don’t know
39%More of the work
Figure 9
80 %60 %40 %20 %0 %0 %20 %40 %60 %80 %
70% 57%Higher quality/
reliability
62% 45%Lower cost
62% 58%Better
technology
35%More capacity
27%Broader
functionality
30%More modern
approach
34%Greater ease
of use
Internal External
Reliability and Costs key for why more work will be handled in houseMore then cost savings, external shared services provider could be a catalyst for implementation of newer and innovative technology
53%
46%
45%
43%
Drivers for Internal / External Shared Services Centre
Figure 10
Currently used 2–3 years later
“I would say the truth of it is that there’s an aspiration to do things with big data. They’ve done multi-year, multi-million dollar efforts, and I think there is plenty of elbow grease going after that, but it’s not really producing very much yet.”
VP of ebusiness and Business Transformation at a Major Health Insurer.
“Enterprise social media, simply from the knowledge sharing, knowledge management side of things we see some value there. We’ve started to develop some of that and we’re very early in it, but I do see potential in expanding that.”
PMO Lead in Financial Services.
June 2013 Cognizant 11
The More Effective Delivery routeas the demands placed on processes change, and as new technologies such as the SMaC Stack present opportunities for operational reengineering, many businesses are looking at how processes are performed and delivered by their organisations.
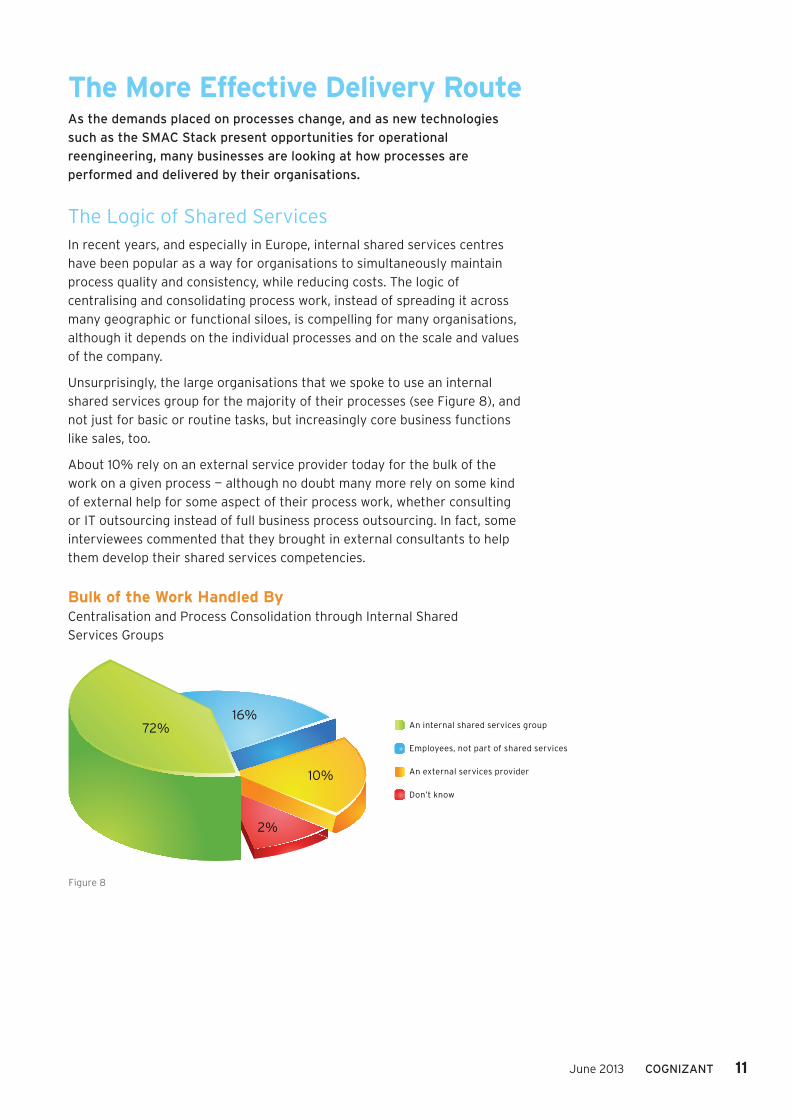
The Logic of Shared ServicesIn recent years, and especially in Europe, internal shared services centres have been popular as a way for organisations to simultaneously maintain process quality and consistency, while reducing costs. The logic of centralising and consolidating process work, instead of spreading it across many geographic or functional siloes, is compelling for many organisations, although it depends on the individual processes and on the scale and values of the company.
Unsurprisingly, the large organisations that we spoke to use an internal shared services group for the majority of their processes (see Figure 8), and not just for basic or routine tasks, but increasingly core business functions like sales, too.
About 10% rely on an external service provider today for the bulk of the work on a given process — although no doubt many more rely on some kind of external help for some aspect of their process work, whether consulting or IT outsourcing instead of full business process outsourcing. In fact, some interviewees commented that they brought in external consultants to help them develop their shared services competencies.
Bulk of the Work Handled ByCentralisation and Process Consolidation through Internal Shared Services Groups
OtherManager
Director
C-suite, SVP or VP
34%
57%
6%
3%
Figure 1
Figure 2
4%
15% 47%
4% 29%
>£6.5 billion
£0.65-£1.2 billion £320-£649 million
£3-£6.4 billion £1.3-£2.9 billion
Figure 3
100 %
80 %
%60%
40 %
20 %%
0%
64%
49% 48% 45%
34%24%
10%
Costreduction
Newmarkets
Agilityand
flexibility
New channelsto market
Operatingrisk
Migrate fromcapex to opex
financing
Talent
Business Goals That Will Shape Process Performance In Next 2-3 YearsCosts will always be a key driver, but accessing new markets, creating operational agilityand new channels will become critical business goals
40% 50 %30 %20 %10 %0 %0 %10 %20 %30 %40 %50 %
21% 18%Very Well
(5)
46% 38%Well(4)
27% 34%Fairly Well
(3)
1 % 4%Poorly
(2)
1 % 2 %Very Poorly
(1)
How well processes meet todays requirements? How well will they meet in the next 2-3 years?
If left unchanged processes will soon start to lag behind
Figure 4
Figure 5
The Unstoppable Growth Of SMAC Stack™SMAC Stack will become critical catalyst for driving process innovation
Software as a Service
Business process platforms
Business analytics
Public social media
Mobile tools for employees
Cloud infrastructure
Enterprise social media
53%
45%
43%
41%
32%
32%
28%
56%
44%
37%
34%
33%
25%
21%
Figure 6
40% 50 % 60% 70 % 80%30 %20 %10 %0 %
64%Collaborate with customers
63%
60%
58%
Identify market opportunities
Market your products/services
Collaborate with colleagues
54%Collaborate with suppliers
46%Monitor reputation
43%Monitor competitors
Objectives Of Social Media ImplementationBetter Customer Collaboration and Tapping New Markets will dictate technology spend
50 %
60%
70 %
40 %
30 %
%20 %
0%
10 %%
54%52%
50%49%
48% 46%43%
Iden
tify
cro
ss-s
ellin
g op
port
unit
ies
Pri
ce p
rodu
cts
and
serv
ices
Rea
ct t
o cu
stom
er d
eman
d
Iden
tify
mar
ket
oppo
rtun
itie
s
Seg
men
t cu
stom
ers
Iden
tify
fra
ud a
nd/o
r w
aste
Neg
otia
te w
ith
supp
liers
Importance Of AnalyticsAnalytics will support greater market penetration and agile customer responsiveness
Analytics is being used to drive sales andstrong market presence, either integrated as
apart of shared services group or throughindividual business groups.
Figure 7
Figure 8
Bulk of the work handled by:Centralisation and process consolidation through internal shared services groups
16%72%
10%
2%
An internal shared services group
An external services provider
Employees, not part of shared services
Don’t know
10%Less of the work
47%About the same
4%Don’t know
39%More of the work
Figure 9
80 %60 %40 %20 %0 %0 %20 %40 %60 %80 %
70% 57%Higher quality/
reliability
62% 45%Lower cost
62% 58%Better
technology
35%More capacity
27%Broader
functionality
30%More modern
approach
34%Greater ease
of use
Internal External
Reliability and Costs key for why more work will be handled in houseMore then cost savings, external shared services provider could be a catalyst for implementation of newer and innovative technology
53%
46%
45%
43%
Drivers for Internal / External Shared Services Centre
Figure 10
Currently used 2–3 years later
12 BuSinESS ProCESS SErviCES June 2013
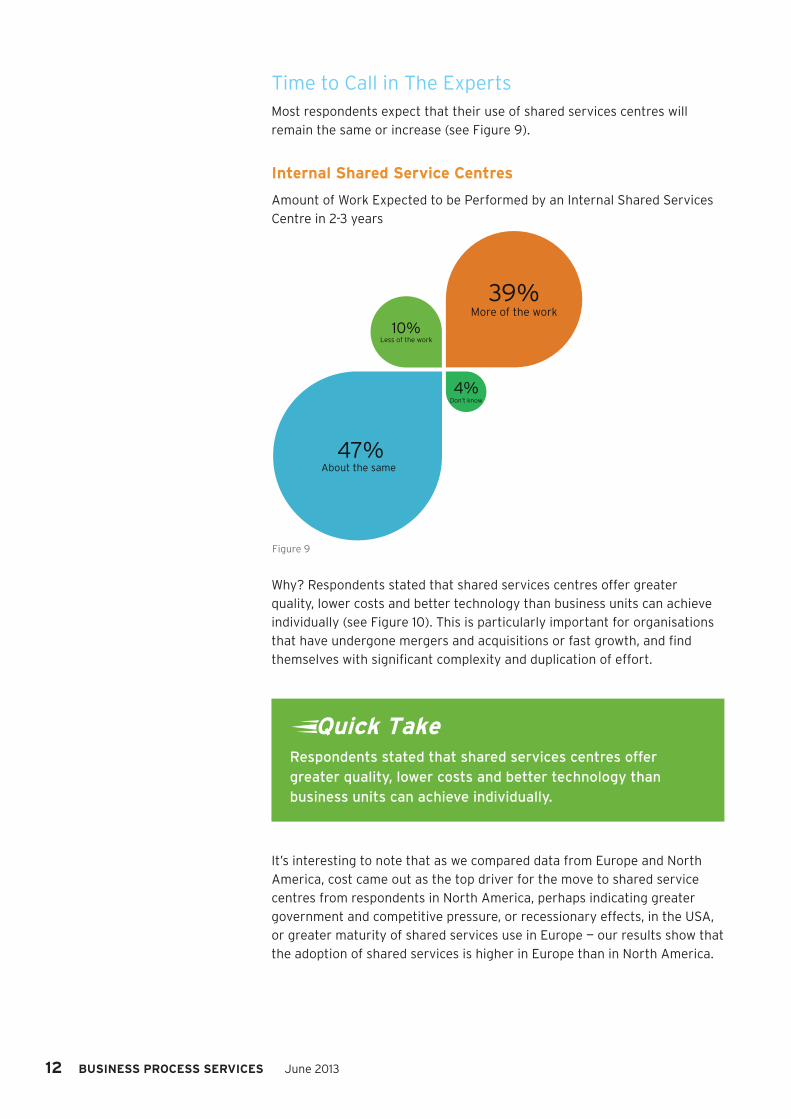
Time to Call in The ExpertsMost respondents expect that their use of shared services centres will remain the same or increase (see Figure 9).
internal Shared Service Centres
Amount of Work Expected to be Performed by an Internal Shared Services Centre in 2-3 years
Why? Respondents stated that shared services centres offer greater quality, lower costs and better technology than business units can achieve individually (see Figure 10). This is particularly important for organisations that have undergone mergers and acquisitions or fast growth, and fi nd themselves with signifi cant complexity and duplication of effort.
It’s interesting to note that as we compared data from Europe and North America, cost came out as the top driver for the move to shared service centres from respondents in North America, perhaps indicating greater government and competitive pressure, or recessionary effects, in the USA, or greater maturity of shared services use in Europe — our results show that the adoption of shared services is higher in Europe than in North America.
OtherManager
Director
C-suite, SVP or VP
34%
57%
6%
3%
Figure 1
Figure 2
4%
15% 47%
4% 29%
>£6.5 billion
£0.65-£1.2 billion £320-£649 million
£3-£6.4 billion £1.3-£2.9 billion
Figure 3
100 %
80 %
%60%
40 %
20 %%
0%
64%
49% 48% 45%
34%24%
10%
Costreduction
Newmarkets
Agilityand
flexibility
New channelsto market
Operatingrisk
Migrate fromcapex to opex
financing
Talent
Business Goals That Will Shape Process Performance In Next 2-3 YearsCosts will always be a key driver, but accessing new markets, creating operational agilityand new channels will become critical business goals
40% 50 %30 %20 %10 %0 %0 %10 %20 %30 %40 %50 %
21% 18%Very Well
(5)
46% 38%Well(4)
27% 34%Fairly Well
(3)
1 % 4%Poorly
(2)
1 % 2 %Very Poorly
(1)
How well processes meet todays requirements? How well will they meet in the next 2-3 years?
If left unchanged processes will soon start to lag behind
Figure 4
Figure 5
The Unstoppable Growth Of SMAC Stack™SMAC Stack will become critical catalyst for driving process innovation
Software as a Service
Business process platforms
Business analytics
Public social media
Mobile tools for employees
Cloud infrastructure
Enterprise social media
53%
45%
43%
41%
32%
32%
28%
56%
44%
37%
34%
33%
25%
21%
Figure 6
40% 50 % 60% 70 % 80%30 %20 %10 %0 %
64%Collaborate with customers
63%
60%
58%
Identify market opportunities
Market your products/services
Collaborate with colleagues
54%Collaborate with suppliers
46%Monitor reputation
43%Monitor competitors
Objectives Of Social Media ImplementationBetter Customer Collaboration and Tapping New Markets will dictate technology spend
50 %
60%
70 %
40 %
30 %
%20 %
0%
10 %%
54%52%
50%49%
48% 46%43%
Iden
tify
cro
ss-s
ellin
g op
port
unit
ies
Pri
ce p
rodu
cts
and
serv
ices
Rea
ct t
o cu
stom
er d
eman
d
Iden
tify
mar
ket
oppo
rtun
itie
s
Seg
men
t cu
stom
ers
Iden
tify
fra
ud a
nd/o
r w
aste
Neg
otia
te w
ith
supp
liers
Importance Of AnalyticsAnalytics will support greater market penetration and agile customer responsiveness
Analytics is being used to drive sales andstrong market presence, either integrated as
apart of shared services group or throughindividual business groups.
Figure 7
Figure 8
Bulk of the work handled by:Centralisation and process consolidation through internal shared services groups
16%72%
10%
2%
An internal shared services group
An external services provider
Employees, not part of shared services
Don’t know
10%Less of the work
47%About the same
4%Don’t know
39%More of the work
Figure 9
80 %60 %40 %20 %0 %0 %20 %40 %60 %80 %
70% 57%Higher quality/
reliability
62% 45%Lower cost
62% 58%Better
technology
35%More capacity
27%Broader
functionality
30%More modern
approach
34%Greater ease
of use
Internal External
Reliability and Costs key for why more work will be handled in houseMore then cost savings, external shared services provider could be a catalyst for implementation of newer and innovative technology
53%
46%
45%
43%
Drivers for Internal / External Shared Services Centre
Figure 10
Currently used 2–3 years later
Respondents stated that shared services centres offer greater quality, lower costs and better technology than business units can achieve individually.
Quick Take
June 2013 Cognizant 13
Beyond the Basics – Greater Expectation of External ProvidersConventional wisdom is that outsourcing to an external provider is done for cost-saving reasons, and tends to involve the use of low-cost offshore resources, applied to routine tasks like processing invoices or handling fi rst-line customer support.
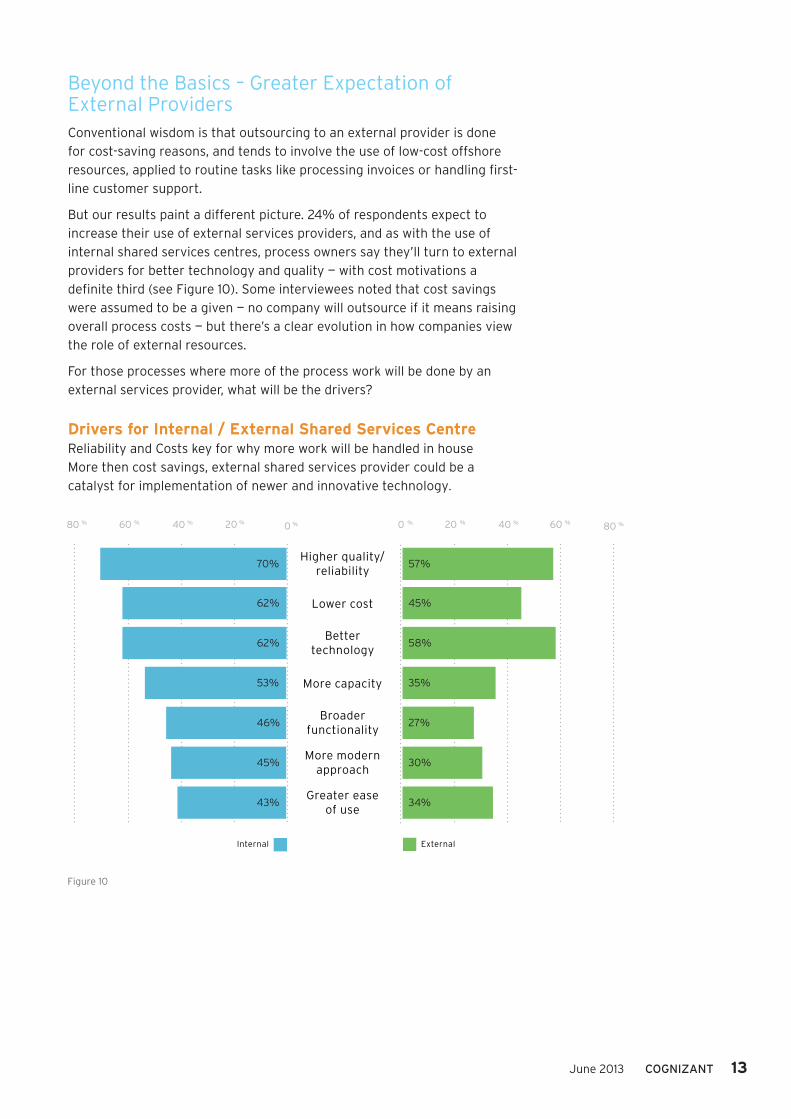
But our results paint a different picture. 24% of respondents expect to increase their use of external services providers, and as with the use of internal shared services centres, process owners say they’ll turn to external providers for better technology and quality — with cost motivations a defi nite third (see Figure 10). Some interviewees noted that cost savings were assumed to be a given — no company will outsource if it means raising overall process costs — but there’s a clear evolution in how companies view the role of external resources.
For those processes where more of the process work will be done by an external services provider, what will be the drivers?
Drivers for internal / External Shared Services CentreReliability and Costs key for why more work will be handled in houseMore then cost savings, external shared services provider could be a catalyst for implementation of newer and innovative technology.
OtherManager
Director
C-suite, SVP or VP
34%
57%
6%
3%
Figure 1
Figure 2
4%
15% 47%
4% 29%
>£6.5 billion
£0.65-£1.2 billion £320-£649 million
£3-£6.4 billion £1.3-£2.9 billion
Figure 3
100 %
80 %
%60%
40 %
20 %%
0%
64%
49% 48% 45%
34%24%
10%
Costreduction
Newmarkets
Agilityand
flexibility
New channelsto market
Operatingrisk
Migrate fromcapex to opex
financing
Talent
Business Goals That Will Shape Process Performance In Next 2-3 YearsCosts will always be a key driver, but accessing new markets, creating operational agilityand new channels will become critical business goals
40% 50 %30 %20 %10 %0 %0 %10 %20 %30 %40 %50 %
21% 18%Very Well
(5)
46% 38%Well(4)
27% 34%Fairly Well
(3)
1 % 4%Poorly
(2)
1 % 2 %Very Poorly
(1)
How well processes meet todays requirements? How well will they meet in the next 2-3 years?
If left unchanged processes will soon start to lag behind
Figure 4
Figure 5
The Unstoppable Growth Of SMAC Stack™SMAC Stack will become critical catalyst for driving process innovation
Software as a Service
Business process platforms
Business analytics
Public social media
Mobile tools for employees
Cloud infrastructure
Enterprise social media
53%
45%
43%
41%
32%
32%
28%
56%
44%
37%
34%
33%
25%
21%
Figure 6
40% 50 % 60% 70 % 80%30 %20 %10 %0 %
64%Collaborate with customers
63%
60%
58%
Identify market opportunities
Market your products/services
Collaborate with colleagues
54%Collaborate with suppliers
46%Monitor reputation
43%Monitor competitors
Objectives Of Social Media ImplementationBetter Customer Collaboration and Tapping New Markets will dictate technology spend
50 %
60%
70 %
40 %
30 %
%20 %
0%
10 %%
54%52%
50%49%
48% 46%43%
Iden
tify
cro
ss-s
ellin
g op
port
unit
ies
Pri
ce p
rodu
cts
and
serv
ices
Rea
ct t
o cu
stom
er d
eman
d
Iden
tify
mar
ket
oppo
rtun
itie
s
Seg
men
t cu
stom
ers
Iden
tify
fra
ud a
nd/o
r w
aste
Neg
otia
te w
ith
supp
liers
Importance Of AnalyticsAnalytics will support greater market penetration and agile customer responsiveness
Analytics is being used to drive sales andstrong market presence, either integrated as
apart of shared services group or throughindividual business groups.
Figure 7
Figure 8
Bulk of the work handled by:Centralisation and process consolidation through internal shared services groups
16%72%
10%
2%
An internal shared services group
An external services provider
Employees, not part of shared services
Don’t know
10%Less of the work
47%About the same
4%Don’t know
39%More of the work
Figure 9
80 %60 %40 %20 %0 %0 %20 %40 %60 %80 %
70% 57%Higher quality/
reliability
62% 45%Lower cost
62% 58%Better
technology
35%More capacity
27%Broader
functionality
30%More modern
approach
34%Greater ease
of use
Internal External
Reliability and Costs key for why more work will be handled in houseMore then cost savings, external shared services provider could be a catalyst for implementation of newer and innovative technology
53%
46%
45%
43%
Drivers for Internal / External Shared Services Centre
Figure 10
Currently used 2–3 years later
14 BuSinESS ProCESS SErviCES June 2013
These results fit clearly in the context of broader business transformations being driven by SMAC technologies. Process owners are focused on moving toward innovative, technology-enabled solutions to support the business’s competitive advantage. Often outside help is the best (or only) place to source specialist skills and technologies on demand, and we expect that as complex middle-office functions modernise in the coming years, organisations will increasingly turn to expert providers for more strategic work. As one interviewee put it:
Managing core processes through an external organisation requires trust in the capabilities of the providers and their ability to understand the industry. Taking the strategic business process to the next level will need a close collaboration between vendors and clients. Organisations will typically look at possible regulatory compliance and customer experience impact before moving anything to a strategic partner. But these concerns can’t hold up progress. Technology and business imperatives are, in the meantime, still moving on. There is simply no time to waste.
“I think from an outsourcing and offshoring perspective, it would be the simple transactional type work in the back office; the things that are simpler for us to move, and simpler for us to be successful in. Much like any other offshore journey that most companies go through, you start out with the simplest transaction type things and then you begin to move up the line towards the complexity.”
SVP Outsourcing and Offshoring, Financial Services
often outside help is the best (or only) place to source specialist skills and technologies on demand, and we expect that as complex middle-office functions modernise in the coming years, organisations will increasingly turn to expert providers for more strategic work.
Quick Take
June 2013 Cognizant 15
Conclusion: Looking to the Way AheadEven in the huge, highly regulated companies we talked to, it’s clear that the way businesses work is changing: it’s increasingly mobile, social, fast-paced, driven by consumer technologies and consumer expectations. the it foundation of familiar processes is becoming data-powered, cloud-based and mobile-accessed.
In this context, business processes can’t stand still. While it’s imperative that they have to continue to contribute to operational efficiency improvements, they have a much more important role to play: they have to support innovation and wholesale organisational transformation and push hard to keep pace with changing business priorities. Agility and flexibility are the watchwords as organisations look to new markets and channels for growth.
Our study shows that European process experts are aware that their processes are at risk of falling behind business needs, competitors, and customer expectations if they don’t act now. They’re looking for ways to improve, and in today’s landscape that means embracing new technologies — such as social, mobile, analytics and cloud — the SMAC Stack and newer operational models that make them more agile. As the task gets underway, process owners will call on help from both shared services centres and external service providers: not just to reduce the cost of rote task-based processes, but to improve quality, contribute technology and add capacity to more strategic core processes too.
Business processes can’t stand still. they have a much more important role to play: they have to support innovation and wholesale organisational transformation and push hard to keep pace with changing business priorities.
Quick Take
Find out moreTo learn more about this study, or to talk to us about your own process transformation and business needs, visit cognizant.com/business-process-services
16 BuSinESS ProCESS SErviCES June 2013
About CognizantCognizant (NASDAQ: CTSH) is a leading provider of information technology, consulting, and business process outsourcing services, dedicated to helping the world’s leading companies. Every day we are helping clients — including 12 of the top 25 global life insurers and property and casualty insurers, 27 of the top 30 global pharma companies, 2 of the top 4 global distribution system companies, and 8 of the top 10 European banks — build stronger businesses. We specialise in helping them embrace powerful forces — including accelerating globalisation, virtualisation, a millennial mindset and new cloud-based technologies — that are forcing companies to rethink traditional ways of working. We call it the “Future of Work.”
Headquartered in Teaneck, New Jersey (U.S.), Cognizant combines a passion for client satisfaction, technology innovation, deep industry and business process expertise, and a global, collaborative workforce that embodies the future of work. Ranked by KPMG as #1 in customer satisfaction across Europe, we believe in investing in our customer successes.
With over 50 delivery centres worldwide and approximately 156,700 employees (as of December 31, 2012), Cognizant is a member of the NASDAQ-100, the S&P 500, the Forbes Global 2000, and the Fortune 500 and is ranked among the top performing and fastest growing companies in the world.
Visit us online at www.cognizant.com or follow us on twitter: Cognizant.
European Headquarters
1 Kingdom StreetPaddington Central
London, W2 6BD United KingdomPhone: +44 (0) 20 7297 7600
Fax: +44 (0) 20 7121 [email protected]
© Copyright 2013, Cognizant. All rights reserved.No part of this document may be reproduced, stored in a retrieval system, transmitted in any formor by any means, electronic, mechanical, photocopying, recording, or otherwise, without the express written permission from Cognizant. The information contained herein is subject to change without notice. All other trademarks mentioned herein are the property of their respective owners.