Embed Size (px)
Citation preview
Business Process Analysis in Healthcare Environments:a Methodology based on Process Mining
Alvaro Rebugea, Diogo R. Ferreirab
aHospital de Sao Sebastiao, EPERua Dr. Candido de Pinho, 4520-211 Santa Maria da Feira, Portugal
bIST – Technical University of LisbonAvenida Prof. Dr. Cavaco Silva, 2744-016 Porto Salvo, Portugal
Abstract
Performing business process analysis in healthcare organizations is particularly difficult due to the highly-
dynamic, complex, ad-hoc, and multi-disciplinary nature of healthcare processes. Process mining is a promising
approach to obtain a better understanding about those processes by analyzing event data recorded in healthcare
information systems. However, not all process mining techniques perform well in capturing the complex and
ad-hoc nature of clinical workflows. In this work we introduce a methodology for the application of process
mining techniques that leads to the identification of regular behavior, process variants, and exceptional medical
cases. The approach is demonstrated in a case study conducted at a hospital emergency service. For this pur-
pose, we implemented the methodology in a tool that integrates the main stages of process analysis. The tool is
specific to the case study, but the same methodology can be used in other healthcare environments.
Key words: Business Process Analysis, Healthcare Processes, Process Mining, Sequence Clustering
1. Introduction
Business process improvement is a topic of increasing concern and a critical success factor for healthcare
organizations worldwide. The purpose is to increase organizational performance by process or information
system redesign, covering the fundamental needs for today’s healthcare organizations [1, 2, 3, 4]. These orga-
nizations are constantly pushed to improve the quality of care services in an unfavorable economical scenario
and under financial pressure by governments [4, 1]. Improving process efficiency is therefore of utmost im-
portance. On the other hand, it has been reported that faulty healthcare processes are one of the main causes
leading practitioners to make technical mistakes [5]. These can severely compromise patient safety and even
cost lives [6]. Moreover, recent trends such as patient-centric services and integrated care pathways have been
introduced to improve the quality of care services, which are also requiring healthcare organizations to redesign
and adapt their processes [3, 1]. They break functional boundaries and offer an explicit process-oriented view of
healthcare where the efficient collaboration and coordination of physicians becomes a critical issue [2, 3, 1]. In
this scenario, healthcare information systems should be designed to directly support clinical and administrative
Preprint submitted to Information Systems January 11, 2011
processes, integrating and coordinating the work of physicians [4, 3, 1]. Unfortunately, in general these systems
need to be rethought since they lack maturity and interoperability with other systems, and offer a weak support
to healthcare processes [5, 7, 8]. In some specific cases, the proportion of these problems can be worrisome [7].
Business Process Analysis (BPA) [9] becomes extremely important to enable the successful improvement
of business processes [10, 11]. BPA aims to provide organizations with knowledge to understand how their
processes are currently being performed. This knowledge can then be used to detect gaps between guidelines
and actual practices, so that organizations can improve processes and systems in alignment with their strategical
objectives [9]. The motivation for this work is to provide healthcare organizations with means to perform
BPA, in particular with the aid of process mining. We limit our scope to the operational business processes of
healthcare organizations, commonly known as healthcare processes.
1.1. Healthcare Processes
Healthcare processes can be classified as medical treatment processes or generic organizational processes
[3]. Medical treatment processes, also known as clinical processes, are directly linked to the patient and
are executed according to a diagnostic-therapeutic cycle, comprising observation, reasoning and action. The
diagnostic-therapeutic cycle heavily depends on medical knowledge to deal with case-specific decisions that are
made by interpreting patient-specific information. On the other hand, organizational or administrative processes
are generic process patterns that support medical treatment processes in general. They are not tailored for a
specific condition but aim to coordinate medical treatment among different people and organizational units.
Patient scheduling and exam requests are two examples of organizational processes.
None of these processes are trivial. They are executed under an environment that is continually changing
and that is commonly accepted to be one of the most complex when compared to other environments [1]. The
healthcare environment and its underlying processes have peculiar characteristics with respect to their degree
of dynamism, complexity and multi-disciplinary nature. In general, healthcare processes are recognized to have
the following characteristics:
• Healthcare processes are highly dynamic [12, 4, 1, 8]. Process changes occur due to a variety of reasons
including the introduction of new administrative procedures, technological developments, or the discov-
ery of new drugs. Moreover, medical knowledge has a strong academic background that is continuously
evolving, meaning that new treatment and diagnostic procedures are constantly being discovered that
may invalidate current treatment pathways or require adaptations. Also new diseases are constantly being
discovered that may require healthcare organizations to implement new processes.
• Healthcare processes are highly complex [13, 14, 4, 3, 1]. Complexity arises from many factors such
as a complex medical decision process, large amounts of data to be exchanged, and the unpredictability
of patients and treatments. The medical decision process is made by interpreting patient-specific data
2
according to medical knowledge. This decision process is the basis of clinical processes and it is difficult
to capture, as medical knowledge includes several kinds of medical guidelines, as well as the individual
experience of physicians. Also, the amount of data that supports medical decisions is large and of various
types; consider for example the different types of reports or the different types of exams that are possible
and are exchanged between physicians. Moreover, the patient’s body may react differently to drugs
and complications may arise during treatment, meaning that new medical decisions need to be made
accordingly. Medical decisions and treatment outcomes may therefore be unpredictable, also meaning
that as clinical processes are instantiated their behavior may also be unpredictable.
• Healthcare processes are increasingly multi-disciplinary [8, 12]. Healthcare organizations are charac-
terized by an increasing level of specialized departments and medical disciplines, and care services are
increasingly delivered across organizations within healthcare networks. Healthcare processes, therefore,
are increasingly executed according to a wide range of distributed activities, performed by the collabora-
tive effort of professionals with different skills, knowledge and organizational culture.
• Healthcare processes are ad-hoc [12, 14, 13]. Healthcare highly depends on distributed human collab-
oration, and participants have the expertise and autonomy to decide their own working procedures. As
physicians have the power to act according their knowledge and experience, and need to deviate from
defined guidelines to deal with specific patient situations, the result is that there are processes with high
degree of variability, non-repetitive character, and whose order of execution is non-deterministic to a large
extent.
1.2. Problem Definition
Traditional BPA assumes that people must be capable of explaining what is happening within the organiza-
tion and describing it in terms of processes, such that each description is valid, unambiguous, and is a useful
abstraction of reality [9]. These descriptions can be represented in terms of process models [15, 16]. Tradition-
ally, process models result from the collaborative effort between key stakeholders and process analysts, as on
one side we have the inside knowledge of how the organization works, and on the other side the expertise to
represent that knowledge in formal languages associated with process modeling [1]. This traditional approach
has two main problems.
The first is that traditional BPA is time-consuming [17, 18], as it implies lengthy discussions with workers,
extensive document analysis, careful observation of participants, etc. The second problem is that, typically,
there are discrepancies between the actual business processes and the way they are perceived or described by
people [17]. Several reasons for this can be pointed out, including the inherent difficulty in understanding
complex and non-deterministic phenomena [19, 20]. The more complex and ad-hoc the processes are, the more
difficult it will be for people to describe them. Also, when processes involve distributed activities, it is difficult
3
for workers to have a shared and common perspective of the global process [21], especially if the process
is continually changing. In summary, we find that BPA is extremely important for healthcare organizations;
however, traditional approaches are time-consuming, and they may not provide an accurate picture of business
processes, which are highly dynamic, highly complex, multi-disciplinary and ad-hoc.
1.3. The Role of Process Mining
Process mining offers an interesting approach to solve or mitigate the above problems [22]. As organizations
depend on information systems to support their work, these systems can record a wide range of valuable data,
such as which tasks were performed, who performed the task, and when. For example, as patients enter an
emergency department a system records the triage, the nurse who performed it, the time it occurred, and for
which patient, i.e. the work case. These event data can be organized in such a way that they contain a history of
what happened during process execution, and this history can be analyzed using process mining techniques.
The extraction of process knowledge from systems, which can be made automatically to a large extent, can
reduce the time required for process analysis. The main benefit, however, is that the models acquired from
process mining are based on real executions of the processes; therefore, one gains insight about what is actually
happening, and ultimately the knowledge provided by process mining can be used for effective improvement of
those processes and of their supporting systems.
In healthcare environments, it may be possible to extract event data from several kinds of specialized systems
[14], such as those based on Electronic Patient Records (EPR). As another example, radiology information
systems (RIS) can record the workflow of patient examinations, from the exam request to the exam report.
Also, emergency information systems can record the careflow of patients, and billing information systems
usually combine data from other hospital systems about the activities performed on a patient.
1.4. Research Goals
The main goal of our work is to devise a methodology based on process mining in order to support BPA
in healthcare. The methodology includes process mining techniques that are especially useful in healthcare
environments, given the characteristics of healthcare processes. To validate the approach, we conducted a case
study in the Hospital of Sao Sebastiao, located in the north of Portugal. To support the case study, we developed
a tool that implemented the proposed methodology. The tool gathered data from the hospital information system
and provided a set of process mining techniques for the analysis of selected healthcare processes.
The structure of the paper is as follows: Section 2 provides an overview of process mining techniques
and discusses the use of these techniques in healthcare; Section 3 describes the proposed methodology for the
analysis of healthcare processes; Section 4 presents the case study at the Hospital of Sao Sebastiao; and section
5 concludes the paper.
4
2. Related Work
In the context of Business Process Management (BPM) [10, 16] there is a life-cycle associated with business
processes that comprises the following phases: (1) design; (2) configuration; (3) enactment; and (4) diagnosis
of business processes. The role of process mining is to support the design and diagnosis of processes while
also changing the traditional life-cycle approach. Instead of starting by designing a process model, it could be
that there are systems that record event data such as tasks that have been executed, their order of execution, and
the process instance they belong to. These event data can be used to extract knowledge about the process and
therefore they are especially useful for the purpose of process analysis.
Event data can be analyzed according to different perspectives [22]: (1) the control-flow perspective; (2)
the organizational perspective; (3) the data perspective; and (4) the performance perspective. The control-
flow perspective is concerned with the process behavior, namely the activities in the process and their order
of execution. The organizational perspective focuses on the relationships between the users who performed
the activities, such as whether they belong to the same or to different groups or organizational units. The
performance perspective aims at detecting bottlenecks or calculating performance indicators, such as throughput
times and sojourn times. The data perspective is related to the data objects that serve as input and output for the
activities in a case.
A wide range of techniques are available to support the different perspectives of process mining, and these
techniques are discussed at length in the literature. Control-flow techniques include the α-algorithm [23], the
Heuristic Miner [24], the Fuzzy Miner [25], and the Genetic Miner [26]. The organizational perspective includes
the Social Network Miner [27] and the Organizational Model Miner [28]. For the performance perspective,
there is the Performance Analysis with Petri Net plug-in [29] and the Dotted Chart Analysis plug-in [30]. For
conformance checking one may use tools such as the Conformance Checker [31] and the LTL Checker [32].
All of these techniques are available in the ProM framework [33], an open-source Java application with an
extensible plug-in architecture1. Here we will focus on a specific kind of techniques, specifically clustering
techniques, which play a key role in the proposed methodology.
2.1. Clustering Techniques
Clustering techniques can be used as a preprocessing step, and their purpose is to handle event logs that
contain large amounts of data and high variability in the recorded behavior [34]. Rather than running control-
flow mining techniques directly on large event logs, which would generate very confusing models, by using
clustering techniques it is possible to divide traces into clusters, such that similar types of behavior are grouped
in the same cluster. One can then discover simpler process models for each cluster.
1ProM can be obtained at http://prom.sourceforge.net
5
Several clustering techniques can be used for this purpose, such as the Disjunctive Workflow Schema (DWS)
plug-in [35] which can be seen as an extension of the Heuristic Miner plug-in. It uses the Heuristic Miner
to construct the initial process model; however, this model is iteratively refined and clustered with a k-means
algorithm. The final result is a tree with the models created, where the parent nodes generalize their child nodes.
At each level of the tree, a set of discriminant rules characterize each cluster. These discriminant rules identify
structural patterns that are found in the process models.
The Trace Clustering plug-in [36] offers a set of distance-based clustering techniques based on the features
of each trace, such as how frequently the tasks occur in the trace, or how many events were created by the origi-
nators in that trace. Different clustering methods, such as k-means and Self-Organizing Maps, can then be used
to group closely-related traces in the same cluster. This technique does not provide a model for visualization;
i.e. to visualize the clusters one needs to use some other mining technique.
The Sequence Clustering plug-in [37] was motivated by previous work outside the ProM framework [38, 39,
40]. Sequence clustering takes the sequences of tasks that describe each trace and groups similar sequences into
the same cluster. This technique differs from Trace Clustering in several ways. Instead of extracting features
from traces, sequence clustering focuses on the sequential behavior of traces. Also, each cluster is based on a
probabilistic model, namely a first-order Markov chain. The probabilistic nature of Markov chains makes this
technique quite robust to noise, and it provides a means to visualize each cluster. In [37], sequence clustering
was shown to generate simpler models than trace clustering techniques.
2.2. Process Mining in Healthcare Enviroments
The application of process mining for BPA in healthcare is a relatively unexplored field, although it has
already been attempted by some authors. For example, [13] applied process mining to discover how stroke
patients are treated in different hospitals. First there was a need for intensive preprocessing of clinical events
to build the event logs. Then the ProM framework was used along with the Heuristic Miner to gain insights
about the control-flow perspective of the process. Different practices that are used to treat similar patients were
discovered, together with unexpected behavior as well. The discovered process model was converted to a Petri
net. The performance of the process was then analyzed by projecting performance indicators onto the Petri net.
It was concluded that process mining can be successfully applied to understand the different clinical pathways
adopted by different hospitals and different groups of patients.
In further work, [14, 13] conducted a case study in the AMC hospital in Amsterdam. Process mining was
used to analyze the careflow of gynecological oncology patients. An intensive preprocessing of data was also
needed to build the event log. The control-flow, the organizational, and the performance perspectives of the
process were analyzed. To discover the control-flow perspective, the Heuristic Miner was used first, which
resulted in a spaghetti model that was not useful for analysis. The authors explain this difficulty based on the
complex and unstructured nature of healthcare processes. Trace Clustering and the Fuzzy Miner were then
6
used to separate the regular behavior from the infrequent one, and more understandable process models were
discovered for each cluster. To study the organizational perspective, the Social Network Analysis plug-in was
used to understand the transfer of work between hospital departments. To analyze the performance perspective,
the Dotted Chart and the Basic Performance Analysis plug-ins were used, both giving useful performance
indicators about the careflow. The discovered models were confirmed by the staff of the AMC hospital, and also
compared with an a priori flowchart of the process, with good results. It should be noted that this flowchart was
created with a lot of effort from the AMC staff. The authors concluded that process mining is an excellent tool
for the analysis of complex hospital processes.
Another study [18] focused on the problems of traditional BPA in the Erlangen University Clinic, in Ger-
many. In order to support the analysis of the radiology workflows at the clinic, the authors developed a data
warehouse for process mining. During the study several control-flow mining techniques were evaluated, and
the authors found that none of the techniques alone was able to meet all the major challenges of healthcare
processes, such as noise, incompleteness, multiple occurrence of activities, and the richness of process variants.
Approaches such as the α-algorithm and the Multi-Phase algorithm are severely affected by the incomplete-
ness and noise present in clinical logs, so they were not able to produce valid process models. The Heuristic
Miner, the DWS Algorithm, and the Genetic Miner produced the best results in the presence of noisy data. The
detection of process variants was only possible with the DWS Algorithm, since it was the only one that used
clustering techniques. The α-algorithm was the only one to (at least partially) handle activities that occurred
multiple times in the process without being part of a loop. Despite the limitations, the authors concluded that
process mining has a great potential to facilitate the understanding of medical processes and their variants.
The author of [12] evaluated the capabilities of the Heuristic Miner and also the DWS Algorithm to analyze
the careflows of an Intensive Care Unit of the Catharina Hospital, in Eindhoven. The Heuristic Miner produced
inaccurate and confusing models, and it was unable to distinguish process variants. The clustering approach
of the DWS Algorithm was able to discover some behavioral patterns; however, the discriminants rules were
hard to understand. None of them was considered to be useful to gain insight about exceptional medical cases
(that can be translated into infrequent behavior) or about variants of careflows. To handle this problem, the
author introduced the Association Rule Miner (ARM) plug-in, which aims at discovering association rules and
frequent itemsets in the event log. The technique has proved to be useful to obtain behavioral patterns in the
event log and to group similar patients. To improve the capabilities of the algorithm in discovering exceptional
medical cases, and also to obtain simpler process models, the ARM includes a clustering technique that divides
the log into clusters with similar association rules and frequent itemsets.
2.3. Discussion
Related work by several authors suggests that process mining can be successfully applied to the analysis
of healthcare processes [14, 18, 13, 13, 12]. However, most of the techniques are not useful to handle the
7
complex and ad-hoc nature of these processes [18, 13, 13]. The main challenges to be addressed are: (1) the
incompleteness and noise of clinical event logs [14, 18, 13, 12]; (2) the richness in process variants, that need to
be clearly distinguished [14, 18, 12]; and (3) the exceptional medical cases (in the form of infrequent behavior),
which must be captured and not disregarded [14, 18, 13]. With respect to noise and the incompleteness of
event logs, it is commonly accepted that approaches such as the α-algorithm and the Multi-Phase miner do
not provide useful results. The Heuristic Miner is a good approach to handle noise [13] but the richness of
process variants results in confusing models, making it impossible to distinguish exceptional medical cases
[14, 18, 12]. Clustering techniques are highly recommended for these situations. The DWS Algorithm can
provide some results [18], but they are not the most useful [12]; both Trace Clustering and the ARM techniques
seem to perform better than the DWS Algorithm [14, 12]. The Fuzzy Miner has also been successfully used
[14]. The usefulness of Sequence Clustering has not been demonstrated in real-life healthcare settings, but it
seems to be an interesting approach, since it has already been successfully applied in other complex and ad-hoc
environments [38, 40, 41, 39, 37] and it may perform better than the Trace Clustering [37]. Also, the result of
Sequence Clustering is a mixture of Markov chains, which provides visual models for the different behavioral
patterns of the process. In ARM, the behavioral patterns are in the form of association rules, and they are
presented in the form of statements rather than models; these statements can be harder to analyze. Therefore,
several reasons justify the need to study the application of Sequence Clustering in the analysis of healthcare
processes.
The organizational and performance perspectives of the process are less explored in healthcare applica-
tions. With respect to the organizational perspective, the Social Network Miner has been successfully applied
in [13, 14]. The fact is that it becomes very important to understand and quantify the working relationships
between physicians; this is very difficult, if not impossible, to achieve with traditional BPA. The usefulness
of the Organizational Miner is still to be shown in real-life healthcare processes. With respect to the perfor-
mance perspective, both the Basic Performance Analysis and the Dotted Chart seem to be useful to measure the
performance of healthcare processes [13, 14].
Also, previous authors do not describe nor formalize a methodology for BPA in healthcare based on process
mining. Rather, they tend to focus on a specific technique or a specific perspective of the process. We argue that
it is important to develop such methodology, and to provide the community with an approach for the holistic
analysis of healthcare processes.
3. Proposed Methodology
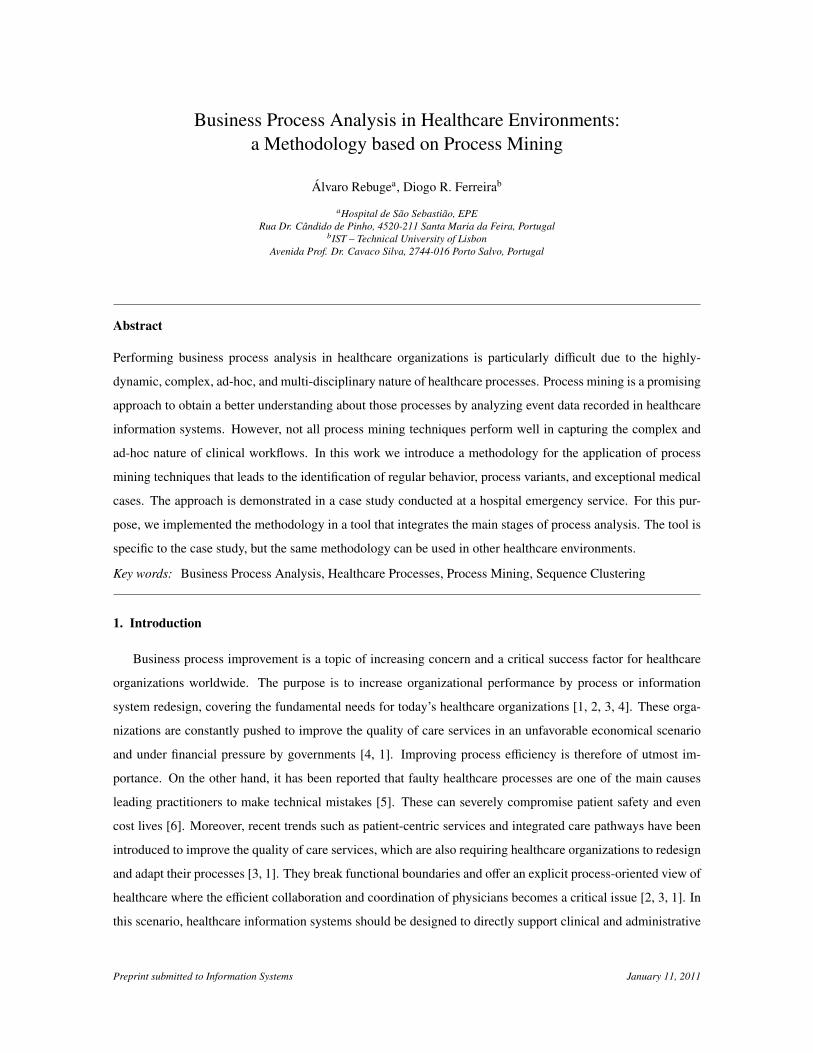
The methodology we propose for BPA in healthcare is an extension to the work of [42]. In [42] the authors
describe a general methodology for the application of process mining techniques. This methodology (Figure
1, tasks in white) comprises (1) the preparation of an event log; (2) log inspection; (3) control-flow analysis;
8
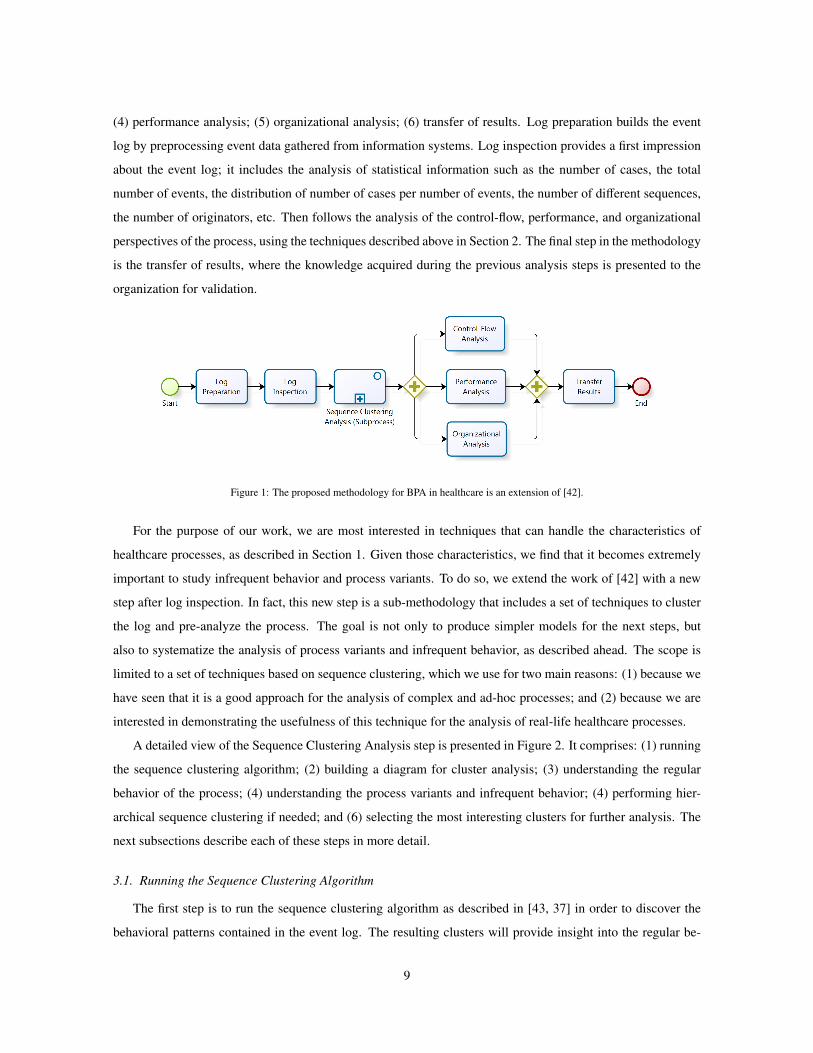
(4) performance analysis; (5) organizational analysis; (6) transfer of results. Log preparation builds the event
log by preprocessing event data gathered from information systems. Log inspection provides a first impression
about the event log; it includes the analysis of statistical information such as the number of cases, the total
number of events, the distribution of number of cases per number of events, the number of different sequences,
the number of originators, etc. Then follows the analysis of the control-flow, performance, and organizational
perspectives of the process, using the techniques described above in Section 2. The final step in the methodology
is the transfer of results, where the knowledge acquired during the previous analysis steps is presented to the
organization for validation.
Figure 1: The proposed methodology for BPA in healthcare is an extension of [42].
For the purpose of our work, we are most interested in techniques that can handle the characteristics of
healthcare processes, as described in Section 1. Given those characteristics, we find that it becomes extremely
important to study infrequent behavior and process variants. To do so, we extend the work of [42] with a new
step after log inspection. In fact, this new step is a sub-methodology that includes a set of techniques to cluster
the log and pre-analyze the process. The goal is not only to produce simpler models for the next steps, but
also to systematize the analysis of process variants and infrequent behavior, as described ahead. The scope is
limited to a set of techniques based on sequence clustering, which we use for two main reasons: (1) because we
have seen that it is a good approach for the analysis of complex and ad-hoc processes; and (2) because we are
interested in demonstrating the usefulness of this technique for the analysis of real-life healthcare processes.
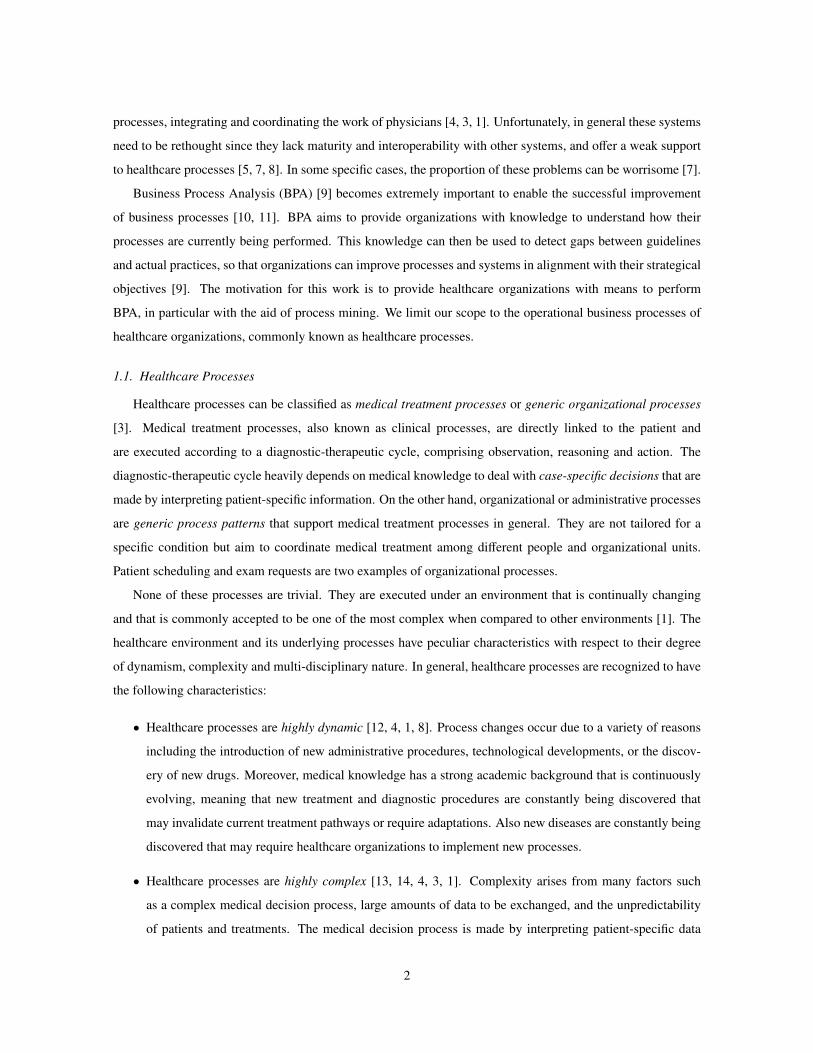
A detailed view of the Sequence Clustering Analysis step is presented in Figure 2. It comprises: (1) running
the sequence clustering algorithm; (2) building a diagram for cluster analysis; (3) understanding the regular
behavior of the process; (4) understanding the process variants and infrequent behavior; (4) performing hier-
archical sequence clustering if needed; and (6) selecting the most interesting clusters for further analysis. The
next subsections describe each of these steps in more detail.
3.1. Running the Sequence Clustering Algorithm
The first step is to run the sequence clustering algorithm as described in [43, 37] in order to discover the
behavioral patterns contained in the event log. The resulting clusters will provide insight into the regular be-
9
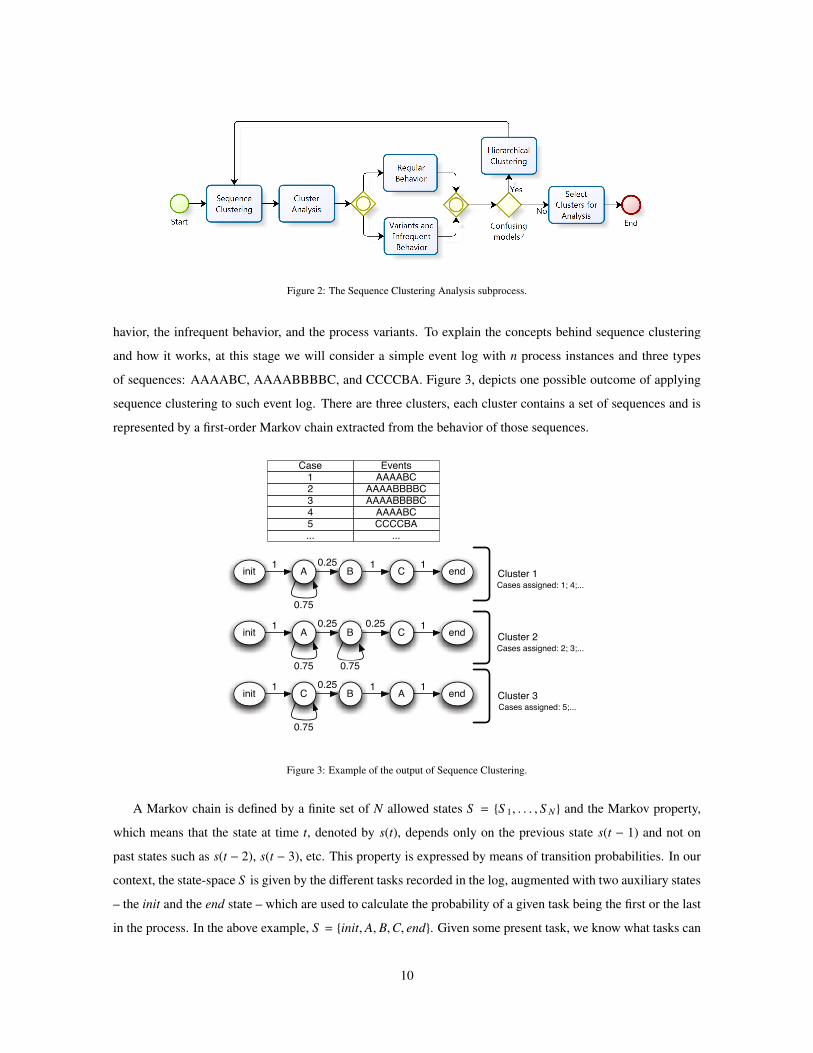
Figure 2: The Sequence Clustering Analysis subprocess.
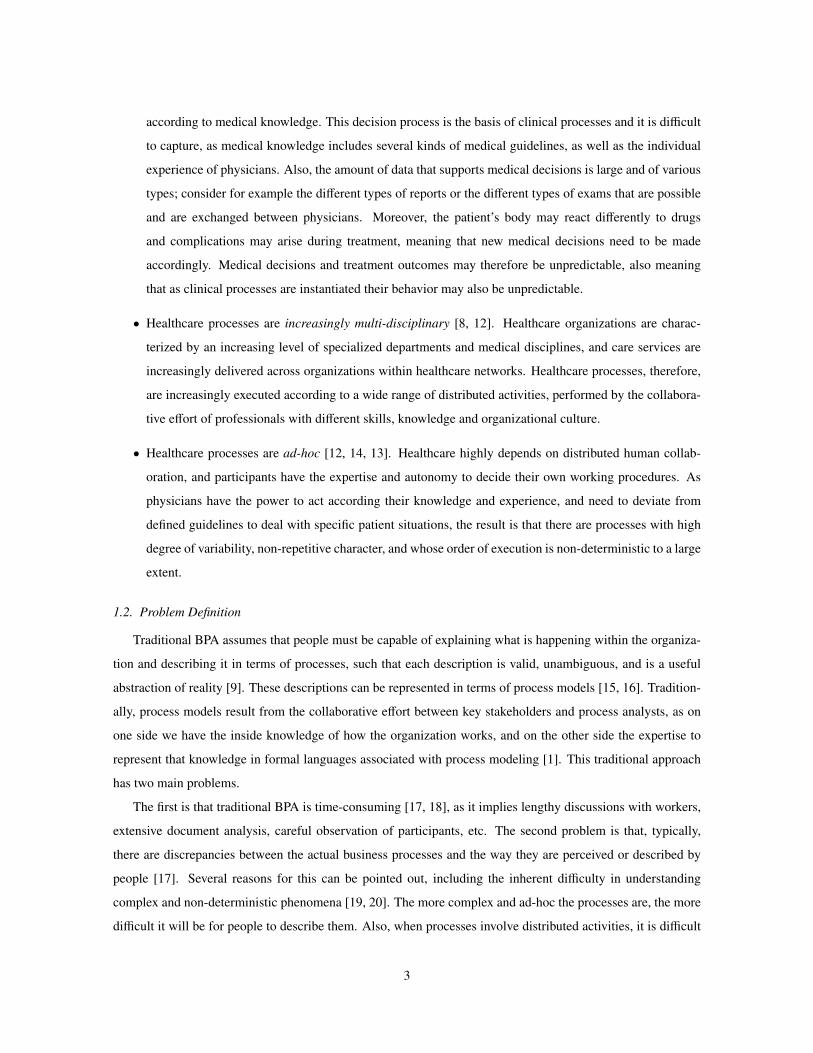
havior, the infrequent behavior, and the process variants. To explain the concepts behind sequence clustering
and how it works, at this stage we will consider a simple event log with n process instances and three types
of sequences: AAAABC, AAAABBBBC, and CCCCBA. Figure 3, depicts one possible outcome of applying
sequence clustering to such event log. There are three clusters, each cluster contains a set of sequences and is
represented by a first-order Markov chain extracted from the behavior of those sequences.
init C end1 1 1
0.75
0.25A B
init A end1 1 1
0.75
0.25C B
init C end1 1
0.75
0.25A B
0.75
0.25
... ...
3AAAABBBBC
1
CCCCBA
AAAABBBBC4
2
Case Events
5
AAAABC
AAAABC
Cluster 1
Cluster 2
Cluster 3
Cases assigned: 1; 4;...
Cases assigned: 2; 3;...
Cases assigned: 5;...
Figure 3: Example of the output of Sequence Clustering.
A Markov chain is defined by a finite set of N allowed states S = {S 1, . . . , S N} and the Markov property,
which means that the state at time t, denoted by s(t), depends only on the previous state s(t − 1) and not on
past states such as s(t − 2), s(t − 3), etc. This property is expressed by means of transition probabilities. In our
context, the state-space S is given by the different tasks recorded in the log, augmented with two auxiliary states
– the init and the end state – which are used to calculate the probability of a given task being the first or the last
in the process. In the above example, S = {init, A, B,C, end}. Given some present task, we know what tasks can
10
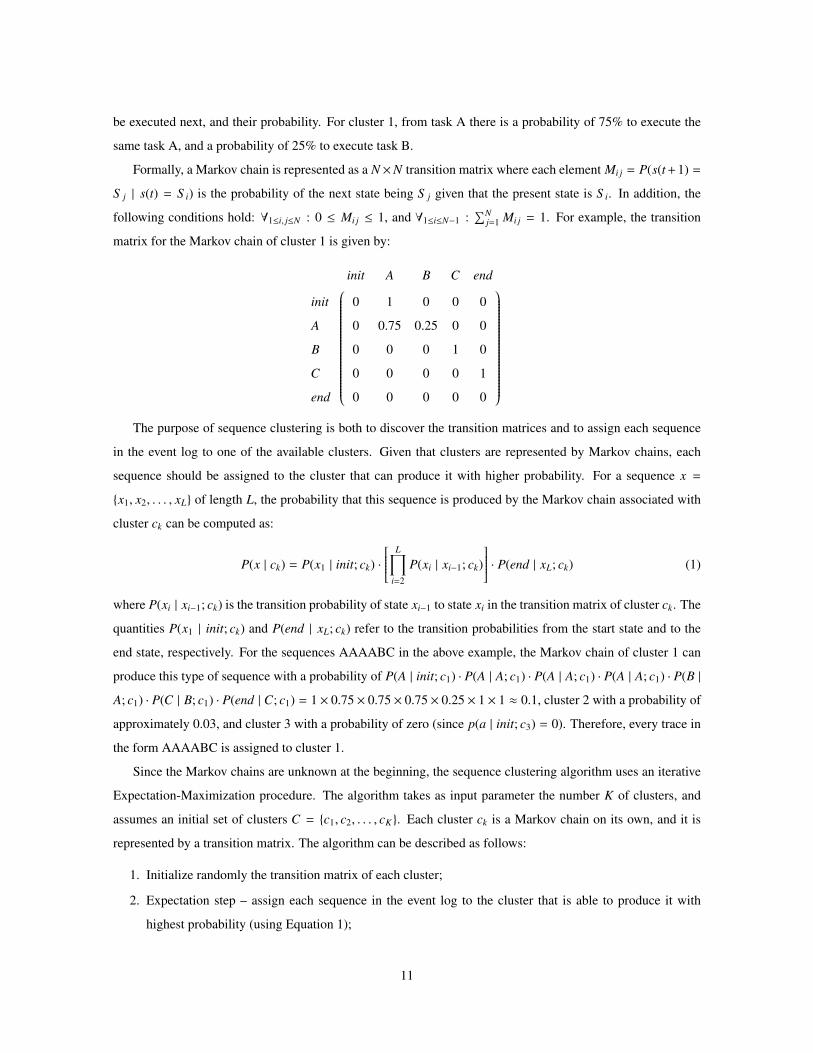
be executed next, and their probability. For cluster 1, from task A there is a probability of 75% to execute the
same task A, and a probability of 25% to execute task B.
Formally, a Markov chain is represented as a N ×N transition matrix where each element Mi j = P(s(t+1) =
S j | s(t) = S i) is the probability of the next state being S j given that the present state is S i. In addition, the
following conditions hold: ∀1≤i, j≤N : 0 ≤ Mi j ≤ 1, and ∀1≤i≤N−1 :∑N
j=1 Mi j = 1. For example, the transition
matrix for the Markov chain of cluster 1 is given by:
init A B C end
init 0 1 0 0 0
A 0 0.75 0.25 0 0
B 0 0 0 1 0
C 0 0 0 0 1
end 0 0 0 0 0
The purpose of sequence clustering is both to discover the transition matrices and to assign each sequence
in the event log to one of the available clusters. Given that clusters are represented by Markov chains, each
sequence should be assigned to the cluster that can produce it with higher probability. For a sequence x =
{x1, x2, . . . , xL} of length L, the probability that this sequence is produced by the Markov chain associated with
cluster ck can be computed as:
P(x | ck) = P(x1 | init; ck) · L∏
i=2
P(xi | xi−1; ck)
· P(end | xL; ck) (1)
where P(xi | xi−1; ck) is the transition probability of state xi−1 to state xi in the transition matrix of cluster ck. The
quantities P(x1 | init; ck) and P(end | xL; ck) refer to the transition probabilities from the start state and to the
end state, respectively. For the sequences AAAABC in the above example, the Markov chain of cluster 1 can
produce this type of sequence with a probability of P(A | init; c1) · P(A | A; c1) · P(A | A; c1) · P(A | A; c1) · P(B |A; c1) · P(C | B; c1) · P(end | C; c1) = 1 × 0.75 × 0.75 × 0.75 × 0.25 × 1 × 1 ≈ 0.1, cluster 2 with a probability of
approximately 0.03, and cluster 3 with a probability of zero (since p(a | init; c3) = 0). Therefore, every trace in
the form AAAABC is assigned to cluster 1.
Since the Markov chains are unknown at the beginning, the sequence clustering algorithm uses an iterative
Expectation-Maximization procedure. The algorithm takes as input parameter the number K of clusters, and
assumes an initial set of clusters C = {c1, c2, . . . , cK}. Each cluster ck is a Markov chain on its own, and it is
represented by a transition matrix. The algorithm can be described as follows:
1. Initialize randomly the transition matrix of each cluster;
2. Expectation step – assign each sequence in the event log to the cluster that is able to produce it with
highest probability (using Equation 1);
11

3. Maximization step – recompute the transition matrices for all clusters by considering the set of sequences
assigned to each cluster in the previous step;
4. Repeat steps 2 and 3 iteratively until the transition matrices do not change; at this point the assignment of
sequences to clusters also does not change anymore.
As a result of step 2 it may happen that some clusters do not get any sequences assigned to them. In this case,
the final number of clusters will be less than the initially specified K. On the other hand, it is not possible to
end up with more than K clusters. For these reasons, and as a rule of thumb, K is usually chosen to be slightly
higher than the initially expected or desired number of clusters. In practice, several runs may be required to find
an appropriate number of clusters. An alternative approach is to choose a small value for K and then subdivide
the clusters hierarchically, as illustrated in Figure 2.
3.2. Building a Diagram for Cluster Analysis
With the behavioral patterns identified with sequence clustering, the next step is to understand which clusters
represent regular behavior, which ones contain infrequent behavior, where are the process variants, and how
much do clusters differ from each other. For this purpose we need a structured approach to analyze the resulting
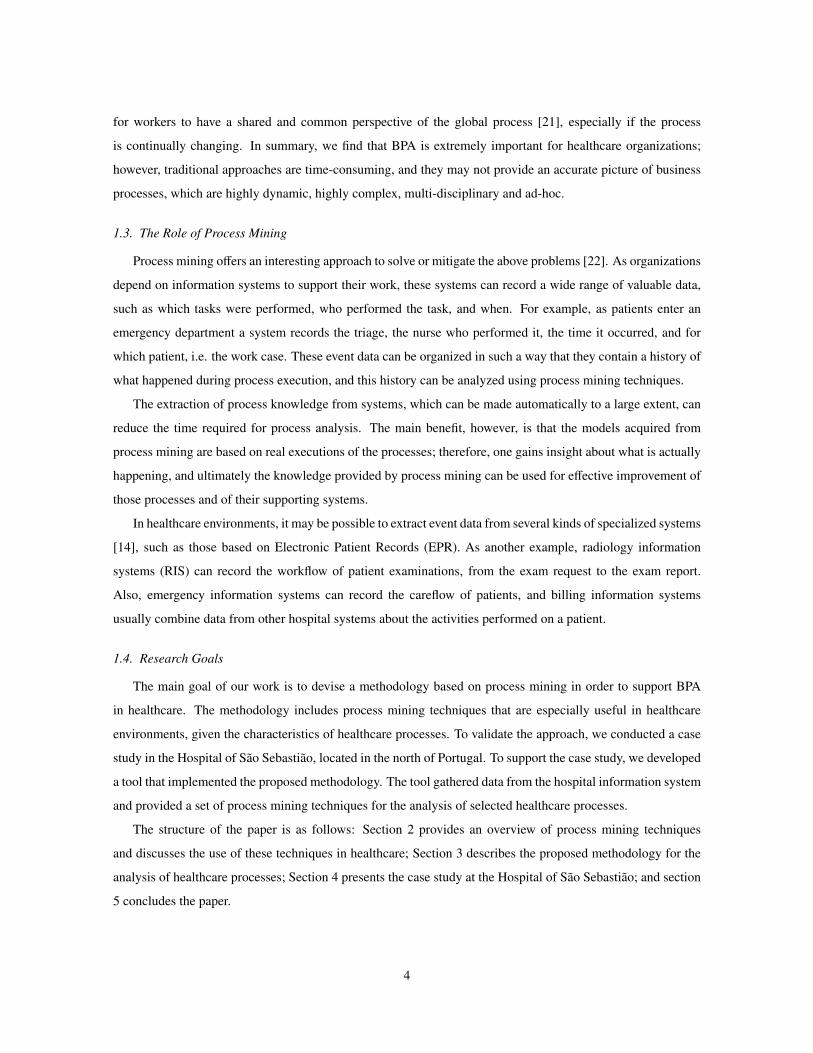
clusters. An essential tool is the cluster diagram, which depicts the support of each cluster, i.e. how many
sequences are contained in each cluster, and the similarity between clusters, i.e. how much the Markov chains
differ from each other. Figure 4 presents the cluster diagram for our running example. The nodes represent
the three clusters and are labeled with the corresponding support. The edges represent the similarity between
clusters, and are weighted according to their value. Support is higher if the node value is higher, and darker
nodes mean higher support; similarity is higher if the edge value is lower, and thicker edges represent higher
similarity.
0.28
0.780.76
Cluster 1 : supp = 0.6
Cluster 2 : supp = 0.3
Cluster 3 : supp = 0.1
Figure 4: Cluster diagram for a simple example
Formally, we define the support of cluster ck as:
support(ck) =#sequences(ck)∑l #sequences(cl)
(2)
12
where #sequences(ck) is the number of sequences contained in ck, and∑
l #sequences(cl) is the total number of
sequences assigned to all clusters, i.e. the total number of sequences in the event log.
One way to look at cluster similarity is to consider the “distance” between their Markov chains, i.e. the
distance between two probability distributions. We use a metric proposed in [44] that also takes into account
the distribution of the state-space of each cluster model. Let S i be a state in the state-space of cluster ck, and let
xr of length |xr | be a sequence that is assigned to cluster ck. Then the marginal probability of S i in ck is given
by:
P(S i)ck =
∑r #S i(xr)∑
r |xr |(3)
where the summation on r is over all sequences that belong to ck, and #S i(xr) counts the occurrences of S i in
each sequence xr.
The distance between two clusters ck and cl is defined as [44]:
D(ck ∥ cl) =12
∑i
∑j
|P(S i)ck · M(ck)i j − P(S i)cl · M(cl)
i j | (4)
where M(ck)i j is an element in the transition matrix of cluster ck. By computing the distance between all pairs of
clusters in the cluster diagram, one can derive a K × K distance matrix Dkl = D(ck ∥ cl), where ∀1≤k,l≤K : 0 ≤Dkl ≤ 1.
Given the cluster support and the distance matrix, we build a diagram for cluster analysis. This diagram is an
undirected weighted graph were the set of nodes is given by the set of K clusters, and each node is labeled with
the corresponding cluster support. The edges are given by the entries in the distance matrix, and are weighted
with the corresponding value, as in Figure 4.
Assuming that the event log contains 100 process instances with 60 sequences of type AAAABC, 30 of type
AAAABBBBC, and 10 of type CCCCBA, and that these traces are assigned to cluster 1, cluster 2, and cluster
3 respectively, we have: support(c1) = 0.6; support(c2) = 0.3; support(c3) = 0.1.
To compute the cluster distances, we first calculate the state-space distribution of each cluster. In cluster 1,
which contains only one type of sequence (AAAABC), we have #A(xr) = 4, #B(xr) = 1 and #C(xr) = 1 for all
sequences xr. Therefore, P(A)c1 = 4×606×60 =
23 , and similarly P(B)c1 = p(C)c1 = 1
6 . Following the same procedure
for other clusters, and calculating the distance matrix Dkl according to Equation (4), we have:
c1 c2 c3
c1 0 0.28 0.76
c2 0.28 0 0.78
c3 0.76 0.78 0
With the support for each cluster and the distance between clusters, we draw the cluster diagram of Figure
4. This kind of diagram will play a key role in the next steps of the methodology.
13
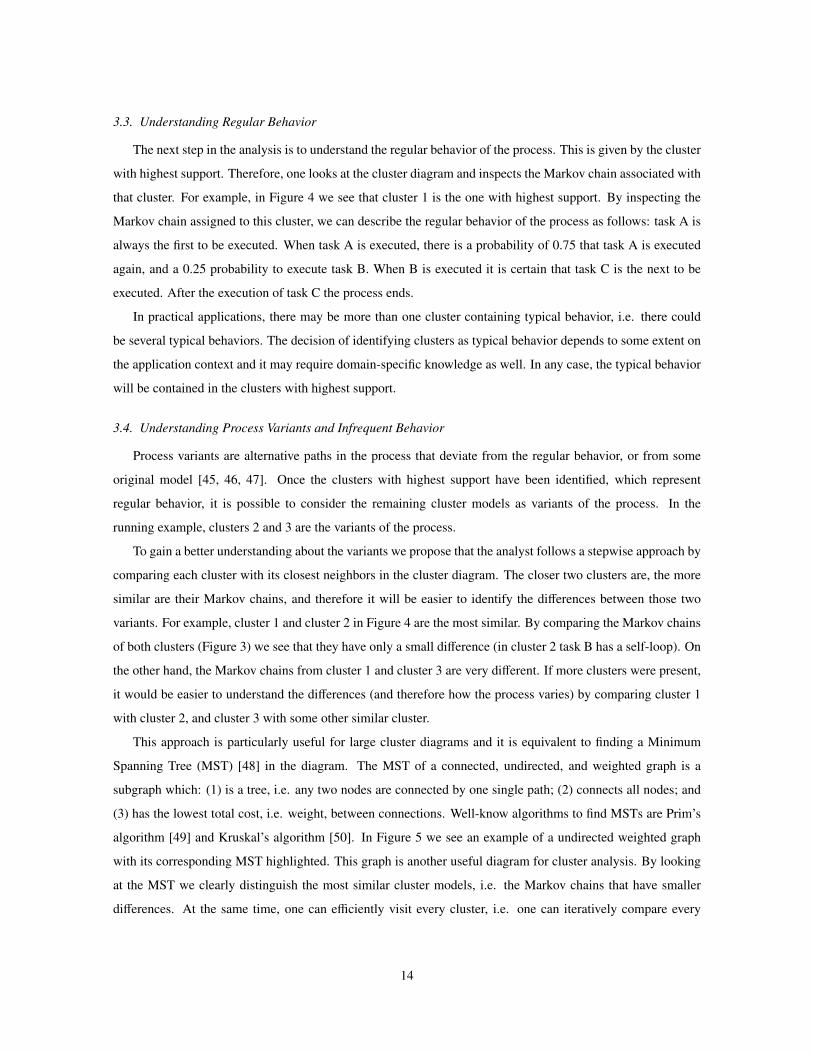
3.3. Understanding Regular Behavior
The next step in the analysis is to understand the regular behavior of the process. This is given by the cluster
with highest support. Therefore, one looks at the cluster diagram and inspects the Markov chain associated with
that cluster. For example, in Figure 4 we see that cluster 1 is the one with highest support. By inspecting the
Markov chain assigned to this cluster, we can describe the regular behavior of the process as follows: task A is
always the first to be executed. When task A is executed, there is a probability of 0.75 that task A is executed
again, and a 0.25 probability to execute task B. When B is executed it is certain that task C is the next to be
executed. After the execution of task C the process ends.
In practical applications, there may be more than one cluster containing typical behavior, i.e. there could
be several typical behaviors. The decision of identifying clusters as typical behavior depends to some extent on
the application context and it may require domain-specific knowledge as well. In any case, the typical behavior
will be contained in the clusters with highest support.
3.4. Understanding Process Variants and Infrequent Behavior
Process variants are alternative paths in the process that deviate from the regular behavior, or from some
original model [45, 46, 47]. Once the clusters with highest support have been identified, which represent
regular behavior, it is possible to consider the remaining cluster models as variants of the process. In the
running example, clusters 2 and 3 are the variants of the process.
To gain a better understanding about the variants we propose that the analyst follows a stepwise approach by
comparing each cluster with its closest neighbors in the cluster diagram. The closer two clusters are, the more
similar are their Markov chains, and therefore it will be easier to identify the differences between those two
variants. For example, cluster 1 and cluster 2 in Figure 4 are the most similar. By comparing the Markov chains
of both clusters (Figure 3) we see that they have only a small difference (in cluster 2 task B has a self-loop). On
the other hand, the Markov chains from cluster 1 and cluster 3 are very different. If more clusters were present,
it would be easier to understand the differences (and therefore how the process varies) by comparing cluster 1
with cluster 2, and cluster 3 with some other similar cluster.
This approach is particularly useful for large cluster diagrams and it is equivalent to finding a Minimum
Spanning Tree (MST) [48] in the diagram. The MST of a connected, undirected, and weighted graph is a
subgraph which: (1) is a tree, i.e. any two nodes are connected by one single path; (2) connects all nodes; and
(3) has the lowest total cost, i.e. weight, between connections. Well-know algorithms to find MSTs are Prim’s
algorithm [49] and Kruskal’s algorithm [50]. In Figure 5 we see an example of a undirected weighted graph
with its corresponding MST highlighted. This graph is another useful diagram for cluster analysis. By looking
at the MST we clearly distinguish the most similar cluster models, i.e. the Markov chains that have smaller
differences. At the same time, one can efficiently visit every cluster, i.e. one can iteratively compare every
14
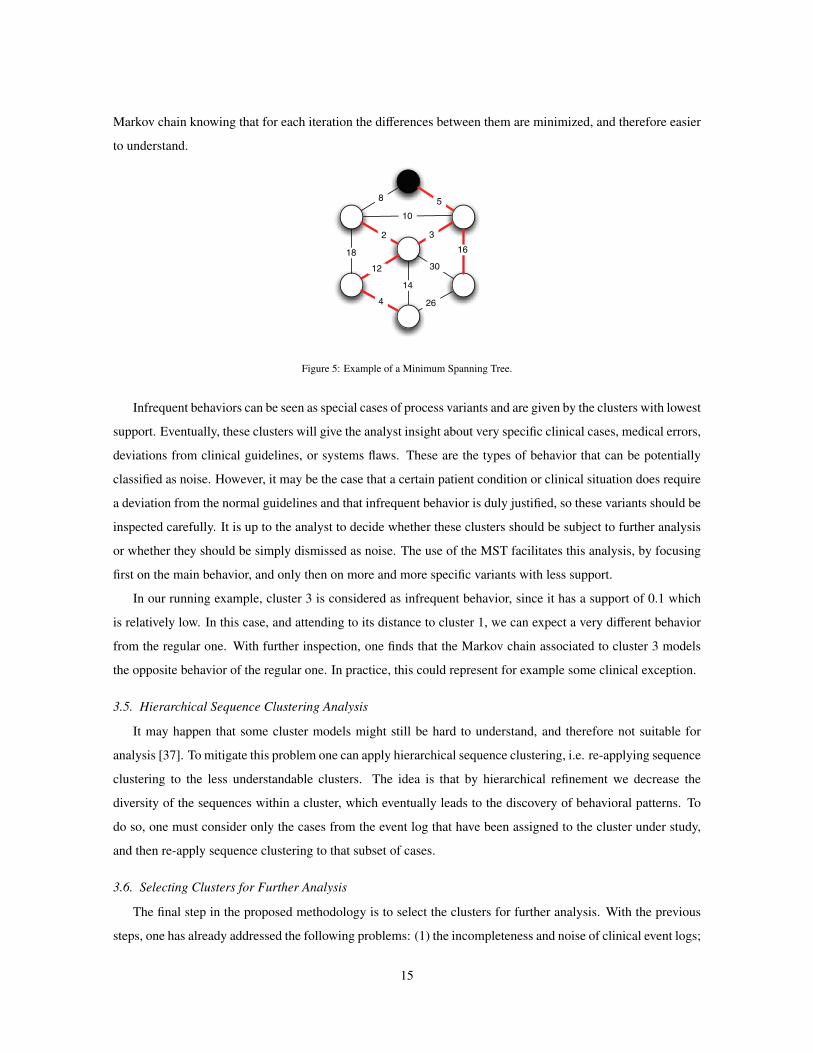
Markov chain knowing that for each iteration the differences between them are minimized, and therefore easier
to understand.
58
10
16
30
2 3
18
12
14
264
Figure 5: Example of a Minimum Spanning Tree.
Infrequent behaviors can be seen as special cases of process variants and are given by the clusters with lowest
support. Eventually, these clusters will give the analyst insight about very specific clinical cases, medical errors,
deviations from clinical guidelines, or systems flaws. These are the types of behavior that can be potentially
classified as noise. However, it may be the case that a certain patient condition or clinical situation does require
a deviation from the normal guidelines and that infrequent behavior is duly justified, so these variants should be
inspected carefully. It is up to the analyst to decide whether these clusters should be subject to further analysis
or whether they should be simply dismissed as noise. The use of the MST facilitates this analysis, by focusing
first on the main behavior, and only then on more and more specific variants with less support.
In our running example, cluster 3 is considered as infrequent behavior, since it has a support of 0.1 which
is relatively low. In this case, and attending to its distance to cluster 1, we can expect a very different behavior
from the regular one. With further inspection, one finds that the Markov chain associated to cluster 3 models
the opposite behavior of the regular one. In practice, this could represent for example some clinical exception.
3.5. Hierarchical Sequence Clustering Analysis
It may happen that some cluster models might still be hard to understand, and therefore not suitable for
analysis [37]. To mitigate this problem one can apply hierarchical sequence clustering, i.e. re-applying sequence
clustering to the less understandable clusters. The idea is that by hierarchical refinement we decrease the
diversity of the sequences within a cluster, which eventually leads to the discovery of behavioral patterns. To
do so, one must consider only the cases from the event log that have been assigned to the cluster under study,
and then re-apply sequence clustering to that subset of cases.
3.6. Selecting Clusters for Further Analysis
The final step in the proposed methodology is to select the clusters for further analysis. With the previous
steps, one has already addressed the following problems: (1) the incompleteness and noise of clinical event logs;
15
(2) how to distinguish process variants; and (3) how to distinguish infrequent behavior (exceptional clinical
cases, medical errors, etc). In essence, these are the major challenges that healthcare environments pose to
process mining. For each cluster of interest, one can then proceed with the remaining analysis on the different
perspectives of the process. Of course, at this point we already have insight about the control-flow of the process,
with Markov chains capturing some of the behavior. However, sequence clustering cannot discover some special
workflow constructs, such as parallelisms or synchronizations in the process. The idea is therefore that one can
explore the strengths of other control-flow mining techniques. Since each cluster contains traces that are similar
in their sequential behavior, this should help other techniques produce more understandable models as well.
4. Case Study: Hospital of Sao Sebastiao
The Hospital of Sao Sebastiao (HSS) is a public hospital with approximately 300 beds, located in Santa
Maria da Feira, Portugal. As with other hospitals, the main strategic goals of HSS include: to deliver patient-
centric services; to improve the efficiency and quality of the most important processes; and to reduce the cost
of care services. Also, HSS makes use of an information system to support most of its activity. The system is
known as Medtrix and has been developed in-house2. It provides an integrated view of all clinical information
of patients across different departments. Medtrix is widely used in the hospital and it is regarded as a critical
enabler for collaborative work among physicians.
The analysis of clinical and administrative careflows is of great concern for HSS, especially when focused on
detecting deviations from the main clinical guidelines, or flaws in the processes that Medtrix provides support to.
Unfortunately, BPA has not been a common practice in HSS. Key stakeholders find BPA time-consuming and
expensive, and they currently lack resources. A significant part of process improvement initiatives are delegated
to the Department of Information Systems, since Medtrix is a leverage point to improve HSS processes. The
department is run by eleven people from which only four are assigned to implement and maintain the Medtrix
system, and also responsible for process analysis. The space of maneuver for process analysis is very tight. The
main concern of executives and physicians is to see quick results from Medtrix, and do not conceive nor fully
understand the idea of spending time and resources on a thorough BPA initiative. Moreover, the department
runs under strong financial constraints and cannot afford external process analysts. The analysis of processes in
HSS mainly results from discussions between representatives of specialized departments and the Medtrix team
which, on their turn, are pressured to focus on system maintenance and development, rather than on analyzing
processes. The process knowledge resulting from these discussions is usually not documented, and formal
languages are not used. In conclusion, knowledge about the processes in HSS is tacit and unstructured, and
2Microsoft has released international product and service brochures featuring the Hospital of Sao Sebastiao as a successful case study
of an EPR system developed using Microsoft .NET Framework and related technologies.
16
given the characteristics of healthcare processes, the hospital needs more sophisticated tools and a methodology
to perform process analysis.
The potential knowledge that process mining can offer is of utmost importance for HSS, and the Medtrix sys-
tem can provide valuable data for this purpose. The HSS staff embraced this possibility with great enthusiasm.
After discussing with key stakeholders, it was decided to limit our scope to the careflows of emergency patients,
and activities comprising the triage, treatments, diagnosis, medical exams, and forwarding of patients. The
main reasons for this decision were: (1) the perceived quality of HSS services is mainly based on the patients’
opinion about the emergency service, and therefore to understand their careflow is a priority; (2) the behavior of
emergency careflows, and the required interactions between physicians, are one of the most complex to actually
understand; (3) the main concern of emergency services is performance and every analysis in this direction is
welcome; (4) since Medtrix began by supporting the emergency processes, and by integrating the emergency
and radiology information systems, these careflows are quite mature and represent a good opportunity to gather
useful data to build an event log.
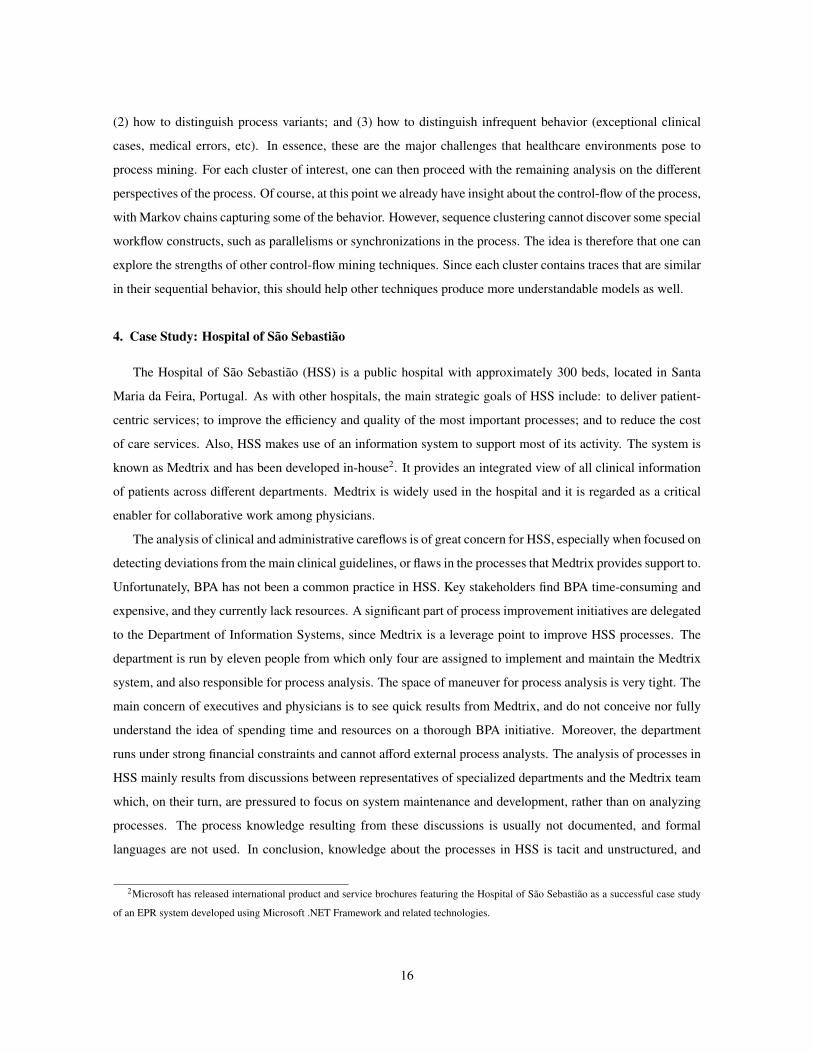
4.1. Data Gathering
In a discussion with the Medtrix team coordinator it was decided that the best approach would be to explore
the data recorded in the system database. However, this was not as easy as it seemed. The Medtrix database
currently contains more than 400 tables that are not documented. The solution was to move the relevant part of
this database to a new one that reflects the domain of the case study, as depicted in Figure 6. The new database
contains the events of the emergency careflows from January to July, 2009.
num_episodeEpisode
num_episodedesignationoriginatortimestamp
Treatmentnum_episodedesignationoriginatortimestamp
Triagenum_episodedesignationoriginatortimestamp
Laboratory Exam
num_episodedesignationoriginatortimestamp
Diagnosticnum_episodenum_requisitiondesignationoriginatortimestamp
Radiology Exam
num_episodedesignationoriginatortimestamp
Forwarding
num_requisitionstatedesignationoriginatortimestamp
Exam Evolution
Figure 6: Database for the case study.
The Emergency Episode table contains the emergency patients, i.e. the case identifiers, and the remaining
tables represent possible activities performed on each patient. The Exam Evolution table is slightly different,
since the activities in this table are given by the set of the possible states of the exam, such as exam scheduled,
17
exam canceled, exam to be reported, etc. In each table we have information about the originator and the
timestamp of events, which allows us explore the organizational and performance perspective of careflows. The
designation field makes it possible to explore the behavior of careflows at different levels of abstraction and
gives more flexibility to the analysis.
For example, if we want to understand the process at a high level, it is possible to build an event log
where each event contains simply the name of the corresponding table where the event was recorded. One
would then have activities such as “Triage”, “Diagnostic”, “Treatment”, “Laboratory Exam”, etc. On the other
hand, to study the clinical activities in more detail, one can build a different event log where each event also
has the designation field, so that the activity names become more specific, such as “Diagnostic Thrombosis”,
“Laboratory Exam X-Ray”, etc. Besides enabling the generation of different event logs from the same data, this
also makes it easier to analyze the careflow of patients with specific health conditions.
4.2. The Medtrix Process Mining Studio
To support the analysis of the emergency careflows in HSS according to the proposed methodology, we de-
veloped a process mining tool called Medtrix Process Mining Studio (MPMS). Also, to allow the use of ProM,
we have developed a component to export the event logs in MXML (Mining XML) format. The reason for
developing a new tool, rather than simply using ProM, was that we needed to make the steps of the method-
ology available in an application that could be readily used by the staff of HSS and that could be customized
to this specific environment. The MPMS tool provides capabilities to inspect the log, perform sequence clus-
tering analysis, inspect the cluster models and the cluster diagram, calculate the Minimum Spanning Tree, and
facilitate the study of process variants by displaying the differences between cluster models. It also has some
capabilities for creating, displaying and analyzing social networks extracted from event data. However, it should
be noted that the purpose of MPMS was not to replicate the functionalities of ProM, so the user can still resort
to ProM for more advanced control-flow, performance and organizational analysis.
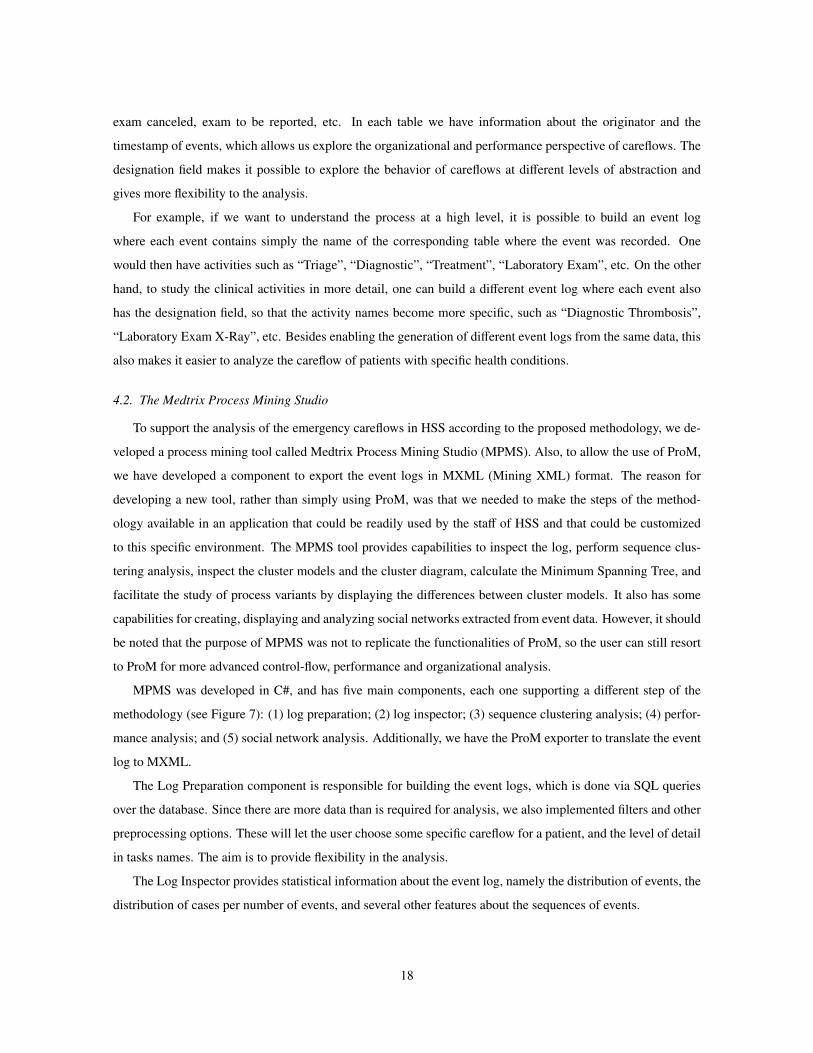
MPMS was developed in C#, and has five main components, each one supporting a different step of the
methodology (see Figure 7): (1) log preparation; (2) log inspector; (3) sequence clustering analysis; (4) perfor-
mance analysis; and (5) social network analysis. Additionally, we have the ProM exporter to translate the event
log to MXML.
The Log Preparation component is responsible for building the event logs, which is done via SQL queries
over the database. Since there are more data than is required for analysis, we also implemented filters and other
preprocessing options. These will let the user choose some specific careflow for a patient, and the level of detail
in tasks names. The aim is to provide flexibility in the analysis.
The Log Inspector provides statistical information about the event log, namely the distribution of events, the
distribution of cases per number of events, and several other features about the sequences of events.
18
Case Study
Database
Log Preparation
Event Log
MS Analysis Services
ProM Exporter
Sequence Clustering Analysis
Log Inspector
Performance Analysis
SNA Analysis
MXML
Interface
Figure 7: Architecture of the Medtrix Process Mining Studio.
The Sequence Clustering component is responsible for the whole sub-methodology we have described ear-
lier in Section 3. At this point we use the Microsoft Sequence Clustering algorithm available in SQL Server
2008 Analysis Services. The algorithm is invoked programmatically via a Data Mining API to extract the in-
formation about the Markov chains for each cluster, the distribution of the state-space of each cluster, and the
support of each cluster as well. The cases in each cluster can be obtained by means of a Prediction DMX query3.
Hierarchical Sequence Clustering can then be performed by filtering the event log and keeping only the cases
that belong to a selected cluster. The distance metric from Equation (4) was implemented in order to build the
cluster diagram for analysis. To find the Minimum Spanning Tree, Kruskal’s algorithm was implemented as
well. Also, we implemented a technique to depict the differences between two Markov chains, which is useful
to visualize and understand the variants of the process.
The performance analysis component is limited to computing the maximum, minimum, and average time
between tasks, as well as the throughput of the process. The results are displayed in charts.
Finally, the Social Network Analysis component is able to discover the social network according to two
metrics: “handover of work” and “working together”. These are the same as implemented in the Social Network
Miner of ProM [27].
4.3. Log Preparation and Inspection for the Analysis of the Radiology Workflow
We started by analyzing the radiology workflow of emergency patients. This kind of workflow is an or-
ganizational healthcare process that is related to the careflows of the emergency department in general. Here
3The DMX (Data Mining Extensions) language is used to create and work with mining models in SQL Server Analysis Services.
19
we present the results of sequence clustering analysis, control-flow analysis, and performance analysis. The
organizational analysis allowed us to study a very specific problem currently experienced in HSS. The internal
regulations of HSS state that when a patient is assigned to a physician, this physician is responsible for the
diagnosis, treatment, exam requests, and forwarding of the patient, and must not handover his work to another
physician during the process. HSS is aware that there are physicians who deviate from this guideline; however,
the organization currently does not have the means to detect and measure such deviations. We addressed this
issue in this case study. The analysis of the careflows for specific patient conditions is very extensive and in this
paper we are able to present only a general analysis of the radiology workflow.
To build the event log, MPMS was used to filter the database, so that it was possible to get the information
contained in the Radiology Exam and the Exam Evolution tables. The resulting event log contained 27930
process instances4, a total number of 179354 events, and 12 different tasks (the exam request and the eleven
possible states of the exam). From the 27930 event sequences, we have 2296 different kinds of sequence. One
of these kinds of sequence had a relative frequency of approximately 0.5, and the remaining a relative frequency
below 0.06; 1820 occur only once. Since we are dealing with an organizational process, it would be expected
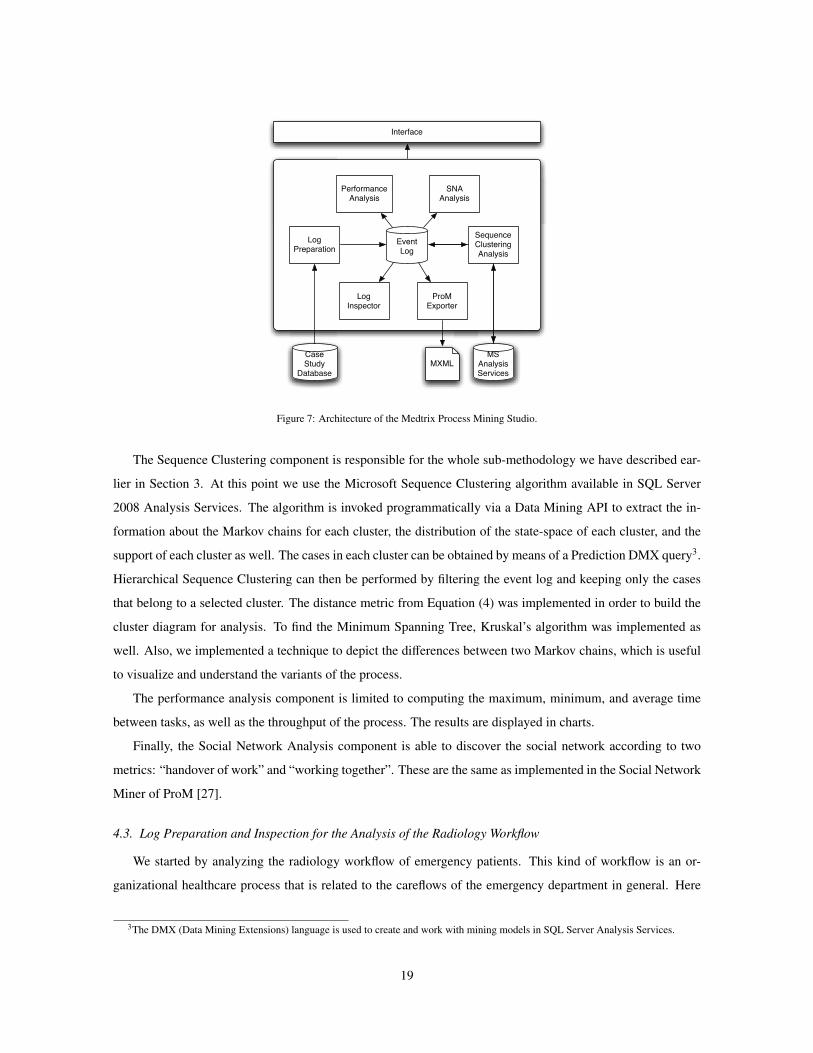
to find a dominant pattern in the run-time behavior. It was not surprising, however, to find that the nature of this
healthcare process creates a large degree of diversity in the event log. Figure 8 provides an idea of the global
behavior of the radiology workflow; we used the heuristic miner in ProM and then converted the result to a Petri
Net. The presence of so many silent transitions (i.e. different choices) after each step suggests that there are
actually several variants of this process.
4.4. Sequence Clustering Analysis
The next step was to run the sequence clustering algorithm in order to separate regular behavior, process
variants, and infrequent behavior. We started by making use of a feature in Microsoft Sequence Clustering
that automatically suggests a number of clusters, and it resulted in an initial set of 22 clusters. However, this
relatively high number of clusters actually made the analysis rather difficult. After some experimentation, we
found that separating the data into 8 clusters provided more intuitive results, which were easier to analyze. In
general, a too high number of clusters makes it difficult to identify typical behavior, since even small variations
may cause similar variants to be scattered across several clusters with relatively low support. On the other hand,
using a very low number of clusters will aggregate different behaviors in each cluster, producing cluster models
that are too complex to interpret and analyze.
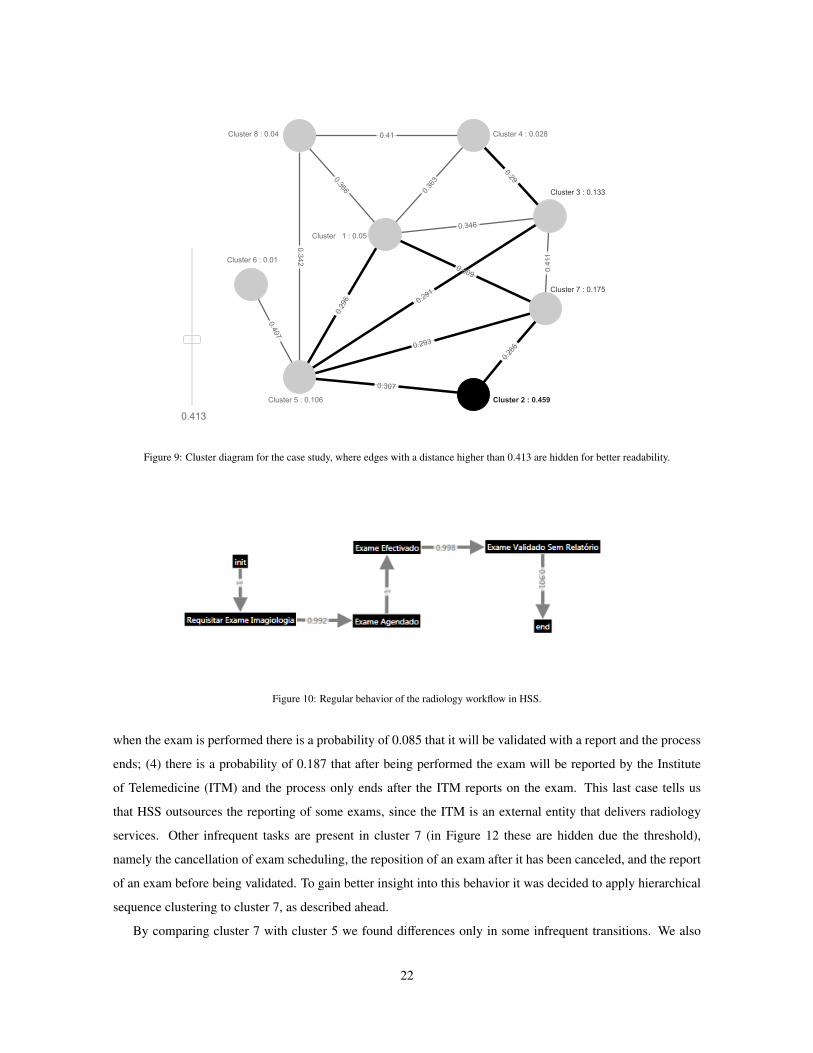
With 8 clusters, MPMS built the cluster diagram depicted in Figure 9. By looking at the diagram one clearly
identifies that cluster 2 is the dominant cluster with a support of approximately 0.5 which refers to the dominant
4The Medtrix system assumes that an exam request can comprise more than one exam; therefore, a process instance may include one or
more exams with the respective states interleaved in the sequence.
20
Figure 8: Petri Net of the global radiology workflow, converted from the heuristic miner in ProM.
sequence found during log inspection. The remaining clusters contain variants. Cluster 1, 4, 6 and 8 have a
rather low support and were labeled as infrequent behavior. We can also identify the most similar clusters. For
example, we can expect that the process behavior modeled by cluster 7 is relatively similar to the one modeled
by cluster 1, 2, and 5.
To understand the regular behavior of the emergency radiology workflow we inspected the Markov chain
associated with cluster 2, the dominant cluster. The process model is depicted in Figure 10 and is explained as
follows: (1) the exam is requested; (2) the exam is scheduled; (3) the exam is performed; and (4) the exam is
validated without report.
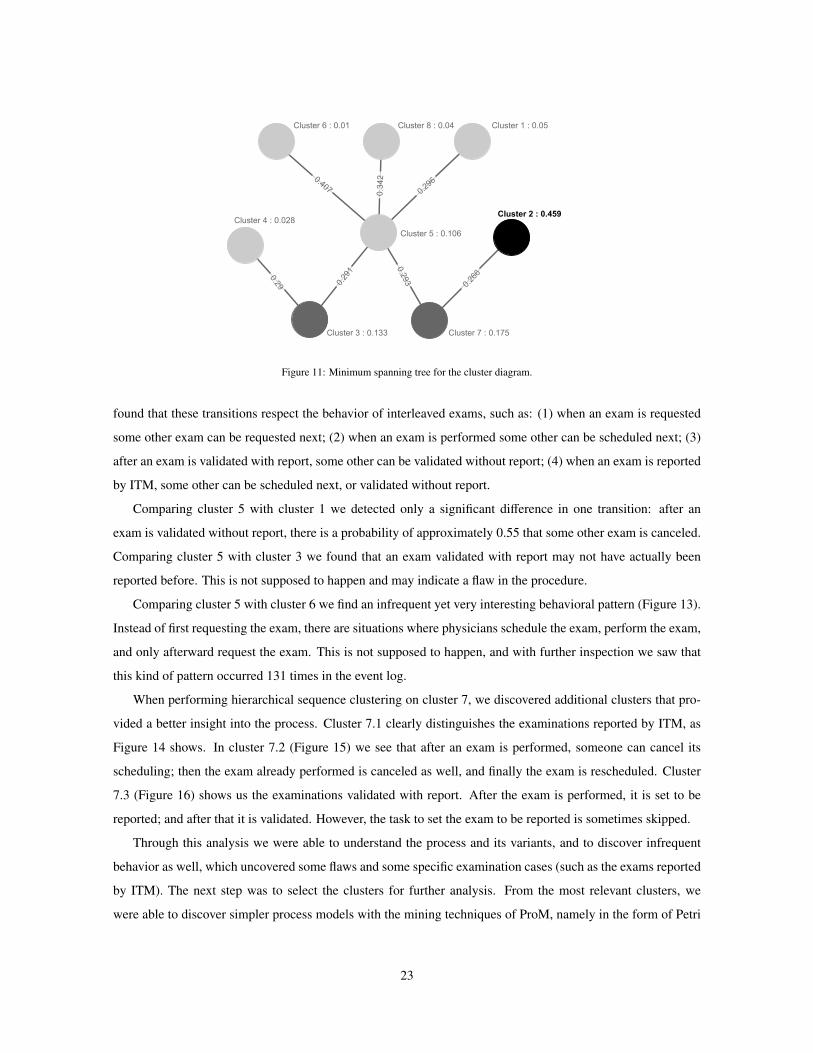
To understand the process variants and infrequent behavior we started by analyzing the Minimum Spanning
Tree of the cluster diagram. The MST is shown in Figure 11. We found that comparing cluster 2 with cluster
7, cluster 7 with cluster 5, cluster 5 with clusters 1, 3, 8 and 6, and cluster 3 with cluster 4, was a good
approximation to understand the variants of the process. Following the connections to the closest clusters in the
MST provided an incremental understanding of the process and its variants.
By comparing cluster 2 with cluster 7 (Figure 12) we detected the following main differences: (1) when an
exam is requested there is a probability of 0.073 that it will be canceled, and after cancellation the process ends;
(2) when an exam is requested there is a probability of 0.08 that the process ends; these are the cases when
employees are not using Medtrix as supposed, since the evolution of exams should always be registered; (3)
21
Cluster 2 : 0.459
0.413
Cluster 8 : 0.04 Cluster 4 : 0.028
Cluster 1 : 0.05
Cluster 6 : 0.01
Cluster 7 : 0.175
Cluster 3 : 0.133
0.309
0.2
66
0.2
96 0.2
91
0.346
0.41
Cluster 5 : 0.106
0.3
42
0.307
0.293
0.4
11
0.3
66
0.3
63
0.2
9
0.4
07
Figure 9: Cluster diagram for the case study, where edges with a distance higher than 0.413 are hidden for better readability.
Figure 10: Regular behavior of the radiology workflow in HSS.
when the exam is performed there is a probability of 0.085 that it will be validated with a report and the process
ends; (4) there is a probability of 0.187 that after being performed the exam will be reported by the Institute
of Telemedicine (ITM) and the process only ends after the ITM reports on the exam. This last case tells us
that HSS outsources the reporting of some exams, since the ITM is an external entity that delivers radiology
services. Other infrequent tasks are present in cluster 7 (in Figure 12 these are hidden due the threshold),
namely the cancellation of exam scheduling, the reposition of an exam after it has been canceled, and the report
of an exam before being validated. To gain better insight into this behavior it was decided to apply hierarchical
sequence clustering to cluster 7, as described ahead.
By comparing cluster 7 with cluster 5 we found differences only in some infrequent transitions. We also
22
Cluster 5 : 0.106
0.407
0.3
42
0.2
96
0.2
66
0.2
93
0.2
91
0.2
9
Cluster 8 : 0.04
Cluster 7 : 0.175
Cluster 6 : 0.01
Cluster 4 : 0.028
Cluster 3 : 0.133
Cluster 2 : 0.459
Cluster 1 : 0.05
Figure 11: Minimum spanning tree for the cluster diagram.
found that these transitions respect the behavior of interleaved exams, such as: (1) when an exam is requested
some other exam can be requested next; (2) when an exam is performed some other can be scheduled next; (3)
after an exam is validated with report, some other can be validated without report; (4) when an exam is reported
by ITM, some other can be scheduled next, or validated without report.
Comparing cluster 5 with cluster 1 we detected only a significant difference in one transition: after an
exam is validated without report, there is a probability of approximately 0.55 that some other exam is canceled.
Comparing cluster 5 with cluster 3 we found that an exam validated with report may not have actually been
reported before. This is not supposed to happen and may indicate a flaw in the procedure.
Comparing cluster 5 with cluster 6 we find an infrequent yet very interesting behavioral pattern (Figure 13).
Instead of first requesting the exam, there are situations where physicians schedule the exam, perform the exam,
and only afterward request the exam. This is not supposed to happen, and with further inspection we saw that
this kind of pattern occurred 131 times in the event log.
When performing hierarchical sequence clustering on cluster 7, we discovered additional clusters that pro-
vided a better insight into the process. Cluster 7.1 clearly distinguishes the examinations reported by ITM, as
Figure 14 shows. In cluster 7.2 (Figure 15) we see that after an exam is performed, someone can cancel its
scheduling; then the exam already performed is canceled as well, and finally the exam is rescheduled. Cluster
7.3 (Figure 16) shows us the examinations validated with report. After the exam is performed, it is set to be
reported; and after that it is validated. However, the task to set the exam to be reported is sometimes skipped.
Through this analysis we were able to understand the process and its variants, and to discover infrequent
behavior as well, which uncovered some flaws and some specific examination cases (such as the exams reported
by ITM). The next step was to select the clusters for further analysis. From the most relevant clusters, we
were able to discover simpler process models with the mining techniques of ProM, namely in the form of Petri
23
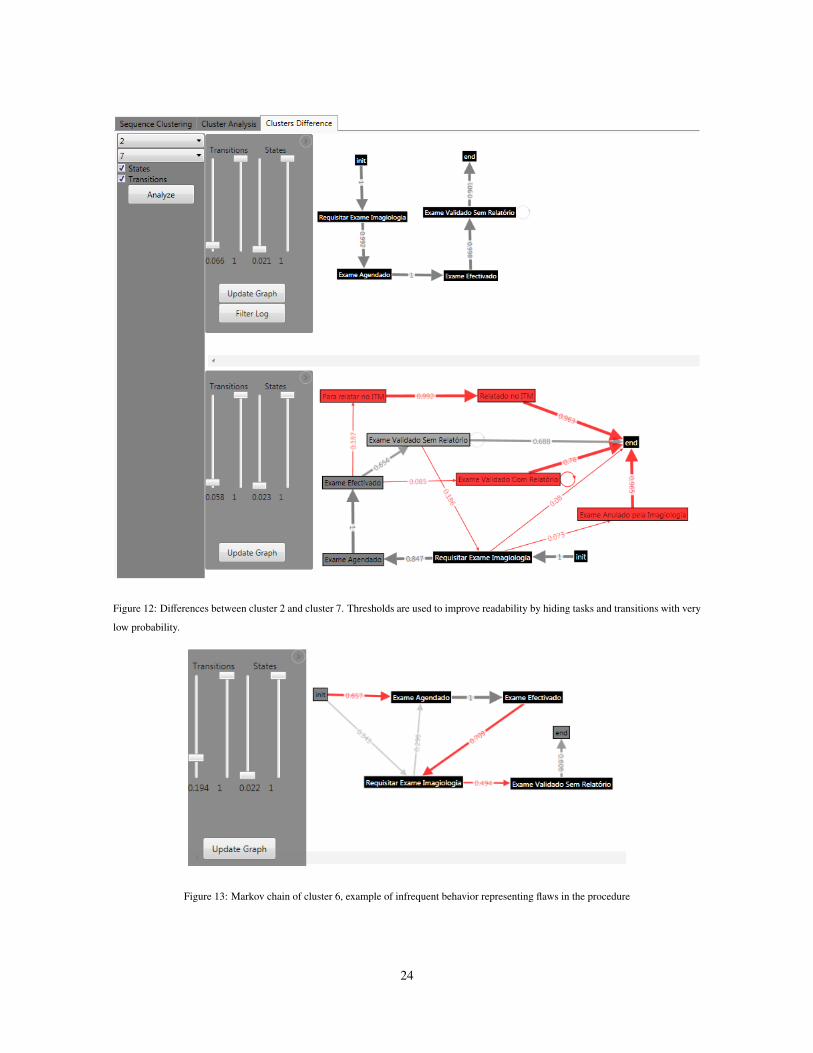
Figure 12: Differences between cluster 2 and cluster 7. Thresholds are used to improve readability by hiding tasks and transitions with very
low probability.
Figure 13: Markov chain of cluster 6, example of infrequent behavior representing flaws in the procedure
24
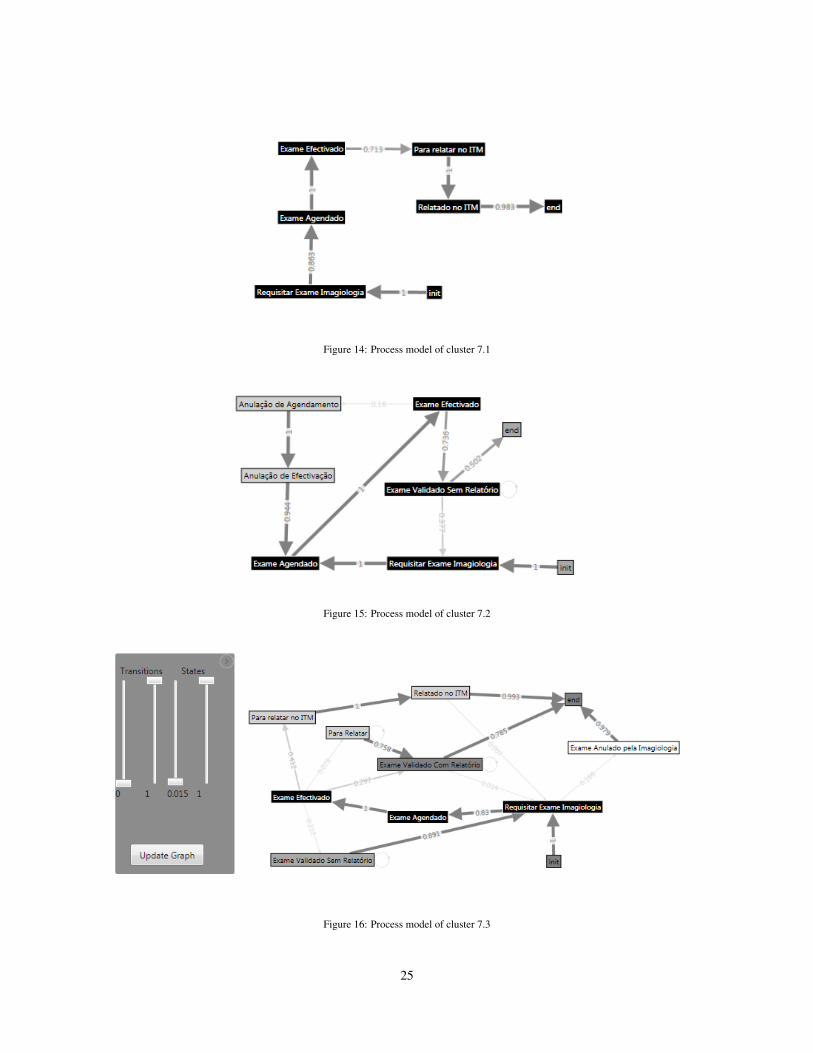
Figure 14: Process model of cluster 7.1
Figure 15: Process model of cluster 7.2
Figure 16: Process model of cluster 7.3
25
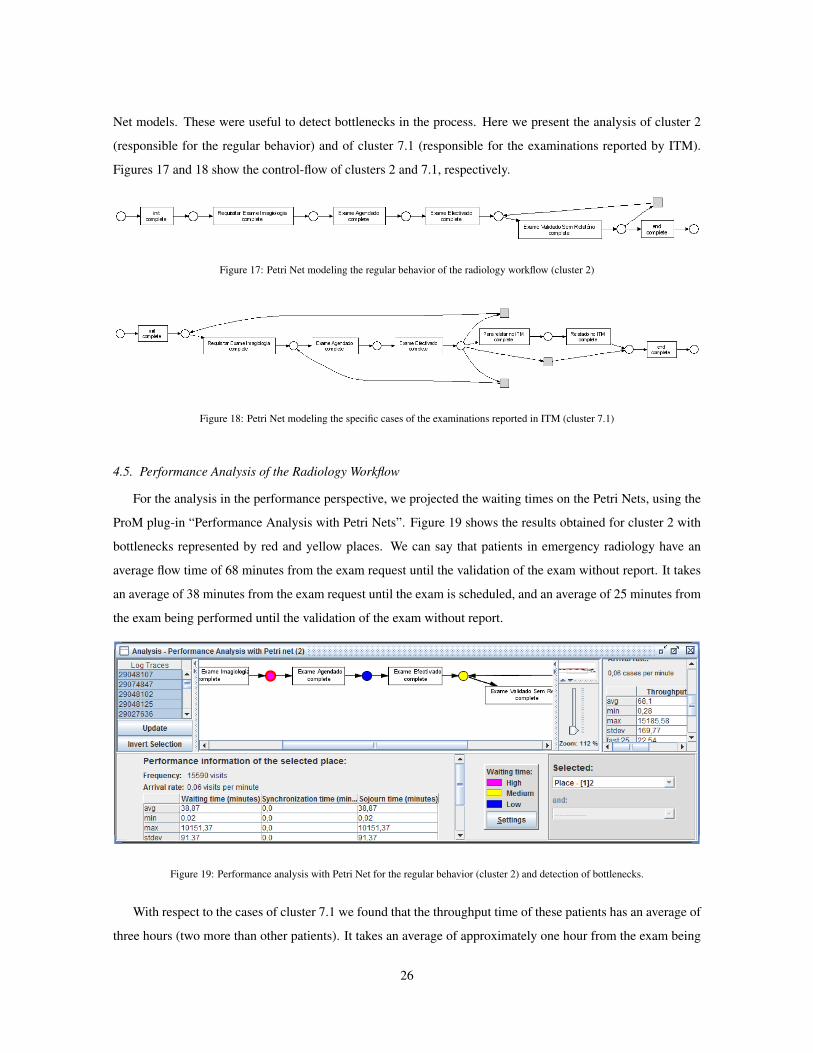
Net models. These were useful to detect bottlenecks in the process. Here we present the analysis of cluster 2
(responsible for the regular behavior) and of cluster 7.1 (responsible for the examinations reported by ITM).
Figures 17 and 18 show the control-flow of clusters 2 and 7.1, respectively.
Figure 17: Petri Net modeling the regular behavior of the radiology workflow (cluster 2)
Figure 18: Petri Net modeling the specific cases of the examinations reported in ITM (cluster 7.1)
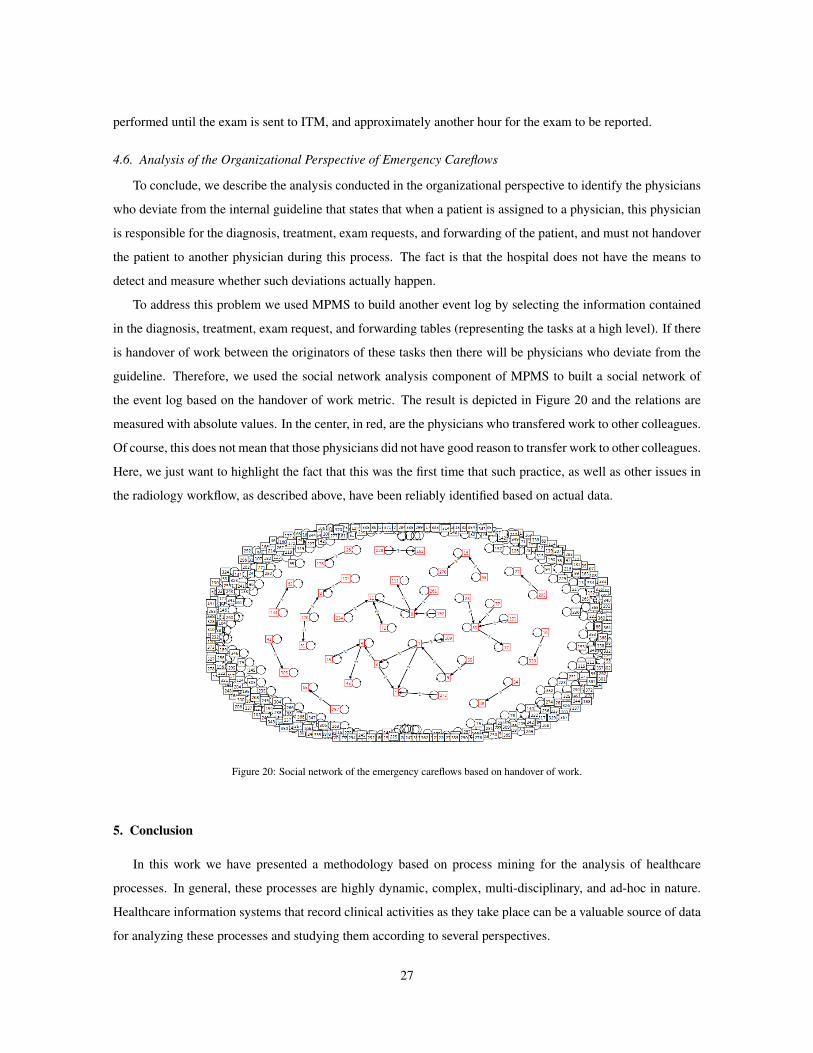
4.5. Performance Analysis of the Radiology Workflow
For the analysis in the performance perspective, we projected the waiting times on the Petri Nets, using the
ProM plug-in “Performance Analysis with Petri Nets”. Figure 19 shows the results obtained for cluster 2 with
bottlenecks represented by red and yellow places. We can say that patients in emergency radiology have an
average flow time of 68 minutes from the exam request until the validation of the exam without report. It takes
an average of 38 minutes from the exam request until the exam is scheduled, and an average of 25 minutes from
the exam being performed until the validation of the exam without report.
Figure 19: Performance analysis with Petri Net for the regular behavior (cluster 2) and detection of bottlenecks.
With respect to the cases of cluster 7.1 we found that the throughput time of these patients has an average of
three hours (two more than other patients). It takes an average of approximately one hour from the exam being
26
performed until the exam is sent to ITM, and approximately another hour for the exam to be reported.
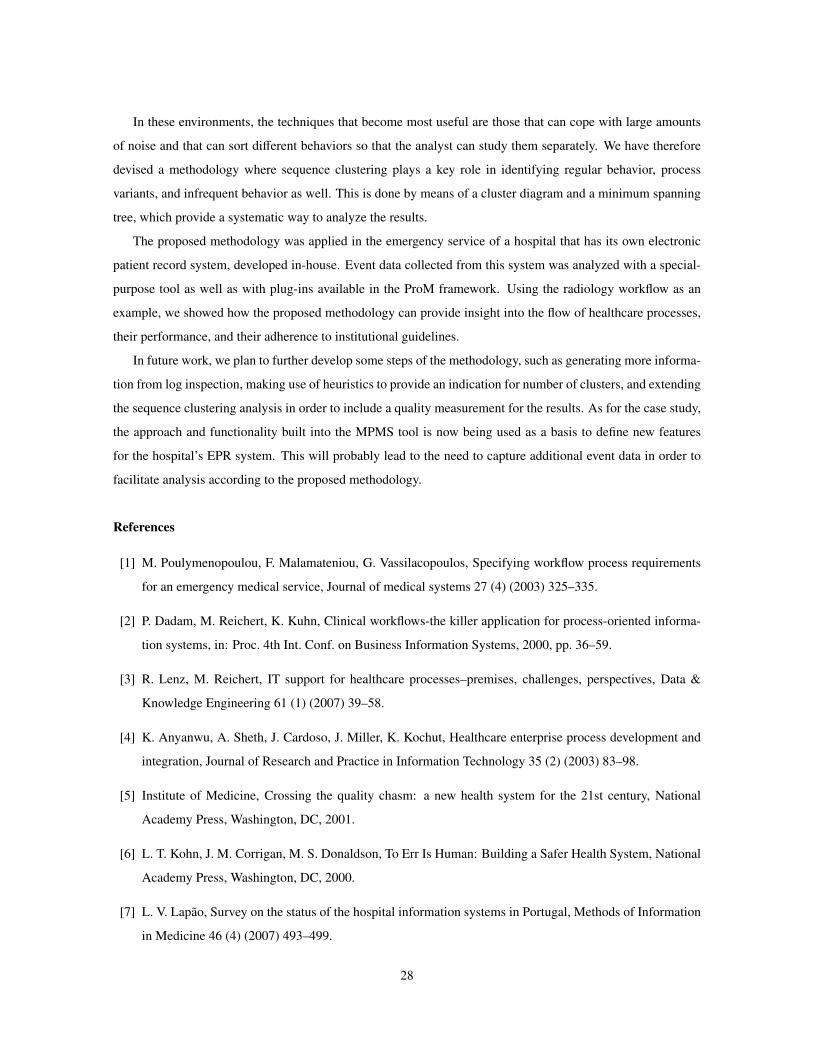
4.6. Analysis of the Organizational Perspective of Emergency Careflows
To conclude, we describe the analysis conducted in the organizational perspective to identify the physicians
who deviate from the internal guideline that states that when a patient is assigned to a physician, this physician
is responsible for the diagnosis, treatment, exam requests, and forwarding of the patient, and must not handover
the patient to another physician during this process. The fact is that the hospital does not have the means to
detect and measure whether such deviations actually happen.
To address this problem we used MPMS to build another event log by selecting the information contained
in the diagnosis, treatment, exam request, and forwarding tables (representing the tasks at a high level). If there
is handover of work between the originators of these tasks then there will be physicians who deviate from the
guideline. Therefore, we used the social network analysis component of MPMS to built a social network of
the event log based on the handover of work metric. The result is depicted in Figure 20 and the relations are
measured with absolute values. In the center, in red, are the physicians who transfered work to other colleagues.
Of course, this does not mean that those physicians did not have good reason to transfer work to other colleagues.
Here, we just want to highlight the fact that this was the first time that such practice, as well as other issues in
the radiology workflow, as described above, have been reliably identified based on actual data.
Figure 20: Social network of the emergency careflows based on handover of work.
5. Conclusion
In this work we have presented a methodology based on process mining for the analysis of healthcare
processes. In general, these processes are highly dynamic, complex, multi-disciplinary, and ad-hoc in nature.
Healthcare information systems that record clinical activities as they take place can be a valuable source of data
for analyzing these processes and studying them according to several perspectives.
27
In these environments, the techniques that become most useful are those that can cope with large amounts
of noise and that can sort different behaviors so that the analyst can study them separately. We have therefore
devised a methodology where sequence clustering plays a key role in identifying regular behavior, process
variants, and infrequent behavior as well. This is done by means of a cluster diagram and a minimum spanning
tree, which provide a systematic way to analyze the results.
The proposed methodology was applied in the emergency service of a hospital that has its own electronic
patient record system, developed in-house. Event data collected from this system was analyzed with a special-
purpose tool as well as with plug-ins available in the ProM framework. Using the radiology workflow as an
example, we showed how the proposed methodology can provide insight into the flow of healthcare processes,
their performance, and their adherence to institutional guidelines.
In future work, we plan to further develop some steps of the methodology, such as generating more informa-
tion from log inspection, making use of heuristics to provide an indication for number of clusters, and extending
the sequence clustering analysis in order to include a quality measurement for the results. As for the case study,
the approach and functionality built into the MPMS tool is now being used as a basis to define new features
for the hospital’s EPR system. This will probably lead to the need to capture additional event data in order to
facilitate analysis according to the proposed methodology.
References
[1] M. Poulymenopoulou, F. Malamateniou, G. Vassilacopoulos, Specifying workflow process requirements
for an emergency medical service, Journal of medical systems 27 (4) (2003) 325–335.
[2] P. Dadam, M. Reichert, K. Kuhn, Clinical workflows-the killer application for process-oriented informa-
tion systems, in: Proc. 4th Int. Conf. on Business Information Systems, 2000, pp. 36–59.
[3] R. Lenz, M. Reichert, IT support for healthcare processes–premises, challenges, perspectives, Data &
Knowledge Engineering 61 (1) (2007) 39–58.
[4] K. Anyanwu, A. Sheth, J. Cardoso, J. Miller, K. Kochut, Healthcare enterprise process development and
integration, Journal of Research and Practice in Information Technology 35 (2) (2003) 83–98.
[5] Institute of Medicine, Crossing the quality chasm: a new health system for the 21st century, National
Academy Press, Washington, DC, 2001.
[6] L. T. Kohn, J. M. Corrigan, M. S. Donaldson, To Err Is Human: Building a Safer Health System, National
Academy Press, Washington, DC, 2000.
[7] L. V. Lapao, Survey on the status of the hospital information systems in Portugal, Methods of Information
in Medicine 46 (4) (2007) 493–499.
28

[8] R. Lenz, K. A. Kuhn, Towards a continuous evolution and adaptation of information systems in healthcare,
International Journal of Medical Informatics 73 (1) (2004) 75 – 89.
[9] G. Darnton, M. Darton, Business Process Analysis, International Thompson Business Press, 1997.
[10] W. van der Aalst, A. Hofstede, M. Weske, Business Process Management: A Survey, Lecture Notes in
Computer Science 2678 (2003) 1–12.
[11] M. Weske, W. M. P. van der Aalst, H. M. W. Verbeek, Advances in business process management, Data &
Knowledge Engineering 50 (1) (2004) 1–8.
[12] S. Gupta, Workflow and process mining in healthcare, Master’s thesis, Technische Universiteit Eindhoven
(2007).
[13] R. Mans, H. Schonenberg, G. Leonardi, S. Panzarasa, A. Cavallini, S. Quaglini, W. van der Aalst, Process
mining techniques: an application to stroke care, Stud Health Technol Inform 136 (2008) 573–8.
[14] R. Mans, M. Schonenberg, M. Song, W. van der Aalst, P. Bakker, Application of Process Mining in
Healthcare – A Case Study in a Dutch Hospital, in: Biomedical Engineering Systems and Technologies,
no. 25 in Communications in Computer and Information Science, Springer, 2009, pp. 425–438.
[15] B. van Dongen, Process mining and verification, Ph.D. thesis, Technische Universiteit Eindhoven (2007).
[16] M. Weske, Business Process Management: Concepts, Languages, Architectures, Springer, 2007.
[17] W. van Der Aalst, A. Ter Hofstede, B. Kiepuszewski, A. Barros, Workflow patterns, Distributed and
parallel databases 14 (1) (2003) 5–51.
[18] M. Lang, T. Burkle, S. Laumann, H.-U. Prokosch, Process Mining for Clinical Workflows: Challenges
and Current Limitations, in: Proceedings of MIE2008, The XXIst International Congress of the European
Federation for Medical Informatics, IOS Press, 2008, pp. 229–234.
[19] J. Sterman, System dynamics modeling for project management, Tech. rep., MIT Sloan School of Man-
agement (1992).
[20] J. Sterman, Modeling managerial behavior: misperceptions of feedback in a dynamic decision making
experiment, Management science 35 (3) (1989) 321–339.
[21] A. Vasconcelos, R. Mendes, J. Tribolet, Using organizational modeling to evaluate health care IS/IT
projects, in: Proceedings of 37th Annual Hawaii International Conference On System Sciences
(HICCS37), Hawaii, USA, 2004.
29
[22] W. van Der Aalst, H. Reijers, A. Weijters, B. Van Dongen, A. Alves de Medeiros, M. Song, H. Verbeek,
Business process mining: An industrial application, Information Systems 32 (5) (2007) 713–732.
[23] W. van der Aalst, T. Weijters, L. Maruster, Workflow mining: Discovering process models from event
logs, IEEE Transactions on Knowledge and Data Engineering 16 (9) (2004) 1128–1142.
[24] A. Weijters, W. van der Aalst, A. A. de Medeiros, Process mining with the heuristics miner algorithm,
BETA Working Paper Series WP 166, Eindhoven University of Technology (2006).
[25] C. Gunther, W. van der Aalst, Fuzzy Mining – Adaptive Process Simplification Based on Multi-perspective
Metrics, Lecture Notes in Computer Science 4714 (2007) 328–343.
[26] A. K. A. D. Medeiros, A. J. M. M. Weijters, Genetic Process Mining, Lecture Notes in Computer Science
3536 (2005) 48–69.
[27] W. van der Aalst, M. Song, Mining Social Networks: Uncovering Interaction Patterns in Business Pro-
cesses, Lecture Notes in Computer Science 3080 (2004) 244–260.
[28] M. Song, W. van der Aalst, Towards comprehensive support for organizational mining, Decision Support
Systems 46 (1) (2008) 300–317.
[29] P. T. Hornix, Performance analysis of business processes through process mining, Master’s thesis, Eind-
hoven University of Technology (2007).
[30] M. Song, W. van der Aalst, Supporting process mining by showing events at a glance, in: Proceedings of
the Seventeenth Annual Workshop on Information Technologies and Systems, 2007, pp. 139–145.
[31] A. Rozinat, W. van der Aalst, Conformance checking of processes based on monitoring real behavior,
Information Systems 33 (1) (2008) 64–95.
[32] W. van der Aalst, H. de Beer, B. van Dongen, Process mining and verification of properties: An approach
based on temporal logic, Lecture notes in computer science 3760 (2005) 130–147.
[33] B. van Dongen, A. de Medeiros, H. Verbeek, A. Weijters, W. van der Aalst, The ProM framework: A new
era in process mining tool support, Lecture Notes in Computer Science 3536 (2005) 444–454.
[34] G. M. Veiga, D. R. Ferreira, Understanding spaghetti models with sequence clustering for ProM, in: Busi-
ness Process Intelligence (BPI 2009): Workshop Proceedings, Ulm, Germany, 2009.
[35] A. K. A. de Medeiros, A. Guzzo, G. Greco, W. M. P. van der Aalst, A. J. M. M. Weijters, B. F. van Dongen,
D. Sacca, Process Mining Based on Clustering: A Quest for Precision , Lecture Notes in Computer Science
4928 (2008) 17–29.
30
[36] M. Song, C. Gunther, W. van der Aalst, Trace Clustering in Process Mining, Lecture Notes in Business
Information Processing 17 (2008) 109–120.
[37] G. Veiga, Developing Process Mining Tools, An Implementation of Sequence Clustering for ProM, Mas-
ter’s thesis, IST – Technical University of Lisbon (2009).
[38] D. R. Ferreira, M. Zacarias, M. Malheiros, P. Ferreira, Approaching Process Mining with Sequence Clus-
tering: Experiments and Findings, Lecture Notes in Computer Science 4714 (2007) 360–374.
[39] D. Ferreira, M. Mira da Silva, Using process mining for ITIL assessment: a case study with incident
management, in: Proceedings of the 13th Annual UKAIS Conference, Bournemouth University, 2008.
[40] D. R. Ferreira, Applied sequence clustering techniques for process mining, in: J. Cardoso, W. van der
Aalst (Eds.), Handbook of Research on Business Process Modeling, Information Science Reference, IGI
Global, 2009, pp. 492–513.
[41] D. R. Ferreira, D. Gillblad, Discovering process models from unlabelled event logs, Lecture Notes in
Computer Science 5701 (2009) 143–158.
[42] M. Bozkaya, J. Gabriels, J. van der Werf, Process Diagnostics: A Method Based on Process Mining, in:
International Conference on Information, Process, and Knowledge Management (eKNOW ’09), 2009, pp.
22–27.
[43] I. Cadez, D. Heckerman, C. Meek, P. Smyth, S. White, Visualization of navigation patterns on a web site
using model-based clustering, in: Proceedings of the Sixth ACM SIGKDD International Conference on
Knowledge Discovery and Data Mining, ACM New York, NY, USA, 2000, pp. 280–284.
[44] D. Gillblad, D. R. Ferreira, R. Steinert, Estimating the parameters of randomly interleaved markov models,
in: The 1st Workshop on Large-scale Data Mining: Theory and Applications, in conjunction with ICDM
2009, December 6-9, Miami, FL, USA, 2009.
[45] C. Li, M. Reichert, A. Wombacher, Mining process variants: Goals and issues, in: IEEE International
Conference on Services Computing, 2008, pp. 573–576.
[46] C. Li, M. Reichert, A. Wombacher, Discovering reference process models by mining process variants, in:
Proceedings of the 2008 IEEE International Conference on Web Services, 2008, pp. 45–53.
[47] A. Hallerbach, T. Bauer, M. Reichert, Managing Process Variants in the Process Lifecycle, in: 10th Int’l
Conf. on Enterprise Information Systems (ICEIS’08), 2008, pp. 154–161.
[48] R. Graham, P. Hell, On the history of the minimum spanning tree problem, Annals of the History of
Computing 7 (1) (1985) 43–57.
31

[49] E. Dijkstra, A note on two problems in connexion with graphs, Numerische mathematik 1 (1) (1959)
269–271.
[50] J. B. Kruskal, On the Shortest Spanning Subtree of a Graph and the Traveling Salesman Problem, Pro-
ceedings of the American Mathematical society 7 (1) (1956) 48–50.
32


![Sequence Partitioning for Process Mining with ... - web.ist.utl.ptweb.ist.utl.pt/~diogo.ferreira/papers/walicki11sequence.pdf · A wide range of process mining techniques [4] has](https://img.pdfslide.us/doc/110x75/60098efabe7b15544f1b64a5/sequence-partitioning-for-process-mining-with-webistutlptwebistutlptdiogoferreirapapers.jpg)