Embed Size (px)
Citation preview
BUSINESS PLAN TO 2023
More growth at
lower risk.
Analyst PresentationConference call, 10th Jan.
2020
01GRUPPOHERA
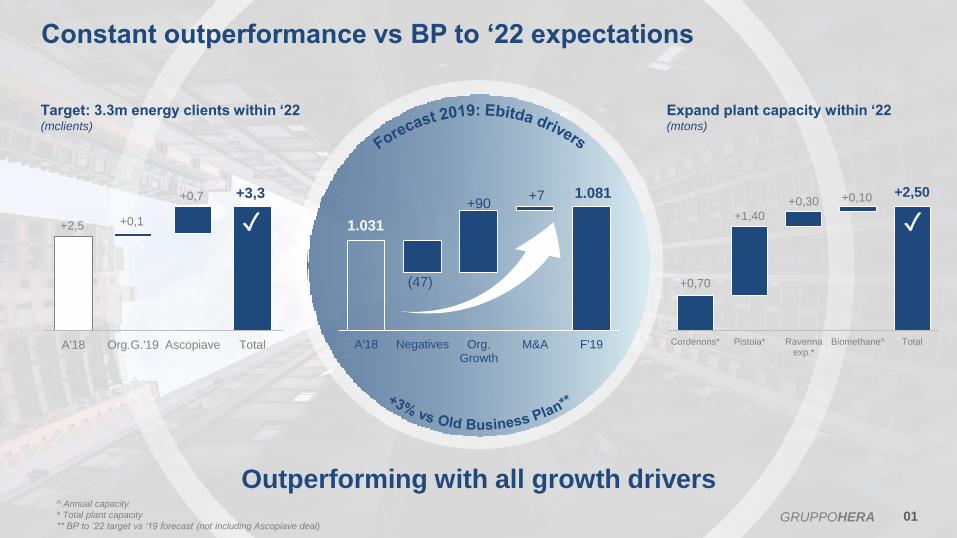
Outperforming with all growth drivers
Constant outperformance vs BP to ‘22 expectations
1.031
1.081
(47)
+90+7
A'18 Negatives Org.Growth
M&A F'19
Target: 3.3m energy clients within ‘22(mclients)
Expand plant capacity within ‘22(mtons)
+2,5
+3,3
+0,1
+0,7
A'18 Org.G.'19 Ascopiave Total
+0,70
+2,50
+1,40
+0,30 +0,10
Cordenons* Pistoia* Ravennaexp.*
Biomethane^ Total
✓ ✓
^ Annual capacity
* Total plant capacity
** BP to ’22 target vs ‘19 forecast (not including Ascopiave deal)
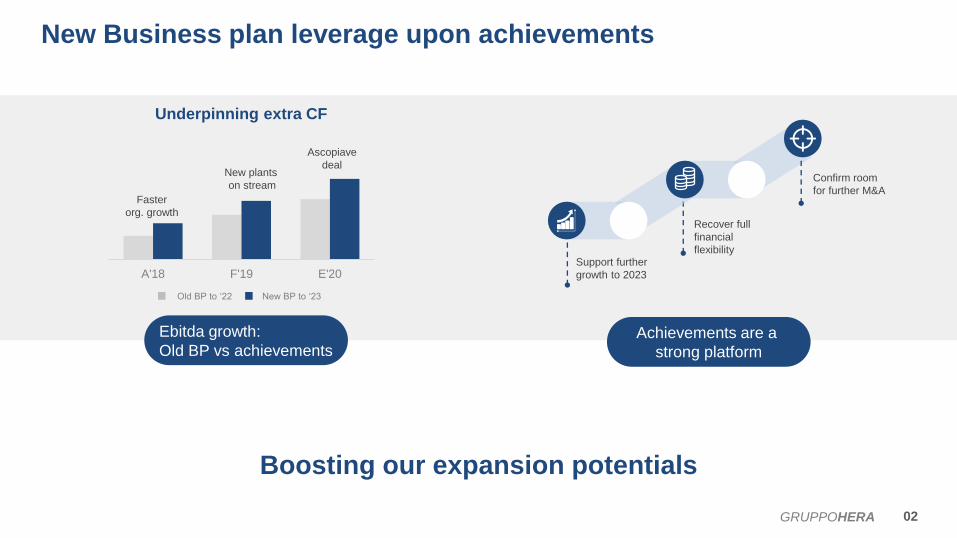
Ebitda growth:
Old BP vs achievements
Underpinning extra CF
Achievements are a
strong platform
New Business plan leverage upon achievements
02GRUPPOHERA
Boosting our expansion potentials
A'18 F'19 E'20
Faster
org. growth
Ascopiave
dealNew plants
on stream
Old BP to ‘22 New BP to ‘23
Confirm room
for further M&A
Support further
growth to 2023
Recover full
financial
flexibility
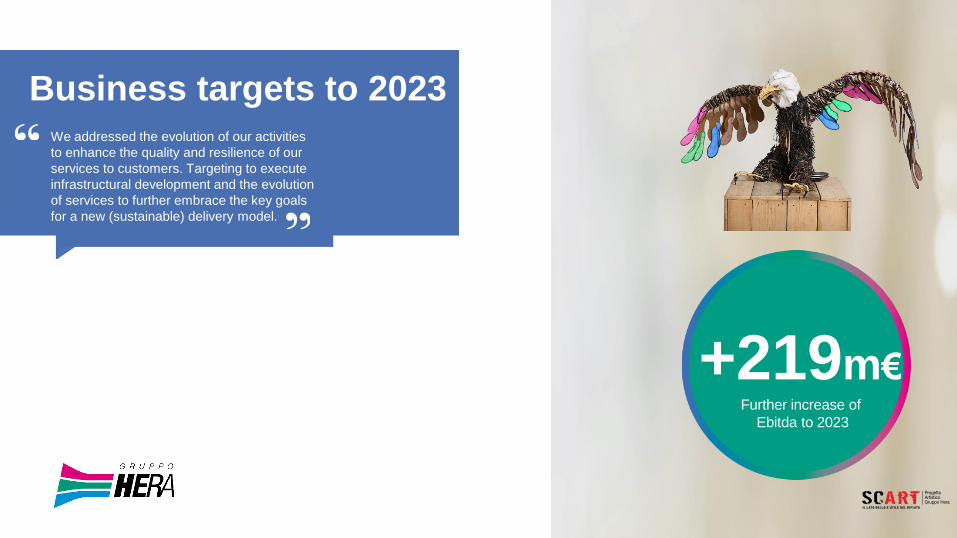
We addressed the evolution of our activities
to enhance the quality and resilience of our
services to customers. Targeting to execute
infrastructural development and the evolution
of services to further embrace the key goals
for a new (sustainable) delivery model.
Business targets to 2023
+219m€Further increase of
Ebitda to 2023
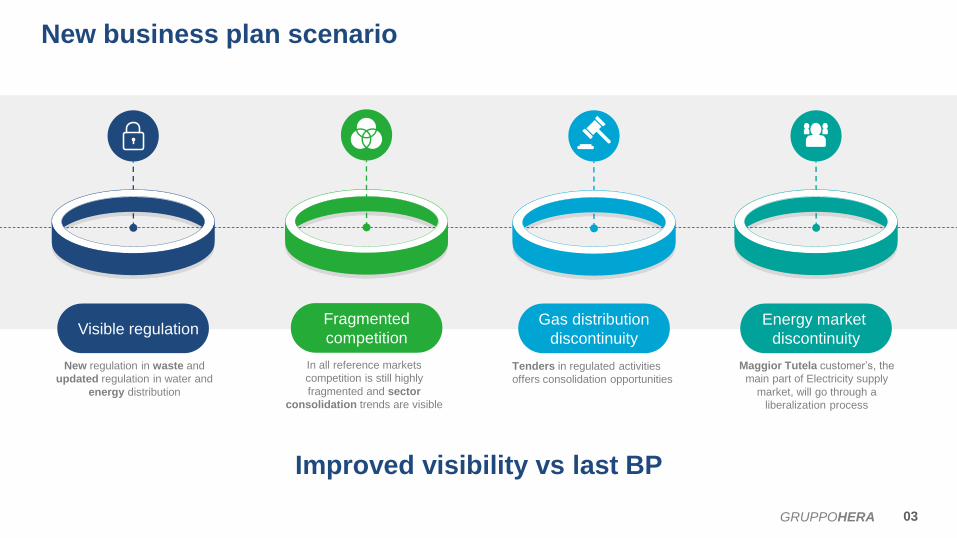
New business plan scenario
03GRUPPOHERA
Improved visibility vs last BP
Visible regulationEnergy market
discontinuity
Gas distribution
discontinuity
Fragmented
competition
New regulation in waste and
updated regulation in water and
energy distribution
Maggior Tutela customer’s, the
main part of Electricity supply
market, will go through a
liberalization process
Tenders in regulated activities
offers consolidation opportunities
In all reference markets
competition is still highly
fragmented and sector
consolidation trends are visible
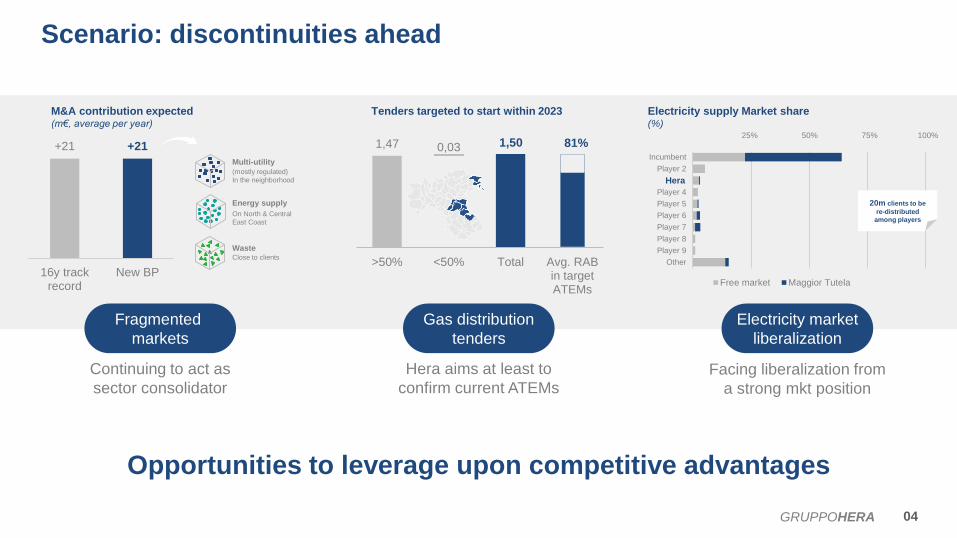
Scenario: discontinuities ahead
04GRUPPOHERA
Opportunities to leverage upon competitive advantages
Fragmented
markets
Gas distribution
tenders
Electricity market
liberalization
Continuing to act as
sector consolidator
Hera aims at least to
confirm current ATEMsFacing liberalization from
a strong mkt position
+21 +21
16y trackrecord
New BP
Energy supply
Waste
Multi-utility
Close to clients
On North & Central
East Coast
M&A contribution expected(m€, average per year)
(mostly regulated)
In the neighborhood
1,47 1,500,03
>50% <50% Total Avg. RABin targetATEMs
81%
Tenders targeted to start within 2023 Electricity supply Market share(%)
Other
Player 9
Player 8
Player 7
Player 6
Player 5
Player 4
Player 2
Incumbent
Free market Maggior Tutela
25% 50% 75% 100%
Hera
20m clients to be
re-distributed
among players
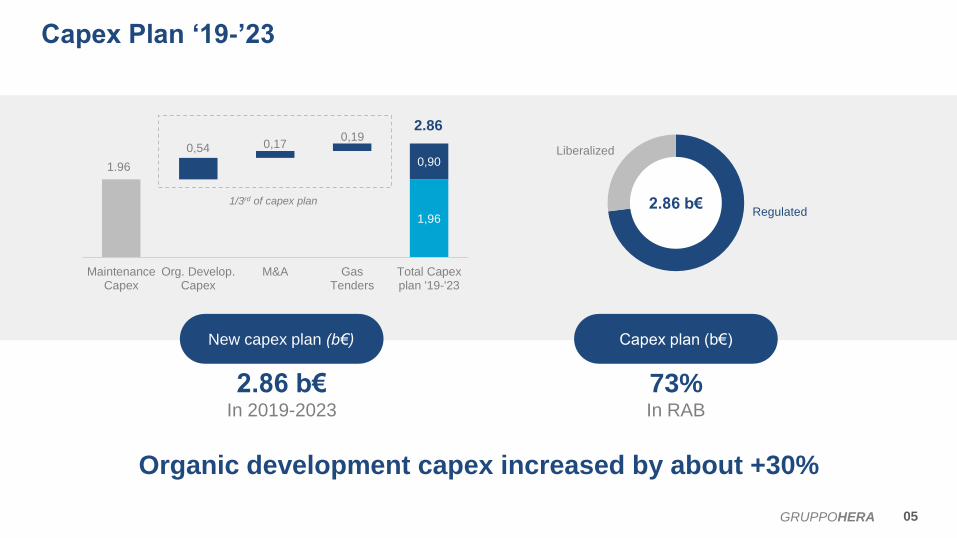
New capex plan (b€)
2.86 b€In 2019-2023
Capex plan (b€)
Capex Plan ‘19-’23
05GRUPPOHERA
Organic development capex increased by about +30%
1.96
1,96
0,54 0,170,19
0,90
MaintenanceCapex
Org. Develop.Capex
M&A GasTenders
Total Capexplan '19-'23
2.86
1/3rd of capex plan Regulated
Liberalized
73%In RAB
2.86 b€
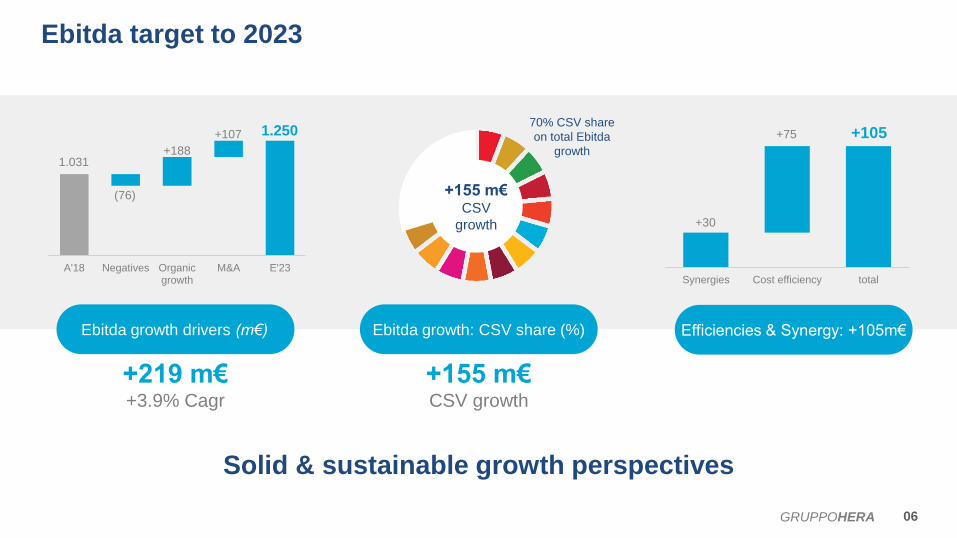
Ebitda growth drivers (m€)
+219 m€+3.9% Cagr
Ebitda growth: CSV share (%)
Ebitda target to 2023
06GRUPPOHERA
Solid & sustainable growth perspectives
+155 m€CSV growth
1.031
1.250
(76)
+188
+107
A'18 Negatives Organicgrowth
M&A E'23
+155 m€ CSV
growth
70% CSV share
on total Ebitda
growth
Efficiencies & Synergy: +105m€
+30
+105+75
Synergies Cost efficiency total
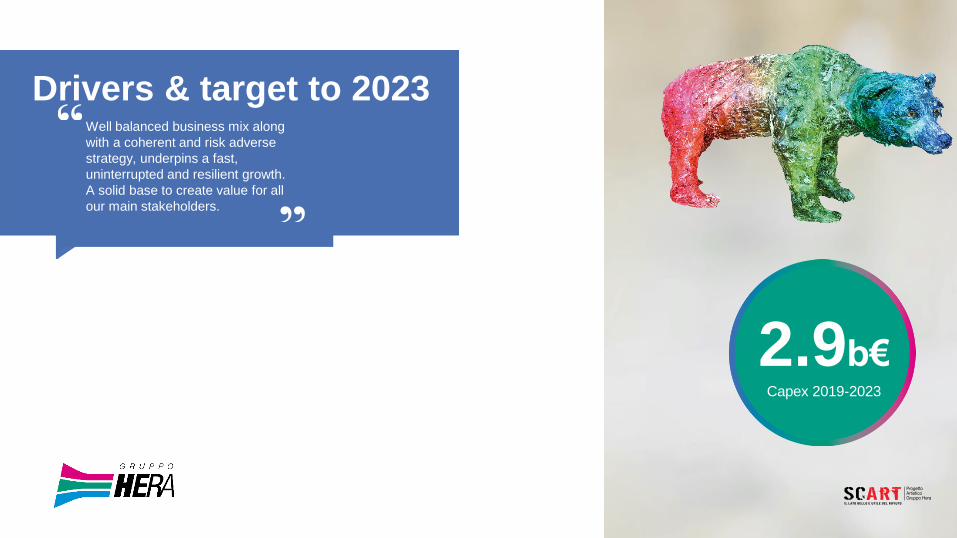
Drivers & target to 2023
2.9b€Capex 2019-2023
Well balanced business mix along
with a coherent and risk adverse
strategy, underpins a fast,
uninterrupted and resilient growth.
A solid base to create value for all
our main stakeholders.
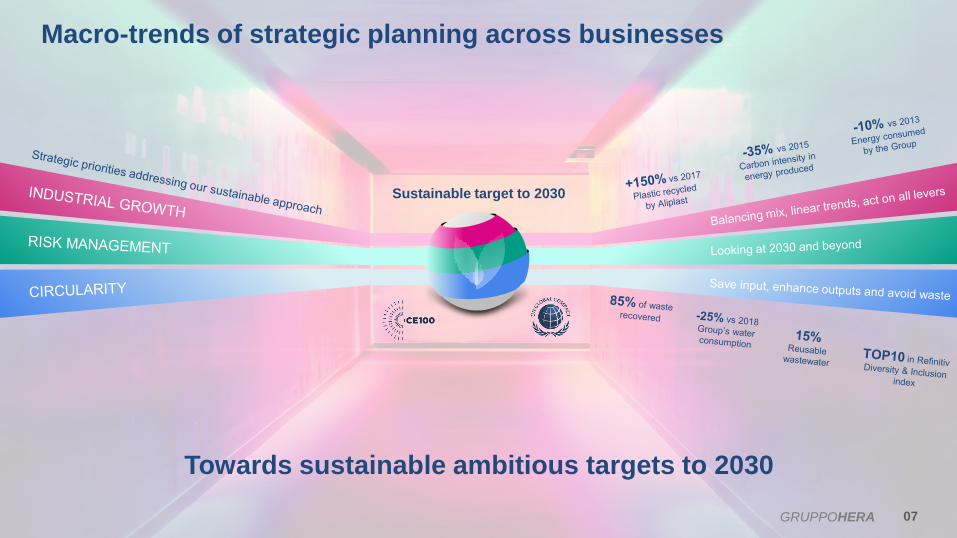
Macro-trends of strategic planning across businesses
Towards sustainable ambitious targets to 2030
07GRUPPOHERA
Sustainable target to 2030
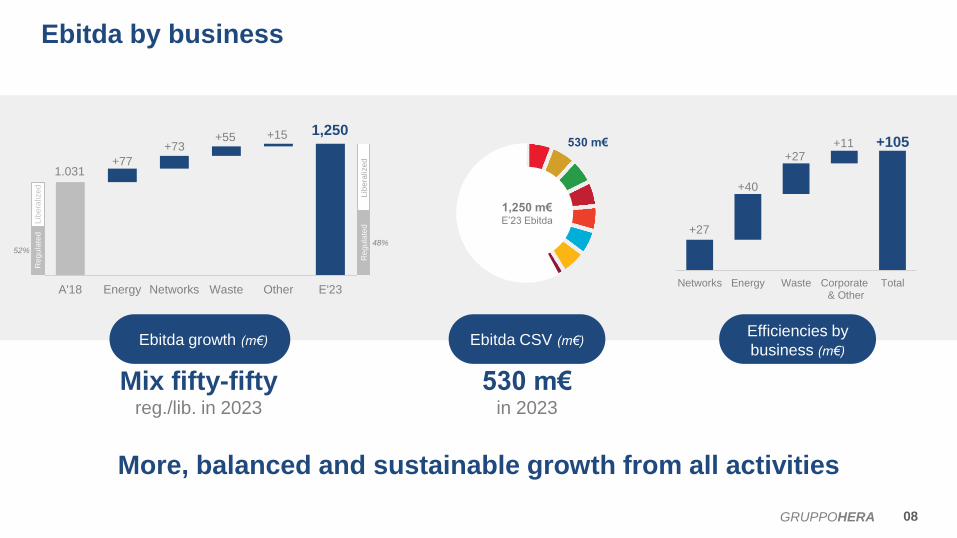
Ebitda growth (m€)Efficiencies by
business (m€)
Ebitda by business
08GRUPPOHERA
More, balanced and sustainable growth from all activities
Ebitda CSV (m€)
530 m€in 2023
Mix fifty-fifty reg./lib. in 2023
530 m€
1,250 m€ E’23 Ebitda
+27
+105
+40
+27+11
Networks Energy Waste Corporate & Other
Total
1.031
1,250
+77
+73+55 +15
A'18 Energy Networks Waste Other E'23
Reg
ula
ted
Lib
era
lize
d
Reg
ula
ted
Lib
era
lize
d
48%52%
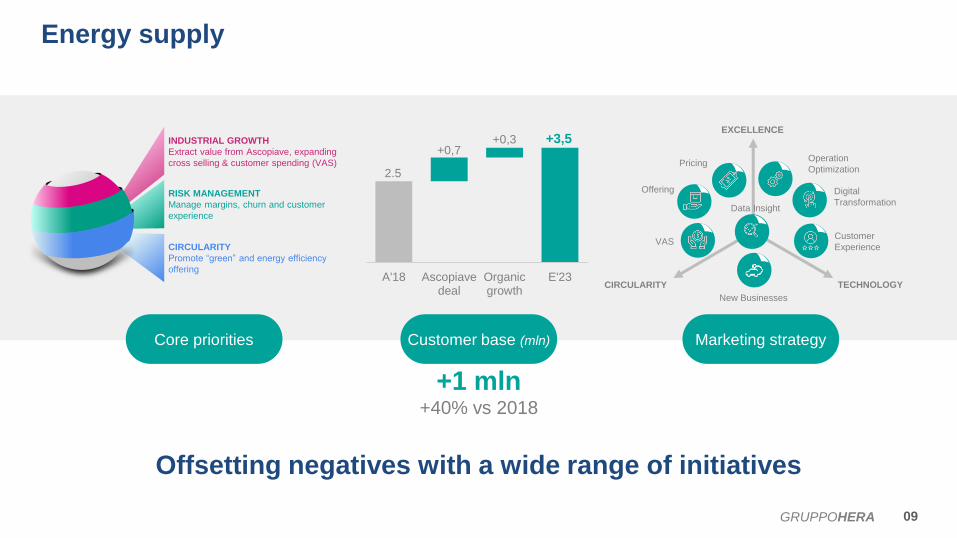
Core priorities Marketing strategy
Energy supply
09GRUPPOHERA
Offsetting negatives with a wide range of initiatives
Customer base (mln)
+1 mln+40% vs 2018
CIRCULARITY
Promote “green” and energy efficiency
offering
INDUSTRIAL GROWTH
Extract value from Ascopiave, expanding
cross selling & customer spending (VAS)
RISK MANAGEMENT
Manage margins, churn and customer
experience
2.5
+3,5+0,7
+0,3
A'18 Ascopiavedeal
Organicgrowth
E'23
EXCELLENCE
TECHNOLOGYCIRCULARITY
Operation
Optimization
Digital
Transformation
Customer
ExperienceVAS
Offering
Pricing
Data Insight
New Businesses
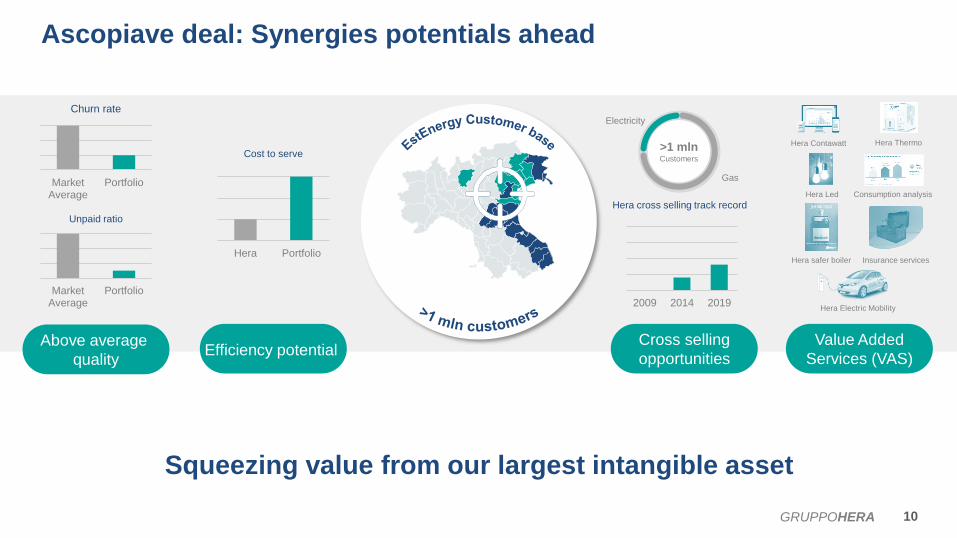
Above average
quality
Ascopiave deal: Synergies potentials ahead
10GRUPPOHERA
Squeezing value from our largest intangible asset
Efficiency potentialCross selling
opportunities
Value Added
Services (VAS)
Churn rate
Unpaid ratio
MarketAverage
Portfolio
MarketAverage
Portfolio
Cost to serve
Hera Portfolio
Hera Contawatt
Consumption analysis
Hera safer boiler
Hera Led
Hera Electric Mobility
Insurance services
Hera Thermo>1 mlnCustomers
Electricity
Gas
Hera cross selling track record
2009 2014 2019
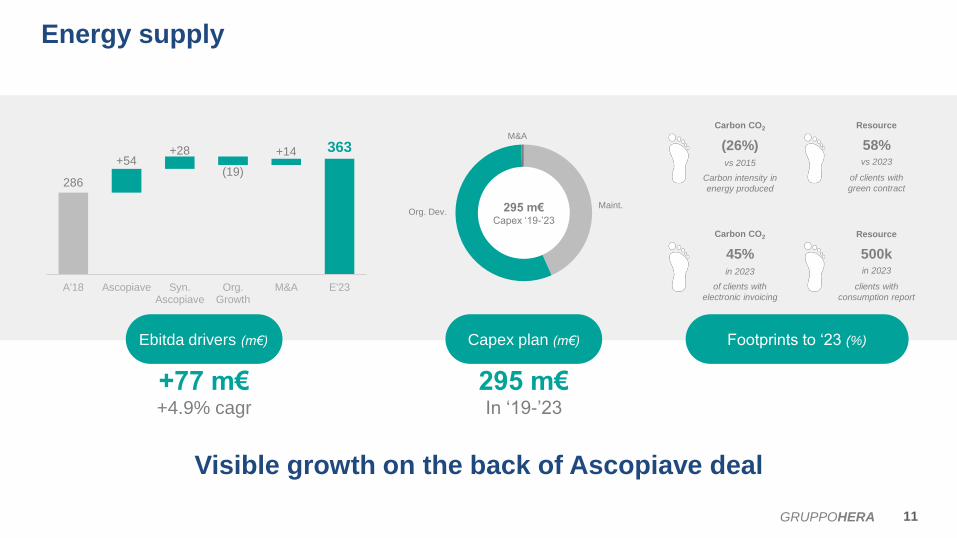
Ebitda drivers (m€) Footprints to ‘23 (%)
Energy supply
11GRUPPOHERA
Visible growth on the back of Ascopiave deal
Capex plan (m€)
295 m€In ‘19-’23
+77 m€+4.9% cagr
295 m€ Capex ‘19-’23
Maint.Org. Dev.
M&A
Carbon CO2
Carbon intensity in
energy produced
(26%)vs 2015
of clients with
green contract
58%vs 2023
Resource
Carbon CO2
of clients with
electronic invoicing
45%in 2023
clients with
consumption report
500kin 2023
Resource
286
363+54
+28
(19)
+14
A'18 Ascopiave Syn.Ascopiave
Org.Growth
M&A E'23
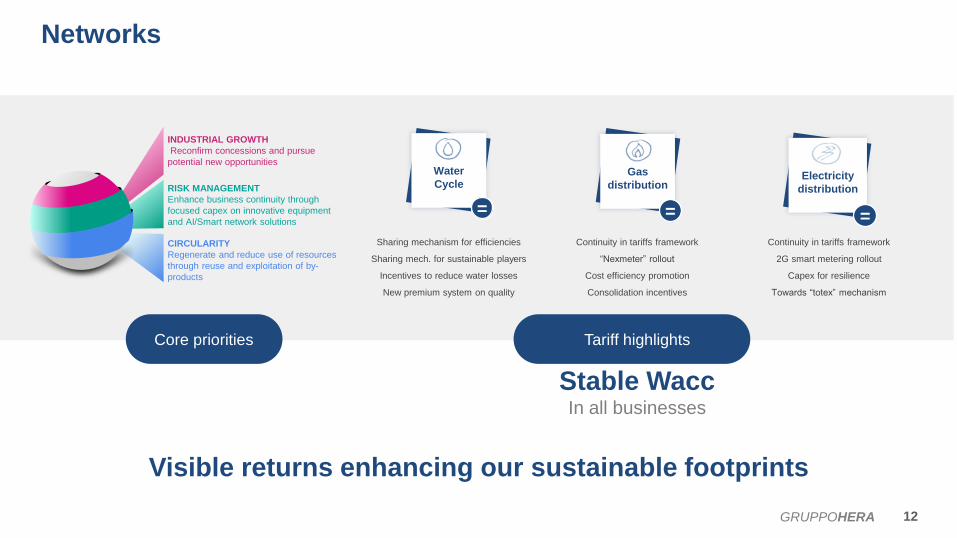
Core priorities
Networks
12GRUPPOHERA
Visible returns enhancing our sustainable footprints
Tariff highlights
Stable WaccIn all businesses
CIRCULARITY
Regenerate and reduce use of resources
through reuse and exploitation of by-
products
INDUSTRIAL GROWTH
Reconfirm concessions and pursue
potential new opportunities
RISK MANAGEMENT
Enhance business continuity through
focused capex on innovative equipment
and AI/Smart network solutions
Water
CycleGas
distribution
=
Electricity
distribution
=
Sharing mechanism for efficiencies
Sharing mech. for sustainable players
Incentives to reduce water losses
New premium system on quality
Continuity in tariffs framework
“Nexmeter” rollout
Cost efficiency promotion
Consolidation incentives
Continuity in tariffs framework
2G smart metering rollout
Capex for resilience
Towards “totex” mechanism
=
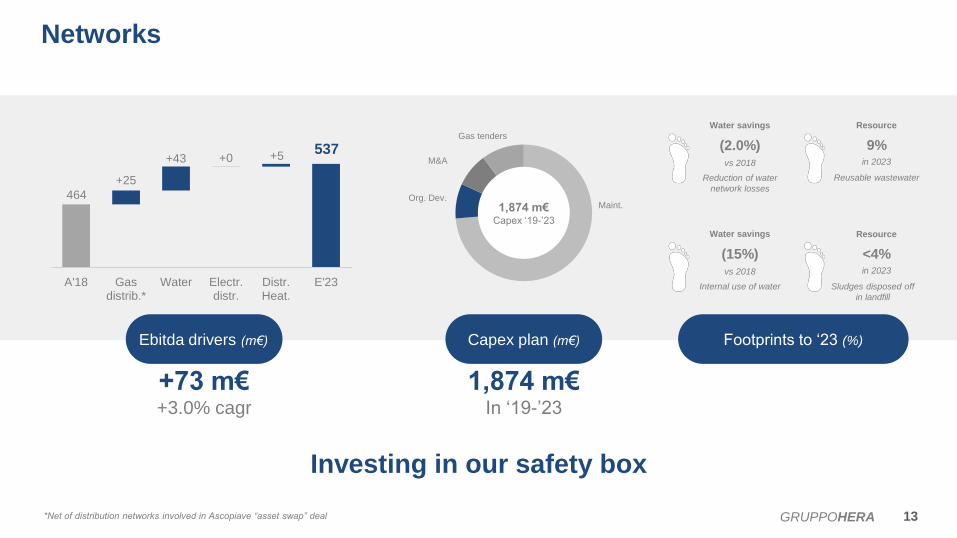
Ebitda drivers (m€) Footprints to ‘23 (%)
Networks
13GRUPPOHERA
Investing in our safety box
Capex plan (m€)
1,874 m€In ‘19-’23
1,874 m€ Capex ‘19-’23
Maint.Org. Dev.
Gas tenders
Water savings
Reduction of water
network losses
(2.0%)vs 2018
Reusable wastewater
9%in 2023
Resource
Water savings
Internal use of water
(15%)vs 2018
Sludges disposed off
in landfill
<4%in 2023
Resource
M&A
*Net of distribution networks involved in Ascopiave “asset swap” deal
464
537
+25
+43 +0 +5
A'18 Gasdistrib.*
Water Electr.distr.
Distr.Heat.
E'23
+73 m€+3.0% cagr
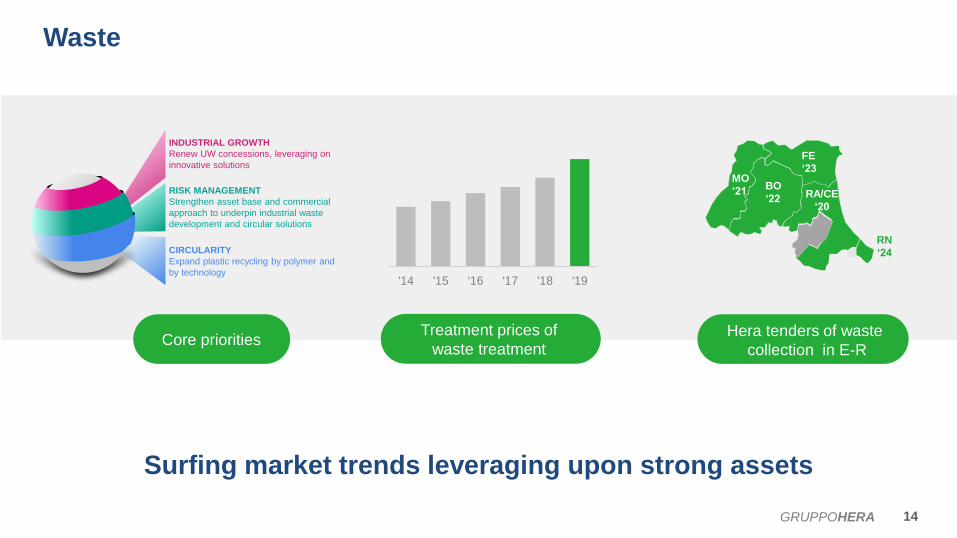
Core prioritiesTreatment prices of
waste treatment
Waste
14GRUPPOHERA
Surfing market trends leveraging upon strong assets
Hera tenders of waste
collection in E-R
CIRCULARITY
Expand plastic recycling by polymer and
by technology
INDUSTRIAL GROWTH
Renew UW concessions, leveraging on
innovative solutions
RISK MANAGEMENT
Strengthen asset base and commercial
approach to underpin industrial waste
development and circular solutions
MO
‘21BO
‘22
FE
‘23
'14 '15 '16 '17 '18 '19
RN
‘24
RA/CE
‘20
Ebitda drivers (m€) Footprints to ‘23 (%)
Waste
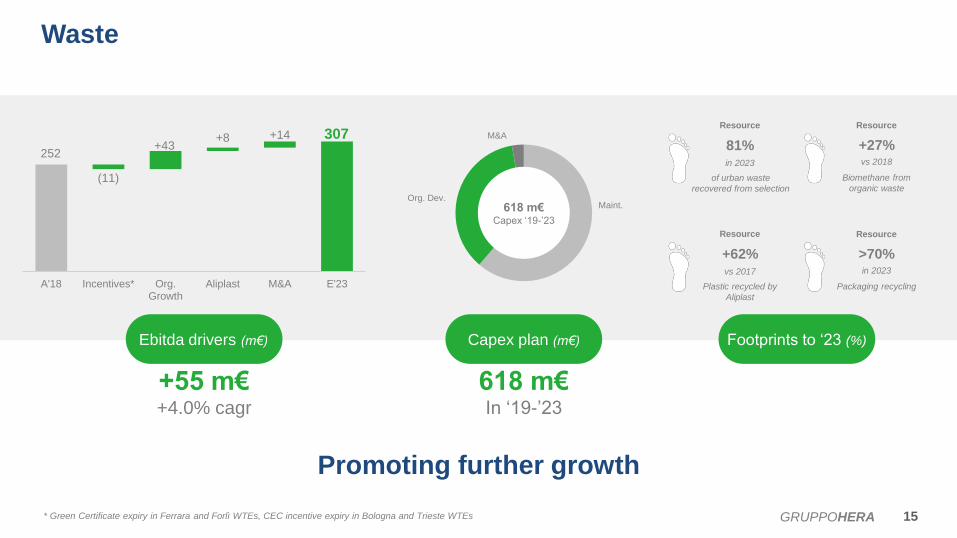
15GRUPPOHERA
Promoting further growth
Capex plan (m€)
618 m€In ‘19-’23
618 m€ Capex ‘19-’23
Maint.Org. Dev.
Resource
of urban waste
recovered from selection
81%in 2023
Biomethane from
organic waste
+27%vs 2018
Resource
Resource
Plastic recycled by
Aliplast
+62%vs 2017
Packaging recycling
>70%in 2023
Resource
M&A
252
307
(11)
+43+8 +14
A'18 Incentives* Org.Growth
Aliplast M&A E'23
+55 m€+4.0% cagr
* Green Certificate expiry in Ferrara and Forlì WTEs, CEC incentive expiry in Bologna and Trieste WTEs
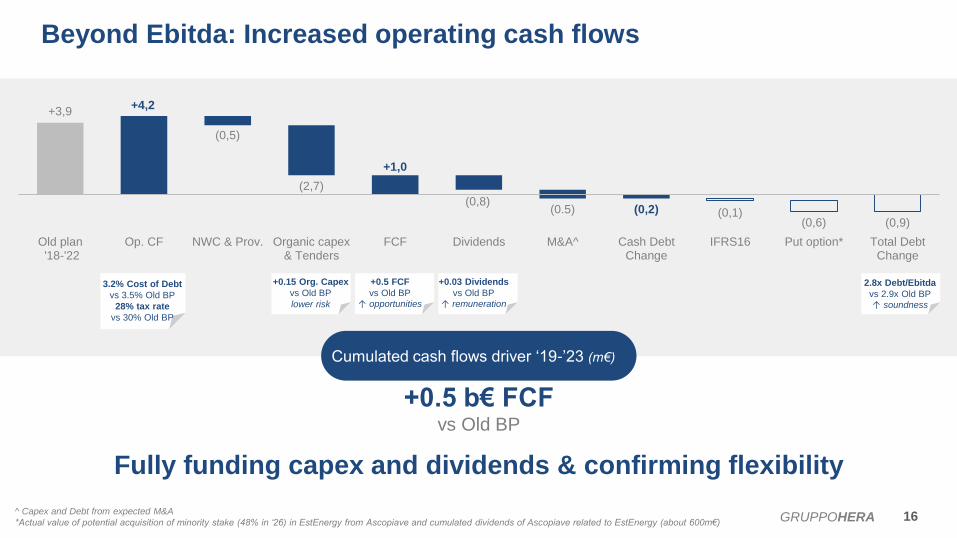
Cumulated cash flows driver ‘19-’23 (m€)
Beyond Ebitda: Increased operating cash flows
16GRUPPOHERA
Fully funding capex and dividends & confirming flexibility
+0.5 b€ FCFvs Old BP
^ Capex and Debt from expected M&A
*Actual value of potential acquisition of minority stake (48% in ‘26) in EstEnergy from Ascopiave and cumulated dividends of Ascopiave related to EstEnergy (about 600m€)
+3,9+4,2
+1,0
(0,2)(0,9)
(0,5)
(2,7)
(0,8)(0.5) (0,1)
(0,6)
Old plan '18-'22
Op. CF NWC & Prov. Organic capex& Tenders
FCF Dividends M&A^ Cash DebtChange
IFRS16 Put option* Total DebtChange
+0.15 Org. Capex
vs Old BP
lower risk
+0.5 FCF
vs Old BP ↑ opportunities
+0.03 Dividends
vs Old BP ↑ remuneration
2.8x Debt/Ebitda
vs 2.9x Old BP ↑ soundness
3.2% Cost of Debt
vs 3.5% Old BP
28% tax rate
vs 30% Old BP
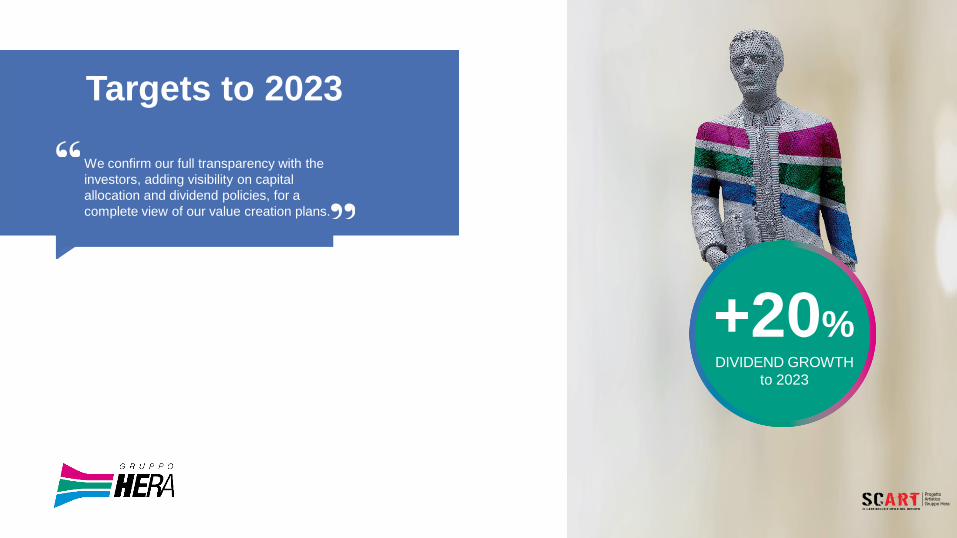
We confirm our full transparency with the
investors, adding visibility on capital
allocation and dividend policies, for a
complete view of our value creation plans.
Targets to 2023
+20%DIVIDEND GROWTH
to 2023
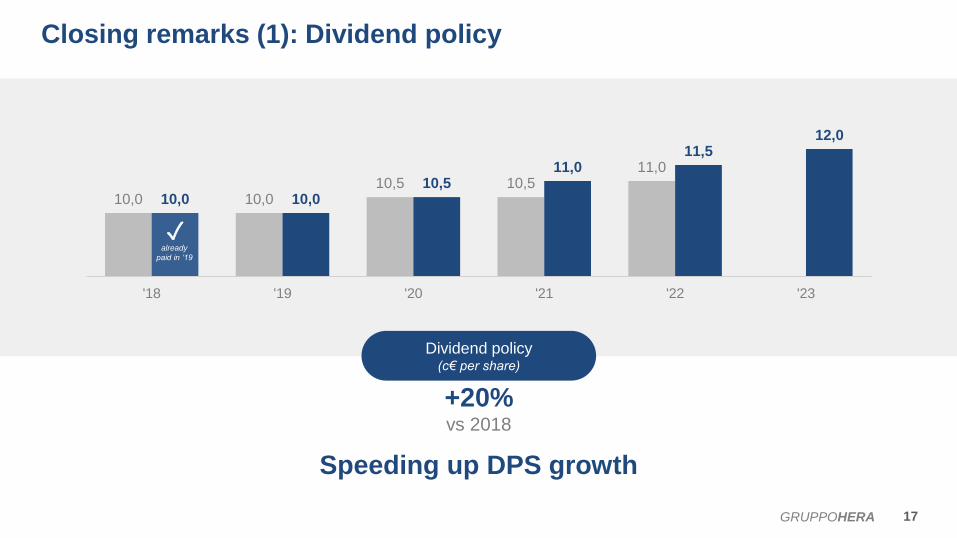
Dividend policy (c€ per share)
Closing remarks (1): Dividend policy
17GRUPPOHERA
Speeding up DPS growth
+20%vs 2018
10,0 10,010,5 10,5
11,0
10,0 10,010,5
11,011,5
12,0
'18 '19 '20 '21 '22 '23
✓already
paid in ‘19
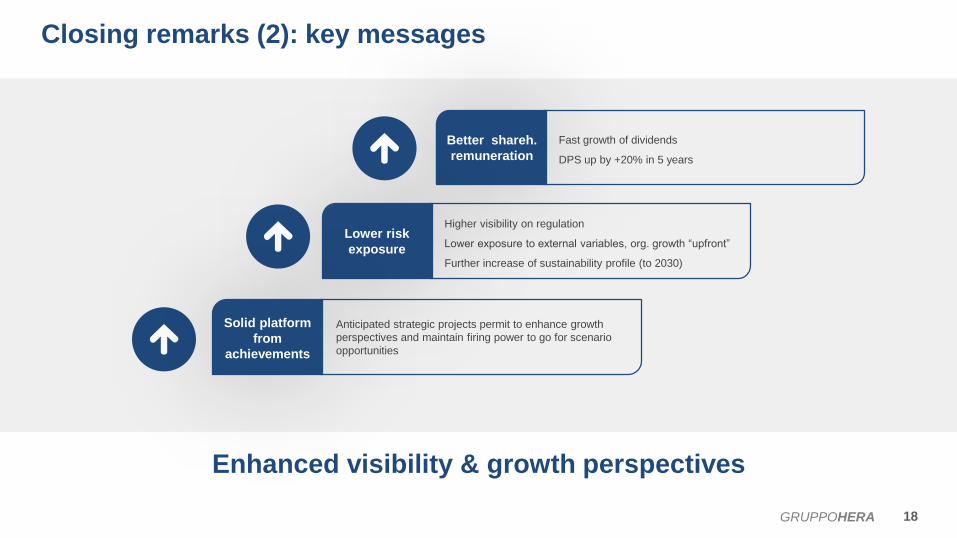
Closing remarks (2): key messages
18GRUPPOHERA
Enhanced visibility & growth perspectives
Better shareh.
remuneration
Lower risk
exposure
Fast growth of dividends
DPS up by +20% in 5 years
Higher visibility on regulation
Lower exposure to external variables, org. growth “upfront”
Further increase of sustainability profile (to 2030)
Solid platform
from
achievements
Anticipated strategic projects permit to enhance growth
perspectives and maintain firing power to go for scenario
opportunities
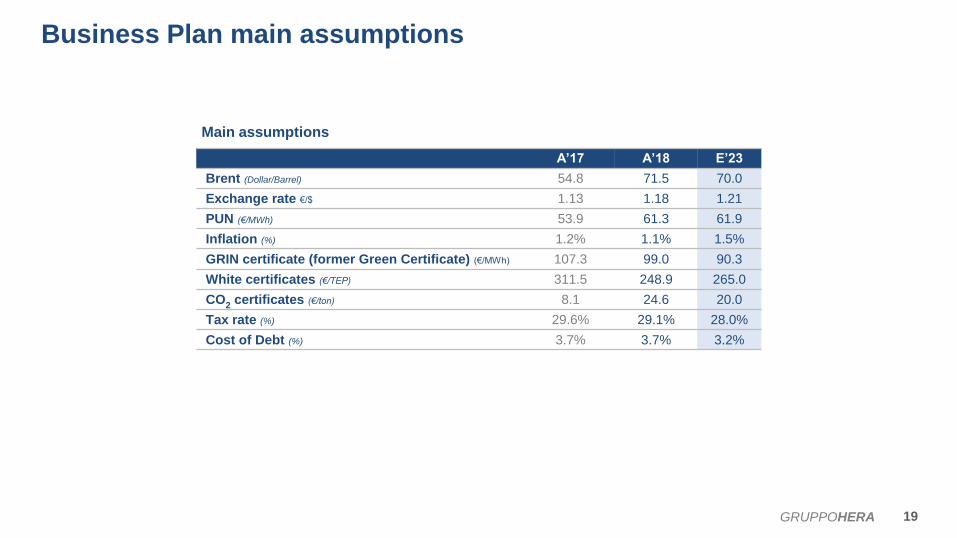
A’17 A’18 E’23
Brent (Dollar/Barrel) 54.8 71.5 70.0
Exchange rate €/$ 1.13 1.18 1.21
PUN (€/MWh) 53.9 61.3 61.9
Inflation (%) 1.2% 1.1% 1.5%
GRIN certificate (former Green Certificate) (€/MWh) 107.3 99.0 90.3
White certificates (€/TEP) 311.5 248.9 265.0
CO2
certificates (€/ton) 8.1 24.6 20.0
Tax rate (%) 29.6% 29.1% 28.0%
Cost of Debt (%) 3.7% 3.7% 3.2%
Business Plan main assumptions
Main assumptions
19GRUPPOHERA
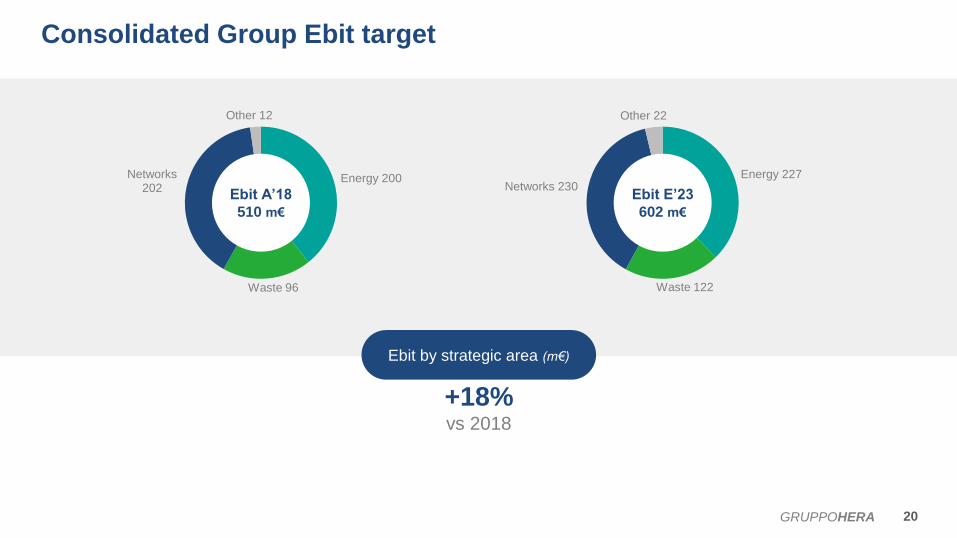
Energy 227
Waste 122
Networks 230
Other 22
Energy 200
Waste 96
Networks202
Other 12
Ebit A’18
510 m€
Ebit E’23
602 m€
Consolidated Group Ebit target
Ebit by strategic area (m€)
+18%vs 2018
20GRUPPOHERA
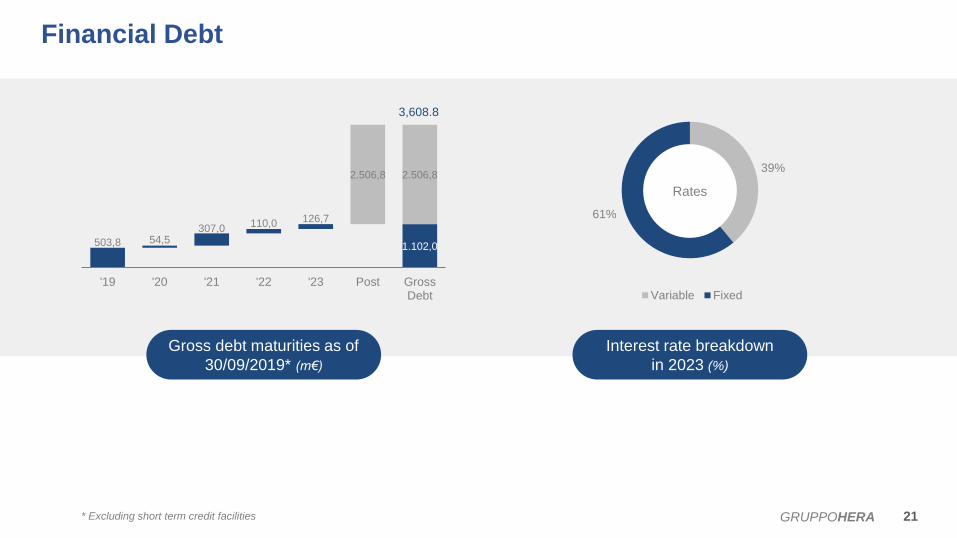
503,8 1.102,054,5
307,0110,0 126,7
2.506,8 2.506,8
'19 '20 '21 '22 '23 Post GrossDebt
39%
61%
Variable Fixed
Rates
3,608.8
* Excluding short term credit facilities
Financial Debt
Gross debt maturities as of
30/09/2019* (m€)
Interest rate breakdown
in 2023 (%)
21GRUPPOHERA
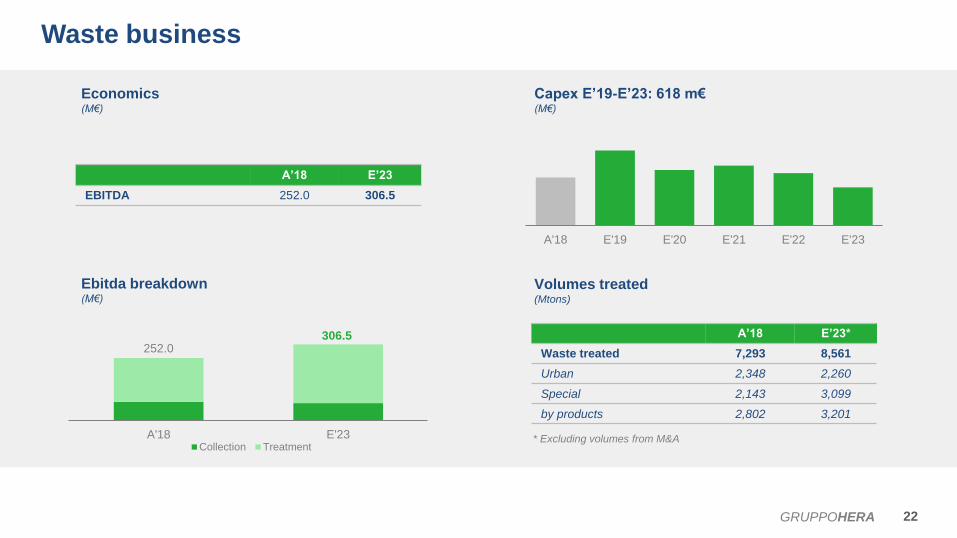
252.0306.5
A'18 E'23Collection Treatment
A’18 E’23
EBITDA 252.0 306.5
A'18 E'19 E'20 E'21 E'22 E'23
* Excluding volumes from M&A
A’18 E’23*
Waste treated 7,293 8,561
Urban 2,348 2,260
Special 2,143 3,099
by products 2,802 3,201
Waste business
Ebitda breakdown(M€)
Economics(M€)
Capex E’19-E’23: 618 m€(M€)
Volumes treated(Mtons)
22GRUPPOHERA
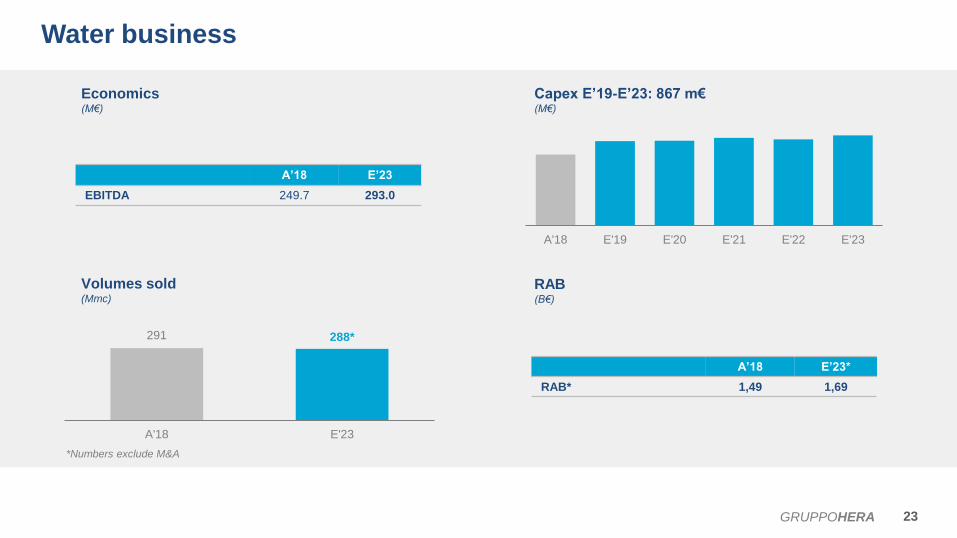
291 288*
A'18 E'23
*Numbers exclude M&A
A'18 E'19 E'20 E'21 E'22 E'23
A’18 E’23
EBITDA 249.7 293.0
A’18 E’23*
RAB* 1,49 1,69
Water business
Volumes sold(Mmc)
RAB(B€)
Economics(M€)
Capex E’19-E’23: 867 m€(M€)
23GRUPPOHERA
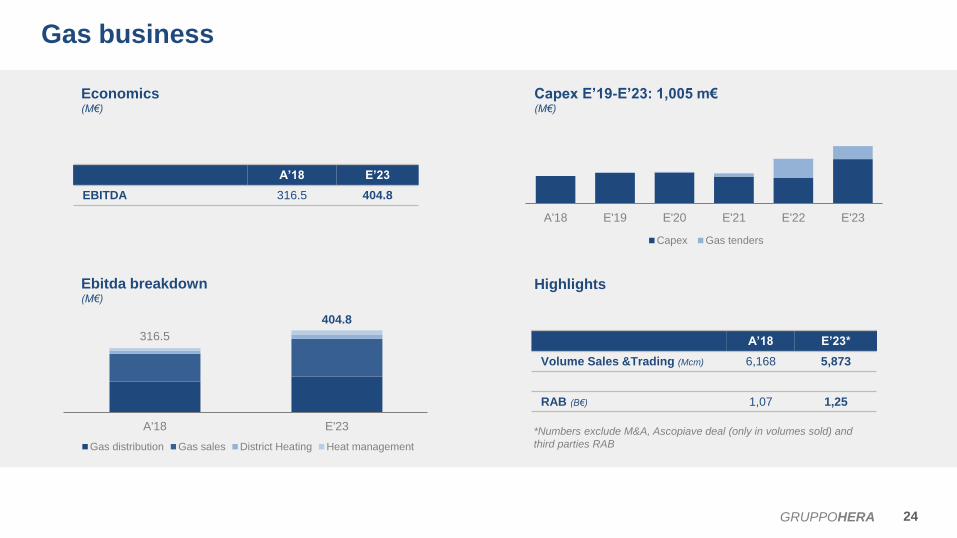
316.5
404.8
A'18 E'23
Gas distribution Gas sales District Heating Heat management
*Numbers exclude M&A, Ascopiave deal (only in volumes sold) and
third parties RAB
A’18 E’23*
Volume Sales &Trading (Mcm) 6,168 5,873
RAB (B€) 1,07 1,25
A'18 E'19 E'20 E'21 E'22 E'23
Capex Gas tenders
A’18 E’23
EBITDA 316.5 404.8
Gas business
HighlightsEbitda breakdown(M€)
Economics(M€)
Capex E’19-E’23: 1,005 m€(M€)
24GRUPPOHERA
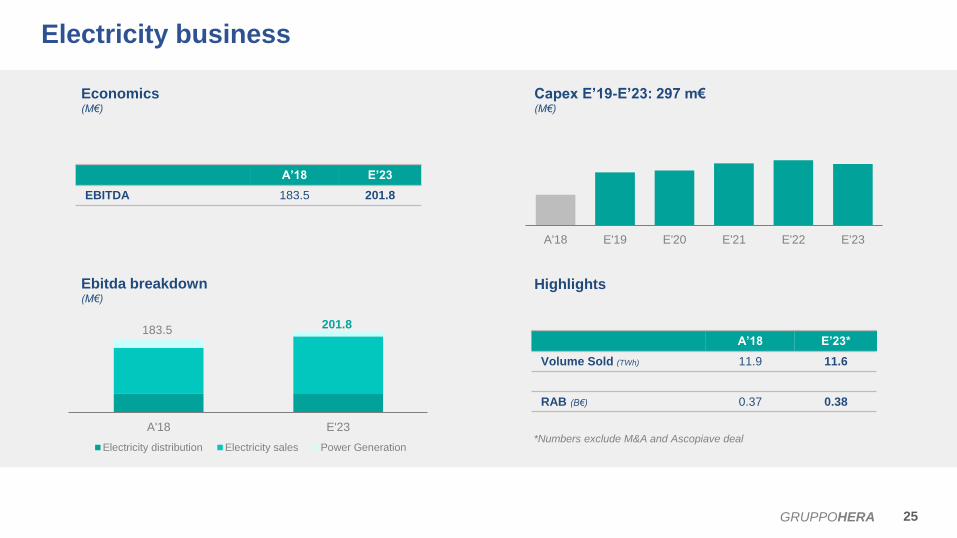
A’18 E’23*
Volume Sold (TWh) 11.9 11.6
RAB (B€) 0.37 0.38
183.5 201.8
A'18 E'23
Electricity distribution Electricity sales Power Generation*Numbers exclude M&A and Ascopiave deal
A’18 E’23
EBITDA 183.5 201.8
A'18 E'19 E'20 E'21 E'22 E'23
Electricity business
Economics(M€)
Capex E’19-E’23: 297 m€(M€)
HighlightsEbitda breakdown(M€)
25GRUPPOHERA
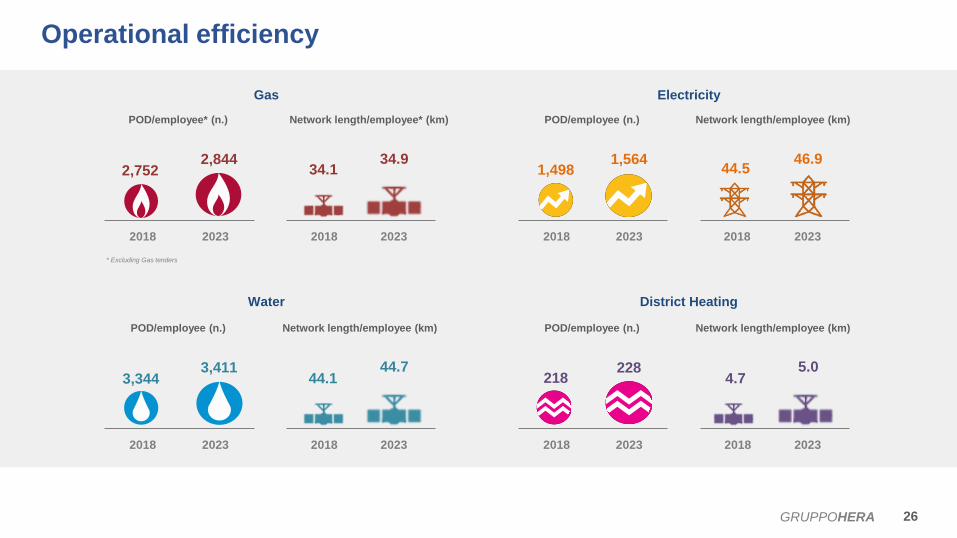
Operational efficiency
26GRUPPOHERA
POD/employee* (n.) Network length/employee* (km)
2018 2023
2,7522,844
2018 2023
34.134.9
* Excluding Gas tenders
POD/employee (n.) Network length/employee (km)
2018 2023
1,4981,564
2018 2023
44.546.9
POD/employee (n.) Network length/employee (km)
2018 2023
3,3443,411
2018 2023
44.144.7
POD/employee (n.) Network length/employee (km)
2018 2023 2018 2023
4.75.0
218228
Gas Electricity
District HeatingWater
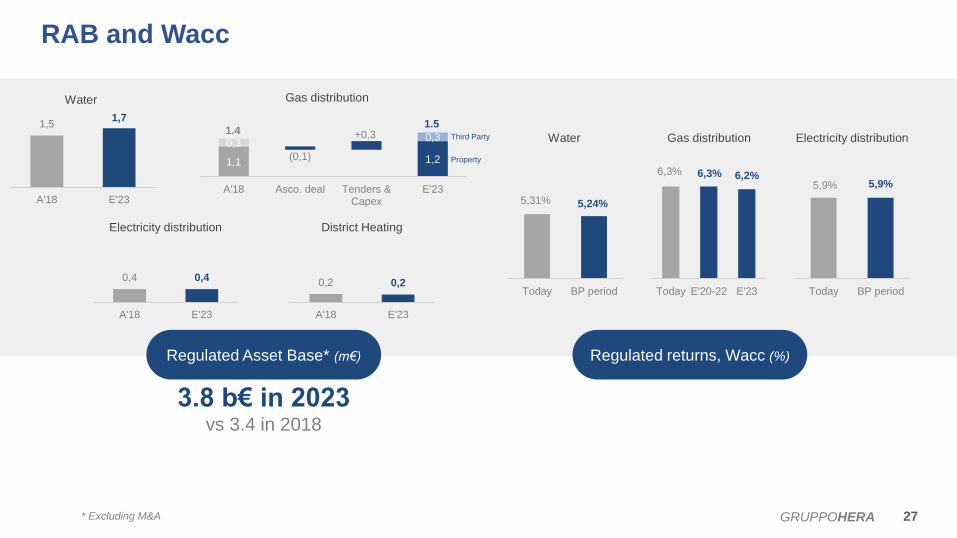
RAB and Wacc
Regulated Asset Base* (m€) Regulated returns, Wacc (%)
27GRUPPOHERA
1.4
1,1 1,2
0,3
(0,1)
+0,3 0,3
A'18 Asco. deal Tenders &Capex
E'23
Water Gas distribution
Electricity distribution
Property
Third Party
1,51,7
A'18 E'23
0,4 0,4
A'18 E'23
0,2 0,2
A'18 E'23
District Heating
3.8 b€ in 2023vs 3.4 in 2018
1.5
* Excluding M&A
5,9% 5,9%
Today BP period
5,31% 5,24%
Today BP period
6,3% 6,3% 6,2%
Today E'20-22 E'23
Water Gas distribution Electricity distribution
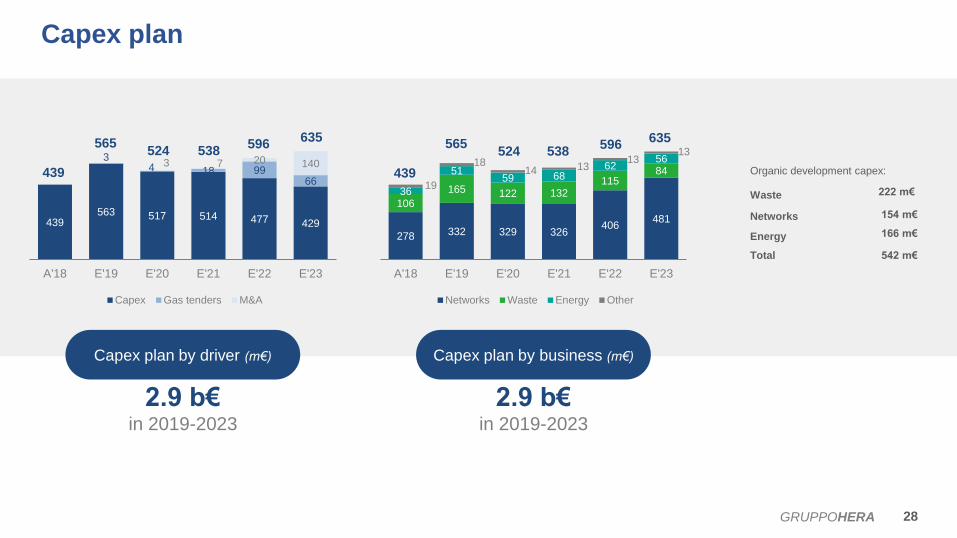
Capex plan
28GRUPPOHERA
Capex plan by driver (m€) Capex plan by business (m€)
2.9 b€in 2019-2023
439563 517 514 477 429
34 18 99
66
3 7 20 140
A'18 E'19 E'20 E'21 E'22 E'23
Capex Gas tenders M&A
439
565524 538
596635
278 332 329 326406
481
106
165 122 132115
84
36
5159 68
6256
19
1814 13
1313
A'18 E'19 E'20 E'21 E'22 E'23
Networks Waste Energy Other
439
565524 538
596635
2.9 b€in 2019-2023
Waste 222 m€
Organic development capex:
Networks
Energy
154 m€
166 m€
Total 542 m€
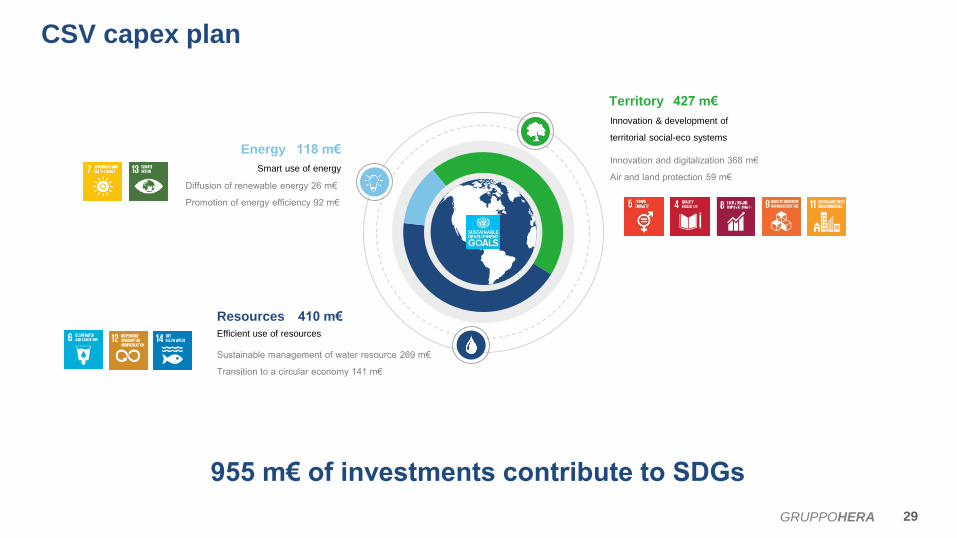
CSV capex plan
955 m€ of investments contribute to SDGs
Energy
Smart use of energy
Territory
Innovation & development of
territorial social-eco systems
Resources
Efficient use of resources
118 m€
427 m€
410 m€
Diffusion of renewable energy 26 m€
Promotion of energy efficiency 92 m€
Innovation and digitalization 368 m€
Air and land protection 59 m€
Sustainable management of water resource 269 m€
Transition to a circular economy 141 m€
29GRUPPOHERA
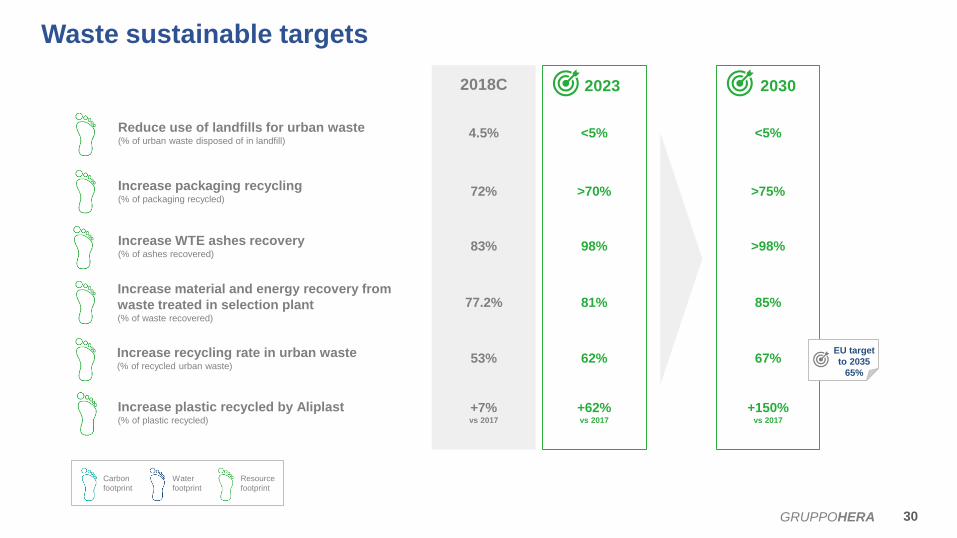
Waste sustainable targets
30GRUPPOHERA
2018C 2023 2030
Increase packaging recycling(% of packaging recycled)
72% >70% >75%
Increase WTE ashes recovery(% of ashes recovered)
83% 98% >98%
Increase material and energy recovery from
waste treated in selection plant(% of waste recovered)
77.2% 81% 85%
Increase plastic recycled by Aliplast (% of plastic recycled)
+7%vs 2017
+62%vs 2017
+150%vs 2017
Increase recycling rate in urban waste(% of recycled urban waste)
53% 62% 67%
Reduce use of landfills for urban waste(% of urban waste disposed of in landfill)
4.5% <5% <5%
EU target
to 2035
65%
Carbon
footprint
Water
footprint
Resource
footprint
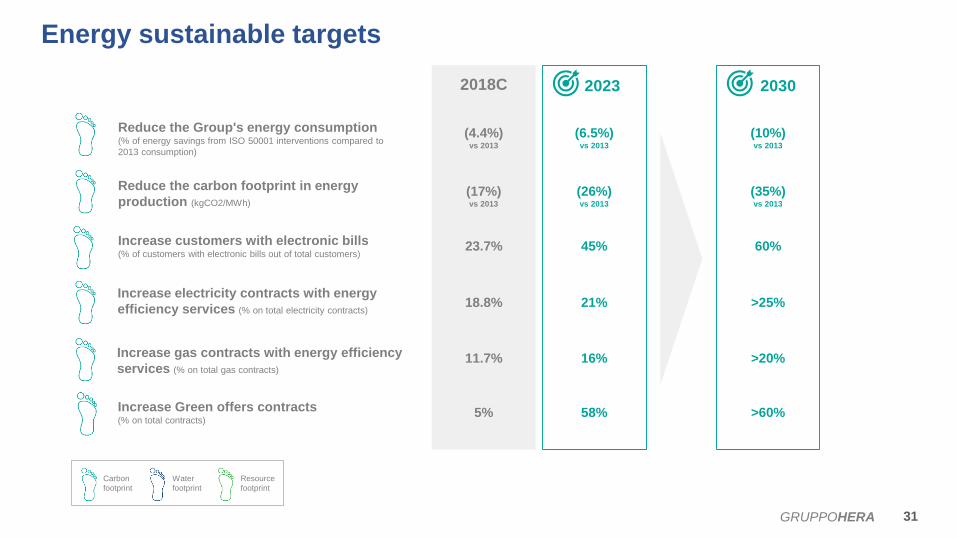
Energy sustainable targets
31GRUPPOHERA
2018C 2023 2030
Reduce the carbon footprint in energy
production (kgCO2/MWh)(17%)vs 2013
(26%)vs 2013
(35%)vs 2013
Increase customers with electronic bills(% of customers with electronic bills out of total customers)
23.7% 45% 60%
Increase electricity contracts with energy
efficiency services (% on total electricity contracts)18.8% 21% >25%
Increase Green offers contracts(% on total contracts)
5% 58% >60%
Increase gas contracts with energy efficiency
services (% on total gas contracts)11.7% 16% >20%
Reduce the Group's energy consumption(% of energy savings from ISO 50001 interventions compared to
2013 consumption)
(4.4%)vs 2013
(6.5%)vs 2013
(10%)vs 2013
Carbon
footprint
Water
footprint
Resource
footprint
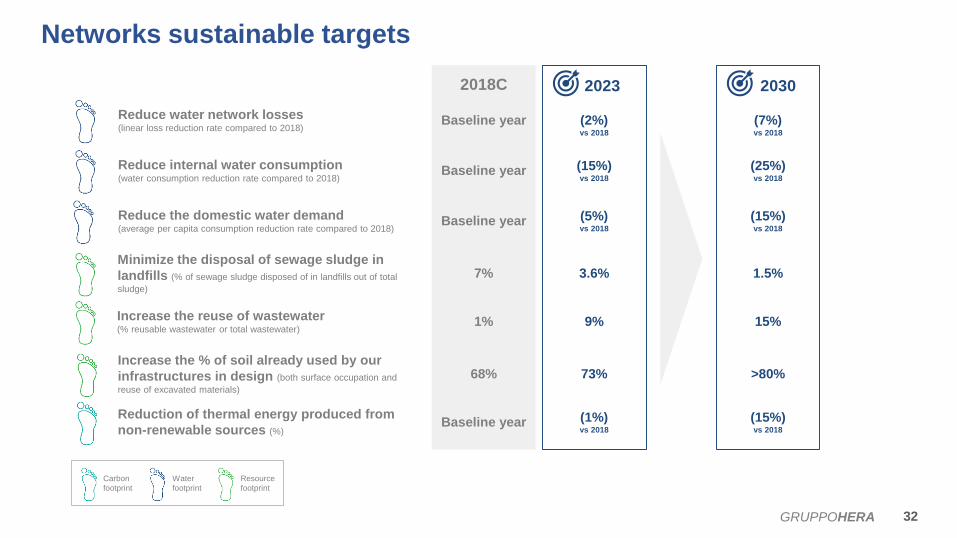
Networks sustainable targets
32GRUPPOHERA
2018C 2023 2030
Reduce internal water consumption(water consumption reduction rate compared to 2018)
Baseline year (15%)vs 2018
(25%)vs 2018
Reduce the domestic water demand(average per capita consumption reduction rate compared to 2018)
Baseline year (5%)vs 2018
(15%)vs 2018
Minimize the disposal of sewage sludge in
landfills (% of sewage sludge disposed of in landfills out of total
sludge)
7% 3.6% 1.5%
Increase the % of soil already used by our
infrastructures in design (both surface occupation and
reuse of excavated materials)
68% 73% >80%
Increase the reuse of wastewater (% reusable wastewater or total wastewater)
1% 9% 15%
Reduce water network losses (linear loss reduction rate compared to 2018)
Baseline year (2%)vs 2018
(7%)vs 2018
Carbon
footprint
Water
footprint
Resource
footprint
Reduction of thermal energy produced from
non-renewable sources (%)Baseline year (1%)
vs 2018
(15%)vs 2018
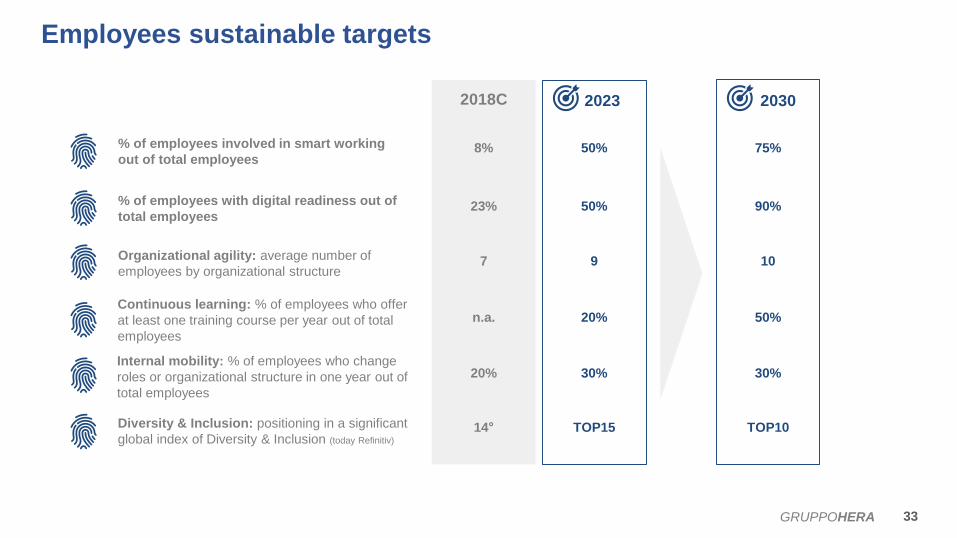
Employees sustainable targets
33GRUPPOHERA
2018C 2023 2030
% of employees with digital readiness out of
total employees23% 50% 90%
Organizational agility: average number of
employees by organizational structure7 9 10
Continuous learning: % of employees who offer
at least one training course per year out of total
employees
n.a. 20% 50%
Diversity & Inclusion: positioning in a significant
global index of Diversity & Inclusion (today Refinitiv)
14° TOP15 TOP10
Internal mobility: % of employees who change
roles or organizational structure in one year out of
total employees
20% 30% 30%
% of employees involved in smart working
out of total employees8% 50% 75%
This presentation contains forward-looking statements regarding future events (which impact the Hera Group’s future
results) that are based on current expectations, estimates and opinions of management.
These forward-looking statements are subject to risks, uncertainties and events that are unpredictable and depend on
circumstances that might change in future.
As a result, any expectation on Group results and estimates set out in this presentation may differ significantly depending
on changes in the unpredictable circumstances on which they are based.
Therefore, any forward-looking statement made by or on behalf of the Hera Group refer on the date they are made.
The Hera Group shall not undertake to update forward-looking statements to reflect any changes in the Group’s
expectations or in the events, conditions or circumstances on which any such statements are based.
Nevertheless, the Hera Group has a “profit warning policy”, in accordance with Italian laws, that shall notify the market
(under “price-sensitive” communication rules) regarding any “sensible change” that might occur in Group expectations on
future results.
Disclaimer
34GRUPPOHERA