Embed Size (px)
Citation preview

January, 1996
This sample business plan has been made available to users of Business Plan Pro™, business planning software published by Palo Alto Software. Our sample plans were developed by existing companies or new business start-ups as research instruments to determine market viability or funding availability. Names, locations and numbers may have been changed, and substantial portions of text may have been omitted to preserve confidentiality and proprietary information.
You are welcome to use this plan as a starting point to create your own, but you do not have permission to reproduce, publish, distribute or even copy this plan as it exists here.
Requests for reprints, academic use, and other dissemination of this sample plan should be addressed to the marketing department of Palo Alto Software.
Trinity Capital
business plan strategic development by Timothy J. Dineen-consultant-
Norcross, GeorgiaPhone: 770-935-0480 Fax: 770-935-1075
e-mail: [email protected]
Copyright Palo Alto Software, Inc., 1999-2000

Confidentiality Agreement
The undersigned reader acknowledges that the information provided by __________ in this business plan is confidential; therefore, reader agrees not to disclose it without the express written permission of __________.
It is acknowledged by reader that information to be furnished in this business plan is in all respects confidential in nature, other than information which is in the public domain through other means and that any disclosure or use of same by reader, may cause serious harm or damage to __________.
Upon request, this document is to be immediately returned to __________.
___________________ ___________________Signature Date
___________________Name (typed or printed)
This is a business plan. It does not imply an offering of securities.
1.0 Executive Summary . . . . . . . . . . . . . . . . . . . . . . . . . . . . . . . . . . . . . . . . . . . . . . . . 11.1 Objectives . . . . . . . . . . . . . . . . . . . . . . . . . . . . . . . . . . . . . . . . . . . . . . . . . . . 21.2 Mission . . . . . . . . . . . . . . . . . . . . . . . . . . . . . . . . . . . . . . . . . . . . . . . . . . . . . 31.3 Keys to Success . . . . . . . . . . . . . . . . . . . . . . . . . . . . . . . . . . . . . . . . . . . . . . . 3
2.0 Company Summary . . . . . . . . . . . . . . . . . . . . . . . . . . . . . . . . . . . . . . . . . . . . . . . . 32.1 Company Ownership . . . . . . . . . . . . . . . . . . . . . . . . . . . . . . . . . . . . . . . . . . . . 42.2 Start-up Summary . . . . . . . . . . . . . . . . . . . . . . . . . . . . . . . . . . . . . . . . . . . . . 42.3 Company Locations and Facilities . . . . . . . . . . . . . . . . . . . . . . . . . . . . . . . . . . . 4
3.0 Products . . . . . . . . . . . . . . . . . . . . . . . . . . . . . . . . . . . . . . . . . . . . . . . . . . . . . . . . 53.1 Sourcing - Product Costs . . . . . . . . . . . . . . . . . . . . . . . . . . . . . . . . . . . . . . . . . 6
4.0 Market Analysis Summary . . . . . . . . . . . . . . . . . . . . . . . . . . . . . . . . . . . . . . . . . . . 74.1 Market Segmentation . . . . . . . . . . . . . . . . . . . . . . . . . . . . . . . . . . . . . . . . . . . 74.2 Target Market Segment Strategy . . . . . . . . . . . . . . . . . . . . . . . . . . . . . . . . . . . 8
4.2.1 Market Segment Analysis . . . . . . . . . . . . . . . . . . . . . . . . . . . . . . . . . . . 84.3 Industry Analysis . . . . . . . . . . . . . . . . . . . . . . . . . . . . . . . . . . . . . . . . . . . . . . 9
4.3.1 Industry Participants . . . . . . . . . . . . . . . . . . . . . . . . . . . . . . . . . . . . . . 104.3.2 Distribution Patterns . . . . . . . . . . . . . . . . . . . . . . . . . . . . . . . . . . . . . . . 104.3.3 Competition and Buying Patterns . . . . . . . . . . . . . . . . . . . . . . . . . . . . . . 104.3.4 Main Competitors . . . . . . . . . . . . . . . . . . . . . . . . . . . . . . . . . . . . . . . . . 11
5.0 Strategy and Implementation Summary . . . . . . . . . . . . . . . . . . . . . . . . . . . . . . . . 115.1 Marketing Strategy . . . . . . . . . . . . . . . . . . . . . . . . . . . . . . . . . . . . . . . . . . . . . 12
5.1.1 Positioning Statements . . . . . . . . . . . . . . . . . . . . . . . . . . . . . . . . . . . . . 125.1.2 Pricing Strategy . . . . . . . . . . . . . . . . . . . . . . . . . . . . . . . . . . . . . . . . . . 125.1.3 Promotion Strategy . . . . . . . . . . . . . . . . . . . . . . . . . . . . . . . . . . . . . . . 135.1.4 Distribution Strategy . . . . . . . . . . . . . . . . . . . . . . . . . . . . . . . . . . . . . . 13
5.2 Sales Strategy . . . . . . . . . . . . . . . . . . . . . . . . . . . . . . . . . . . . . . . . . . . . . . . . 135.2.1 Sales Forecast . . . . . . . . . . . . . . . . . . . . . . . . . . . . . . . . . . . . . . . . . . . 14
5.3 Milestones . . . . . . . . . . . . . . . . . . . . . . . . . . . . . . . . . . . . . . . . . . . . . . . . . . . 14
6.0 Management Summary . . . . . . . . . . . . . . . . . . . . . . . . . . . . . . . . . . . . . . . . . . . . . 156.1 Management Team . . . . . . . . . . . . . . . . . . . . . . . . . . . . . . . . . . . . . . . . . . . . . 156.2 Management Team Gaps . . . . . . . . . . . . . . . . . . . . . . . . . . . . . . . . . . . . . . . . . 156.3 Personnel Plan . . . . . . . . . . . . . . . . . . . . . . . . . . . . . . . . . . . . . . . . . . . . . . . . 15
7.0 Financial Plan . . . . . . . . . . . . . . . . . . . . . . . . . . . . . . . . . . . . . . . . . . . . . . . . . . . . 167.1 Important Assumptions . . . . . . . . . . . . . . . . . . . . . . . . . . . . . . . . . . . . . . . . . . 177.2 Key Financial Indicators . . . . . . . . . . . . . . . . . . . . . . . . . . . . . . . . . . . . . . . . . 187.3 Break-even Analysis . . . . . . . . . . . . . . . . . . . . . . . . . . . . . . . . . . . . . . . . . . . . 197.4 Projected Profit and Loss . . . . . . . . . . . . . . . . . . . . . . . . . . . . . . . . . . . . . . . . . 217.5 Projected Cash Flow . . . . . . . . . . . . . . . . . . . . . . . . . . . . . . . . . . . . . . . . . . . . 227.6 Projected Balance Sheet . . . . . . . . . . . . . . . . . . . . . . . . . . . . . . . . . . . . . . . . . 247.7 Business Ratios . . . . . . . . . . . . . . . . . . . . . . . . . . . . . . . . . . . . . . . . . . . . . . . 24
Table of Contents

1.0 Executive Summary
Professional Athletic Equipment, Inc. will manufacture and market a protective device for young athletes. The trade name "Body Armor" will serve as brand name and identity name for the product. The product is intended to help prevent injury from blunt trauma to the chest, side, and abdomen. The device may also help prevent sudden death from commotio cordis (heart stoppage due to external trauma). This injury occurs primarily in baseball but can also occur in soccer and other sports. A United States patent on the device is in the application process and is pending.
This business plan is part of our regular business planning process. We revise this plan semi-annually.
In the next full year we intend to produce and market initial product. No sales have occurred to date.
We are projecting sales of 750 units per month on average in year one of marketing, calendar year 1997. This will place sales volume at $242,550 for the year. Management predicts sales exceeding $4 million and profitability in year three. Year three profits are expected to be $593,570 before taxes.
Our keys to success and critical factors for the next year are, in order of importance: • Initial product production on first three sizes. • Test marketing and basic research to determine product acceptance. • Test marketing of multi-channel distribution. • Test marketing of media, PR, pricing, and product endorsement plans. • Goal of recouping production start-up costs and first year depreciation on initial three
molds in year one.
And after that: • Limiting loss in year two to less than $200K. • Reaching limited retail distribution in year three (2nd sales year). • Attaining profitable operations in year three.
Professional Athletic Equipment, Inc.
Page 1

($500,000)
$0
$500,000
$1,000,000
$1,500,000
$2,000,000
$2,500,000
$3,000,000
$3,500,000
$4,000,000
$4,500,000
1996 1997 1998
Sales
Gross Margin
Net Profit
Highlights (Planned)
1.1 Objectives
Professional Athletic Equipment, Inc. has set a modest goal for year one sales (1997). These targeted minimums when achieved will bring us close to over-all break-even for year one and will provide a platform for limited business expansion in year two (1998).
The sales targets by size are: • Small--4500 units • Medium--2250 units • Large--2250 units
Attaining these targets will result in year one sales volume of $242,550 and will confirm a successful test.
Costs will be controlled to maintain projected margins at these modest sales levels. If sales exceed these goals additional production and stepped-up marketing activity can be implemented quickly, although additional capital will be required on short notice in order to fully implement growth. On the safe side, some sales may be missed in order to gear up for year two.
Professional Athletic Equipment, Inc.
Page 2

1.2 Mission
Professional Athletic Equipment, Inc. is a manufacturing and marketing company dedicated to protecting young athletes from tragic injury and death. We intend to make quality, tested products and to make sufficient profit to generate a fair return for our investors. Our initial product, the "Body Armor", will be sold via targeted direct marketing to consumers, who are the parents of youth baseball participants. The "Body Armor" is intended both to help prevent injury and to improve athletic performance via its confidence enhancing attributes among youthful sports participants. The "Body Armor" seeks to foster the enjoyment of sports by young people. We intend to grow the business and to establish our brand as a product leader and innovator in its specialty niche. We intend to finance continued growth both internally and externally and to develop and acquire new and additional products once our marketing platform is established. We will conduct our business in accordance with Christian values and strive to maintain a friendly, fair and creative work environment which respects ideas, hard work, and the dignity and worth of the individual.
1.3 Keys to Success
The keys to success for Professional Athletic Equipment, Inc. are: • Product Quality. New molds must be made and new production commenced. Suppliers
of all components must be found and initial orders placed. Timely delivery and assembly must be maintained with re-work and waste held to a minimum.
• Marketing. Once quality product is available, the success of Professional Athletic Equipment, Inc. rests wholly in the marketing venue. The "Body Armor" is a new product and consumers must be educated as to its availability and purpose. Most critical to success is the control of media costs to generate sales.
• Management. While there is a temptation to grow a business exponentially, it is critical that Professional Athletic Equipment, Inc. management concentrate first on proving product salability within certain price points, margin requirements, distribution channels, and establish consumer acceptance. Once these answers are found, then controlled expansion (which requires increased production and investment in inventory) can be executed with confidence.
2.0 Company Summary
Professional Athletic Equipment, Inc. is a privately held Georgia Corporation founded by Dr. Jim Smith of Anytown. Dr. Smith is the inventor and designer of "Body Armor." Prototypes have been produced, used, and tested. This business plan will serve as the framework for bringing the product to market. All development costs to date have been born by Dr. Smith personally. At this point Dr. Smith owns 100% of the common stock of Professional Athletic Equipment, Inc. It is his intention to invest further in this expansion plan as well as to open limited initial investment via private placement. At this point the company can offer no assurances of the marketability of its product, or that sufficient capital can be raised to execute its business plan.
Professional Athletic Equipment, Inc.
Page 3

2.1 Company Ownership
Dr. Jim Smith of Anytown, Ga. currently owns 100% of the common stock of Professional Athletic Equipment, Inc. It is his intention to sell limited ownership to outside private investors in the first round of external financing. With success of initial business plan executions, additional capital will be required. Further offerings to both individuals and institutions are planned. Initial investors will be granted participation rights in any future offerings the company undertakes on a right-of-first-refusal basis.
It is expected that stock option plans totaling no more than 15% of equity will be made available to key company management personnel.
2.2 Start-up Summary
The start-up costs for Professional Athletic Equipment, Inc. are $250,000 minimum to $500,000 maximum. All start-up assumptions are based on an actual infusion of $250,000 in new capital. These funds will be utilized to procure molds and raw materials to fund production of initial inventory by our contract manufacturer, ABC Plastics. Cash outlay for capital equipment will be $65,000. Investment in initial inventory will be $25,437. In addition, initial marketing costs, and overhead, including G & A is included.
If $500,000 in new capital is secured from the initial offering the overage will be allocated to cash surplus and will serve to make funds available to accelerate marketing plans with no delay to secure funding. This acceleration and use of funds will be reflected in the first six-month revision of this business plan.
Professional Athletic Equipment, Inc. management intends to raise the initial capital with a private offering of cumulative convertible preferred stock. The conversion would be at 3 shares of common to one share of preferred and would be exercised at the end of year two. The interest would be accumulated at 8% per annum but not paid until time of conversion. For the purpose of all charts and graphs included in this plan the interest is not treated as paid on a monthly basis, but will in fact be held in reserve. Management reserves the right to utilize such reserve funds as operating capital if necessary. Repayment of principal and interest is treated as a line item paid of $290,000 in 1998. If interest cannot be repaid at the end of the two year term, preferred stock holders will have liquidation preference. Or preferred stockholders may exercise, at their option, to forgive payment of interest in return for upgrading to a 4 to 1 conversion ratio. It is expected that all issued convertible preferred shares will be retired by the end of year two of operations.
2.3 Company Locations and Facilities
A company office is presently maintained by Dr. Smith at 1234 Main Street, Anytown, Ga. 30000. Subsequent to funding the office may be relocated to the Atlanta market area. Available office space has been located in Atlanta. This office space is small and may be secured at nominal cost. As needs dictate office and/or distribution facilities will be expanded. Initially, the small office will serve to manage marketing functions and sales/order processing.
Distribution will initially be handled by the contract manufacturer. Orders will be drop shipped directly from the plant. This precludes the need to invest in distribution space at the outset. ABC Plastics is located in Anyplace, Ga. between Anytown and Somewhere, off of Interstate Route 123 The plant has been visited by Professional Athletic Equipment, Inc. management and has substantial capacity both for production and warehousing of inventory. Preliminary
Professional Athletic Equipment, Inc.
Page 4

terms for production, material and assembly costs and capital expenditures for molds are used as the cost basis in this plan. Shipping and handling expense will be billed to the customer.
3.0 Products
Professional Athletic Equipment, Inc. is in the business of providing protection against both serious and minor injury among youthful sports participants. Such injuries may include painful bruises, broken ribs, spleen and kidney injuries, and more. The primary function of the "Body Armor" is to improve performance and confidence. The product may also serve to protect its wearer from the more severe outcomes resulting from commotio cordis. Death caused by a ball hitting the chest is a serious problem in youth baseball and softball. The U.S. Consumer Product Safety Commission has documented 38 such deaths since 1973. In all but two cases, the autopsies revealed no pre-existing heart defects of any kind. Of further concern is the fact that response to resuscitation efforts is poor. CPR is of little use when heart stoppage occurs. The injury produced by blunt external trauma is a functional rather than a structural injury. The trauma of impact produces a variety of cardiac electrical abnormalities, including repeatable arrhythmias and traumatic apnea.
The danger to young athletic participants is particularly high since almost all the energy of impact is transferred to the chest because ball rebound after impact is minimal. In a child the layer of soft tissue in the chest wall is thinner than in an adult and yields more readily than does a baseball.
Two areas of possible prevention have been researched extensively in the past: 1. Using balls with softer cores. 2. Various means of padded chest protection.
Changing the compression or size of the ball seems less pragmatic since chest impact from other sports projectiles such as softballs and lacrosse balls also can cause sudden death. In addition, a study of baseballs with softer cores suggests they have little protective effect and may, in some cases, actually increase the impact to the chest.
However, the limited protective padding worn by hockey players seems to offer some protection. Although hockey players routinely receive chest blows, and the hockey puck travels at high speed and is harder than a baseball, relatively few players have suffered commotio cordis.
Chest protection has not met with acceptance to date. The key issues are the high cost of outfitting teams with a protective product and whether or not the wearing of such a product will hinder athletic performance and/or mobility.
Dr. Smith has designed a product that can be produced at low cost, that is lightweight, that has performed in independent university tests as well as anything commercially available in energy absorption capability, and has been worn in competition for more than a year by his own son and other players competing in youth baseball in Anytown, Georgia. The players themselves report that their performance is not hindered in any way. They contend that performance is actually improved due to the mental confidence they experience from wearing the "Body Armor." The fear of painful injury is reduced and hence the boys perform with fundamentally sound baseball mechanics and with more confidence.
The management of Professional Athletic Equipment, Inc. feels that the "Body Armor" can be successfully marketed.
Professional Athletic Equipment, Inc.
Page 5

3.1 Sourcing - Product Costs
Product production costs have been estimated with the help of ABC Plastics of Anytown, Georgia.
Fixed, depreciable costs are for molds for each size and other equipment. Lead time for molds is 18 weeks. Lead time for equipment to affix and shape the foam on the molded plastic part is 10 weeks.
• small mold-- $15,000 • medium mold--$17,000 • large mold-- $20,000 • foam equip-- $ 9,500 • glue equip-- $2,000 • rivet gun, misc--$1,500
Total Capital Equipment= $65,000
5 yr. straight line depreciation= $13,000 per year or $1,083 per month
Variable costs are as follows:
Molded part: • small--$1.35 • med-- $1.45 • large--$1.55
Foam back (cut to size with holes): • small--$3.75 • med-- $4.00 • large-- $4.25
Glue--.02 per part
Labor cost per assembly--$1.07
Rivets, velcro and loops (est.): • small--$1.48 • med-- $1.48 • large-- $1.48
Thus, over all unit variable production cost is: • small--$7.67 • med-- $8.02 • large-- $8.37
At 50% small sales, 25% medium sales, and 25% large sales ave. weighted unit cost is $7.94.
Production rate for assembly is 75 units/hour.
Professional Athletic Equipment, Inc.
Page 6

4.0 Market Analysis Summary
The sporting goods market as whole and the market for baseball equipment are multi-billion and multi-million dollar markets respectively. The "Body Armor" represents a new sub catagory in the baseball products market. Currently, there are no competitive entries in this segment. The only other chest protectors are worn by catchers. We define our user as any batter and/or position player. The product is to be worn at all times beneath the uniform. The buyer is defined as the parent(s). The targeted consumer is the Mom, whom management feels will be more receptive to the safety/protection message.
Complete industry specific data on markets, sub-markets, categories, trends and demographics are available in trade industry reports. These reports are available for fees and with membership in trade organizations. The two most important industry trade groups are the Sporting Goods Manufacturers Association located in N. Palm Beach, Fla. and the National Sporting Goods Association located in Mount Prospect, Ill. The leading trade industry publication is Sporting Goods Business.
For the purpose of the test market, statistical market studies would not be valid. Our purpose is to prove salability. Market share numbers will be minute. With successful test marketing, Professional Athletic Equipment, Inc. will join these above named industry groups and utilize their data and research to project roll-out and expansion numbers.
4.1 Market Segmentation
As indicated, the product segment sought by Professional Athletic Equipment, Inc. is a new one. It can best be defined by the demographic of its targeted customer. Since we seek to serve youth baseball as the only commercially available permanent chest protection for position players the potential market size can be defined by its universe of participants.
In the latest survey of sports participation for boys ages 6 to 17 taken in 1994, 8.6 million participants played baseball. This compares to 14.6 million for basketball and 8.1 million for football. Little League Baseball headquartered in Williamsport, Pa. is the largest youth sports organization in the world with 2.9 million participants on 193,000 teams in 91 countries around the world. Additionally other local leagues sponsored by parks and recreation departments and other regional leagues and associations such as Dixie Baseball, Inc. and Youth Baseball Athletic League (YBAL) have many millions more participants.
With such a large potential market available, Professional Athletic Equipment, Inc. management is confident of the ability to sell products in the conservative numbers estimated by first year production availability.
Professional Athletic Equipment, Inc.
Page 7

4.2 Target Market Segment Strategy
By focusing our efforts on the parent(s) of youth baseball participants (primarily Moms), we can cost effectively (and editorially) convey our safety and protection message.
Certain media have already been discovered through research. The following print media and specialty publications have been identified:
1. Baseball Parent Magazine. 2. Sport Scene Magazine, published by the Consumer North American Youth Sports
Institute. 3. Safety and Health, published by the National Safety Council.
In addition, there are Web sites and newsgroups that management has uncovered. Such as: rec.sport.baseball and alt.sports.baseball which can provide targeted e-mail opportunities. Two separate software programs have been identified: One that targets newsgroups for bulk e-mail, and another than conducts "on-line surveys" from identified groups. Both will be utilized in Professional Athletic Equipment, Inc.'s marketing efforts.
We have located Web sites and links to equipment purchase locations and on-line sporting goods malls as well as a flow of targeted customers. These include:
1. John Skilton's baseball links (more than 50 links). 2. Society for American Baseball Research. 3. Baseball on the Net (mailing lists, newsgroups, commercial products, research).
A company in California called Focalink can provide World Wide Web advertising services with feedback and measured response.
While business on the Web is still in its infancy, the value as a marketing tool cannot be discounted and actual sales are expected to increase exponentially in the next three years.
The magazines and publications will offer exposure for education via PR and articles as well as a means to target media effectiveness in small numbers. The premise is: If you advertise to a highly selected target audience you prove salability and price point acceptance. Then you seek to extrapolate the results via broader based media.
4.2.1 Market Segment Analysis
Our market analysis is defined by potential users. Which media to utilize to cost effectively reach these users is the critical decision path. The universe of potential customers exceeds 8 million users. It is projected to grow only moderately each year. Although old customers will be replaced by new ones as they pass through the age demographic, it is impossible to estimate erosion from re-sale or re-use at this point. Management recognizes that a market exists for used sporting goods equipment.
The Market Analysis table, and the Potential Market pie chart illustrates our key customer segments. The "other" catagory is defined as a specific direct sales test with two leagues--one in Anytown and one in Anywhere.
We will concentrate heavily on the local, or Georgia market segment with direct marketing efforts. Any efforts in other market areas will be accomplished only by overlapping media that does not incur incremental cost. Examples are on-line marketing or infomercials run by design in other spot markets.
Professional Athletic Equipment, Inc.
Page 8

Little League
All Other Leagues
Georgia residents
Other
Market Analysis (Pie)
Table: Market Analysis
Market AnalysisPotential Customers Growth 1996 1997 1998 1999 2000 CAGRLittle League 3% 2,700,000 2,781,000 2,864,430 2,950,363 3,038,874 3.00%All Other Leagues 3% 5,500,000 5,665,000 5,834,950 6,009,999 6,190,299 3.00%Georgia residents 8% 400,000 432,000 466,560 503,885 544,196 8.00%Other 0% 5,000 5,000 5,000 5,000 5,000 0.00%Total 3.25% 8,605,000 8,883,000 9,170,940 9,469,247 9,778,369 3.25%
4.3 Industry Analysis
The sporting goods industry as a whole remains healthy with annual growth between 5% and 10% Older sports, such as baseball, are experiencing flat to moderate growth when compared to other segments. The fastest growing sport is in-line skating. However, the over-all size of the baseball market and its volume of participants indicates to management that it could be receptive to a new product entry, particularly one that offers such an important potential benefit. It is not expected that major economic turns would have substantial effect on this market although they could effect discretionary spending for peripheral items. The "Body Armor" could suffer although it is expected sales slippage would occur in low-to-middle income groups. Higher income groups should remain the strongest base for sales.
Professional Athletic Equipment, Inc.
Page 9

4.3.1 Industry Participants
Major manufacturers and marketers of baseball equipment include Rawlings, Wilson, Mizuno, and others. Professional Athletic Equipment, Inc. management feels that these major players in the industry will not take significant notice of the sales and marketing activities of Professional Athletic Equipment, Inc. until such time as Professional Athletic Equipment, Inc. sales reach $10 to $20 million. That sales level marks the point at which a business is considered substantial enough for either competitive activity or acquisition. It is expected that Professional Athletic Equipment, Inc. will have a defendable patent position in its product but that cannot be assured at this time.
4.3.2 Distribution Patterns
By far the dominate distribution channel for all sporting goods is retail, predominantly mass merchants and sporting goods super-stores. The barriers to entry into these channels are substantial, including media and marketing budgets, ability to supply product, "rent" for shelf space, and co-operative media and promotion budgets. Professional Athletic Equipment, Inc. will not have the capability to undertake the costs involved to go directly into retail stores. In addition, retail margins absorb 40% to 50% of sales price. Wholesale margins to the manufacturer are cut vs. other sales channels. Only volume sales can achieve desired returns to the manufacturer. Thus, retail sales will not be targeted by Professional Athletic Equipment, Inc. until year three of the plan with the possible exception of a limited test of a "truckload sale" concept.
We will pursue a "Multi-Channel Distribution" strategy of direct sales via differing media segments. These media segments will include targeted direct marketing via print, catalogue, TV shopping, on-line shopping malls, and possibly infomercial.
The measure of success in each of these channels will be the control of media cost vs. sales results.
4.3.3 Competition and Buying Patterns
The single most important factor in our product is the bandwagon. The concept of "Critical Mass" is what Professional Athletic Equipment, Inc. must overcome. The rich get richer, and the poor poorer. However, there is still room for new products and new companies outside the main design types.
• In the main design types, market share generates more market share. Rawlings chest
protectors for catchers, for example, may not be the best, but it is the market leader. More people know it better than any other brand. Most important, the retailers feature it. So it continues to dominate. Despite the existence of better products, it is the wisest choice for the buyer.
• Buyers want brand names. Quality of products is hard to measure. Brand names assure quality. However, brand names only operate in mainstream product types; there is room for smaller names with specific solutions that appeal to buyers.
• Buyers are willing to pay high prices for solutions that work. While competitors chip away at market leaders for lower prices, the leaders continue to command high prices.
• Channels discount heavily. Brand name, packaged goods become a commodity and are bought on price. Buyers will pay a heavy premium for Mizuno glove over a lesser-known knockoff, but they happily pay $25 in a discount store instead of $50 at a full-
Professional Athletic Equipment, Inc.
Page 10

price retail store. • There is no consensus about product copying. Estimates of its revenue impact vary
from 10% to 60% of the theoretical revenue manufacturers would receive if copying were impossible. Illegal product copying is a fact of life that manufacturers live with because they have no other choice. There is evidence, however, that wholesale copying of Big Bertha Drivers and King Cobra irons helped those products build their market share leads, which became their key strengths.
• Impulse buying goes on with products below $100. Buyers have discovered products like stomach exercisers and kitchen tools that were low priced and extremely useful. There is more freedom in the lower end of the market.
• Distribution channels are clogged. Lack of channels are a serious barrier to industry growth. Wal-mart and Sports Authority stores are insufficient for the wealth of products available, and the constant flood of new products.
• Support becomes a serious factor at higher price levels. Companies that charge hundreds of dollars for widgets are expected to answer user questions. Those that don't will suffer from bad reviews and poor word of mouth. However, neither Wilson nor Rawlings have had reputations for good support, and both are successful. Our product catagory will not require extensive support other than a product manual and a return/exchange procedure for defective merchandise.
4.3.4 Main Competitors
There are none in our specific product catagory.
5.0 Strategy and Implementation Summary
Our strategy is based on serving niche markets well. The world is full of small and medium-sized businesses that provide good products and services apart from the major vendors who focus on high-volume orders only.
Also: • What begins as a customized version of a standard product, tailored to the needs of a
local customer, can eventually become a niche product that will fit the needs of similar customers across the country. Our test market will be local, Anytown primarily. Although certain media selections (on-line in particular) are broader in geographical scope.
• We are building our marketing infrastructure so that we can eventually reach specific kinds of customers across broad geographic lines.
• We focus on satisfying the needs of small boys aged 6-16. • We focus on follow-on technology that we can take to the masses, not leading edge
technology that aims at the experts and volume leaders.
Professional Athletic Equipment, Inc.
Page 11
5.1 Marketing Strategy
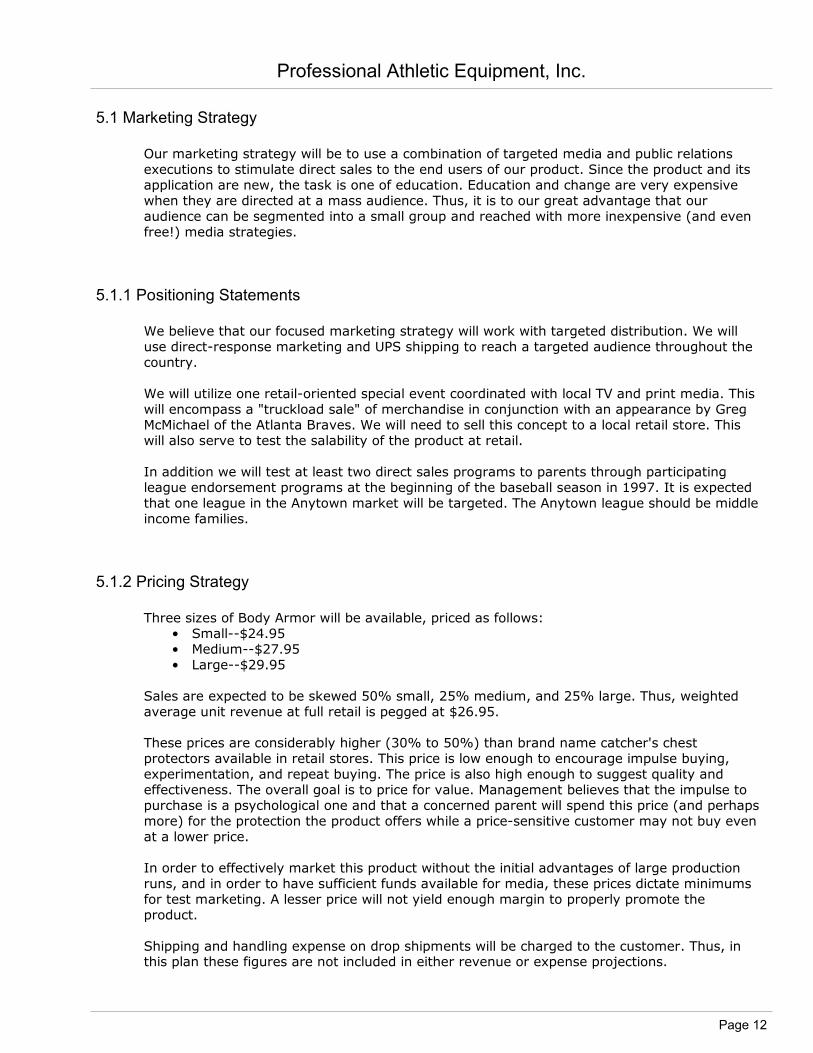
Our marketing strategy will be to use a combination of targeted media and public relations executions to stimulate direct sales to the end users of our product. Since the product and its application are new, the task is one of education. Education and change are very expensive when they are directed at a mass audience. Thus, it is to our great advantage that our audience can be segmented into a small group and reached with more inexpensive (and even free!) media strategies.
5.1.1 Positioning Statements
We believe that our focused marketing strategy will work with targeted distribution. We will use direct-response marketing and UPS shipping to reach a targeted audience throughout the country.
We will utilize one retail-oriented special event coordinated with local TV and print media. This will encompass a "truckload sale" of merchandise in conjunction with an appearance by Greg McMichael of the Atlanta Braves. We will need to sell this concept to a local retail store. This will also serve to test the salability of the product at retail.
In addition we will test at least two direct sales programs to parents through participating league endorsement programs at the beginning of the baseball season in 1997. It is expected that one league in the Anytown market will be targeted. The Anytown league should be middle income families.
5.1.2 Pricing Strategy
Three sizes of Body Armor will be available, priced as follows: • Small--$24.95 • Medium--$27.95 • Large--$29.95
Sales are expected to be skewed 50% small, 25% medium, and 25% large. Thus, weighted average unit revenue at full retail is pegged at $26.95.
These prices are considerably higher (30% to 50%) than brand name catcher's chest protectors available in retail stores. This price is low enough to encourage impulse buying, experimentation, and repeat buying. The price is also high enough to suggest quality and effectiveness. The overall goal is to price for value. Management believes that the impulse to purchase is a psychological one and that a concerned parent will spend this price (and perhaps more) for the protection the product offers while a price-sensitive customer may not buy even at a lower price.
In order to effectively market this product without the initial advantages of large production runs, and in order to have sufficient funds available for media, these prices dictate minimums for test marketing. A lesser price will not yield enough margin to properly promote the product.
Shipping and handling expense on drop shipments will be charged to the customer. Thus, in this plan these figures are not included in either revenue or expense projections.
Professional Athletic Equipment, Inc.
Page 12

5.1.3 Promotion Strategy
The long-range goal is enough visibility to leverage the product line into other more expensive media with more reach and into other regions and generate interest for evolution into retail channels. To do that:
• Public relations services at $3,000 per month for the next year are intended to generate awareness of editors and product information insertions, reviews, etc. This is maintained for year one and two.
• Advertising at $5,000 per month concentrating on special interest magazines. We will experiment with general-interest parenting magazines, keeping careful track of results. Advertising will either move product through, enabling more production and additional sales, or will be cut back after four months at this level. Year two of sales reflects sales penetration into retail channels and advertising is projected at $800,000 or 20% of projected sales.
• Trade shows: None until year two.
5.1.4 Distribution Strategy
We need to establish a corporate identity, logo, design of brand name, packaging, and standard media copy and executions. It is estimated that a budget of $15,000 initially with any overage coming out of the advertising allotment of $5,000 per month will be sufficient.
All marketing decisions with regard to specific media choices, frequency, size, and expenditures will be conducted on an on-going basis with careful considerations of returns generated.
5.2 Sales Strategy
Initially all sales are direct response. At the beginning of year two we will look to expand to other channels which will entail the hiring of a sales manager and investigation and decisions on rep organizations. Actual retail sales will not take place until year three. It is estimated that one full year of pre-sell with the major chains and participation in industry trade shows will be required to penetrate retail channels.
In addition, this expansion will be coordinated with a strategic plan to raise more capital in order to insure media, co-op, and endorsement programs.
Professional Athletic Equipment, Inc.
Page 13

5.2.1 Sales Forecast
The following table and related charts show our present sales forecast. We are projecting sales at $242,000 in test year 1 which represents 9,000 units sold via direct marketing. We are forecasting sales to increase to $4,042,510 in year two with expanded media expenditures and reach. This reflects an increase to 25,000 units sold via direct marketing and 125,000 units sold in initial retail penetration. The direct cost of sales is not margin adjusted here but it is adjusted on the P & L statement.
Table: Sales Forecast (Planned)
Sales ForecastSales 1996 1997 1998Sales $0 $242,550 $4,042,500Other $0 $0 $0Total Sales $0 $242,550 $4,042,500
Direct Cost of Sales 1996 1997 1998Sales $0 $63,520 $1,191,000Other $0 $0 $0Subtotal Direct Cost of Sales $0 $63,520 $1,191,000
5.3 Milestones
The first milestone for Professional Athletic Equipment, Inc. is design and prototype production of a fully functional product. This has been achieved with founder funding. The prototype was developed in 1994.
The second milestone is to test the effectiveness of the product. This has been completed at the University of Tennessee at the Southern Impact Research Center, L.L.C. The product tested favorably vs. any commercially available "competitive" product. The test results are included in an addendum to this plan. Test costs were also founder funded. Testing was completed in January 1996.
The third milestone is to obtain a U.S. Patent on the product. Patent application is currently pending. Legal fees have been born by the founder. Patent application was filed in December 1995 and revised in April 1996.
The next significant milestone to be achieved for Professional Athletic Equipment, Inc. will be the successful subscription to the private placement offering. Initial capital of $250 to $500K enables the implementation of the test market. All costs of marketing the private placement are to be born by the founder. Target date for completion of the offering is August 1996.
The subsequent milestone will then be product production. Start-up production costs are expected to be $65,000 for depreciable molds and manufacturing equipment. An additional $25,437 will be spent to produce the initial inventory of 1500 small units, 850 medium units, and 850 large units. Molds are to be ordered by September 1996.
Corporate identity executions will take place in November 1996. This will include logos, trademarking, package design, and advertising and promotion copy executions. Expenditure is estimated at $15,000.
The next, and most significant milestone, will be the sale of initial inventory through test market executions. The successful sale of product will then launch the expanded production and marketing efforts with significant confidence for success. Sales success will also trigger additional small production runs to enable marketing and sales efforts to continue. Cash flow needs will be addressed by additional debt/equity offerings as conditions dictate. Banking
Professional Athletic Equipment, Inc.
Page 14

relationships will also be established at that point. Initial sales are expected in February or March 1997.
6.0 Management Summary
Professional Athletic Equipment, Inc. will have a very thin management team at inception. Production management will in effect be subcontracted via the use of a contract manufacturer. Key internal needs are for general financial control, strategic planning, and sales and marketing implementation.
6.1 Management Team
• Dr. James B. Smith, M.D.: President and Founder. Dr. Smith is a practicing physician in Anytown, Ga. His design of the Body Armor and willingness to invest his personal funds in the project represents his commitment to success. He has recognized the need for an effective product to protect youthful sports participants. Dr. Smith will manage the business on a passive basis throughout the test marketing phase.
• Timothy J. Clark: Chief Operating Officer. Mr. Clark is the principal of Lintel Capital in Anytown, Georgia. He is the author of this business plan. Mr. Clark will manage operations during the first year and throughout the test marketing phase. He has previously managed successful start-ups and early stage business ventures. He will also assist in capital raising efforts via Lintel Capital in both first and subsequent stage offerings. Mr. Clark will also advise the company on management succession.
• Mr. Rick L. Jones C.P.A.: Mr. Jones of Haddocks, Maddocks, Bollix, Jones & Co. will handle the company's accounting.
• Patent attorneys are: Needle & Haystack P.C. of Anytown.
Board of Directors consists of Mssrs. Smith, Evans, The Honorable Robert L. Anyname, Superior Court Judge, and William R. Offenboughten, Manager of Distributor Sales for A-B-C-D Company.
6.2 Management Team Gaps
Key management team gaps are the lack of a permanent C.O.O. and a permanent V.P. Sales and Marketing. It is expected that such key people will be readily available in the Anytown employment market when needed.
6.3 Personnel Plan
Personnel needs in year two and three will be for G & A staff, particularly in order processing. The potential also exists to outsource such services via a product fulfillment center. Product shipping and handling will be handled at the manufacturing point and may be supplemented with temporary employees as required. At present a line item in personnel requirements of $60,000 is budgeted for these functions (personnel burden of 20% is also calculated on this amount). No permanent staffing decisions will be made until year two when the business plan is revised going into roll-out in year three. All expenditures represent estimates at this time.
Professional Athletic Equipment, Inc.
Page 15

Table: Personnel (Planned)
Personnel Plan1996 1997 1998
C.O.O. $18,000 $36,000 $60,000VP Sales & Mkt. $0 $48,000 $48,000C.E.O. $0 $0 $72,000Process&Ship $0 $60,000 $60,000Other $0 $0 $0Other $0 $0 $0Total Payroll $18,000 $144,000 $240,000
Total Headcount 0 0 0Payroll Burden $3,600 $28,800 $48,000Total Payroll Expenditures $21,600 $172,800 $288,000
7.0 Financial Plan
Professional Athletic Equipment, Inc. desires to finance growth through a combination of equity/debt investment and internally generated cash flow. Because of the cost of initial tooling and inventory and marketing costs of establishing a market presence, the business will be financed primarily by investment in the early stages and is expected to burn cash. The target of break-even in year one will only apply if one stops at selling initial inventory and stops marketing or does not engage in additional production. Obviously, any of those courses would hinder growth. Thus, it is expected that additional investment will be required.
The most important indicator in our case is inventory turnover. We have to make sure that turnover stays above 5 on all production subsequent to test marketing, or we will be clogged with inventory.
Collection days are very important. We do not want to let our average collection days to get above 45 under any circumstances. This could cause a serious problem with cash flow, because working capital will be tight. Fortunately, most sales in test marketing will be direct via credit card. Thus, business at this stage will be basically for cash. Retail distribution entails 30 to 60 day billing cycles. Every effort will be made to collect on time and to offer billing term discounts. Major retailers are notoriously slow in payments. Even when sales are for cash, this plan assumes 45 day payments on all sales in order to be conservative on cash flow demands.
We must maintain gross margins of 70% and hold marketing costs to 30% of sales in all direct sales channels.
In retail channels gross margins based on wholesale pricing must be 40% and marketing costs held to 15% of sales. Volumes must be significant to support these numbers. An accurate forecast of retail sales potential can only be made after significant product acceptance by consumers. Estimates for year three retail sales contained in this plan should be considered as such. Subsequent plan revisions will have a higher degree of accuracy.
Professional Athletic Equipment, Inc.
Page 16
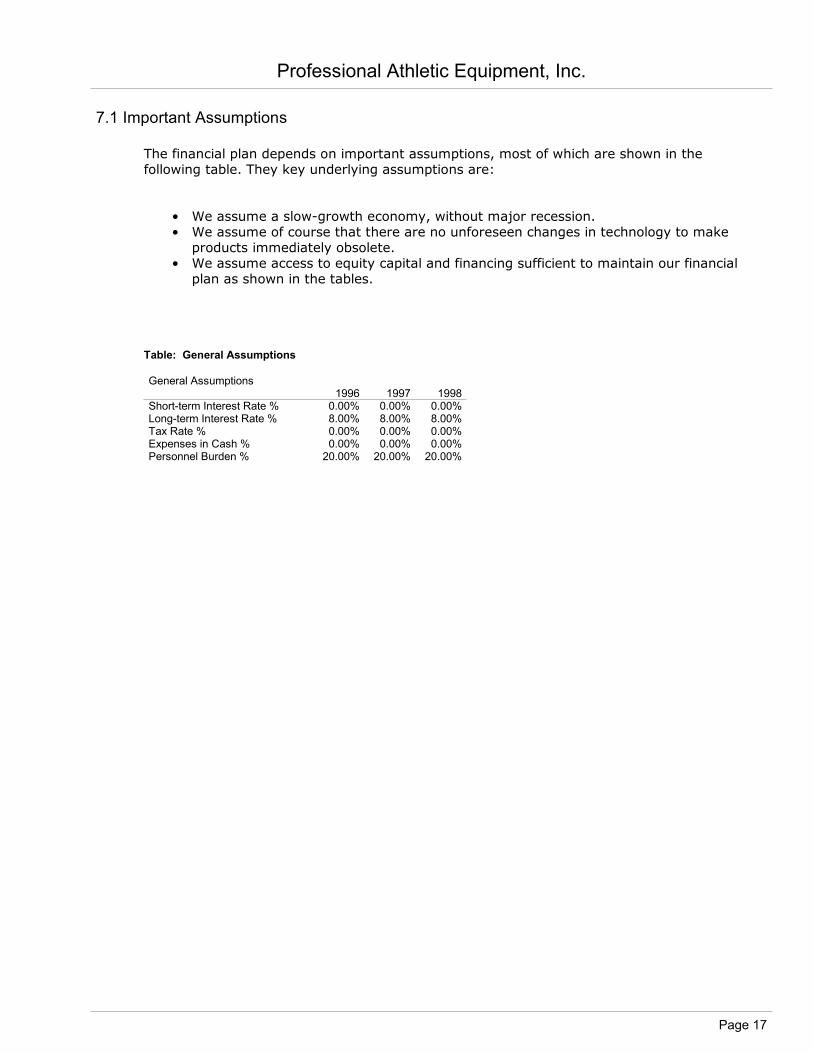
7.1 Important Assumptions
The financial plan depends on important assumptions, most of which are shown in the following table. They key underlying assumptions are:
• We assume a slow-growth economy, without major recession. • We assume of course that there are no unforeseen changes in technology to make
products immediately obsolete. • We assume access to equity capital and financing sufficient to maintain our financial
plan as shown in the tables.
Table: General Assumptions
General Assumptions1996 1997 1998
Short-term Interest Rate % 0.00% 0.00% 0.00%Long-term Interest Rate % 8.00% 8.00% 8.00%Tax Rate % 0.00% 0.00% 0.00%Expenses in Cash % 0.00% 0.00% 0.00%Personnel Burden % 20.00% 20.00% 20.00%
Professional Athletic Equipment, Inc.
Page 17

7.2 Key Financial Indicators
• The most important indicator in our case is inventory turnover. We have to make sure that turnover stays above 5, or we are clogged with inventory.
• Collection days is very important. We do not want to let our average collection days get above 45 under any circumstances. This could cause a serious problem with cash flow, because our working capital situation is chronically tight.
• We must maintain gross margins of 45 percent at the least, and hold marketing costs to no more than 20% of sales.
0
5
10
15
20
25
Sales Gross OpEx
1996
1997
1998
Benchmarks (Planned)
Professional Athletic Equipment, Inc.
Page 18

7.3 Break-even Analysis
The break-even analysis shows that Professional Athletic Equipment, Inc. has a good balance of fixed costs and sufficient sales strength to remain healthy. Our break-even point is close to 1430 units per month, while our sales forecast for the next year calls for 750 units per month on average.
Some costs included in the plan may be trimmed if necessary. Thus, there is room to cut the gap to break-even in year two with interim plan revision on the cost side, particularly by limiting ad and promotion expense and some fixed expense. The break even number of 1430 units a month is an extremely conservative break-even number since it assumes full marketing and media expenditures as called for by the plan. These expenses are treated as "fixed" when in fact they are "variable". Thus, break even is based on full expenditures.
The initial production run will be 3200 units or approximately one third of the first year's projected sales. This will preserve operating capital and incoming sales revenue will permit the company to function with some cash flow reserve during the first year. A close to break-even performance in year one on a new consumer product would be outstanding.
Since production gear up is short once molds are in place, additional production runs can be done on short notice. For the purpose of this first plan we have used a "zero inventory" model. That is, after the production run initially, we produce to need, which is driven by sales. Generally direct or mail order sales can ship within 30 days and often collect via credit card up front. Subsequent plans will include inventory balance on an on-going basis which will yield more accurate cash flow numbers in year two and three.
($30,000)
($20,000)
($10,000)
$0
$10,000
$20,000
$0 $10,780 $21,560 $32,340 $43,120 $53,900
Monthly break-even point
Break-even point = where line intersects with 0
Break-even Analysis
Professional Athletic Equipment, Inc.
Page 19
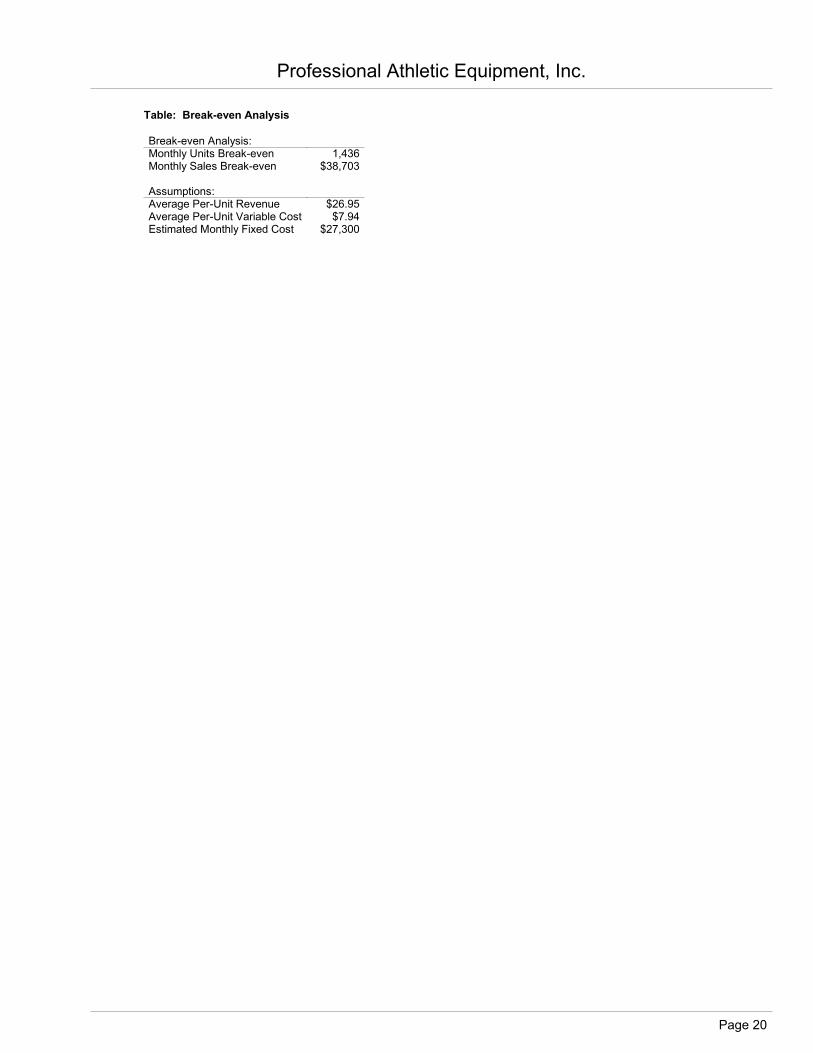
Table: Break-even Analysis
Break-even Analysis:Monthly Units Break-even 1,436Monthly Sales Break-even $38,703
Assumptions:Average Per-Unit Revenue $26.95Average Per-Unit Variable Cost $7.94Estimated Monthly Fixed Cost $27,300
Professional Athletic Equipment, Inc.
Page 20

7.4 Projected Profit and Loss
All expenses estimated in this initial plan are considered to be accurate but not firm. Flexibility is assumed as the plan progresses through execution. Also, the assumption here is that we only raise $250,000 in initial capital. If we actually raise $500,000 it may or may not alter the sales forecast and increase advertising and promotion activity, but it will serve as a buffer of cash reserve.
The plan now projects a loss of $170K in 1997, the first year of sales. This will be considered very acceptable when considered against the need to spend to introduce a new product. In fact, it is achievable only since we are pursuing low-cost channels of distribution in the test. Our over-all objective here remains only to prove salability and test various channels and promotional strategies, not to make an instant profit.
Year two assumes new sales into retail with a corresponding reduction in margin on the sales into that channel. Volumes increase as do ad and promo expenditures. Only one or two small retail chain or independent stores (assuming multiple locations) would be required to generate the sales volume sought provided the product has proven to be acceptable to consumers. We are thus forecasting a roll-over to profitability in 1998 with a bottom line of $495,000 after tax or 12% of sales. These are realistic targets.
If this is achieved, it would be a good time for management to look at a major financing, other acquisitions, and an aggressive national expansion of the "Body Armor."
Table: Profit and Loss (Planned)
Pro Forma Profit and Loss1996 1997 1998
Sales $0 $242,550 $4,042,500Direct Cost of Sales $0 $63,520 $1,191,000Lost Margin on Retail units $0 $0 $992,500
------------ ------------ ------------Total Cost of Sales $0 $63,520 $2,183,500Gross Margin $0 $179,030 $1,859,000Gross Margin % 0.00% 73.81% 45.99%Operating Expenses: Advertising/Promotion $0 $60,000 $800,000Travel $1,200 $12,000 $24,000Miscellaneous $1,500 $4,800 $8,600Public Relations $6,000 $36,000 $36,000Payroll Expense $18,000 $144,000 $240,000Payroll Burden $3,600 $28,800 $48,000Leased Equipment $1,500 $6,000 $6,000Utilities $750 $6,000 $12,000Insurance $2,250 $24,000 $48,000Rent $1,500 $6,000 $24,000Other $0 $0 $0Other $0 $0 $0Depreciation $3,249 $18,830 $18,830Logo, Design, Identity $15,000 $0 $0
------------ ------------ ------------Total Operating Expenses $54,549 $346,430 $1,265,430Profit Before Interest and Taxes ($54,549) ($167,400) $593,570Interest Expense Short-term $0 $0 $0Interest Expense Long-term $0 $0 $0Taxes Incurred $0 $0 $0Extraordinary Items $0 $0 $0Net Profit ($54,549) ($167,400) $593,570Net Profit/Sales 0.00% -69.02% 14.68%
Professional Athletic Equipment, Inc.
Page 21

7.5 Projected Cash Flow
Cash flow in year two, 1997, needs a closer look on a month-to-month basis. Since this will be entirely a function of actual sales vs. inventory turns it will be addressed in detail in subsequent plan revisions. At this juncture, the "produce as needed" philosophy of management still is the operative mode. Subsequent revisions of this plan in years two and three will switch to a full inventory, payables, and receivables model. The following chart represents the use of cash from initial investment in 1996.
($100,000)
($50,000)
$0
$50,000
$100,000
$150,000
$200,000
$250,000
Jan Feb Mar Apr May Jun Jul Aug Sep Oct Nov Dec
Net Cash Flow
Cash Balance
Cash (Planned)
Professional Athletic Equipment, Inc.
Page 22
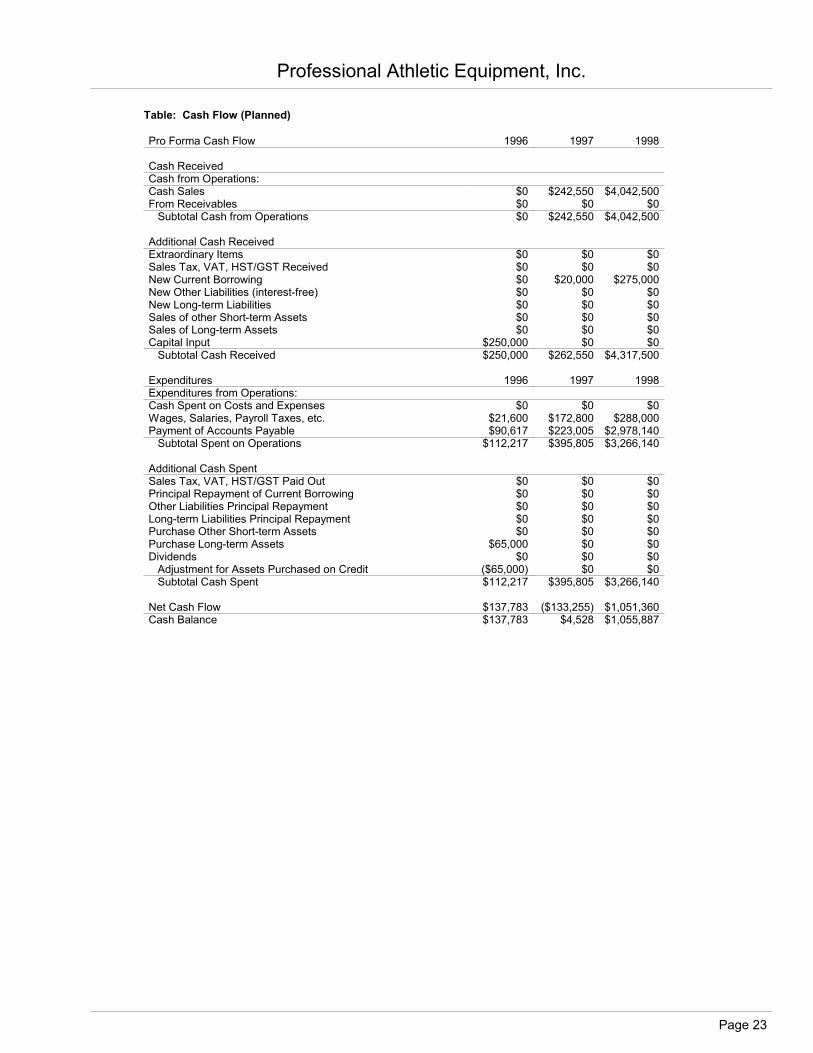
Table: Cash Flow (Planned)
Pro Forma Cash Flow 1996 1997 1998
Cash ReceivedCash from Operations: Cash Sales $0 $242,550 $4,042,500From Receivables $0 $0 $0 Subtotal Cash from Operations $0 $242,550 $4,042,500
Additional Cash ReceivedExtraordinary Items $0 $0 $0Sales Tax, VAT, HST/GST Received $0 $0 $0New Current Borrowing $0 $20,000 $275,000New Other Liabilities (interest-free) $0 $0 $0New Long-term Liabilities $0 $0 $0Sales of other Short-term Assets $0 $0 $0Sales of Long-term Assets $0 $0 $0Capital Input $250,000 $0 $0 Subtotal Cash Received $250,000 $262,550 $4,317,500
Expenditures 1996 1997 1998Expenditures from Operations:Cash Spent on Costs and Expenses $0 $0 $0Wages, Salaries, Payroll Taxes, etc. $21,600 $172,800 $288,000Payment of Accounts Payable $90,617 $223,005 $2,978,140 Subtotal Spent on Operations $112,217 $395,805 $3,266,140
Additional Cash SpentSales Tax, VAT, HST/GST Paid Out $0 $0 $0Principal Repayment of Current Borrowing $0 $0 $0Other Liabilities Principal Repayment $0 $0 $0Long-term Liabilities Principal Repayment $0 $0 $0Purchase Other Short-term Assets $0 $0 $0Purchase Long-term Assets $65,000 $0 $0Dividends $0 $0 $0 Adjustment for Assets Purchased on Credit ($65,000) $0 $0 Subtotal Cash Spent $112,217 $395,805 $3,266,140
Net Cash Flow $137,783 ($133,255) $1,051,360Cash Balance $137,783 $4,528 $1,055,887
Professional Athletic Equipment, Inc.
Page 23

7.6 Projected Balance Sheet
Preliminary Balance Sheet is estimated.
Table: Balance Sheet (Planned)
Pro Forma Balance Sheet
AssetsShort-term Assets 1996 1997 1998Cash $137,783 $4,528 $1,055,887Other Short-term Assets $0 $0 $0Total Short-term Assets $137,783 $4,528 $1,055,887Long-term AssetsLong-term Assets $65,000 $65,000 $65,000Accumulated Depreciation $1,500 $7,500 $13,500Total Long-term Assets $63,500 $57,500 $51,500Total Assets $201,283 $62,028 $1,107,387
Liabilities and Capital1996 1997 1998
Accounts Payable $5,832 $13,977 $190,766Current Borrowing $0 $20,000 $295,000Other Short-term Liabilities $0 $0 $0Subtotal Short-term Liabilities $5,832 $33,977 $485,766
Long-term Liabilities $0 $0 $0Total Liabilities $5,832 $33,977 $485,766
Paid-in Capital $250,000 $250,000 $250,000Retained Earnings $0 ($54,549) ($221,949)Earnings ($54,549) ($167,400) $593,570Total Capital $195,451 $28,051 $621,621Total Liabilities and Capital $201,283 $62,028 $1,107,387Net Worth $195,451 $28,051 $621,621
7.7 Business Ratios
Business ratio estimates are preliminary, and the Industry Profile is based on Standard Industry Code #3949, Sporting and Athletic Goods.
Professional Athletic Equipment, Inc.
Page 24

Table: Ratios (Planned)
Ratio Analysis1996 1997 1998 Industry Profile
Sales Growth 0.00% 0.00% 1566.67% -2.30%
Percent of Total AssetsAccounts Receivable 0.00% 0.00% 0.00% 22.80%Inventory 0.00% 0.00% 0.00% 26.00%Other Short-term Assets 0.00% 0.00% 0.00% 26.30%Total Short-term Assets 68.45% 7.30% 95.35% 75.10%Long-term Assets 31.55% 92.70% 4.65% 24.90%Total Assets 100.00% 100.00% 100.00% 100.00%
Other Short-term Liabilities 0.00% 0.00% 0.00% 35.50%Subtotal Short-term Liabilities 2.90% 54.78% 43.87% 29.10%Long-term Liabilities 0.00% 0.00% 0.00% 14.20%Total Liabilities 2.90% 54.78% 43.87% 43.30%Net Worth 97.10% 45.22% 56.13% 56.70%
Percent of SalesSales 100.00% 100.00% 100.00% 100.00%Gross Margin 0.00% 73.81% 45.99% 37.50%Selling, General & Administrative Expenses 0.00% 142.83% 31.30% 23.50%Advertising Expenses 0.00% 24.74% 19.79% 1.60%Profit Before Interest and Taxes 0.00% -69.02% 14.68% 2.70%
Main RatiosCurrent 23.63 0.13 2.17 2.27Quick 23.63 0.13 2.17 1.18Total Debt to Total Assets 2.90% 54.78% 43.87% 49.70%Pre-tax Return on Net Worth -27.91% -596.77% 95.49% 5.40%Pre-tax Return on Assets -27.10% -269.88% 53.60% 10.70%
Business Vitality Profile 1996 1997 1998 IndustrySales per Employee $0 $0 $0 $0Survival Rate 0.00%
Additional Ratios 1996 1997 1998Net Profit Margin 0.00% -69.02% 14.68% n.aReturn on Equity -27.91% -596.77% 95.49% n.a
Activity RatiosAccounts Receivable Turnover 0.00 0.00 0.00 n.aCollection Days 0 0 0 n.aInventory Turnover 0.00 0.00 0.00 n.aAccounts Payable Turnover 16.54 16.54 16.54 n.aTotal Asset Turnover 0.00 3.91 3.65 n.a
Debt RatiosDebt to Net Worth 0.03 1.21 0.78 n.aShort-term Liab. to Liab. 1.00 1.00 1.00 n.a
Liquidity RatiosNet Working Capital $131,951 ($29,449) $570,121 n.aInterest Coverage 0.00 0.00 0.00 n.a
Additional RatiosAssets to Sales n.a. 0.26 0.27 n.aCurrent Debt/Total Assets 3% 55% 44% n.aAcid Test 23.63 0.13 2.17 n.aSales/Net Worth 0.00 8.65 6.50 n.aDividend Payout $0 0.00 0.00 n.a
Professional Athletic Equipment, Inc.
Page 25

Appendix Table: Sales Forecast (Planned)
Sales ForecastSales Jan Feb Mar Apr May Jun Jul Aug Sep Oct Nov DecSales $0 $0 $0 $0 $0 $0 $0 $0 $0 $0 $0 $0Other $0 $0 $0 $0 $0 $0 $0 $0 $0 $0 $0 $0Total Sales $0 $0 $0 $0 $0 $0 $0 $0 $0 $0 $0 $0
Direct Cost of Sales Jan Feb Mar Apr May Jun Jul Aug Sep Oct Nov DecSales $0 $0 $0 $0 $0 $0 $0 $0 $0 $0 $0 $0Other $0 $0 $0 $0 $0 $0 $0 $0 $0 $0 $0 $0Subtotal Direct Cost of Sales $0 $0 $0 $0 $0 $0 $0 $0 $0 $0 $0 $0
Appendix
Page 1
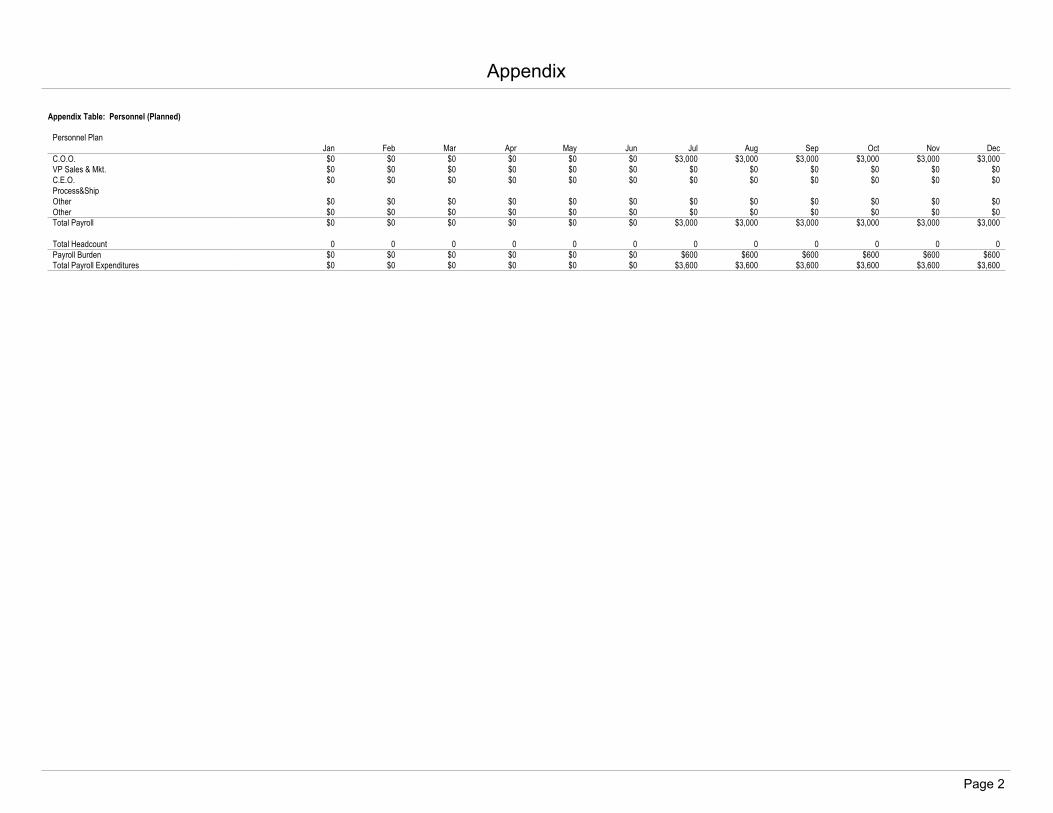
Appendix Table: Personnel (Planned)
Personnel PlanJan Feb Mar Apr May Jun Jul Aug Sep Oct Nov Dec
C.O.O. $0 $0 $0 $0 $0 $0 $3,000 $3,000 $3,000 $3,000 $3,000 $3,000VP Sales & Mkt. $0 $0 $0 $0 $0 $0 $0 $0 $0 $0 $0 $0C.E.O. $0 $0 $0 $0 $0 $0 $0 $0 $0 $0 $0 $0Process&ShipOther $0 $0 $0 $0 $0 $0 $0 $0 $0 $0 $0 $0Other $0 $0 $0 $0 $0 $0 $0 $0 $0 $0 $0 $0Total Payroll $0 $0 $0 $0 $0 $0 $3,000 $3,000 $3,000 $3,000 $3,000 $3,000
Total Headcount 0 0 0 0 0 0 0 0 0 0 0 0Payroll Burden $0 $0 $0 $0 $0 $0 $600 $600 $600 $600 $600 $600Total Payroll Expenditures $0 $0 $0 $0 $0 $0 $3,600 $3,600 $3,600 $3,600 $3,600 $3,600
Appendix
Page 2
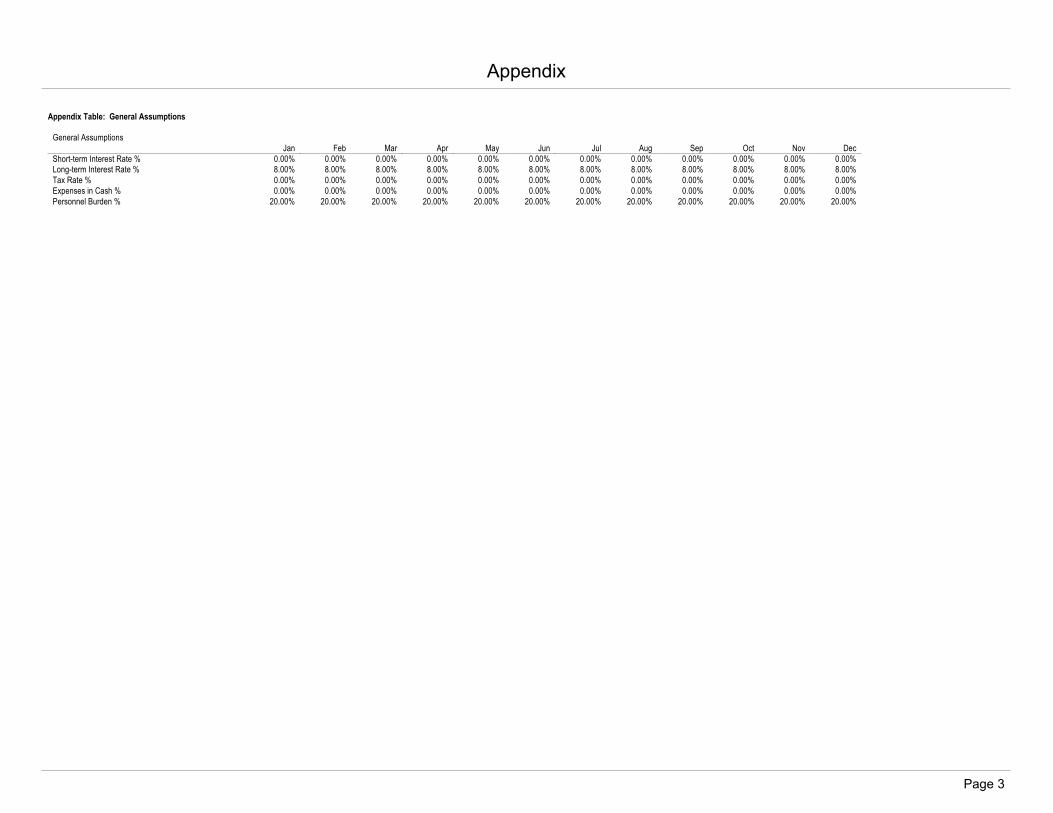
Appendix Table: General Assumptions
General AssumptionsJan Feb Mar Apr May Jun Jul Aug Sep Oct Nov Dec
Short-term Interest Rate % 0.00% 0.00% 0.00% 0.00% 0.00% 0.00% 0.00% 0.00% 0.00% 0.00% 0.00% 0.00%Long-term Interest Rate % 8.00% 8.00% 8.00% 8.00% 8.00% 8.00% 8.00% 8.00% 8.00% 8.00% 8.00% 8.00%Tax Rate % 0.00% 0.00% 0.00% 0.00% 0.00% 0.00% 0.00% 0.00% 0.00% 0.00% 0.00% 0.00%Expenses in Cash % 0.00% 0.00% 0.00% 0.00% 0.00% 0.00% 0.00% 0.00% 0.00% 0.00% 0.00% 0.00%Personnel Burden % 20.00% 20.00% 20.00% 20.00% 20.00% 20.00% 20.00% 20.00% 20.00% 20.00% 20.00% 20.00%
Appendix
Page 3
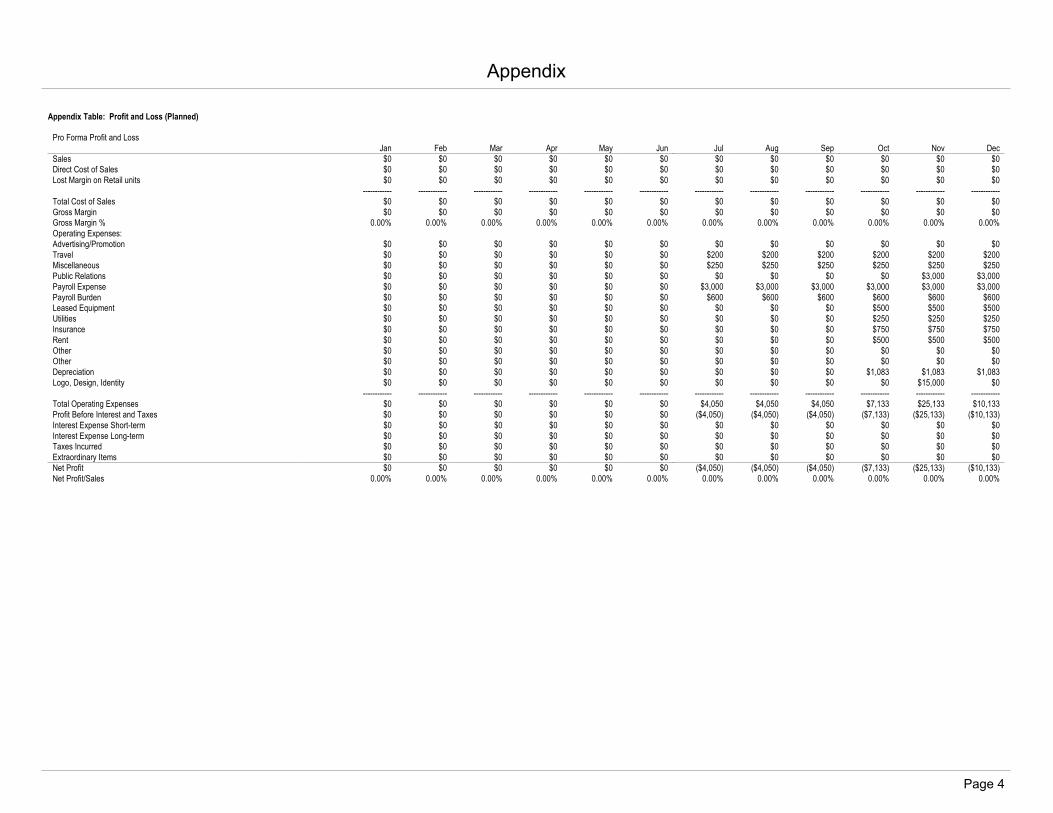
Appendix Table: Profit and Loss (Planned)
Pro Forma Profit and LossJan Feb Mar Apr May Jun Jul Aug Sep Oct Nov Dec
Sales $0 $0 $0 $0 $0 $0 $0 $0 $0 $0 $0 $0Direct Cost of Sales $0 $0 $0 $0 $0 $0 $0 $0 $0 $0 $0 $0Lost Margin on Retail units $0 $0 $0 $0 $0 $0 $0 $0 $0 $0 $0 $0
------------ ------------ ------------ ------------ ------------ ------------ ------------ ------------ ------------ ------------ ------------ ------------Total Cost of Sales $0 $0 $0 $0 $0 $0 $0 $0 $0 $0 $0 $0Gross Margin $0 $0 $0 $0 $0 $0 $0 $0 $0 $0 $0 $0Gross Margin % 0.00% 0.00% 0.00% 0.00% 0.00% 0.00% 0.00% 0.00% 0.00% 0.00% 0.00% 0.00%Operating Expenses: Advertising/Promotion $0 $0 $0 $0 $0 $0 $0 $0 $0 $0 $0 $0Travel $0 $0 $0 $0 $0 $0 $200 $200 $200 $200 $200 $200Miscellaneous $0 $0 $0 $0 $0 $0 $250 $250 $250 $250 $250 $250Public Relations $0 $0 $0 $0 $0 $0 $0 $0 $0 $0 $3,000 $3,000Payroll Expense $0 $0 $0 $0 $0 $0 $3,000 $3,000 $3,000 $3,000 $3,000 $3,000Payroll Burden $0 $0 $0 $0 $0 $0 $600 $600 $600 $600 $600 $600Leased Equipment $0 $0 $0 $0 $0 $0 $0 $0 $0 $500 $500 $500Utilities $0 $0 $0 $0 $0 $0 $0 $0 $0 $250 $250 $250Insurance $0 $0 $0 $0 $0 $0 $0 $0 $0 $750 $750 $750Rent $0 $0 $0 $0 $0 $0 $0 $0 $0 $500 $500 $500Other $0 $0 $0 $0 $0 $0 $0 $0 $0 $0 $0 $0Other $0 $0 $0 $0 $0 $0 $0 $0 $0 $0 $0 $0Depreciation $0 $0 $0 $0 $0 $0 $0 $0 $0 $1,083 $1,083 $1,083Logo, Design, Identity $0 $0 $0 $0 $0 $0 $0 $0 $0 $0 $15,000 $0
------------ ------------ ------------ ------------ ------------ ------------ ------------ ------------ ------------ ------------ ------------ ------------Total Operating Expenses $0 $0 $0 $0 $0 $0 $4,050 $4,050 $4,050 $7,133 $25,133 $10,133Profit Before Interest and Taxes $0 $0 $0 $0 $0 $0 ($4,050) ($4,050) ($4,050) ($7,133) ($25,133) ($10,133)Interest Expense Short-term $0 $0 $0 $0 $0 $0 $0 $0 $0 $0 $0 $0Interest Expense Long-term $0 $0 $0 $0 $0 $0 $0 $0 $0 $0 $0 $0Taxes Incurred $0 $0 $0 $0 $0 $0 $0 $0 $0 $0 $0 $0Extraordinary Items $0 $0 $0 $0 $0 $0 $0 $0 $0 $0 $0 $0Net Profit $0 $0 $0 $0 $0 $0 ($4,050) ($4,050) ($4,050) ($7,133) ($25,133) ($10,133)Net Profit/Sales 0.00% 0.00% 0.00% 0.00% 0.00% 0.00% 0.00% 0.00% 0.00% 0.00% 0.00% 0.00%
Appendix
Page 4

Appendix Table: Cash Flow (Planned)
Pro Forma Cash Flow Jan Feb Mar Apr May Jun Jul Aug Sep Oct Nov Dec
Cash ReceivedCash from Operations: Cash Sales $0 $0 $0 $0 $0 $0 $0 $0 $0 $0 $0 $0From Receivables $0 $0 $0 $0 $0 $0 $0 $0 $0 $0 $0 $0 Subtotal Cash from Operations $0 $0 $0 $0 $0 $0 $0 $0 $0 $0 $0 $0
Additional Cash ReceivedExtraordinary Items $0 $0 $0 $0 $0 $0 $0 $0 $0 $0 $0 $0Sales Tax, VAT, HST/GST Received 0.00% $0 $0 $0 $0 $0 $0 $0 $0 $0 $0 $0 $0New Current Borrowing $0 $0 $0 $0 $0 $0 $0 $0 $0 $0 $0 $0New Other Liabilities (interest-free) $0 $0 $0 $0 $0 $0 $0 $0 $0 $0 $0 $0New Long-term Liabilities $0 $0 $0 $0 $0 $0 $0 $0 $0 $0 $0 $0Sales of other Short-term Assets $0 $0 $0 $0 $0 $0 $0 $0 $0 $0 $0 $0Sales of Long-term Assets $0 $0 $0 $0 $0 $0 $0 $0 $0 $0 $0 $0Capital Input $0 $0 $0 $0 $0 $0 $250,000 $0 $0 $0 $0 $0 Subtotal Cash Received $0 $0 $0 $0 $0 $0 $250,000 $0 $0 $0 $0 $0
Expenditures Jan Feb Mar Apr May Jun Jul Aug Sep Oct Nov DecExpenditures from Operations:Cash Spent on Costs and Expenses $0 $0 $0 $0 $0 $0 $0 $0 $0 $0 $0 $0Wages, Salaries, Payroll Taxes, etc. $0 $0 $0 $0 $0 $0 $3,600 $3,600 $3,600 $3,600 $3,600 $3,600Payment of Accounts Payable $0 $0 $0 $0 $0 $0 $15 $450 $2,617 $63,369 $3,633 $20,533 Subtotal Spent on Operations $0 $0 $0 $0 $0 $0 $3,615 $4,050 $6,217 $66,969 $7,233 $24,133
Additional Cash SpentSales Tax, VAT, HST/GST Paid Out $0 $0 $0 $0 $0 $0 $0 $0 $0 $0 $0 $0Principal Repayment of Current Borrowing $0 $0 $0 $0 $0 $0 $0 $0 $0 $0 $0 $0Other Liabilities Principal Repayment $0 $0 $0 $0 $0 $0 $0 $0 $0 $0 $0 $0Long-term Liabilities Principal Repayment $0 $0 $0 $0 $0 $0 $0 $0 $0 $0 $0 $0Purchase Other Short-term Assets $0 $0 $0 $0 $0 $0 $0 $0 $0 $0 $0 $0Purchase Long-term Assets $0 $0 $0 $0 $0 $0 $0 $0 $65,000 $0 $0 $0Dividends $0 $0 $0 $0 $0 $0 $0 $0 $0 $0 $0 $0 Adjustment for Assets Purchased on Credit $0 $0 $0 $0 $0 $0 $0 $0 ($65,000) $0 $0 $0 Subtotal Cash Spent $0 $0 $0 $0 $0 $0 $3,615 $4,050 $6,217 $66,969 $7,233 $24,133
Net Cash Flow $0 $0 $0 $0 $0 $0 $246,385 ($4,050) ($6,217) ($66,969) ($7,233) ($24,133)Cash Balance $0 $0 $0 $0 $0 $0 $246,385 $242,335 $236,118 $169,149 $161,916 $137,783
Appendix
Page 5

Appendix Table: Balance Sheet (Planned)
Pro Forma Balance Sheet
AssetsShort-term Assets Starting Balances Jan Feb Mar Apr May Jun Jul Aug Sep Oct Nov DecCash $0 $0 $0 $0 $0 $0 $0 $246,385 $242,335 $236,118 $169,149 $161,916 $137,783Other Short-term Assets $0 $0 $0 $0 $0 $0 $0 $0 $0 $0 $0 $0 $0Total Short-term Assets $0 $0 $0 $0 $0 $0 $0 $246,385 $242,335 $236,118 $169,149 $161,916 $137,783Long-term AssetsLong-term Assets $0 $0 $0 $0 $0 $0 $0 $0 $0 $65,000 $65,000 $65,000 $65,000Accumulated Depreciation $0 $0 $0 $0 $0 $0 $0 $0 $0 $0 $500 $1,000 $1,500Total Long-term Assets $0 $0 $0 $0 $0 $0 $0 $0 $0 $65,000 $64,500 $64,000 $63,500Total Assets $0 $0 $0 $0 $0 $0 $0 $246,385 $242,335 $301,118 $233,649 $225,916 $201,283
Liabilities and CapitalJan Feb Mar Apr May Jun Jul Aug Sep Oct Nov Dec
Accounts Payable $0 $0 $0 $0 $0 $0 $0 $435 $435 $63,268 $2,932 $20,332 $5,832Current Borrowing $0 $0 $0 $0 $0 $0 $0 $0 $0 $0 $0 $0 $0Other Short-term Liabilities $0 $0 $0 $0 $0 $0 $0 $0 $0 $0 $0 $0 $0Subtotal Short-term Liabilities $0 $0 $0 $0 $0 $0 $0 $435 $435 $63,268 $2,932 $20,332 $5,832
Long-term Liabilities $0 $0 $0 $0 $0 $0 $0 $0 $0 $0 $0 $0 $0Total Liabilities $0 $0 $0 $0 $0 $0 $0 $435 $435 $63,268 $2,932 $20,332 $5,832
Paid-in Capital $0 $0 $0 $0 $0 $0 $0 $250,000 $250,000 $250,000 $250,000 $250,000 $250,000Retained Earnings $0 $0 $0 $0 $0 $0 $0 $0 $0 $0 $0 $0 $0Earnings $0 $0 $0 $0 $0 $0 $0 ($4,050) ($8,100) ($12,150) ($19,283) ($44,416) ($54,549)Total Capital $0 $0 $0 $0 $0 $0 $0 $245,950 $241,900 $237,850 $230,717 $205,584 $195,451Total Liabilities and Capital $0 $0 $0 $0 $0 $0 $0 $246,385 $242,335 $301,118 $233,649 $225,916 $201,283Net Worth $0 $0 $0 $0 $0 $0 $0 $245,950 $241,900 $237,850 $230,717 $205,584 $195,451
Appendix
Page 6