Embed Size (px)
Citation preview
1
Johannesburg Development Agency (JDA)
City of Johannesburg
BUSINESS PLAN 2012/13
2
3
TABLE OF CONTENTS
1. INTRODUCTION .................................................................................................... 4
2. EXECUTIVE SUMMARY ....................................................................................... 7
3. STRATEGIC ANALYSIS ..................................................................................... 10
4. STRATEGIC FOCUS AREA ................................................................................ 27
5. FINANCIAL IMPACT ........................................................................................... 37
6. HUMAN CAPITAL ............................................................................................... 46
7. RISK ASSESSMENT ........................................................................................... 50
8. APPENDICES ...................................................................................................... 56
4
1. INTRODUCTION
The South African State of the Cities Report for 2011 defines the resilient city as one that is able to chart a different path in solving complex and unanticipated problems. It involves adapting and shaping development in order to improve the City‟s position through structural change. Creative and innovative development strategies are required. If we are to promote resilience through structural change that achieves greater equality in Johannesburg, then the restructuring of city form must be a priority for Johannesburg. The State of World Cities Report for 2010-11 identifies access to equal opportunities and improvements in the quality of life of the poor as being key to the creation of an inclusive or equitable city. By building a more robust network of sustainable and competitive economic nodes and high density movement corridors that are well served by public transport it will be possible to increase access to markets and jobs for more people, and ensure optimal use of land and energy resources. It is also important to create new activity nodes in marginalised areas in order to bring markets, services and employment opportunities to these under-developed parts of the city. The second key reason for restructuring the city is to achieve reduced energy consumption and greenhouse gas emissions. The spatial form of the city is important because private car use is a significant driver of energy consumption and greenhouse gas emissions in South Africa, and 80% of the variance in private car energy use is due to urban density. For example, in the South African context, if 10% of households shift to energy efficient lighting it will reduce energy consumption by 0.1%; and if 10% of low income houses have ceilings retrofitted another reduction of 0.1% can be achieved. But, if 10% of private car users shift to public transport for their daily commute, this will result in an 8% reduction in energy consumption. The restructuring of the space economy in Johannesburg will depend on achieving the following development outcomes:
a) The regeneration of key economic nodes such as the Johannesburg inner city, and other declining economic nodes such as the Randburg and Roodepoort CBDs to enable these areas to accommodate a greater agglomeration of economic activity and more intensity of land use.
b) The development of selected nodes in marginalised areas to stimulate local economies, increase competitiveness, and broaden access to markets and jobs.
c) The development of high-density movement corridors anchored by transit nodes to restructure city form, promote efficient land use and transport energy consumption.
The most efficient urban form is compact, mixed land-use with an extensive public transport network that includes high intensity movement corridors and with attractive environments for walking and cycling. Energy efficiency is not the only reason for promoting compact cities. There are also social and economic sustainability reasons, including access, inclusion, health, social cohesion, vibrancy, economy, household savings, and air quality. As a City Development Agency, the JDA is positioned to take on a broader role, focusing on development areas selected for their potential to satisfy strategic objectives such as restructuring the space economy. There are opportunities for the scale of JDA operations to be extended: by increasing the number of development areas; extending the types of developments undertaken by the JDA; and increasing the development facilitation role that the JDA plays in development areas.
5
1.1 Vision, Mission
The JDA‟s vision and mission reflect the role the JDA can play in restructuring the space economy in Johannesburg.
1.1.1 Vision
JDA builds a more welcoming and competitive Johannesburg that is a better city to live, work and play in.
1.1.2 Mission
JDA is a city development agency of the City of Johannesburg that manages and facilitates developments in efficient and innovative ways to build an equitable, sustainable and resilient city.
1.1.3 Objectives
The objectives of the JDA are to:
Restructure the city by developing defined, strategic geographic areas around the city and the movement corridors that link them.
Promote economic growth by creating efficient and competitive business environments that cluster industries and functions in these areas.
Turn around declining investment trends in these areas by upgrading public space, generating shared visions for future development, and encouraging urban management partnerships.
Develop local economic potential in marginalised areas to promote access to jobs and markets.
Encourage sustainable energy consumption and land-use in the city by developing strategic transit nodes and corridors.
Promote economic empowerment through the structuring and procurement of JDA developments.
Support productive development partnerships and co-operation between all stakeholders in these areas.
1.2 Management and Organisational Structures In order to implement its annual business plan, the JDA is required to secure and maintain adequate human resource capability. The specialist skills required to achieve the JDA mandate include technical skills like engineering, project management and financial management. Since its inception in 2001/02 the JDA has had two CEOs, each serving a term of approximately 5 years. The organisational and staffing structure has evolved through these two terms: starting as a small technical team that focussed on development facilitation in the early years; and growing into a medium sized public entity (with just over 60 staff members in 2008/09). Since then, operational expenditure limits have been managed by not filling posts when they become vacant. The JDA is currently staffed by 51 people, most of whom work in the three development teams that manage the capital projects implemented by the JDA. The JDA‟s organisational structure is based on the following principles:
An executive management committee made up of the Chief Executive Officer (CEO), Chief Financial Officer (CFO), Chief Operating Officer (COO), Executive Manager:
6
Planning and Strategy, Executive Manager: Risk, Compliance & Human Resources and Executive Manager: Marketing & Communications.
Three specialist teams focusing on developments, each with led by a Senior Development Manager (SDM) who is responsible for overseeing all development under their portfolio assisted by a number of Development Managers (DMs), Assistant Development Managers (ADMs) and Development Coordinators.
The SDM is fully responsible for all aspects of developments, from design to implementation, while the COO is responsible for strategic guidance in the conceptualization, design, implementation and handover of all JDA developments, all transverse and cross-cutting operating issues related to developments, stakeholder relations, operating systems and monitoring and quality control over development projects.
Other administrative departments are responsible for functions such as supply chain management, finance, human resources, risk and compliance, marketing and communications and planning and strategy.
Certain tasks and functions, such as internal audit, are outsourced, although JDA retains responsibility and full accountability for these outsourced functions.
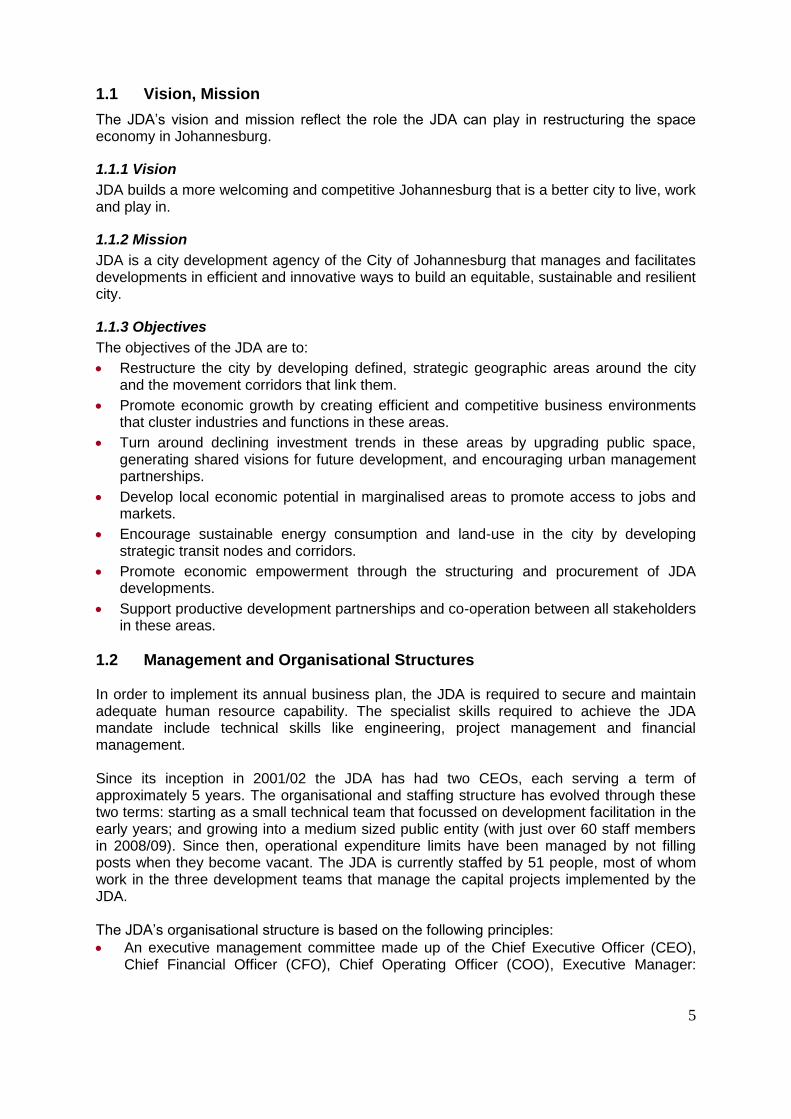
In 2011/12 there are 65 approved positions, of which 51 are filled posts; 10 are unfunded vacant positions; and 6 are funded vacant posts. The challenge in JDA, as in other entities in the public sector operating in similar technical and engineering environment, remains the attraction and retention of qualified personnel with requisite specialist engineering and project management skills. The JDA, however, always endeavours to retain its technical teams, as they are core to our work.
Figure showing JDA structure in 2011/12
7
2. EXECUTIVE SUMMARY
The Joburg 2040 GDS, launched in October 2011, responds to the multiple challenges and uncertain futures faced by the city. To cope with change, the City of Johannesburg aims to strengthen the adaptive capacity of the City and its citizens, so that it may become more resilient to potential and unpredictable futures. Rather than develop a blueprint plan for the future, the Joburg 2040 GDS lays the foundation for multi-level, integrated responses to the challenges the city faces.
The Joburg 2040 GDS is driven by the goal of capable and capacitated communities and individuals. With this realised, the City of Johannesburg will be able to achieve a more sustainable, inclusive future, in which communities and the individuals who live in them hold the potential and the means to imagine and grow their neighbourhoods, their communities and themselves. A balanced focus on the environment management and services, good governance, economic growth and human and social development will assist in achieving a resilient and sustainable city – and a city in which all aspire to live.
This business plan for the JDA for 2012/13 responds to the GDS 2040 ideals of resilience, liveability and sustainability. It represents the culmination of a cross-sectoral strategic planning process that has involved all CoJ Departments and Municipal Entities in cluster discussions that have defined four outcome-driven programmes for the new 5-year Integrated Development Plan (IDP).
This business plan gives effect to many cross-cutting strategic objectives, but for practical purposes it is located as part of the Sustainable Services Cluster and responds to the need to develop a resilient, liveable, sustainable urban environment - underpinned by infrastructure supportive of a low carbon economy - in Johannesburg.
The JDA will structure its operations into three key sub-programmes within the Sustainable Services Cluster:
i) The Greenways programme that focuses on providing resilient, liveable and sustainable environments within the City by using roads, rivers and transport modes to promote walking, cycling, and sustainable public transport. This programme includes the continued roll-out of the Rea Vaya BRT infrastructure and service.
ii) A Transit oriented development programme that encourages optimal development of transit hubs and corridors across the city, which provide access to affordable accommodation and transport, high quality public spaces and amenities, and good community services.
iii) A programme on priority area planning and implementation that shifts the design of the city – including elements like streets, buildings and spaces of work and play – to improve liveability and create sustainable human settlements.
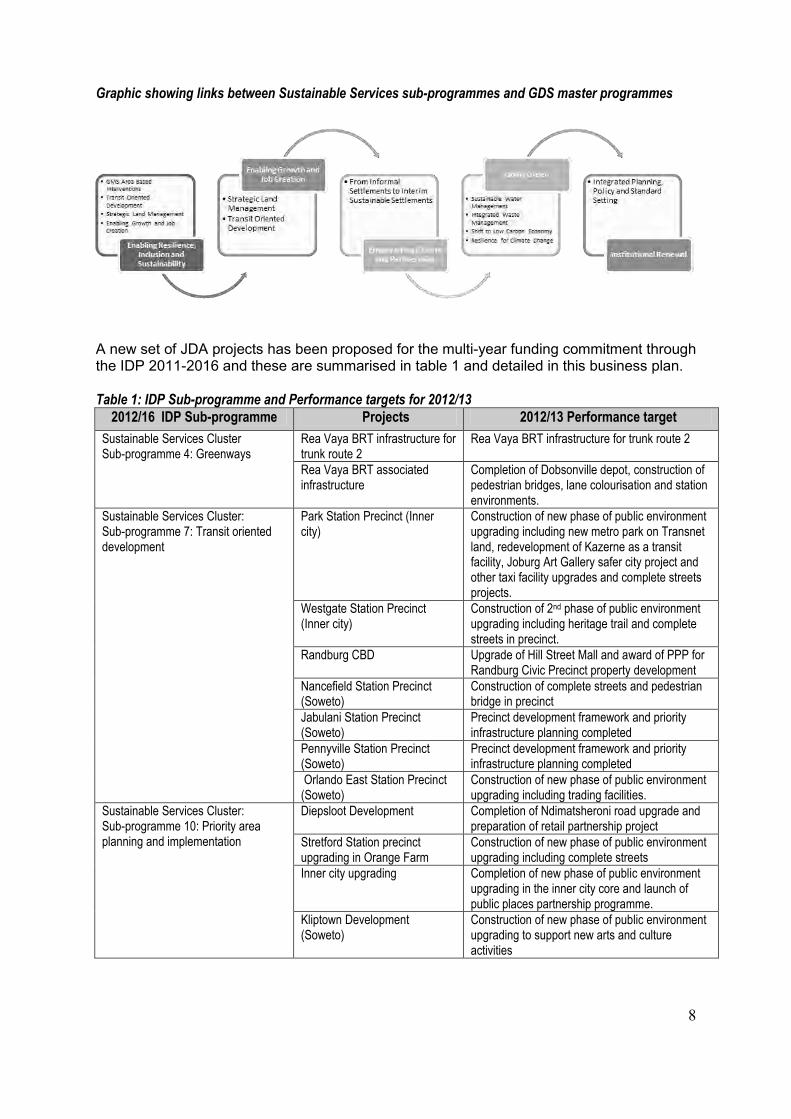
All three of these programmes are intended to restructure the space economy to give poor households better access to well-located accommodation, jobs and markets; Optimise land use and energy consumption; and improve living standards and mobility for large numbers of people in well serviced and managed transit neighbourhoods. They link back to three of the master programmes outlined in the GDS 2040: Enabling resilience, inclusion and sustainability; enabling growth and job creation; and going green as shown in the figure overleaf.
8
Graphic showing links between Sustainable Services sub-programmes and GDS master programmes
A new set of JDA projects has been proposed for the multi-year funding commitment through the IDP 2011-2016 and these are summarised in table 1 and detailed in this business plan. Table 1: IDP Sub-programme and Performance targets for 2012/13
2012/16 IDP Sub-programme Projects 2012/13 Performance target
Sustainable Services Cluster Sub-programme 4: Greenways
Rea Vaya BRT infrastructure for trunk route 2
Rea Vaya BRT infrastructure for trunk route 2
Rea Vaya BRT associated infrastructure
Completion of Dobsonville depot, construction of pedestrian bridges, lane colourisation and station environments.
Sustainable Services Cluster: Sub-programme 7: Transit oriented development
Park Station Precinct (Inner city)
Construction of new phase of public environment upgrading including new metro park on Transnet land, redevelopment of Kazerne as a transit facility, Joburg Art Gallery safer city project and other taxi facility upgrades and complete streets projects.
Westgate Station Precinct (Inner city)
Construction of 2nd phase of public environment upgrading including heritage trail and complete streets in precinct.
Randburg CBD Upgrade of Hill Street Mall and award of PPP for Randburg Civic Precinct property development
Nancefield Station Precinct (Soweto)
Construction of complete streets and pedestrian bridge in precinct
Jabulani Station Precinct (Soweto)
Precinct development framework and priority infrastructure planning completed
Pennyville Station Precinct (Soweto)
Precinct development framework and priority infrastructure planning completed
Orlando East Station Precinct (Soweto)
Construction of new phase of public environment upgrading including trading facilities.
Sustainable Services Cluster: Sub-programme 10: Priority area planning and implementation
Diepsloot Development Completion of Ndimatsheroni road upgrade and preparation of retail partnership project
Stretford Station precinct upgrading in Orange Farm
Construction of new phase of public environment upgrading including complete streets
Inner city upgrading Completion of new phase of public environment upgrading in the inner city core and launch of public places partnership programme.
Kliptown Development (Soweto)
Construction of new phase of public environment upgrading to support new arts and culture activities
9
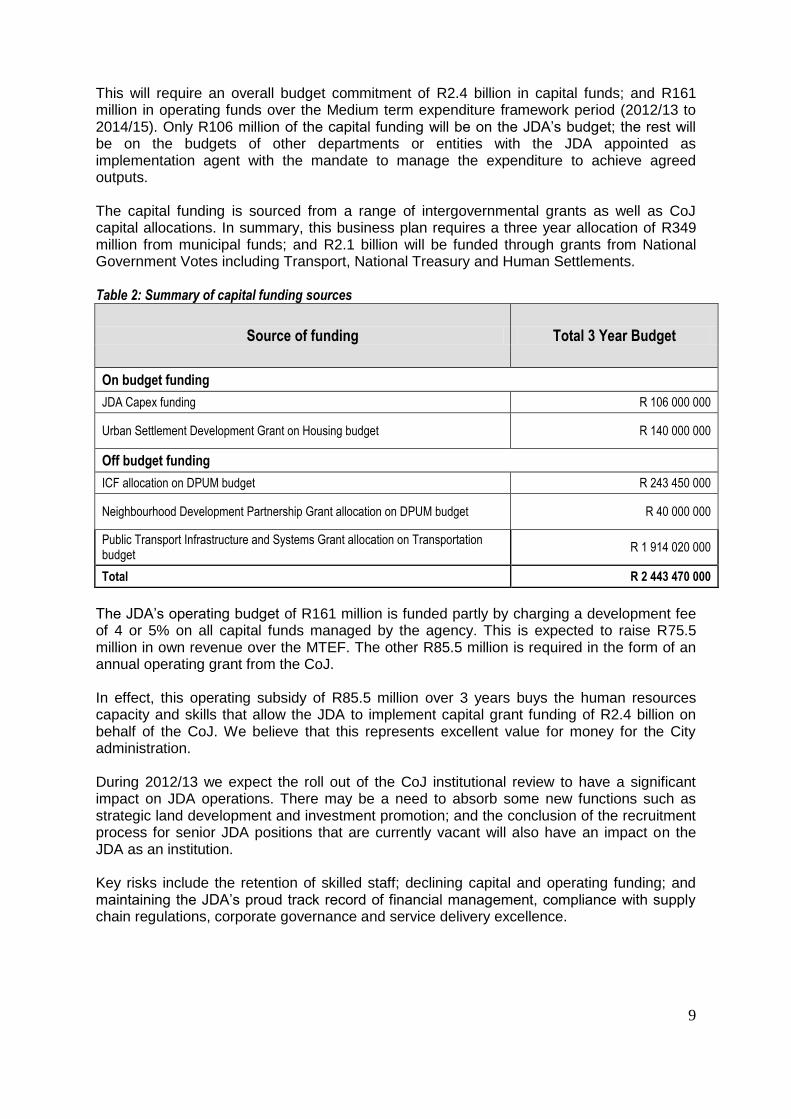
This will require an overall budget commitment of R2.4 billion in capital funds; and R161 million in operating funds over the Medium term expenditure framework period (2012/13 to 2014/15). Only R106 million of the capital funding will be on the JDA‟s budget; the rest will be on the budgets of other departments or entities with the JDA appointed as implementation agent with the mandate to manage the expenditure to achieve agreed outputs. The capital funding is sourced from a range of intergovernmental grants as well as CoJ capital allocations. In summary, this business plan requires a three year allocation of R349 million from municipal funds; and R2.1 billion will be funded through grants from National Government Votes including Transport, National Treasury and Human Settlements. Table 2: Summary of capital funding sources
Source of funding Total 3 Year Budget
On budget funding
JDA Capex funding R 106 000 000
Urban Settlement Development Grant on Housing budget R 140 000 000
Off budget funding
ICF allocation on DPUM budget R 243 450 000
Neighbourhood Development Partnership Grant allocation on DPUM budget R 40 000 000
Public Transport Infrastructure and Systems Grant allocation on Transportation budget
R 1 914 020 000
Total R 2 443 470 000
The JDA‟s operating budget of R161 million is funded partly by charging a development fee of 4 or 5% on all capital funds managed by the agency. This is expected to raise R75.5 million in own revenue over the MTEF. The other R85.5 million is required in the form of an annual operating grant from the CoJ. In effect, this operating subsidy of R85.5 million over 3 years buys the human resources capacity and skills that allow the JDA to implement capital grant funding of R2.4 billion on behalf of the CoJ. We believe that this represents excellent value for money for the City administration. During 2012/13 we expect the roll out of the CoJ institutional review to have a significant impact on JDA operations. There may be a need to absorb some new functions such as strategic land development and investment promotion; and the conclusion of the recruitment process for senior JDA positions that are currently vacant will also have an impact on the JDA as an institution. Key risks include the retention of skilled staff; declining capital and operating funding; and maintaining the JDA‟s proud track record of financial management, compliance with supply chain regulations, corporate governance and service delivery excellence.
10
3. STRATEGIC ANALYSIS
The Joburg 2040 Growth and Development Strategy (GDS) responds to the multiple challenges and uncertain futures faced by the city. To cope with change, the City of Johannesburg aims to strengthen the adaptive capacity of the City and its citizens, so that it may become more resilient to potential and unpredictable futures. Rather than develop a blueprint plan for the future, the Joburg 2040 GDS lays the foundation for multi-level, multi-scalar and integrated responses to the challenges the city faces. According to the analysis undertaken for the GDS 2040, the legacy of Apartheid continues to dominate the national context. The inequality and divisions based on race and class continue to affect all sectors of society. Some stubborn problems persist – including low levels of education, income inequality, chronic poverty and crippling unemployment, which continue to plague South Africa. There is evidence that these conditions have not improved substantially over the last decade. To compound matters, the global financial downturn, climate change and energy insecurity are driving multiple hardships worldwide, impacting on South African growth prospects.
The following factors are important in terms of their impact on the national perspective:
Global-local financial downturn;
The New Growth Path strategy;
The „youth question‟ and the difficulties faced in respect of youth unemployment;
Addressing the future of energy;
Integrating policy imperatives – the Presidency Outcomes;
Integrating policy imperatives – the work of the NPC;
Political imperatives; and
The Millennium Development Goals. This revised Joburg GDS 2040 offers a vision, mission and framing paradigm and principles, alongside outcomes, outputs and indicators. Four major outcomes define the GDS 2040. Each outcome is linked to a corresponding set of outputs and one or more indicators of success. The outcomes originate from the GDS paradigm, and analysis. Two outcomes are particularly relevant to the JDA business plan:
Outcome 2: Provide a resilient, liveable, sustainable urban environment – underpinned by infrastructure supportive of a low carbon economy
The City plans to lead in the establishment of sustainable and eco-efficient infrastructure solutions (e.g. housing, eco-mobility, energy, water, waste, sanitation and information and communications technology), to create a landscape that is liveable, environmentally resilient, sustainable, and supportive of low carbon economy initiatives.
Outcome 3: An inclusive, job-intensive, resilient and competitive economy that harnesses the potential of citizens
The GDS 2040 emphasises that “the City of Johannesburg will focus on supporting the creation an even-more competitive, „smart‟ and resilient city economy, when measured in relation to national, continent and global performance. The City will promote economic growth and sustainability through the meaningful mobilisation of all who work and live here, and through collaborating with others to build job-intensive long-term growth and prosperity, from which all can benefit.”
11
3.1. Quality, a compact built form and incremental development builds resilience
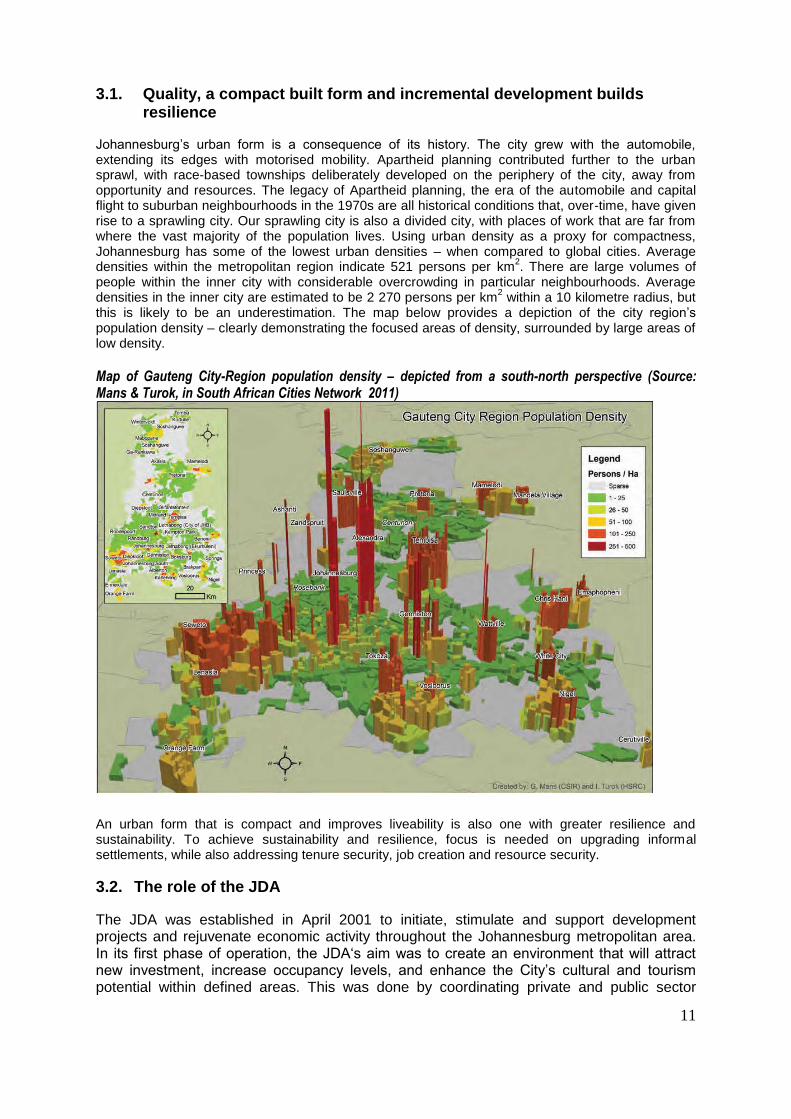
Johannesburg‟s urban form is a consequence of its history. The city grew with the automobile, extending its edges with motorised mobility. Apartheid planning contributed further to the urban sprawl, with race-based townships deliberately developed on the periphery of the city, away from opportunity and resources. The legacy of Apartheid planning, the era of the automobile and capital flight to suburban neighbourhoods in the 1970s are all historical conditions that, over-time, have given rise to a sprawling city. Our sprawling city is also a divided city, with places of work that are far from where the vast majority of the population lives. Using urban density as a proxy for compactness, Johannesburg has some of the lowest urban densities – when compared to global cities. Average densities within the metropolitan region indicate 521 persons per km
2. There are large volumes of
people within the inner city with considerable overcrowding in particular neighbourhoods. Average densities in the inner city are estimated to be 2 270 persons per km
2 within a 10 kilometre radius, but
this is likely to be an underestimation. The map below provides a depiction of the city region‟s population density – clearly demonstrating the focused areas of density, surrounded by large areas of low density.
Map of Gauteng City-Region population density – depicted from a south-north perspective (Source: Mans & Turok, in South African Cities Network 2011)
An urban form that is compact and improves liveability is also one with greater resilience and sustainability. To achieve sustainability and resilience, focus is needed on upgrading informal settlements, while also addressing tenure security, job creation and resource security.
3.2. The role of the JDA
The JDA was established in April 2001 to initiate, stimulate and support development projects and rejuvenate economic activity throughout the Johannesburg metropolitan area. In its first phase of operation, the JDA„s aim was to create an environment that will attract new investment, increase occupancy levels, and enhance the City‟s cultural and tourism potential within defined areas. This was done by coordinating private and public sector
12
interventions and managing capital investment into area-based economic development initiatives throughout the Johannesburg metropolitan area. The specific and agreed objectives of the JDA were to:
promote economic growth through the development and promotion of efficient business environments in defined geographic areas.
regenerate decaying areas of the city so as to enhance their ability to contribute to the economic development of the city and the quality of life of its residents.
promote economic empowerment through the structuring and procurement of JDA developments.
promote productive partnerships and cooperation between all relevant stakeholders on area-based initiatives.
develop best practice and organisational expertise in respect of area-based development management.
In general, the JDA's interventions were directed at the urban and economic regeneration of large-scale, multi-faceted areas. The Agency intentionally avoided small-scale or piecemeal interventions in favour of bold and integrated developments. The JDA also drew on the history of the city to create new symbols of the city, such as the Nelson Mandela Bridge and Constitution Hill, which are significant to all its residents.
In the second phase of operations (between 2006 and 2011) the JDA continued to focus on developing strategic areas across the city. These included the establishment of integrated sport precincts in Nasrec and Ellis Park, the dedicated busways and bus stations for the new Rea Vaya Bus Rapid Transit system and the development of historically marginalised areas such Orlando West, Orange Farm and Diepsloot.
The new Mayoral term presents an opportunity for the JDA to play a key role in restructuring the space economy to achieve the ideals of resilience, equity and sustainability.
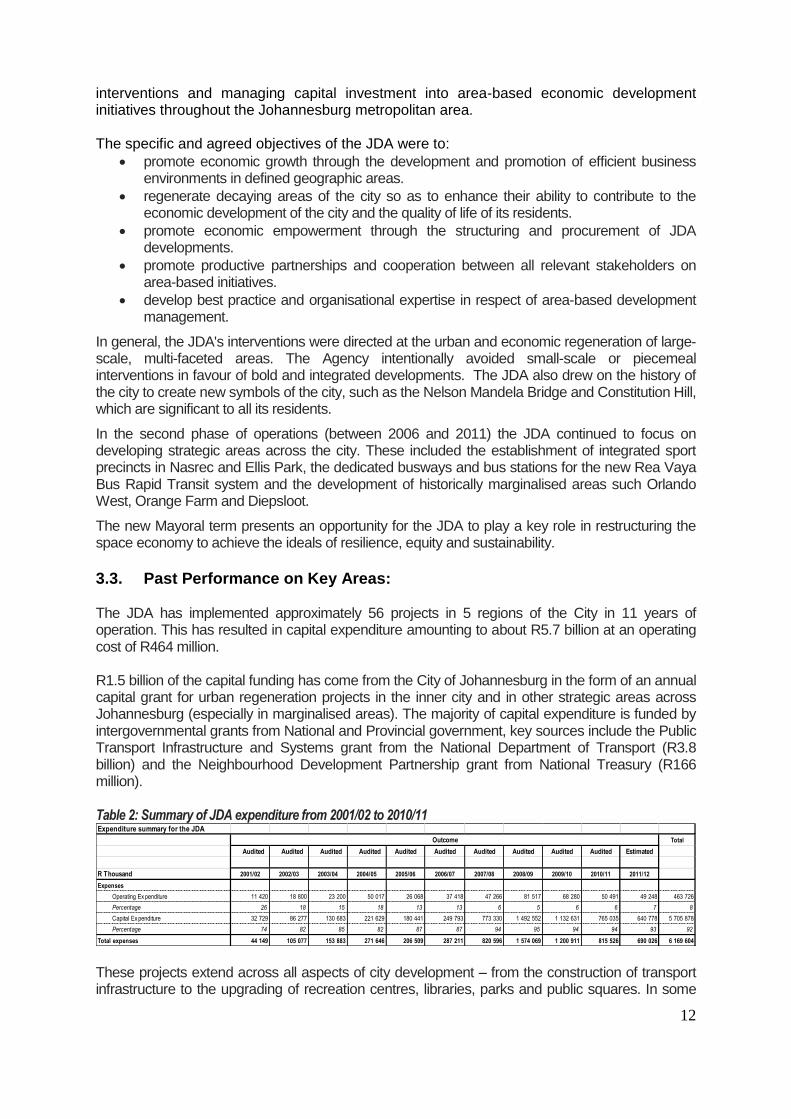
3.3. Past Performance on Key Areas: The JDA has implemented approximately 56 projects in 5 regions of the City in 11 years of operation. This has resulted in capital expenditure amounting to about R5.7 billion at an operating cost of R464 million. R1.5 billion of the capital funding has come from the City of Johannesburg in the form of an annual capital grant for urban regeneration projects in the inner city and in other strategic areas across Johannesburg (especially in marginalised areas). The majority of capital expenditure is funded by intergovernmental grants from National and Provincial government, key sources include the Public Transport Infrastructure and Systems grant from the National Department of Transport (R3.8 billion) and the Neighbourhood Development Partnership grant from National Treasury (R166 million). Table 2: Summary of JDA expenditure from 2001/02 to 2010/11 Expenditure summary for the JDA
Total
Audited Audited Audited Audited Audited Audited Audited Audited Audited Audited Estimated
R Thousand 2001/02 2002/03 2003/04 2004/05 2005/06 2006/07 2007/08 2008/09 2009/10 2010/11 2011/12
Expenses
Operating Ex penditure 11 420 18 800 23 200 50 017 26 068 37 418 47 266 81 517 68 280 50 491 49 248 463 726
Percentage 26 18 15 18 13 13 6 5 6 6 7 8
Capital Ex penditure 32 729 86 277 130 683 221 629 180 441 249 793 773 330 1 492 552 1 132 631 765 035 640 778 5 705 878
Percentage 74 82 85 82 87 87 94 95 94 94 93 92
Total expenses 44 149 105 077 153 883 271 646 206 509 287 211 820 596 1 574 069 1 200 911 815 526 690 026 6 169 604
Outcome
These projects extend across all aspects of city development – from the construction of transport infrastructure to the upgrading of recreation centres, libraries, parks and public squares. In some
13
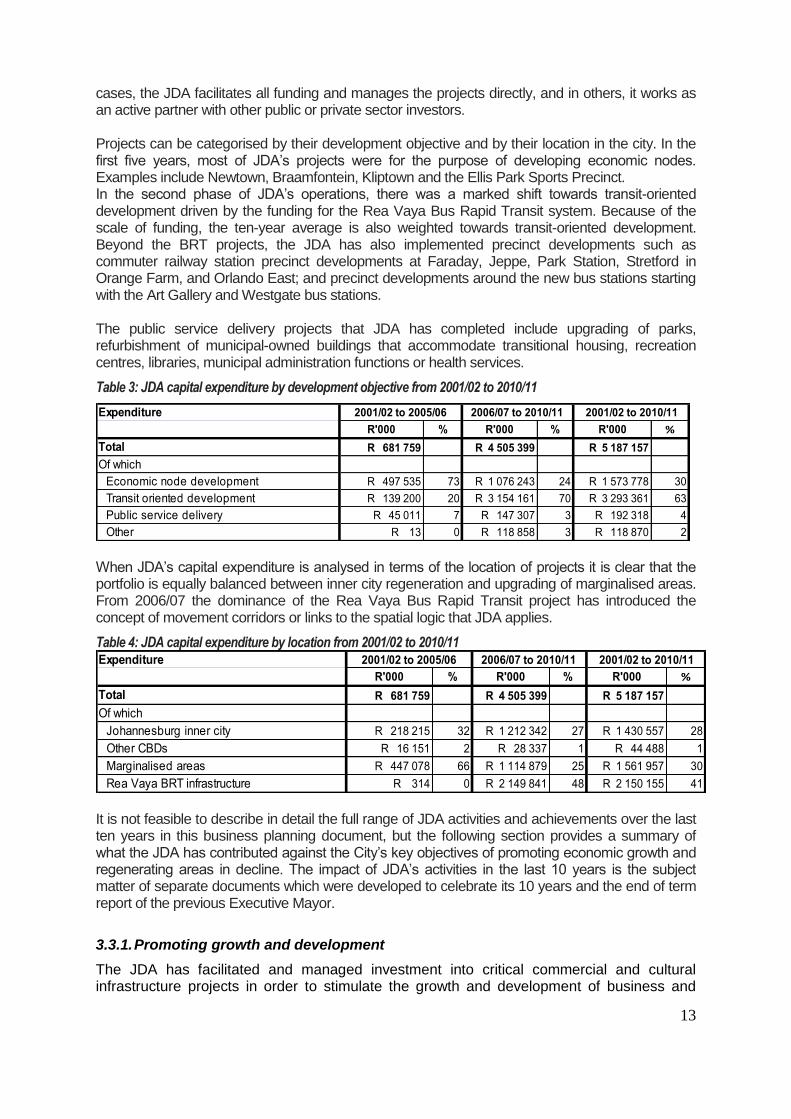
cases, the JDA facilitates all funding and manages the projects directly, and in others, it works as an active partner with other public or private sector investors. Projects can be categorised by their development objective and by their location in the city. In the first five years, most of JDA‟s projects were for the purpose of developing economic nodes. Examples include Newtown, Braamfontein, Kliptown and the Ellis Park Sports Precinct. In the second phase of JDA‟s operations, there was a marked shift towards transit-oriented development driven by the funding for the Rea Vaya Bus Rapid Transit system. Because of the scale of funding, the ten-year average is also weighted towards transit-oriented development. Beyond the BRT projects, the JDA has also implemented precinct developments such as commuter railway station precinct developments at Faraday, Jeppe, Park Station, Stretford in Orange Farm, and Orlando East; and precinct developments around the new bus stations starting with the Art Gallery and Westgate bus stations. The public service delivery projects that JDA has completed include upgrading of parks, refurbishment of municipal-owned buildings that accommodate transitional housing, recreation centres, libraries, municipal administration functions or health services.
Table 3: JDA capital expenditure by development objective from 2001/02 to 2010/11
Expenditure
R'000 % R'000 % R'000 %
Total R 681 759 R 4 505 399 R 5 187 157
Of which
Economic node development R 497 535 73 R 1 076 243 24 R 1 573 778 30
Transit oriented development R 139 200 20 R 3 154 161 70 R 3 293 361 63
Public service delivery R 45 011 7 R 147 307 3 R 192 318 4
Other R 13 0 R 118 858 3 R 118 870 2
2001/02 to 2005/06 2006/07 to 2010/11 2001/02 to 2010/11
When JDA‟s capital expenditure is analysed in terms of the location of projects it is clear that the portfolio is equally balanced between inner city regeneration and upgrading of marginalised areas. From 2006/07 the dominance of the Rea Vaya Bus Rapid Transit project has introduced the concept of movement corridors or links to the spatial logic that JDA applies.
Table 4: JDA capital expenditure by location from 2001/02 to 2010/11 Expenditure
R'000 % R'000 % R'000 %
Total R 681 759 R 4 505 399 R 5 187 157
Of which
Johannesburg inner city R 218 215 32 R 1 212 342 27 R 1 430 557 28
Other CBDs R 16 151 2 R 28 337 1 R 44 488 1
Marginalised areas R 447 078 66 R 1 114 879 25 R 1 561 957 30
Rea Vaya BRT infrastructure R 314 0 R 2 149 841 48 R 2 150 155 41
2001/02 to 2005/06 2006/07 to 2010/11 2001/02 to 2010/11
It is not feasible to describe in detail the full range of JDA activities and achievements over the last ten years in this business planning document, but the following section provides a summary of what the JDA has contributed against the City‟s key objectives of promoting economic growth and regenerating areas in decline. The impact of JDA‟s activities in the last 10 years is the subject matter of separate documents which were developed to celebrate its 10 years and the end of term report of the previous Executive Mayor.
3.3.1. Promoting growth and development
The JDA has facilitated and managed investment into critical commercial and cultural infrastructure projects in order to stimulate the growth and development of business and
14
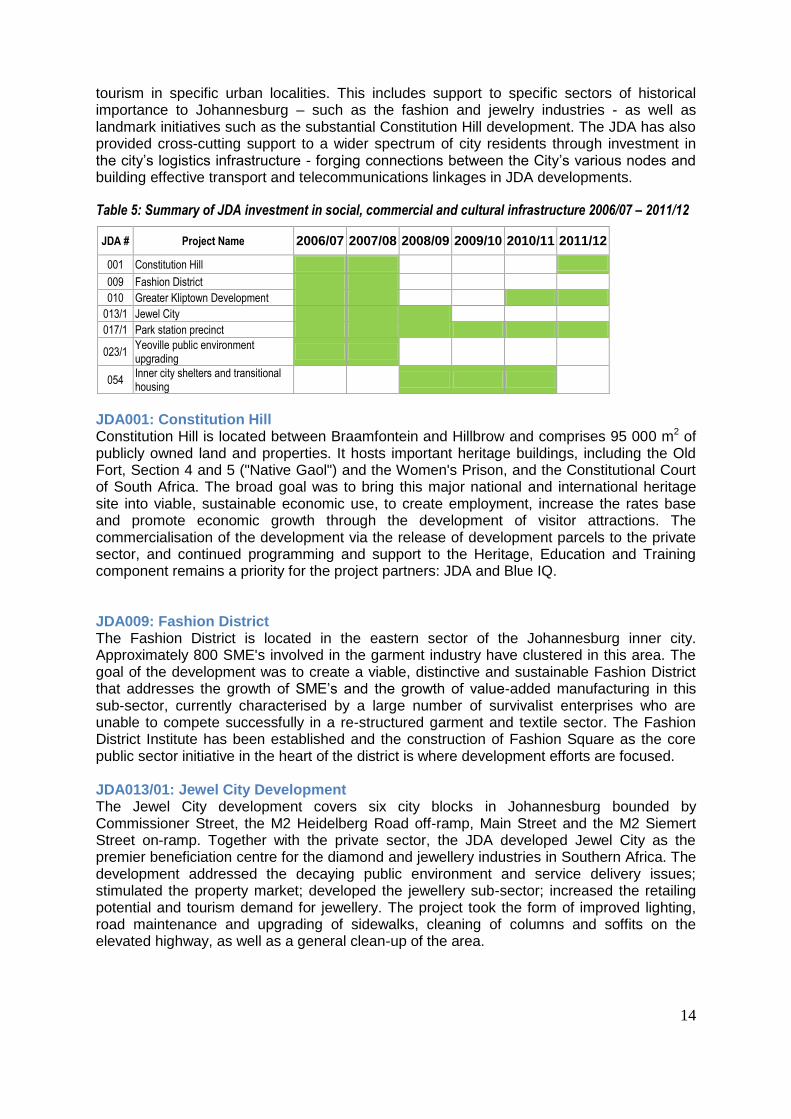
tourism in specific urban localities. This includes support to specific sectors of historical importance to Johannesburg – such as the fashion and jewelry industries - as well as landmark initiatives such as the substantial Constitution Hill development. The JDA has also provided cross-cutting support to a wider spectrum of city residents through investment in the city‟s logistics infrastructure - forging connections between the City‟s various nodes and building effective transport and telecommunications linkages in JDA developments.
Table 5: Summary of JDA investment in social, commercial and cultural infrastructure 2006/07 – 2011/12
JDA # Project Name 2006/07 2007/08 2008/09 2009/10 2010/11 2011/12
001 Constitution Hill
009 Fashion District
010 Greater Kliptown Development
013/1 Jewel City
017/1 Park station precinct
023/1 Yeoville public environment upgrading
054 Inner city shelters and transitional housing
JDA001: Constitution Hill Constitution Hill is located between Braamfontein and Hillbrow and comprises 95 000 m2 of publicly owned land and properties. It hosts important heritage buildings, including the Old Fort, Section 4 and 5 ("Native Gaol") and the Women's Prison, and the Constitutional Court of South Africa. The broad goal was to bring this major national and international heritage site into viable, sustainable economic use, to create employment, increase the rates base and promote economic growth through the development of visitor attractions. The commercialisation of the development via the release of development parcels to the private sector, and continued programming and support to the Heritage, Education and Training component remains a priority for the project partners: JDA and Blue IQ. JDA009: Fashion District The Fashion District is located in the eastern sector of the Johannesburg inner city. Approximately 800 SME's involved in the garment industry have clustered in this area. The goal of the development was to create a viable, distinctive and sustainable Fashion District that addresses the growth of SME‟s and the growth of value-added manufacturing in this sub-sector, currently characterised by a large number of survivalist enterprises who are unable to compete successfully in a re-structured garment and textile sector. The Fashion District Institute has been established and the construction of Fashion Square as the core public sector initiative in the heart of the district is where development efforts are focused. JDA013/01: Jewel City Development The Jewel City development covers six city blocks in Johannesburg bounded by Commissioner Street, the M2 Heidelberg Road off-ramp, Main Street and the M2 Siemert Street on-ramp. Together with the private sector, the JDA developed Jewel City as the premier beneficiation centre for the diamond and jewellery industries in Southern Africa. The development addressed the decaying public environment and service delivery issues; stimulated the property market; developed the jewellery sub-sector; increased the retailing potential and tourism demand for jewellery. The project took the form of improved lighting, road maintenance and upgrading of sidewalks, cleaning of columns and soffits on the elevated highway, as well as a general clean-up of the area.
15
JDA017/01: Park City Precinct Gauteng‟s public transport system will significantly improve with the introduction of the Gautrain Rapid Rail Link. The JDA acted as development manager for the precinct around the station in Park City. This development focused on intermodal transport facilities in the Joubert Park area in order to establish an efficient and effective transport campus that addresses congestion and contestation of space issues experienced in this hub of transportation activity. Development outputs included upgrading of sidewalks and lighting around Park Station. This initial intervention was extended through the implementation of the Art Gallery Rea Vaya station precinct and commuter links upgrades in later years. JDA023/01: Yeoville public environment upgrade The need to reinstate Rockey-Raleigh Street in Yeoville as a functioning and effective neighbourhood high street was addressed through a public environment upgrade that includes the creation of a civic node around the local park and upgrading of street frontages to ensure a safe and secure built environment where economic activity can grow. JDA undertook an upgrade of the road, specifically focusing on street lighting, a reconfiguration of parking, construction of a library in a renovated heritage building, refurbishment of the recreation centre, and upgrading of the park. JDA054: Inner City Shelters and transitional housing The Inner City sees a large concentration of extremely vulnerable groups. These include street children, the aged, orphans and vulnerable children (including child headed households), the destitute and homeless, abused women, and the severely physically challenged. The social support needs of these vulnerable groups are diverse, but there are also certain needs in common. In particular, the primary need of many of the individuals in these groups is for some form of shelter. Formal shelters, and support programmes run through these shelters, are a key need. While many shelters do exist, run by churches, NGOs and other public-benefit organisations, they need a sustained support well above the levels currently being provided.
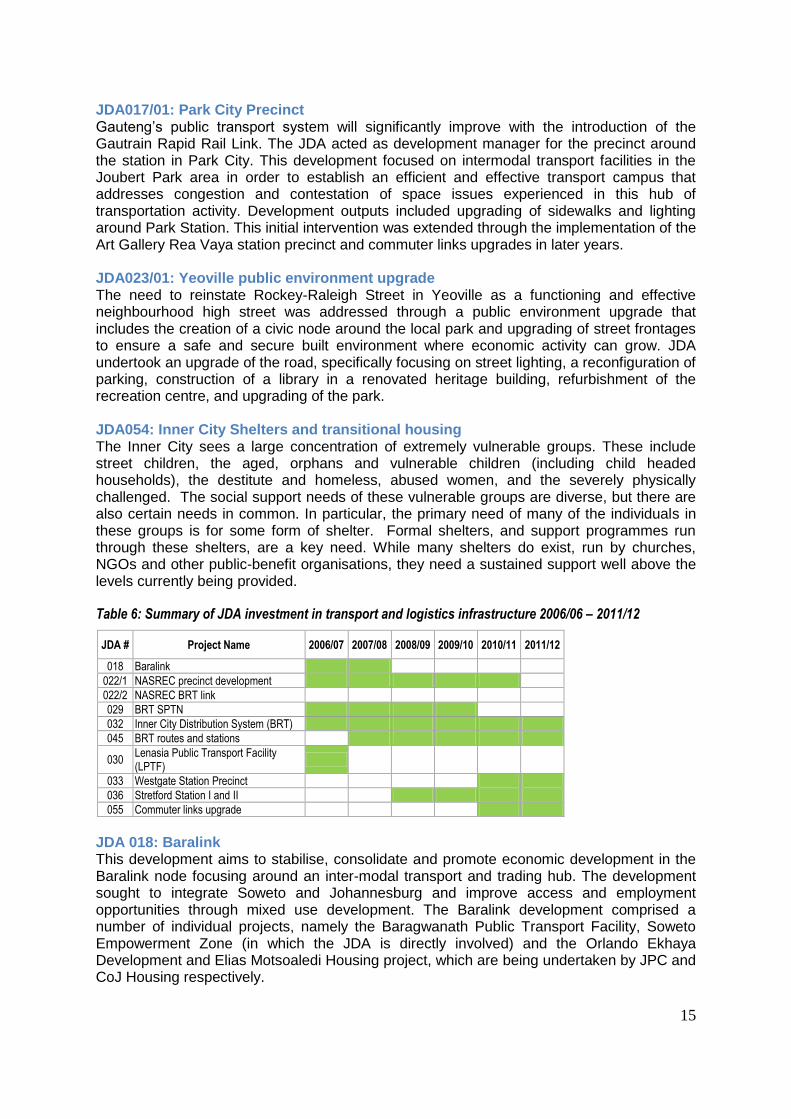
Table 6: Summary of JDA investment in transport and logistics infrastructure 2006/06 – 2011/12
JDA # Project Name 2006/07 2007/08 2008/09 2009/10 2010/11 2011/12
018 Baralink
022/1 NASREC precinct development
022/2 NASREC BRT link
029 BRT SPTN
032 Inner City Distribution System (BRT)
045 BRT routes and stations
030 Lenasia Public Transport Facility (LPTF)
033 Westgate Station Precinct
036 Stretford Station I and II
055 Commuter links upgrade
JDA 018: Baralink This development aims to stabilise, consolidate and promote economic development in the Baralink node focusing around an inter-modal transport and trading hub. The development sought to integrate Soweto and Johannesburg and improve access and employment opportunities through mixed use development. The Baralink development comprised a number of individual projects, namely the Baragwanath Public Transport Facility, Soweto Empowerment Zone (in which the JDA is directly involved) and the Orlando Ekhaya Development and Elias Motsoaledi Housing project, which are being undertaken by JPC and CoJ Housing respectively.
16
JDA 022/1: NASREC transport hub This development aimed to facilitate economic growth and development through spatial and economic development and appropriate density and land-use interventions that reinforce the economies of urbanisation. The NASREC development focused on growing and enhancing business opportunities in conferences and exhibitions, sporting (and especially the role of Soccer City in the 2010 World Cup) housing and mixed use development of publicly and privately owned land. The area incorporates nationally, and internationally significant businesses (including the Nasrec Expo Centre – the largest expo centre in Africa, and Soccer City - a world class, 90 000 seat stadium, and the under-utilised Crown Mines golf course). JDA 029: Rea Vaya Bus Rapid Transit system (formerly the Strategic Public Transport
Network (SPTN)) The City of Johannesburg has received funding from the National Department of Transport to fund the implementation of the Strategic Public Transportation Network and the JDA is implementing this multi-year project on behalf of the CoJ‟s Department of Transportation. The SPTN was intended to consist of special public transport lanes and intersections, running north and south of the city, and west and east. Transport interchange nodes will be created, where commuters can switch from one form of transport to another. They will eventually be able to buy a single ticket, making travel via the different means of transport; rail, bus, taxi a seamless journey. The network was intended to comprise the proposed "Flagship Project" of two public transport priority corridors stretching east west from Alexandra to Roodepoort and north-south from Sunninghill to Soweto. The first phase of the network, took the form of the Rea Vaya Bus Rapid Transit system with dedicated trunk bus ways constructed from Thokoza Park in Soweto to Ellis Park, with an inner city distribution system of dedicated lanes and bus stations.
JDA 032: Inner City Distribution System In response to the need for a reliable, frequent and low cost service to allow people to move efficiently around the city, the Inner City Distribution System was proposed to be included in the BRT. The system serves to reduce congestion, promote economic growth in the city and popularise public transport. The 16 kilometres of new bus routes through the inner city are an integral part of the BRT trunk route to Soweto. The service has begun to popularise public transport and provides an attractive and cheaper alternative for many private car and taxi commuters.
JDA 045: Trunk Routes 1A and 1B BRT is the idea of creating a rail-like mass transit service using road-based technologies that are more affordable than new railway lines. It refers to a high quality bus-based transit system that delivers fast, comfortable, and cost-effective urban mobility through the provision of segregated right-of-way infrastructure, rapid and frequent operations, and excellence in marketing and customer service. Specifically, the Rea Vaya BRT proposal calls for a total of 94 kilometres of trunk corridors encompassing a total routing length of approximately 148 kilometres. Routes have been selected in order to give the customer maximum flexibility with a minimum of cumbersome transfer. The City has received funding from the National Department of Transport to fund the implementation of the Rea Vaya BRT infrastructure and system. Trunk route 1A runs from Thokoza Park in Soweto, enters the inner city near Westgate Station and ends at Ellis Park on the Eastern side of the inner city. This section was completed and buses began running in August 2009. Up to 34 000 people use the service every day. Trunk route 1B runs from Soweto, through the institutional spine where hospitals and universities are clustered, and enters the inner city near the Metro Centre. The infrastructure on this route should be complete by October 2011.
17
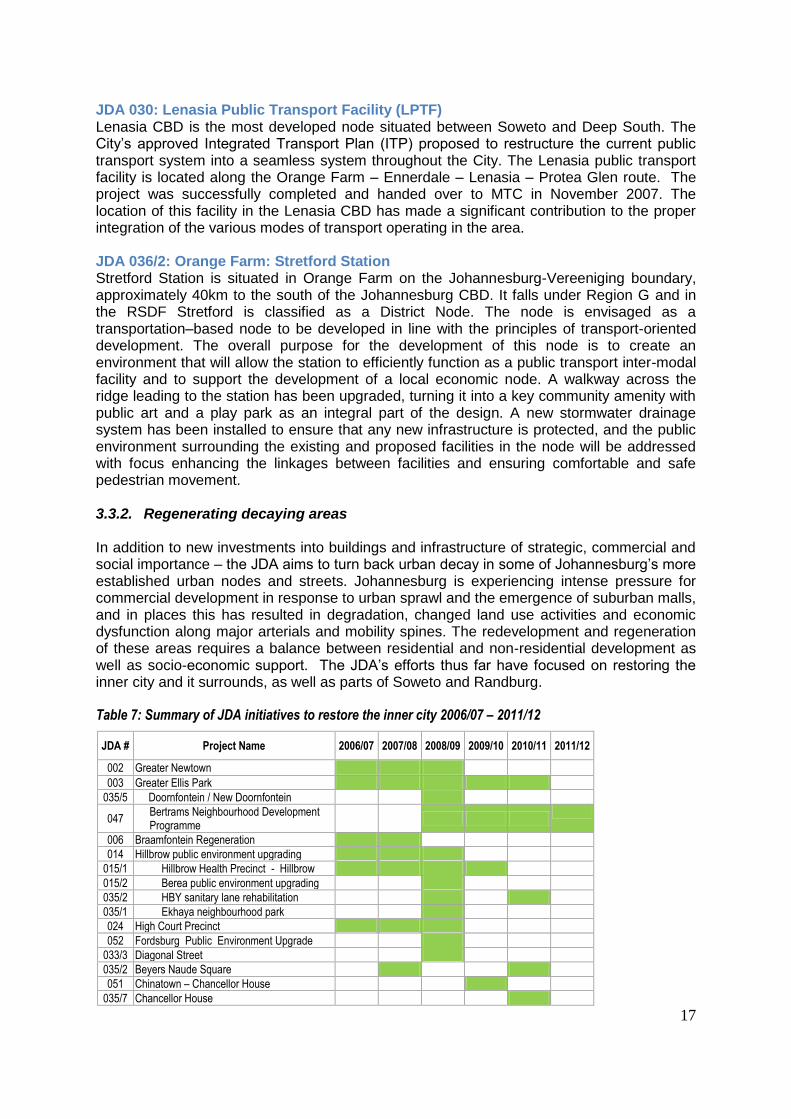
JDA 030: Lenasia Public Transport Facility (LPTF) Lenasia CBD is the most developed node situated between Soweto and Deep South. The City‟s approved Integrated Transport Plan (ITP) proposed to restructure the current public transport system into a seamless system throughout the City. The Lenasia public transport facility is located along the Orange Farm – Ennerdale – Lenasia – Protea Glen route. The project was successfully completed and handed over to MTC in November 2007. The location of this facility in the Lenasia CBD has made a significant contribution to the proper integration of the various modes of transport operating in the area. JDA 036/2: Orange Farm: Stretford Station Stretford Station is situated in Orange Farm on the Johannesburg-Vereeniging boundary, approximately 40km to the south of the Johannesburg CBD. It falls under Region G and in the RSDF Stretford is classified as a District Node. The node is envisaged as a transportation–based node to be developed in line with the principles of transport-oriented development. The overall purpose for the development of this node is to create an environment that will allow the station to efficiently function as a public transport inter-modal facility and to support the development of a local economic node. A walkway across the ridge leading to the station has been upgraded, turning it into a key community amenity with public art and a play park as an integral part of the design. A new stormwater drainage system has been installed to ensure that any new infrastructure is protected, and the public environment surrounding the existing and proposed facilities in the node will be addressed with focus enhancing the linkages between facilities and ensuring comfortable and safe pedestrian movement. 3.3.2. Regenerating decaying areas In addition to new investments into buildings and infrastructure of strategic, commercial and social importance – the JDA aims to turn back urban decay in some of Johannesburg‟s more established urban nodes and streets. Johannesburg is experiencing intense pressure for commercial development in response to urban sprawl and the emergence of suburban malls, and in places this has resulted in degradation, changed land use activities and economic dysfunction along major arterials and mobility spines. The redevelopment and regeneration of these areas requires a balance between residential and non-residential development as well as socio-economic support. The JDA‟s efforts thus far have focused on restoring the inner city and it surrounds, as well as parts of Soweto and Randburg.
Table 7: Summary of JDA initiatives to restore the inner city 2006/07 – 2011/12
JDA # Project Name 2006/07 2007/08 2008/09 2009/10 2010/11 2011/12
002 Greater Newtown
003 Greater Ellis Park
035/5 Doornfontein / New Doornfontein
047 Bertrams Neighbourhood Development Programme
006 Braamfontein Regeneration
014 Hillbrow public environment upgrading
015/1 Hillbrow Health Precinct - Hillbrow
015/2 Berea public environment upgrading
035/2 HBY sanitary lane rehabilitation
035/1 Ekhaya neighbourhood park
024 High Court Precinct
052 Fordsburg Public Environment Upgrade
033/3 Diagonal Street
035/2 Beyers Naude Square
051 Chinatown – Chancellor House
035/7 Chancellor House
18
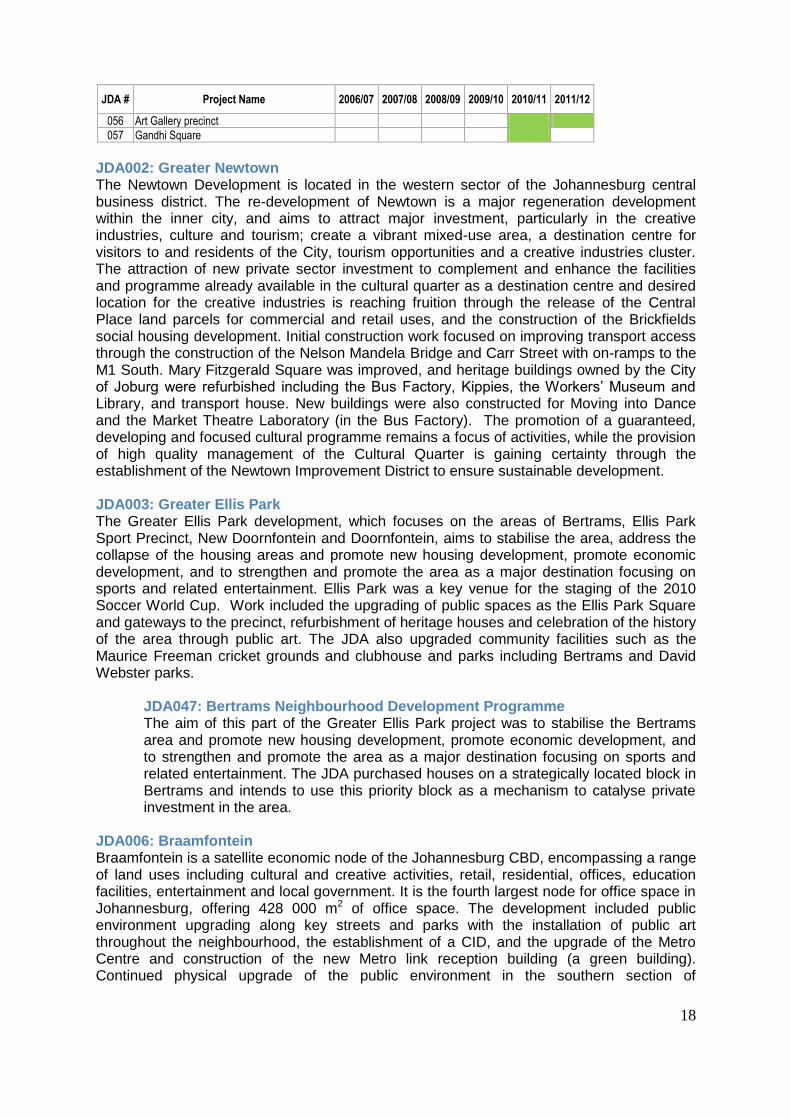
JDA # Project Name 2006/07 2007/08 2008/09 2009/10 2010/11 2011/12
056 Art Gallery precinct
057 Gandhi Square
JDA002: Greater Newtown The Newtown Development is located in the western sector of the Johannesburg central business district. The re-development of Newtown is a major regeneration development within the inner city, and aims to attract major investment, particularly in the creative industries, culture and tourism; create a vibrant mixed-use area, a destination centre for visitors to and residents of the City, tourism opportunities and a creative industries cluster. The attraction of new private sector investment to complement and enhance the facilities and programme already available in the cultural quarter as a destination centre and desired location for the creative industries is reaching fruition through the release of the Central Place land parcels for commercial and retail uses, and the construction of the Brickfields social housing development. Initial construction work focused on improving transport access through the construction of the Nelson Mandela Bridge and Carr Street with on-ramps to the M1 South. Mary Fitzgerald Square was improved, and heritage buildings owned by the City of Joburg were refurbished including the Bus Factory, Kippies, the Workers‟ Museum and Library, and transport house. New buildings were also constructed for Moving into Dance and the Market Theatre Laboratory (in the Bus Factory). The promotion of a guaranteed, developing and focused cultural programme remains a focus of activities, while the provision of high quality management of the Cultural Quarter is gaining certainty through the establishment of the Newtown Improvement District to ensure sustainable development. JDA003: Greater Ellis Park The Greater Ellis Park development, which focuses on the areas of Bertrams, Ellis Park Sport Precinct, New Doornfontein and Doornfontein, aims to stabilise the area, address the collapse of the housing areas and promote new housing development, promote economic development, and to strengthen and promote the area as a major destination focusing on sports and related entertainment. Ellis Park was a key venue for the staging of the 2010 Soccer World Cup. Work included the upgrading of public spaces as the Ellis Park Square and gateways to the precinct, refurbishment of heritage houses and celebration of the history of the area through public art. The JDA also upgraded community facilities such as the Maurice Freeman cricket grounds and clubhouse and parks including Bertrams and David Webster parks.
JDA047: Bertrams Neighbourhood Development Programme The aim of this part of the Greater Ellis Park project was to stabilise the Bertrams area and promote new housing development, promote economic development, and to strengthen and promote the area as a major destination focusing on sports and related entertainment. The JDA purchased houses on a strategically located block in Bertrams and intends to use this priority block as a mechanism to catalyse private investment in the area.
JDA006: Braamfontein Braamfontein is a satellite economic node of the Johannesburg CBD, encompassing a range of land uses including cultural and creative activities, retail, residential, offices, education facilities, entertainment and local government. It is the fourth largest node for office space in Johannesburg, offering 428 000 m2 of office space. The development included public environment upgrading along key streets and parks with the installation of public art throughout the neighbourhood, the establishment of a CID, and the upgrade of the Metro Centre and construction of the new Metro link reception building (a green building). Continued physical upgrade of the public environment in the southern section of
19
Braamfontein is being undertaken through the commuter links project to integrate related redevelopment efforts of the private sector. JDA 014: Hillbrow Berea and Yeoville The City wanted to take action to make Hillbrow, Berea and Yeoville more economically self-sustaining, with increased employment potential and improved quality of life for residents. The need to create holistic and integrated neighbourhoods of choice and inclusion was seen as critical to turn around the trend of decline. There have been a variety of interventions undertaken by JDA since 2006/07 (including public environment upgrading, parks development, and the installation of public art) the focus has been on developing a Hillbrow Health Precinct, supporting the Ekhaya Neighbourhood, and Yeoville‟s high street.
JDA015: Medical Precincts: Hillbrow Health Precinct This development aims to stabilize, consolidate and promote economic development in the Medical precinct north and south of the Constitution Hill area. The founding vision of the Johannesburg Medical Quarter (JMQ) was to create an environment that enables delivery of excellent, affordable, comprehensive health services, research and development through partnerships between public, private, not-for-profit organisations and academic institutions. The JDA‟s strategy has been to support the achievement of the Hillbrow Health precinct vision with an emphasis on strengthening and growing economic activities in the health sector primary economy and giving impetus to the development of a range of viable secondary supportive economic activities. The upgrading of the public environment including construction of new parking facilities, the clustering of NGOs and other primary health care facilities in the Hugh Solomon Building and facilitation support to the Esselen Street Centre of Excellence have been completed.
JDA035: Inner City Core Projects Despite many successes the Johannesburg Inner City has not yet been fully stabilised and urban decline continues in some areas. This manifests in a number of symptoms including deteriorated public environments; poorly supported and controlled informal activities; hijacked buildings and continued levels of petty crime. However there is increasing evidence that the City‟s interventions are revitalising the Inner City and leading to increased private sector confidence and investment. In support of the Inner City Charter the CoJ has committed money to the Inner City Fund in order to undertake key infrastructure and other projects that will continue to promote the redevelopment of the Inner City and attract private investors. The challenge going forward is to scale up regeneration efforts to ensure more rapid, even and sustained positive impacts on the entire inner city, without having a detrimental effect on inner city communities. The inner city core has been the focus of a range of interventions. Since 2007 these have been defined through the Inner City Charter, but early projects include the High Court Precinct, Gauteng Province Precinct and others.
JDA 024: High Court Precinct The High Court Precinct Development was a public private initiative involving the Central Johannesburg Partnership (CJP), private property owners, the Judiciary and Public Works. The boundaries of the precinct are determined as Von Brandis, Pritchard and Von Wielleigh Streets. The intention of the project was to recreate the space using the High Court and the activities related as the main driver to development. This included ensuring greater and more secure public space, more suitable public facilities and traffic controls that cater for the large volume of pedestrians in the area.
20
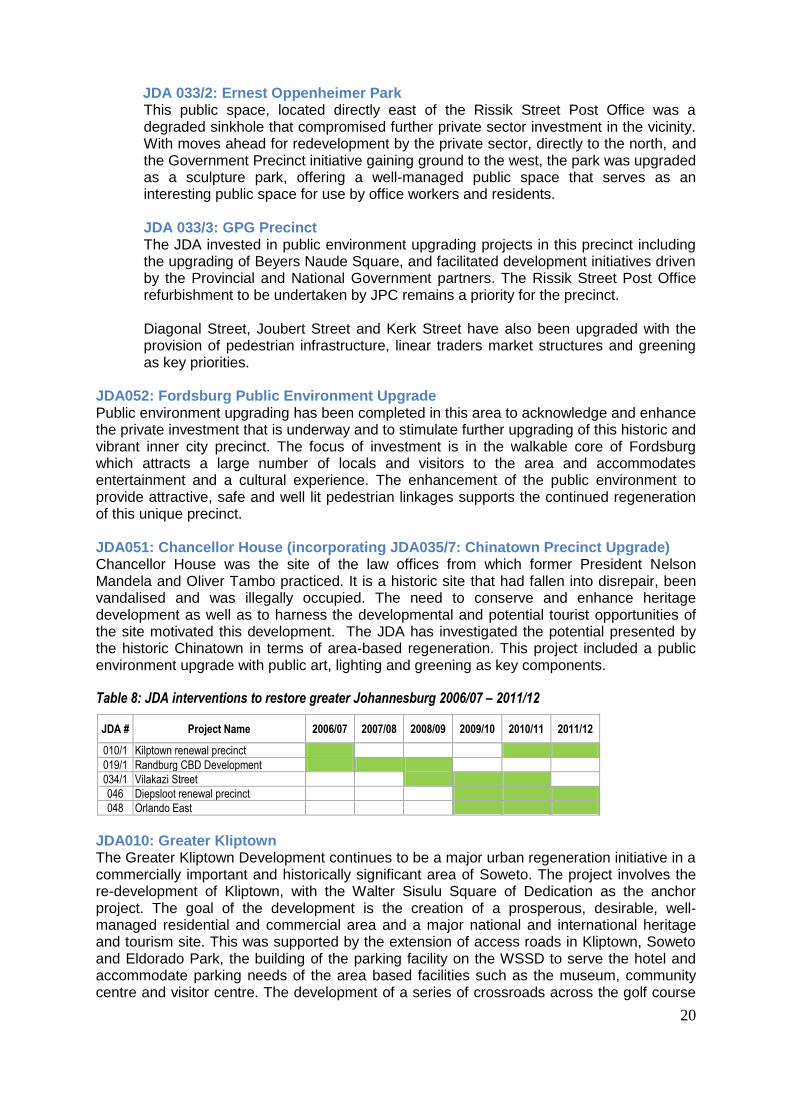
JDA 033/2: Ernest Oppenheimer Park This public space, located directly east of the Rissik Street Post Office was a degraded sinkhole that compromised further private sector investment in the vicinity. With moves ahead for redevelopment by the private sector, directly to the north, and the Government Precinct initiative gaining ground to the west, the park was upgraded as a sculpture park, offering a well-managed public space that serves as an interesting public space for use by office workers and residents. JDA 033/3: GPG Precinct The JDA invested in public environment upgrading projects in this precinct including the upgrading of Beyers Naude Square, and facilitated development initiatives driven by the Provincial and National Government partners. The Rissik Street Post Office refurbishment to be undertaken by JPC remains a priority for the precinct. Diagonal Street, Joubert Street and Kerk Street have also been upgraded with the provision of pedestrian infrastructure, linear traders market structures and greening as key priorities.
JDA052: Fordsburg Public Environment Upgrade Public environment upgrading has been completed in this area to acknowledge and enhance the private investment that is underway and to stimulate further upgrading of this historic and vibrant inner city precinct. The focus of investment is in the walkable core of Fordsburg which attracts a large number of locals and visitors to the area and accommodates entertainment and a cultural experience. The enhancement of the public environment to provide attractive, safe and well lit pedestrian linkages supports the continued regeneration of this unique precinct. JDA051: Chancellor House (incorporating JDA035/7: Chinatown Precinct Upgrade) Chancellor House was the site of the law offices from which former President Nelson Mandela and Oliver Tambo practiced. It is a historic site that had fallen into disrepair, been vandalised and was illegally occupied. The need to conserve and enhance heritage development as well as to harness the developmental and potential tourist opportunities of the site motivated this development. The JDA has investigated the potential presented by the historic Chinatown in terms of area-based regeneration. This project included a public environment upgrade with public art, lighting and greening as key components.
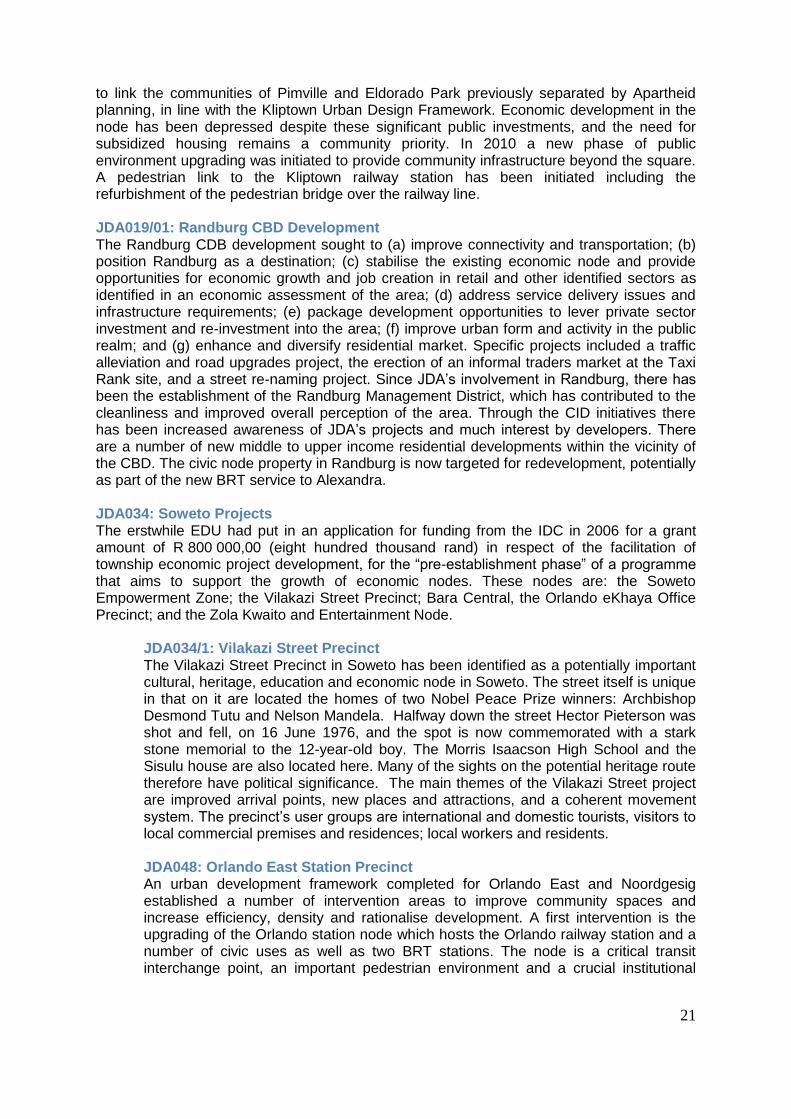
Table 8: JDA interventions to restore greater Johannesburg 2006/07 – 2011/12
JDA # Project Name 2006/07 2007/08 2008/09 2009/10 2010/11 2011/12
010/1 Kilptown renewal precinct
019/1 Randburg CBD Development
034/1 Vilakazi Street
046 Diepsloot renewal precinct
048 Orlando East
JDA010: Greater Kliptown The Greater Kliptown Development continues to be a major urban regeneration initiative in a commercially important and historically significant area of Soweto. The project involves the re-development of Kliptown, with the Walter Sisulu Square of Dedication as the anchor project. The goal of the development is the creation of a prosperous, desirable, well-managed residential and commercial area and a major national and international heritage and tourism site. This was supported by the extension of access roads in Kliptown, Soweto and Eldorado Park, the building of the parking facility on the WSSD to serve the hotel and accommodate parking needs of the area based facilities such as the museum, community centre and visitor centre. The development of a series of crossroads across the golf course
21
to link the communities of Pimville and Eldorado Park previously separated by Apartheid planning, in line with the Kliptown Urban Design Framework. Economic development in the node has been depressed despite these significant public investments, and the need for subsidized housing remains a community priority. In 2010 a new phase of public environment upgrading was initiated to provide community infrastructure beyond the square. A pedestrian link to the Kliptown railway station has been initiated including the refurbishment of the pedestrian bridge over the railway line. JDA019/01: Randburg CBD Development The Randburg CDB development sought to (a) improve connectivity and transportation; (b) position Randburg as a destination; (c) stabilise the existing economic node and provide opportunities for economic growth and job creation in retail and other identified sectors as identified in an economic assessment of the area; (d) address service delivery issues and infrastructure requirements; (e) package development opportunities to lever private sector investment and re-investment into the area; (f) improve urban form and activity in the public realm; and (g) enhance and diversify residential market. Specific projects included a traffic alleviation and road upgrades project, the erection of an informal traders market at the Taxi Rank site, and a street re-naming project. Since JDA‟s involvement in Randburg, there has been the establishment of the Randburg Management District, which has contributed to the cleanliness and improved overall perception of the area. Through the CID initiatives there has been increased awareness of JDA‟s projects and much interest by developers. There are a number of new middle to upper income residential developments within the vicinity of the CBD. The civic node property in Randburg is now targeted for redevelopment, potentially as part of the new BRT service to Alexandra. JDA034: Soweto Projects The erstwhile EDU had put in an application for funding from the IDC in 2006 for a grant amount of R 800 000,00 (eight hundred thousand rand) in respect of the facilitation of township economic project development, for the “pre-establishment phase” of a programme that aims to support the growth of economic nodes. These nodes are: the Soweto Empowerment Zone; the Vilakazi Street Precinct; Bara Central, the Orlando eKhaya Office Precinct; and the Zola Kwaito and Entertainment Node.
JDA034/1: Vilakazi Street Precinct The Vilakazi Street Precinct in Soweto has been identified as a potentially important cultural, heritage, education and economic node in Soweto. The street itself is unique in that on it are located the homes of two Nobel Peace Prize winners: Archbishop Desmond Tutu and Nelson Mandela. Halfway down the street Hector Pieterson was shot and fell, on 16 June 1976, and the spot is now commemorated with a stark stone memorial to the 12-year-old boy. The Morris Isaacson High School and the Sisulu house are also located here. Many of the sights on the potential heritage route therefore have political significance. The main themes of the Vilakazi Street project are improved arrival points, new places and attractions, and a coherent movement system. The precinct‟s user groups are international and domestic tourists, visitors to local commercial premises and residences; local workers and residents. JDA048: Orlando East Station Precinct An urban development framework completed for Orlando East and Noordgesig established a number of intervention areas to improve community spaces and increase efficiency, density and rationalise development. A first intervention is the upgrading of the Orlando station node which hosts the Orlando railway station and a number of civic uses as well as two BRT stations. The node is a critical transit interchange point, an important pedestrian environment and a crucial institutional
22
node in Orlando East. It is also the point of arrival for visitors to Orlando stadium. A number of improvements are also recommended for Noordgesig.
JDA046: Diepsloot Development Project Diepsloot is situated in a transition zone between Johannesburg and Tshwane. The Diepsloot project falls within the City‟s marginalised areas programmes and is focused on improving the public environment in Diepsloot as well as promoting private sector investment in the area. The overall objectives of the development plans are to establish Diepsloot as a socially, economically and environmentally sustainable human settlement that is spatially integrated into the City of Johannesburg. A number of interventions in Diepsloot have been undertaken, including the the formalisation of Ngonyama Road, upgrading of the taxi rank, the establishment of traders facilities, and the construction of bridges and pedestrian links.
3.5. Contextual Analysis:
High inequality levels make it more difficult to reduce poverty – even in the context of a growing economy. In highly unequal societies, the poor frequently engage in subsistence living, with this potentially influencing the size of the domestic market, constraining sustained growth. Furthermore, high inequality levels may undermine safety, social cohesion and the realization of social political and civil rights. Inequality can also manifest in unequal access to infrastructure and services. Interventions that consider the gap between the wealthy and the poor, while growing the economic base from which all can benefit, and individual capabilities to meaningfully engage and contribute, have to be top of the agenda for a developmental local government. Inequality is not only experienced through economic deprivation, but is reflected in various other experiences. Resilience is about building economically vibrant neighbourhoods that are diverse and distinct in urban form, structure, density and cultural identity. It requires a re-orientation of the concepts related to service delivery. The current approach focuses on the establishment and growth of sustainable human settlements. Sustainability, however, is not the only outcome viewed as important. A resilient housing market may incorporate many different approaches. In the context of Johannesburg, however, it must confront the uncomfortable reality of informality. To do this, the city must develop a new housing delivery model that changes the typology of the RDP house. The quality of housing and the design of neighbourhoods are critical. A resilient city values the quality of built form over efficient and cheap delivery. The City will only succeed in ensuring the establishment of sustainable and resilient human settlements if the criteria used in decision-making in respect of new neighbourhood development include issues of access, location, mobility, quality and liveability. The key to accelerated and sustainable growth, development and poverty alleviation is infrastructure investment in physical infrastructure, socio-economic infrastructure and technological innovation. This infrastructure plays a fundamental role in safeguarding urban citizens. The ability to develop new infrastructure and extend services to new growth areas is an important aspect of building resilience to increased infrastructure pressures resulting from rapid urbanisation. Infrastructure and urban services that are orientated to ensure resilience, manage demand in multiple ways:
New infrastructure development includes a focus on reduced carbon emissions.
Use is made of integrated planning to manage the demand for infrastructure emerging from new economic growth and increases in population.
Two important features characterise Johannesburg‟s transport system: the majority of residents do not own cars and, in contrast, middle-income residents are resolutely car-oriented. There has however been no viable mass public transport system to facilitate a
23
modal shift change of middle income residents, from private car to public transport. Continued urban sprawl has also created conditions for more intensive private car use. The region‟s road network has to cope with an annual traffic increase rate of 7 percent, with 1.8 million drivers and 2.8 million registered vehicles. The average travel time to work in the region has increased from 41.5 minutes in 1995, to 50 minutes in 2003 (i.e. a 17 percent increase over eight years). By 2040, it is anticipated that Johannesburg will have an extra 2.5 million inhabitants. The existing system, with its dominant mode of private vehicle use, is unsustainable. A larger population with more cars means more congestion – with negative effects for the quality of life of residents, let alone the impact on the environment. Rising fuel costs pose an ever-increasing challenge to road freight, the mini-bus taxi industry and private car users. Petrol and diesel prices in South Africa have trebled in nominal terms over the past five years. In terms of diesel and petrol demand in Gauteng, data from the oil industry (for the period 1995 to 2005) indicates an increase in demand for diesel of 88.69 percent, and an increase in the demand for petrol of 13.92 percent. Apart from increased costs, private cars also affect the environment and quality of air. Cars produce large amounts of air pollution, with liquid fuels recognised as major contributors to greenhouse gas emission rates. 32% of carbon emissions are due to petrol and diesel consumption in Johannesburg according to the 2008 State of the Environment Report. Shifting commuters from private to public transport is therefore a matter of urgency. But to change from private to public transport, those commuters who have a choice must be able to understand the costs of not changing. They will also need to see and experience a qualitative change in the nature of the public transport system (in terms of its safety, reliability, efficiency, affordability and the extent to which each mode is part of an integrated system), for this shift may become a reality. Mass public transport really is one of the few silver bullets through which to deliver resilience and sustainable development. An efficient mass public transportation system creates significant carbon emission savings, while resulting in a city that is less dependent on private vehicles for mobility, and is less exposed to the risk of fuel price shocks. A car-dominated city such as Johannesburg is unprotected from the ever-increasing risks associated with rising fuel prices, especially where these are increasing at a faster rate than incomes. Scaling up and investing in mass public transport is one of the surest ways in which to also address and manage the legacy of Johannesburg‟s Apartheid spatial form, by connecting people and places, and giving those who still remain in disadvantaged township communities access to new opportunities. Multi-modal transport infrastructure will be critical for the goals of greater inclusivity and access to be realised. For planning to be more people-centric, the City should strive to reduce the need for transport and travel in the way it plans areas and approves developments. Being more proactive in the development of mixed-use nodes, appropriately located across the City and region, will also encourage the creation of environments where people can live, work and play – with all activities undertaken in close proximity. Transport nodes should be regarded as key areas for local economic development, with planning taking into consideration economic development factors, and the interests of prospective investors. Planning may include the development of nodes that can address transport needs, while simultaneously promoting reading, learning, access to technology and access to other aspects of the city – including arts, culture, and heritage. The City will need to address urban planning within the context of a greater focus on alternative modes of non-motorised transport, encouraging a modal shift (e.g. to cycling and walking) through the design of streets and pathways that are pedestrian and bicycle friendly. This will need to be supported with infrastructure and systems such as bicycle storage facilities, and the provision of an active policing and monitoring capacity, to drive greater safety – thereby increasing use. Additional measures in this regard may include
24
dedicated lanes, wide sidewalks and in respect of public transport, the inclusion of lay byes. Furthermore, planning should take into consideration possible shifts to the form of the Inner City and others central business districts. One route may include a process of ensuring that the Inner City is a pedestrian and public transport friendly area, through the implementation of policies that exclude cars at certain times, with parking restricted to the edges, and traders managed in a way that acknowledges their contribution but also enables pedestrian accessibility to the sidewalks.
The design of the city – including elements like streets, buildings and spaces of work and play, are powerful determinants of liveability. Liveability is also created through the access citizens have to a range of cultural and social services and facilities. All of these issues require consideration when addressing the concepts incorporated into the national shift towards „sustainable human settlements‟. The policy framework on sustainable human settlements supports the creation of liveable places of work and rest that address spaces in a holistic manner – focusing on issues of accommodation, services, the built environment and the natural environment, alongside issues of cultural identity. The City has achieved high levels of service infrastructure coverage, with over 90 percent of its residents holding access to basic service infrastructure. The challenge, however, is still how to transform our Apartheid city, to build liveable communities and create a more humane city for all. Effective restructuring of the inefficient urban form of the city will require more than the simple management of city growth. There is a need to define, in clear and unambiguous terms, a series of spatial reconfiguration projects that pay careful attention to the form, morphology and structure of the city. A vision, followed by detailed planning equal to the vision and plan of the Apartheid city, is needed. Mobility, integration and access are important drivers to effect change. Mobility serves to counter distance and divisions, providing the means to access areas otherwise only available to the select few – with issues relating to this addressed in the section above. While a system like the BRT is an important tool to address mobility, it is only one intervention – and needs to be supplemented in many other ways. The issue of access is about bringing people closer to jobs, markets, social networks and other opportunities that promote an improved life experience. This is both an important and a fundamental right – with equity of access a key driver. A focus on integration is also critical, not only because the city faces increasing complications as the urban edge spreads, with careful land use management increasingly important in the context of land scarcity. But integration is also essential in a diverse city, where getting to know others is a step towards optimising the creativity and strengths our diversity brings. Integration in the context of housing and human settlements requires a focus on mixed settlements, and the use of other elements of liveability to create spaces and places that encourage interaction and harmonious living. Addressing the Apartheid urban form over the past period has required a focus on two main forms of spatial exclusion. Firstly, exclusion by design, which was based on deliberate underinvestment in township areas and planned township dormitory towns. Secondly, exclusion by decline, with well-located Inner City areas such as Hillbrow, Berea and Yeoville experiencing historical decline as a result of a collapse of the inner-city property market. Inner City regeneration initiatives have done well to address some of the issues of Inner City decline, but cheap, affordable rental supply remains a challenge. Targeted investments in Soweto have broken the cycle of underinvestment in former townships areas – with visible improvement in these property markets. The introduction of the Rea Vaya BRT system has also supported these initiatives, assisting in making areas that were previously viewed as spatially dislocated, more accessible through transport.
25
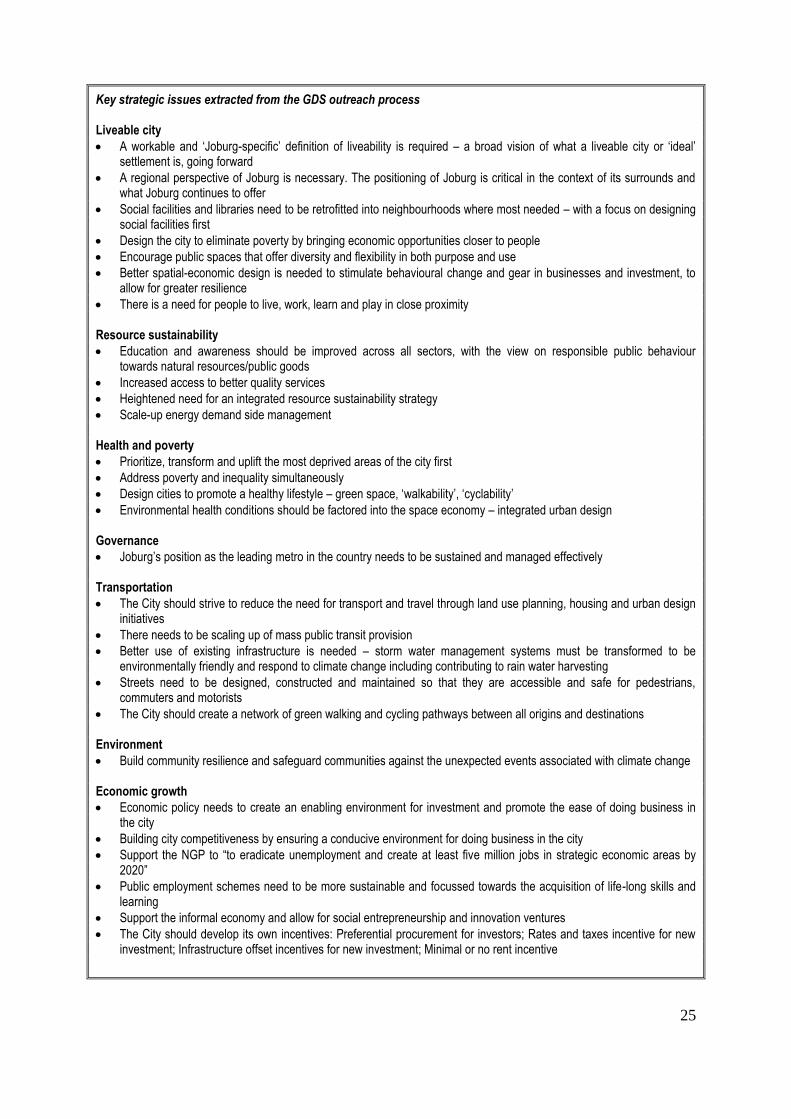
Key strategic issues extracted from the GDS outreach process Liveable city
A workable and „Joburg-specific‟ definition of liveability is required – a broad vision of what a liveable city or „ideal‟ settlement is, going forward
A regional perspective of Joburg is necessary. The positioning of Joburg is critical in the context of its surrounds and what Joburg continues to offer
Social facilities and libraries need to be retrofitted into neighbourhoods where most needed – with a focus on designing social facilities first
Design the city to eliminate poverty by bringing economic opportunities closer to people
Encourage public spaces that offer diversity and flexibility in both purpose and use
Better spatial-economic design is needed to stimulate behavioural change and gear in businesses and investment, to allow for greater resilience
There is a need for people to live, work, learn and play in close proximity Resource sustainability
Education and awareness should be improved across all sectors, with the view on responsible public behaviour towards natural resources/public goods
Increased access to better quality services
Heightened need for an integrated resource sustainability strategy
Scale-up energy demand side management Health and poverty
Prioritize, transform and uplift the most deprived areas of the city first
Address poverty and inequality simultaneously
Design cities to promote a healthy lifestyle – green space, „walkability‟, „cyclability‟
Environmental health conditions should be factored into the space economy – integrated urban design Governance
Joburg‟s position as the leading metro in the country needs to be sustained and managed effectively Transportation
The City should strive to reduce the need for transport and travel through land use planning, housing and urban design initiatives
There needs to be scaling up of mass public transit provision
Better use of existing infrastructure is needed – storm water management systems must be transformed to be environmentally friendly and respond to climate change including contributing to rain water harvesting
Streets need to be designed, constructed and maintained so that they are accessible and safe for pedestrians, commuters and motorists
The City should create a network of green walking and cycling pathways between all origins and destinations Environment
Build community resilience and safeguard communities against the unexpected events associated with climate change Economic growth
Economic policy needs to create an enabling environment for investment and promote the ease of doing business in the city
Building city competitiveness by ensuring a conducive environment for doing business in the city
Support the NGP to “to eradicate unemployment and create at least five million jobs in strategic economic areas by 2020”
Public employment schemes need to be more sustainable and focussed towards the acquisition of life-long skills and learning
Support the informal economy and allow for social entrepreneurship and innovation ventures
The City should develop its own incentives: Preferential procurement for investors; Rates and taxes incentive for new investment; Infrastructure offset incentives for new investment; Minimal or no rent incentive
26
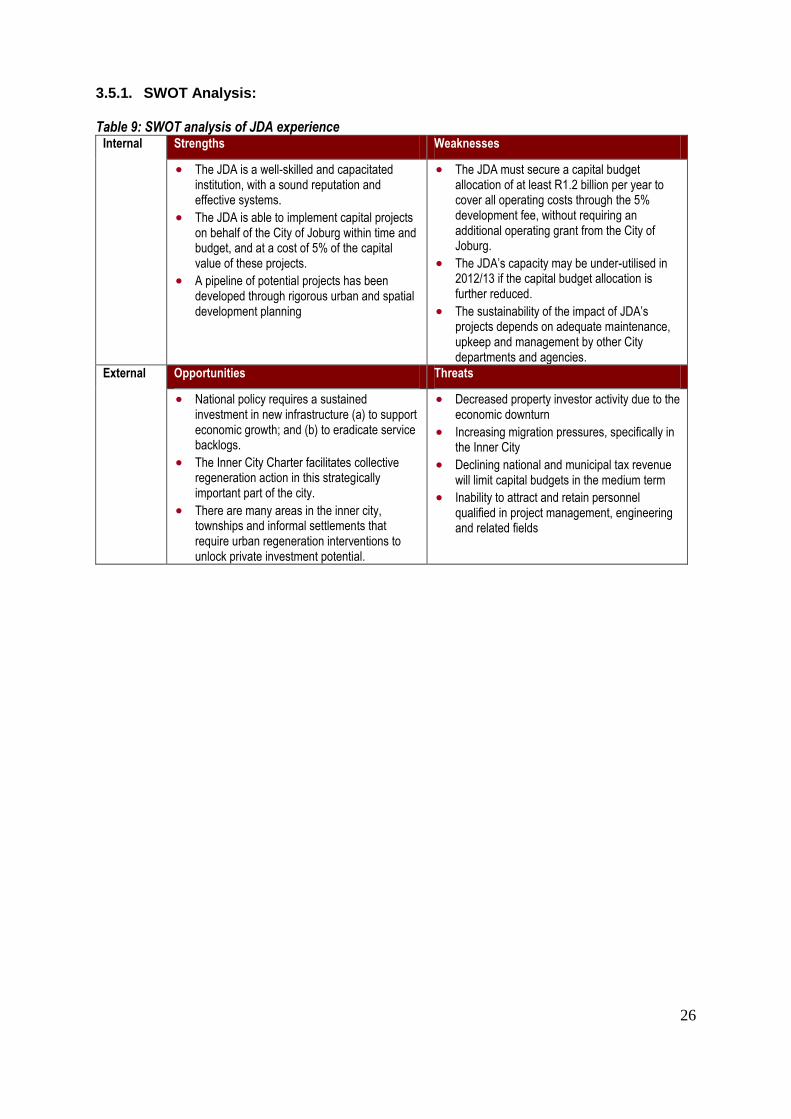
3.5.1. SWOT Analysis: Table 9: SWOT analysis of JDA experience
Internal Strengths Weaknesses
The JDA is a well-skilled and capacitated institution, with a sound reputation and effective systems.
The JDA is able to implement capital projects on behalf of the City of Joburg within time and budget, and at a cost of 5% of the capital value of these projects.
A pipeline of potential projects has been developed through rigorous urban and spatial development planning
The JDA must secure a capital budget allocation of at least R1.2 billion per year to cover all operating costs through the 5% development fee, without requiring an additional operating grant from the City of Joburg.
The JDA‟s capacity may be under-utilised in 2012/13 if the capital budget allocation is further reduced.
The sustainability of the impact of JDA‟s projects depends on adequate maintenance, upkeep and management by other City departments and agencies.
External Opportunities Threats
National policy requires a sustained investment in new infrastructure (a) to support economic growth; and (b) to eradicate service backlogs.
The Inner City Charter facilitates collective regeneration action in this strategically important part of the city.
There are many areas in the inner city, townships and informal settlements that require urban regeneration interventions to unlock private investment potential.
Decreased property investor activity due to the economic downturn
Increasing migration pressures, specifically in the Inner City
Declining national and municipal tax revenue will limit capital budgets in the medium term
Inability to attract and retain personnel qualified in project management, engineering and related fields
27
4. STRATEGIC FOCUS AREA
The JDA‟s strategic objectives are clearly aligned with GDS 2040 for the City of Joburg and in particular with the cluster plan for Sustainable Services in the integrated development plan. Promoting resilient city strategies by restructuring spatial logic is the primary objective towards which the JDA will work in the medium term. This will be achieved through:
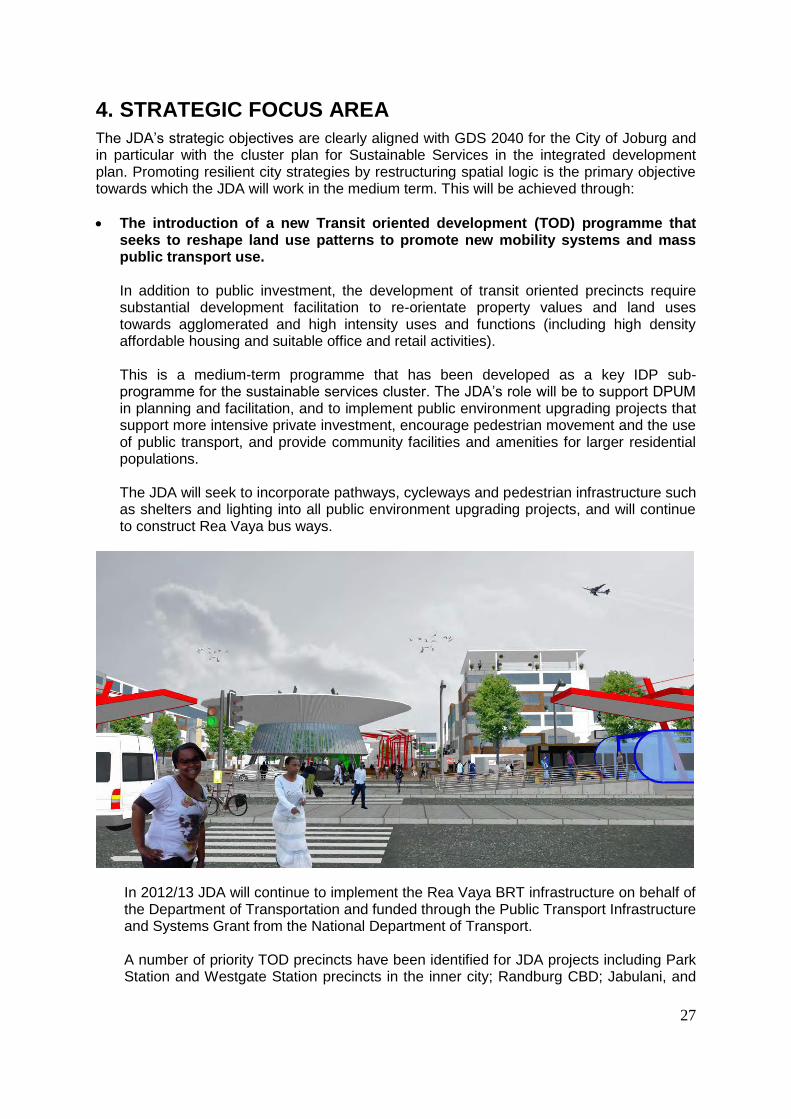
The introduction of a new Transit oriented development (TOD) programme that seeks to reshape land use patterns to promote new mobility systems and mass public transport use. In addition to public investment, the development of transit oriented precincts require substantial development facilitation to re-orientate property values and land uses towards agglomerated and high intensity uses and functions (including high density affordable housing and suitable office and retail activities).
This is a medium-term programme that has been developed as a key IDP sub-programme for the sustainable services cluster. The JDA‟s role will be to support DPUM in planning and facilitation, and to implement public environment upgrading projects that support more intensive private investment, encourage pedestrian movement and the use of public transport, and provide community facilities and amenities for larger residential populations. The JDA will seek to incorporate pathways, cycleways and pedestrian infrastructure such as shelters and lighting into all public environment upgrading projects, and will continue to construct Rea Vaya bus ways.
In 2012/13 JDA will continue to implement the Rea Vaya BRT infrastructure on behalf of the Department of Transportation and funded through the Public Transport Infrastructure and Systems Grant from the National Department of Transport. A number of priority TOD precincts have been identified for JDA projects including Park Station and Westgate Station precincts in the inner city; Randburg CBD; Jabulani, and
28
Nancefield Railway Stations in Soweto; and a number of future TOD precincts that must be planned during this Mayoral term.
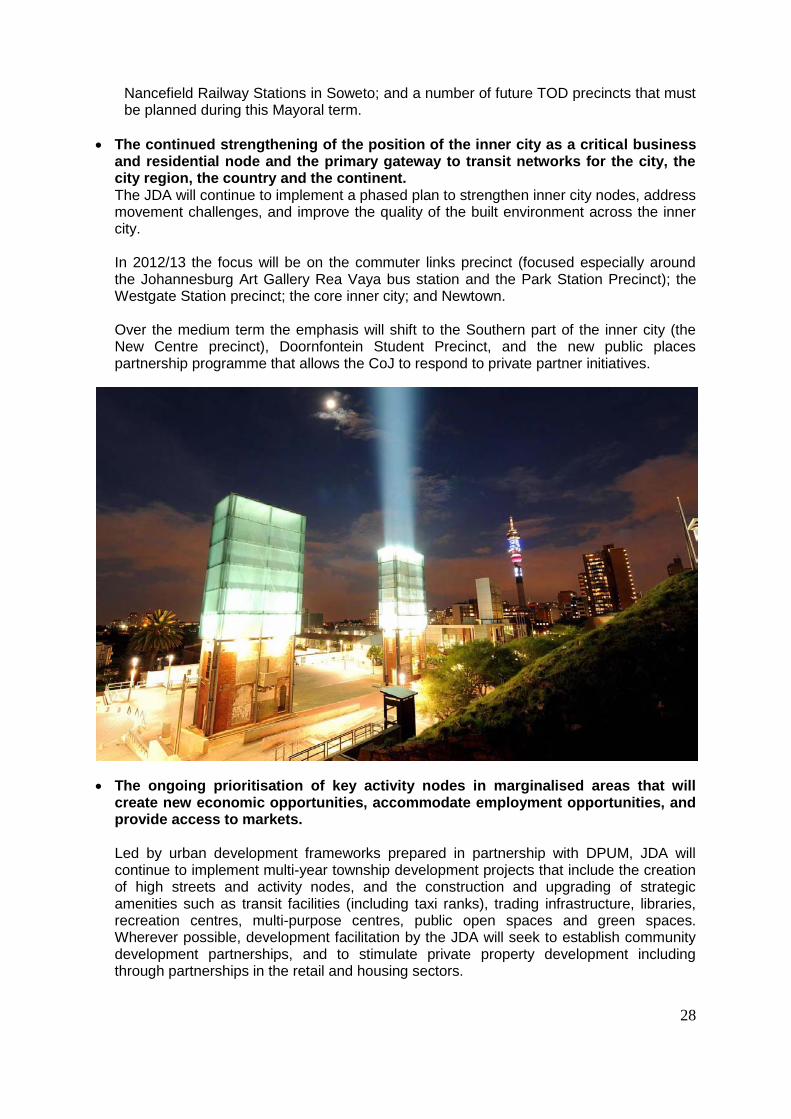
The continued strengthening of the position of the inner city as a critical business and residential node and the primary gateway to transit networks for the city, the city region, the country and the continent.
The JDA will continue to implement a phased plan to strengthen inner city nodes, address movement challenges, and improve the quality of the built environment across the inner city.
In 2012/13 the focus will be on the commuter links precinct (focused especially around
the Johannesburg Art Gallery Rea Vaya bus station and the Park Station Precinct); the Westgate Station precinct; the core inner city; and Newtown.
Over the medium term the emphasis will shift to the Southern part of the inner city (the
New Centre precinct), Doornfontein Student Precinct, and the new public places partnership programme that allows the CoJ to respond to private partner initiatives.
The ongoing prioritisation of key activity nodes in marginalised areas that will create new economic opportunities, accommodate employment opportunities, and provide access to markets.
Led by urban development frameworks prepared in partnership with DPUM, JDA will
continue to implement multi-year township development projects that include the creation of high streets and activity nodes, and the construction and upgrading of strategic amenities such as transit facilities (including taxi ranks), trading infrastructure, libraries, recreation centres, multi-purpose centres, public open spaces and green spaces. Wherever possible, development facilitation by the JDA will seek to establish community development partnerships, and to stimulate private property development including through partnerships in the retail and housing sectors.
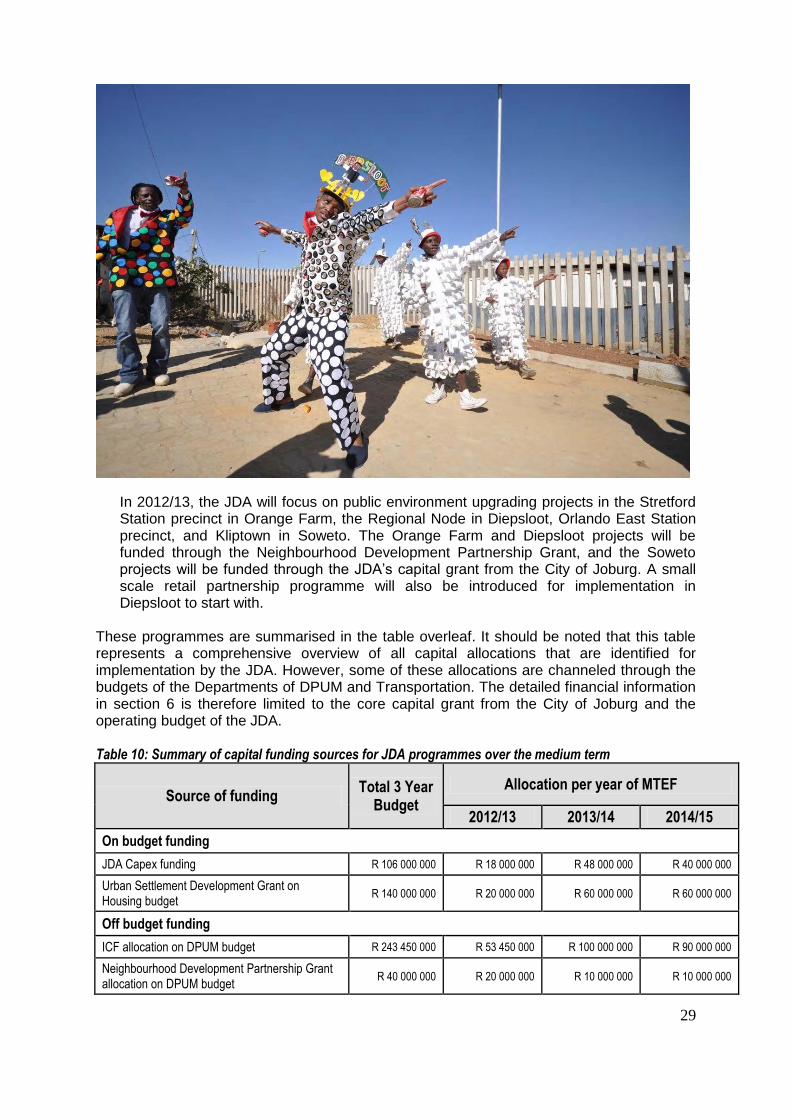
29
In 2012/13, the JDA will focus on public environment upgrading projects in the Stretford Station precinct in Orange Farm, the Regional Node in Diepsloot, Orlando East Station precinct, and Kliptown in Soweto. The Orange Farm and Diepsloot projects will be funded through the Neighbourhood Development Partnership Grant, and the Soweto projects will be funded through the JDA‟s capital grant from the City of Joburg. A small scale retail partnership programme will also be introduced for implementation in Diepsloot to start with.
These programmes are summarised in the table overleaf. It should be noted that this table represents a comprehensive overview of all capital allocations that are identified for implementation by the JDA. However, some of these allocations are channeled through the budgets of the Departments of DPUM and Transportation. The detailed financial information in section 6 is therefore limited to the core capital grant from the City of Joburg and the operating budget of the JDA. Table 10: Summary of capital funding sources for JDA programmes over the medium term
Source of funding Total 3 Year
Budget
Allocation per year of MTEF
2012/13 2013/14 2014/15
On budget funding
JDA Capex funding R 106 000 000 R 18 000 000 R 48 000 000 R 40 000 000
Urban Settlement Development Grant on Housing budget
R 140 000 000 R 20 000 000 R 60 000 000 R 60 000 000
Off budget funding
ICF allocation on DPUM budget R 243 450 000 R 53 450 000 R 100 000 000 R 90 000 000
Neighbourhood Development Partnership Grant allocation on DPUM budget
R 40 000 000 R 20 000 000 R 10 000 000 R 10 000 000
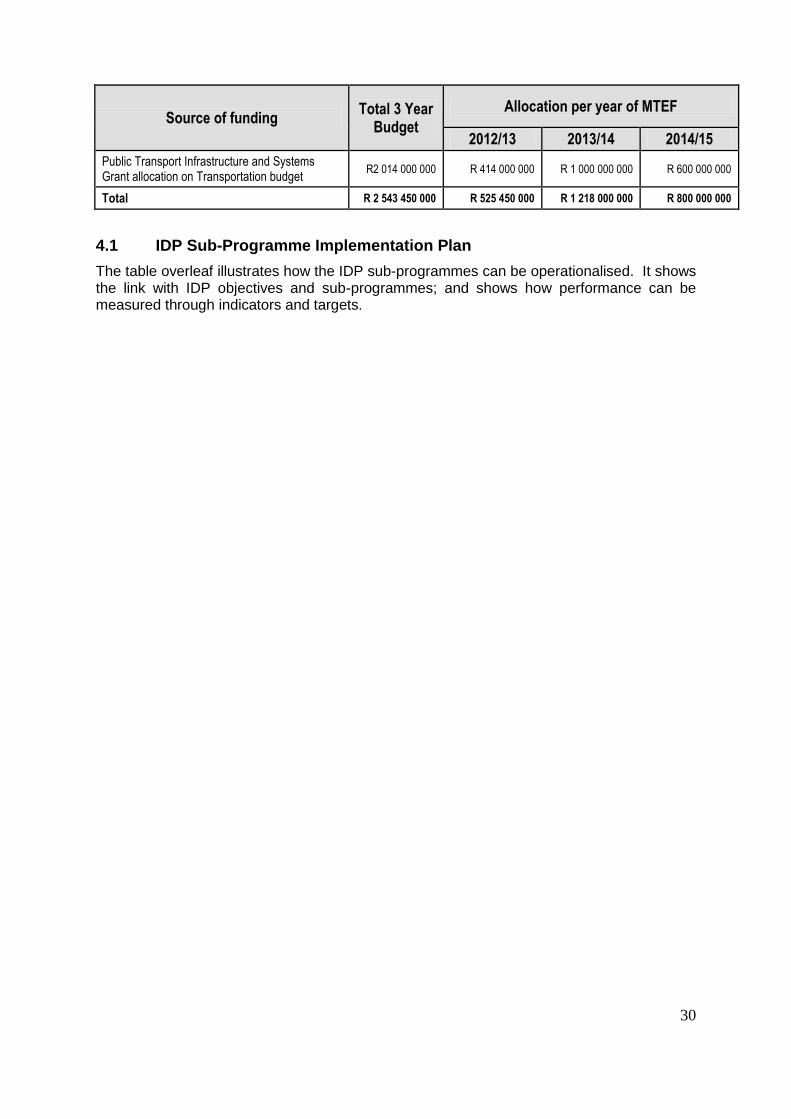
30
Source of funding Total 3 Year
Budget
Allocation per year of MTEF
2012/13 2013/14 2014/15
Public Transport Infrastructure and Systems Grant allocation on Transportation budget
R2 014 000 000 R 414 000 000 R 1 000 000 000 R 600 000 000
Total R 2 543 450 000 R 525 450 000 R 1 218 000 000 R 800 000 000
4.1 IDP Sub-Programme Implementation Plan
The table overleaf illustrates how the IDP sub-programmes can be operationalised. It shows the link with IDP objectives and sub-programmes; and shows how performance can be measured through indicators and targets.
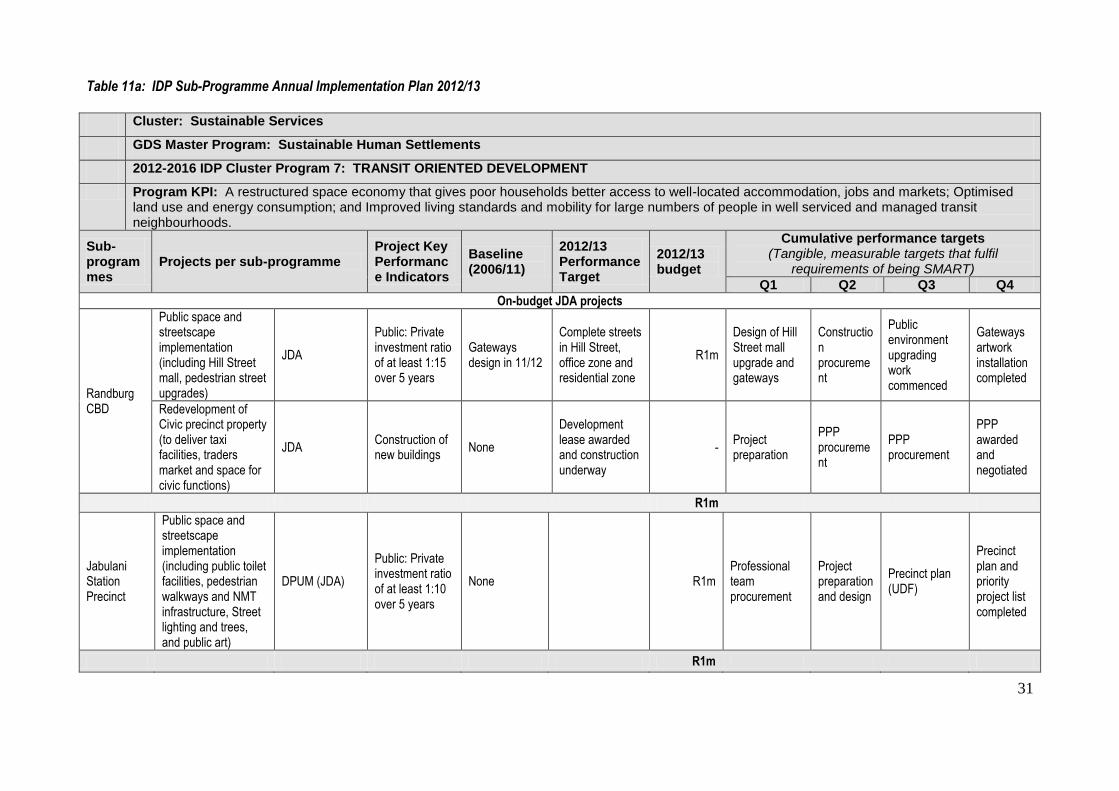
31
Table 11a: IDP Sub-Programme Annual Implementation Plan 2012/13
Cluster: Sustainable Services
GDS Master Program: Sustainable Human Settlements
2012-2016 IDP Cluster Program 7: TRANSIT ORIENTED DEVELOPMENT
Program KPI: A restructured space economy that gives poor households better access to well-located accommodation, jobs and markets; Optimised land use and energy consumption; and Improved living standards and mobility for large numbers of people in well serviced and managed transit neighbourhoods.
Sub-programmes
Projects per sub-programme Project Key Performance Indicators
Baseline (2006/11)
2012/13 Performance Target
2012/13 budget
Cumulative performance targets (Tangible, measurable targets that fulfil
requirements of being SMART)
Q1 Q2 Q3 Q4
On-budget JDA projects
Randburg CBD
Public space and streetscape implementation (including Hill Street mall, pedestrian street upgrades)
JDA
Public: Private investment ratio of at least 1:15 over 5 years
Gateways design in 11/12
Complete streets in Hill Street, office zone and residential zone
R1m
Design of Hill Street mall upgrade and gateways
Construction procurement
Public environment upgrading work commenced
Gateways artwork installation completed
Redevelopment of Civic precinct property (to deliver taxi facilities, traders market and space for civic functions)
JDA Construction of new buildings
None
Development lease awarded and construction underway
- Project preparation
PPP procurement
PPP procurement
PPP awarded and negotiated
R1m
Jabulani Station Precinct
Public space and streetscape implementation (including public toilet facilities, pedestrian walkways and NMT infrastructure, Street lighting and trees, and public art)
DPUM (JDA)
Public: Private investment ratio of at least 1:10 over 5 years
None R1m Professional team procurement
Project preparation and design
Precinct plan (UDF)
Precinct plan and priority project list completed
R1m
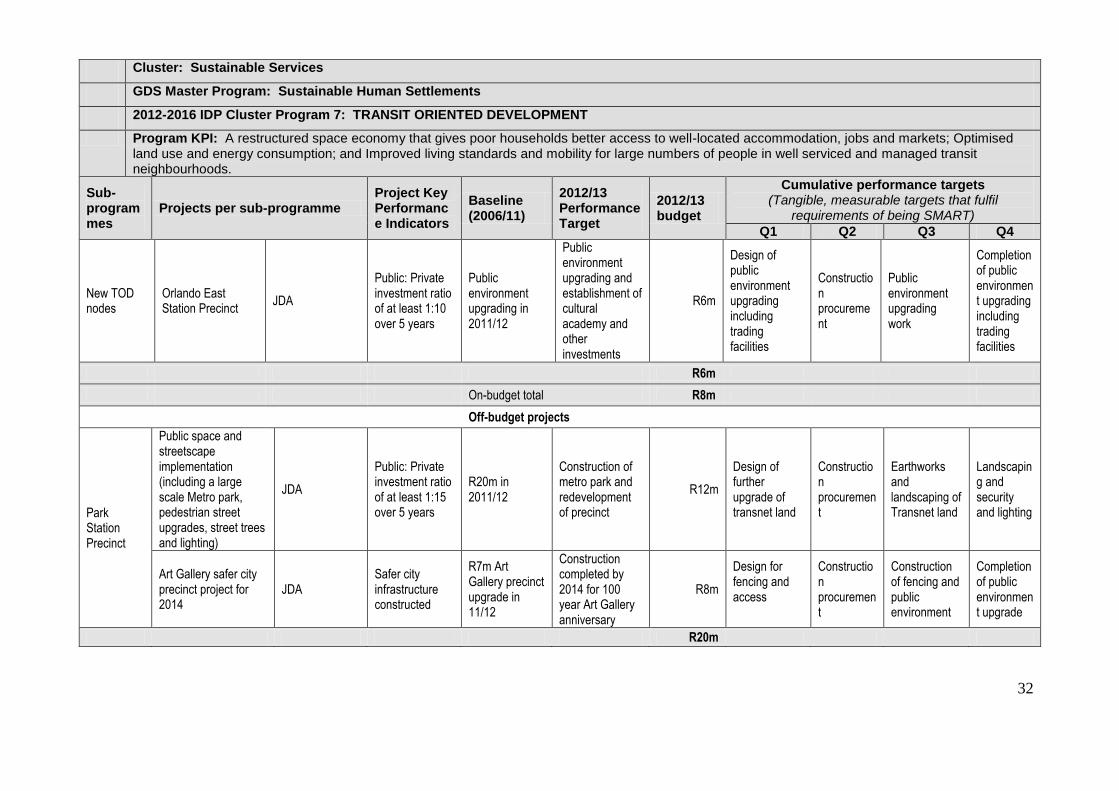
32
Cluster: Sustainable Services
GDS Master Program: Sustainable Human Settlements
2012-2016 IDP Cluster Program 7: TRANSIT ORIENTED DEVELOPMENT
Program KPI: A restructured space economy that gives poor households better access to well-located accommodation, jobs and markets; Optimised land use and energy consumption; and Improved living standards and mobility for large numbers of people in well serviced and managed transit neighbourhoods.
Sub-programmes
Projects per sub-programme Project Key Performance Indicators
Baseline (2006/11)
2012/13 Performance Target
2012/13 budget
Cumulative performance targets (Tangible, measurable targets that fulfil
requirements of being SMART)
Q1 Q2 Q3 Q4
New TOD nodes
Orlando East Station Precinct
JDA
Public: Private investment ratio of at least 1:10 over 5 years
Public environment upgrading in 2011/12
Public environment upgrading and establishment of cultural academy and other investments
R6m
Design of public environment upgrading including trading facilities
Construction procurement
Public environment upgrading work
Completion of public environment upgrading including trading facilities
R6m
On-budget total R8m
Off-budget projects
Park Station Precinct
Public space and streetscape implementation (including a large scale Metro park, pedestrian street upgrades, street trees and lighting)
JDA
Public: Private investment ratio of at least 1:15 over 5 years
R20m in 2011/12
Construction of metro park and redevelopment of precinct
R12m
Design of further upgrade of transnet land
Construction procurement
Earthworks and landscaping of Transnet land
Landscaping and security and lighting
Art Gallery safer city precinct project for 2014
JDA Safer city infrastructure constructed
R7m Art Gallery precinct upgrade in 11/12
Construction completed by 2014 for 100 year Art Gallery anniversary
R8m
Design for fencing and access
Construction procurement
Construction of fencing and public environment
Completion of public environment upgrade
R20m
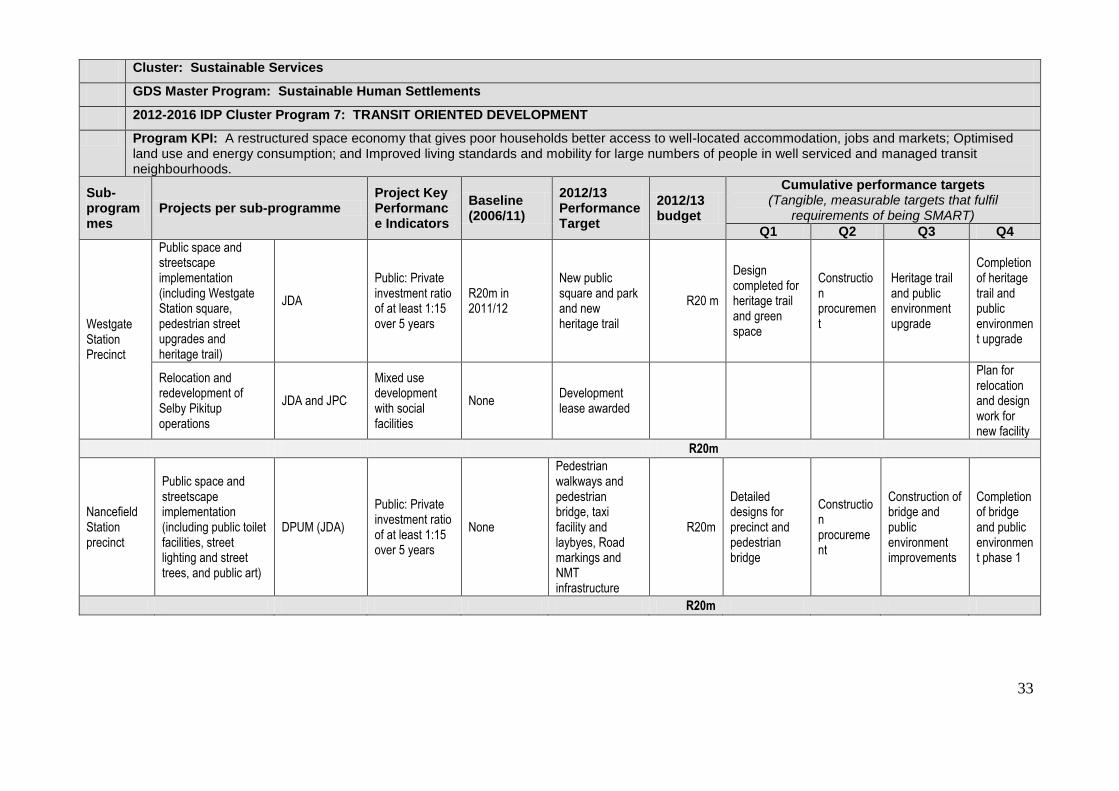
33
Cluster: Sustainable Services
GDS Master Program: Sustainable Human Settlements
2012-2016 IDP Cluster Program 7: TRANSIT ORIENTED DEVELOPMENT
Program KPI: A restructured space economy that gives poor households better access to well-located accommodation, jobs and markets; Optimised land use and energy consumption; and Improved living standards and mobility for large numbers of people in well serviced and managed transit neighbourhoods.
Sub-programmes
Projects per sub-programme Project Key Performance Indicators
Baseline (2006/11)
2012/13 Performance Target
2012/13 budget
Cumulative performance targets (Tangible, measurable targets that fulfil
requirements of being SMART)
Q1 Q2 Q3 Q4
Westgate Station Precinct
Public space and streetscape implementation (including Westgate Station square, pedestrian street upgrades and heritage trail)
JDA
Public: Private investment ratio of at least 1:15 over 5 years
R20m in 2011/12
New public square and park and new heritage trail
R20 m
Design completed for heritage trail and green space
Construction procurement
Heritage trail and public environment upgrade
Completion of heritage trail and public environment upgrade
Relocation and redevelopment of Selby Pikitup operations
JDA and JPC
Mixed use development with social facilities
None Development lease awarded
Plan for relocation and design work for new facility
R20m
Nancefield Station precinct
Public space and streetscape implementation (including public toilet facilities, street lighting and street trees, and public art)
DPUM (JDA)
Public: Private investment ratio of at least 1:15 over 5 years
None
Pedestrian walkways and pedestrian bridge, taxi facility and laybyes, Road markings and NMT infrastructure
R20m
Detailed designs for precinct and pedestrian bridge
Construction procurement
Construction of bridge and public environment improvements
Completion of bridge and public environment phase 1
R20m
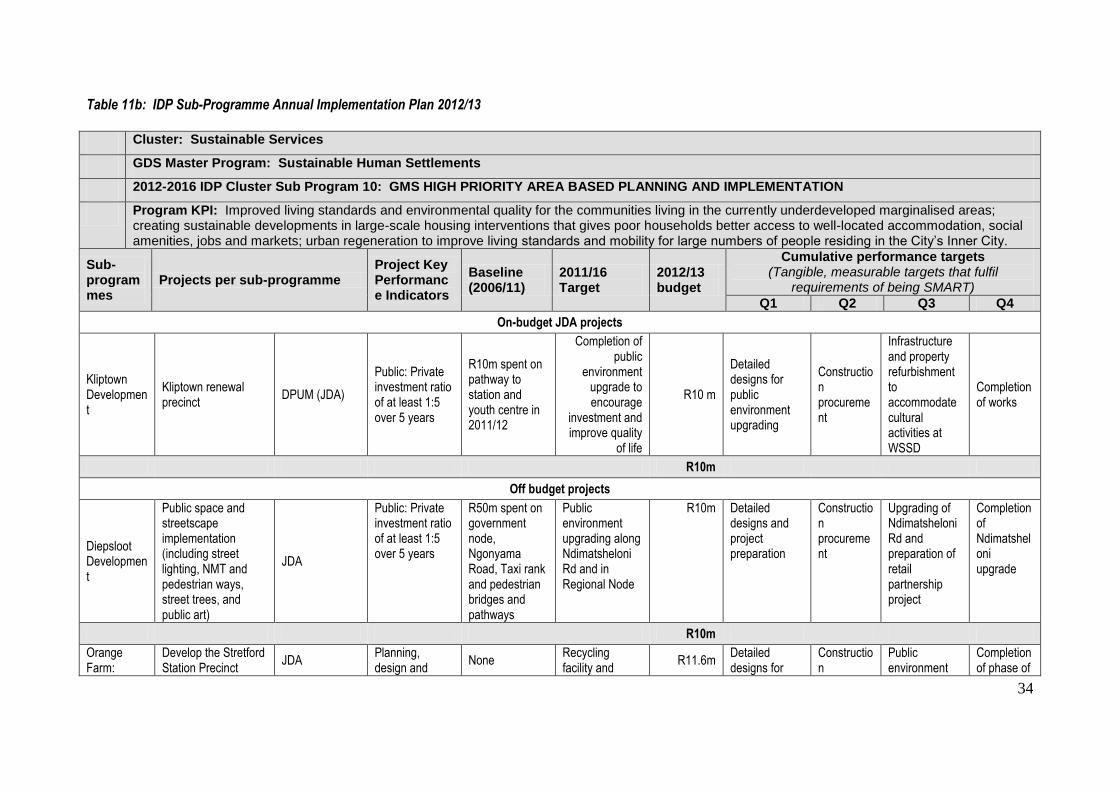
34
Table 11b: IDP Sub-Programme Annual Implementation Plan 2012/13
Cluster: Sustainable Services
GDS Master Program: Sustainable Human Settlements
2012-2016 IDP Cluster Sub Program 10: GMS HIGH PRIORITY AREA BASED PLANNING AND IMPLEMENTATION
Program KPI: Improved living standards and environmental quality for the communities living in the currently underdeveloped marginalised areas; creating sustainable developments in large-scale housing interventions that gives poor households better access to well-located accommodation, social amenities, jobs and markets; urban regeneration to improve living standards and mobility for large numbers of people residing in the City‟s Inner City.
Sub-programmes
Projects per sub-programme Project Key Performance Indicators
Baseline (2006/11)
2011/16 Target
2012/13 budget
Cumulative performance targets (Tangible, measurable targets that fulfil
requirements of being SMART)
Q1 Q2 Q3 Q4
On-budget JDA projects
Kliptown Development
Kliptown renewal precinct
DPUM (JDA)
Public: Private investment ratio of at least 1:5 over 5 years
R10m spent on pathway to station and youth centre in 2011/12
Completion of public
environment upgrade to encourage
investment and improve quality
of life
R10 m
Detailed designs for public environment upgrading
Construction procurement
Infrastructure and property refurbishment to accommodate cultural activities at WSSD
Completion of works
R10m
Off budget projects
Diepsloot Development
Public space and streetscape implementation (including street lighting, NMT and pedestrian ways, street trees, and public art)
JDA
Public: Private investment ratio of at least 1:5 over 5 years
R50m spent on government node, Ngonyama Road, Taxi rank and pedestrian bridges and pathways
Public environment upgrading along Ndimatsheloni Rd and in Regional Node
R10m Detailed designs and project preparation
Construction procurement
Upgrading of Ndimatsheloni Rd and preparation of retail partnership project
Completion of Ndimatsheloni upgrade
R10m
Orange Farm:
Develop the Stretford Station Precinct
JDA Planning, design and
None Recycling facility and
R11.6m Detailed designs for
Construction
Public environment
Completion of phase of
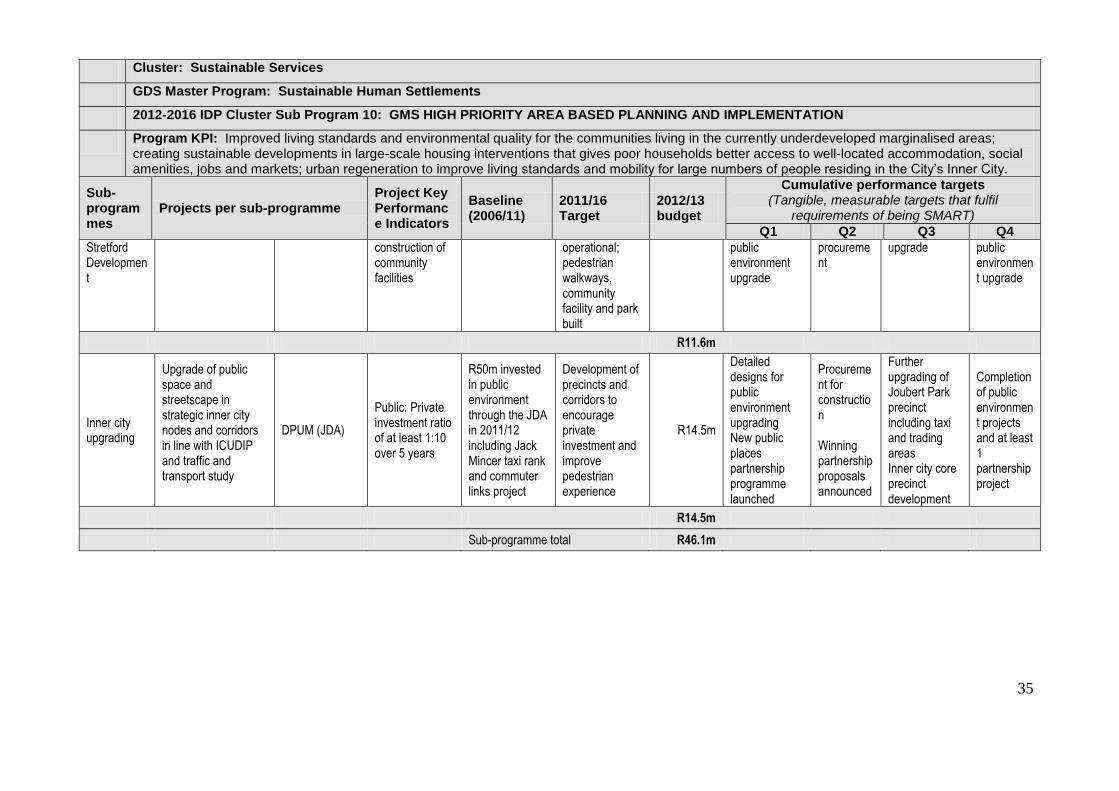
35
Cluster: Sustainable Services
GDS Master Program: Sustainable Human Settlements
2012-2016 IDP Cluster Sub Program 10: GMS HIGH PRIORITY AREA BASED PLANNING AND IMPLEMENTATION
Program KPI: Improved living standards and environmental quality for the communities living in the currently underdeveloped marginalised areas; creating sustainable developments in large-scale housing interventions that gives poor households better access to well-located accommodation, social amenities, jobs and markets; urban regeneration to improve living standards and mobility for large numbers of people residing in the City‟s Inner City.
Sub-programmes
Projects per sub-programme Project Key Performance Indicators
Baseline (2006/11)
2011/16 Target
2012/13 budget
Cumulative performance targets (Tangible, measurable targets that fulfil
requirements of being SMART)
Q1 Q2 Q3 Q4
Stretford Development
construction of community facilities
operational; pedestrian walkways, community facility and park built
public environment upgrade
procurement
upgrade
public environment upgrade
R11.6m
Inner city upgrading
Upgrade of public space and streetscape in strategic inner city nodes and corridors in line with ICUDIP and traffic and transport study
DPUM (JDA)
Public: Private investment ratio of at least 1:10 over 5 years
R50m invested in public environment through the JDA in 2011/12 including Jack Mincer taxi rank and commuter links project
Development of precincts and corridors to encourage private investment and improve pedestrian experience
R14.5m
Detailed designs for public environment upgrading New public places partnership programme launched
Procurement for construction Winning partnership proposals announced
Further upgrading of Joubert Park precinct including taxi and trading areas Inner city core precinct development
Completion of public environment projects and at least 1 partnership project
R14.5m
Sub-programme total R46.1m
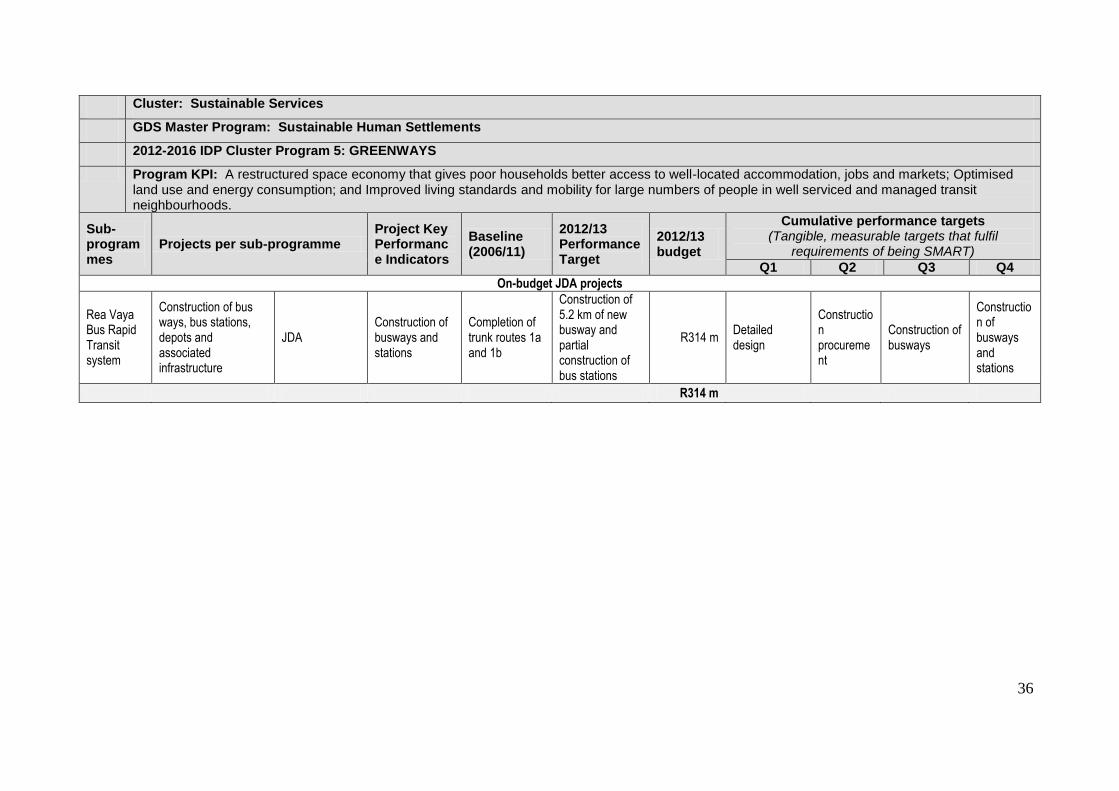
36
Cluster: Sustainable Services
GDS Master Program: Sustainable Human Settlements
2012-2016 IDP Cluster Program 5: GREENWAYS
Program KPI: A restructured space economy that gives poor households better access to well-located accommodation, jobs and markets; Optimised land use and energy consumption; and Improved living standards and mobility for large numbers of people in well serviced and managed transit neighbourhoods.
Sub-programmes
Projects per sub-programme Project Key Performance Indicators
Baseline (2006/11)
2012/13 Performance Target
2012/13 budget
Cumulative performance targets (Tangible, measurable targets that fulfil
requirements of being SMART)
Q1 Q2 Q3 Q4
On-budget JDA projects
Rea Vaya Bus Rapid Transit system
Construction of bus ways, bus stations, depots and associated infrastructure
JDA Construction of busways and stations
Completion of trunk routes 1a and 1b
Construction of 5.2 km of new busway and partial construction of bus stations
R314 m Detailed design
Construction procurement
Construction of busways
Construction of busways and stations
R314 m
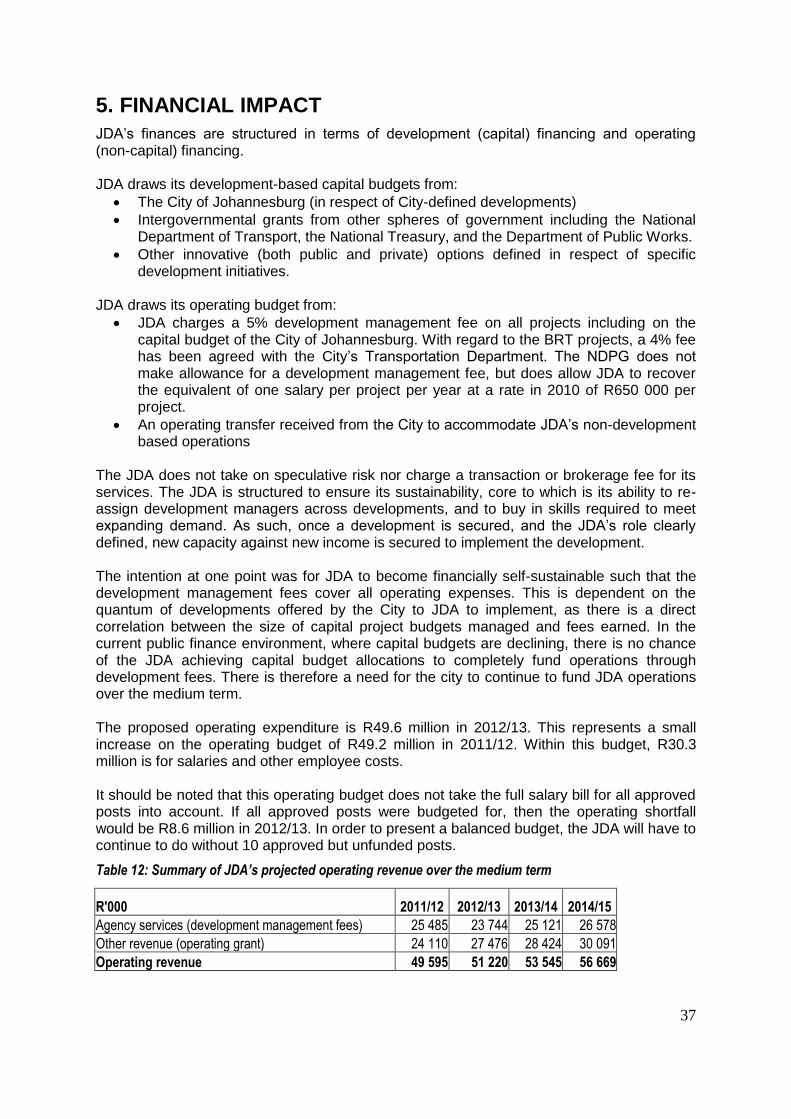
37
5. FINANCIAL IMPACT
JDA‟s finances are structured in terms of development (capital) financing and operating (non-capital) financing. JDA draws its development-based capital budgets from:
The City of Johannesburg (in respect of City-defined developments)
Intergovernmental grants from other spheres of government including the National Department of Transport, the National Treasury, and the Department of Public Works.
Other innovative (both public and private) options defined in respect of specific development initiatives.
JDA draws its operating budget from:
JDA charges a 5% development management fee on all projects including on the capital budget of the City of Johannesburg. With regard to the BRT projects, a 4% fee has been agreed with the City‟s Transportation Department. The NDPG does not make allowance for a development management fee, but does allow JDA to recover the equivalent of one salary per project per year at a rate in 2010 of R650 000 per project.
An operating transfer received from the City to accommodate JDA‟s non-development based operations
The JDA does not take on speculative risk nor charge a transaction or brokerage fee for its services. The JDA is structured to ensure its sustainability, core to which is its ability to re-assign development managers across developments, and to buy in skills required to meet expanding demand. As such, once a development is secured, and the JDA‟s role clearly defined, new capacity against new income is secured to implement the development. The intention at one point was for JDA to become financially self-sustainable such that the development management fees cover all operating expenses. This is dependent on the quantum of developments offered by the City to JDA to implement, as there is a direct correlation between the size of capital project budgets managed and fees earned. In the current public finance environment, where capital budgets are declining, there is no chance of the JDA achieving capital budget allocations to completely fund operations through development fees. There is therefore a need for the city to continue to fund JDA operations over the medium term. The proposed operating expenditure is R49.6 million in 2012/13. This represents a small increase on the operating budget of R49.2 million in 2011/12. Within this budget, R30.3 million is for salaries and other employee costs. It should be noted that this operating budget does not take the full salary bill for all approved posts into account. If all approved posts were budgeted for, then the operating shortfall would be R8.6 million in 2012/13. In order to present a balanced budget, the JDA will have to continue to do without 10 approved but unfunded posts.
Table 12: Summary of JDA’s projected operating revenue over the medium term
R'000 2011/12 2012/13 2013/14 2014/15
Agency services (development management fees) 25 485 23 744 25 121 26 578
Other revenue (operating grant) 24 110 27 476 28 424 30 091
Operating revenue 49 595 51 220 53 545 56 669
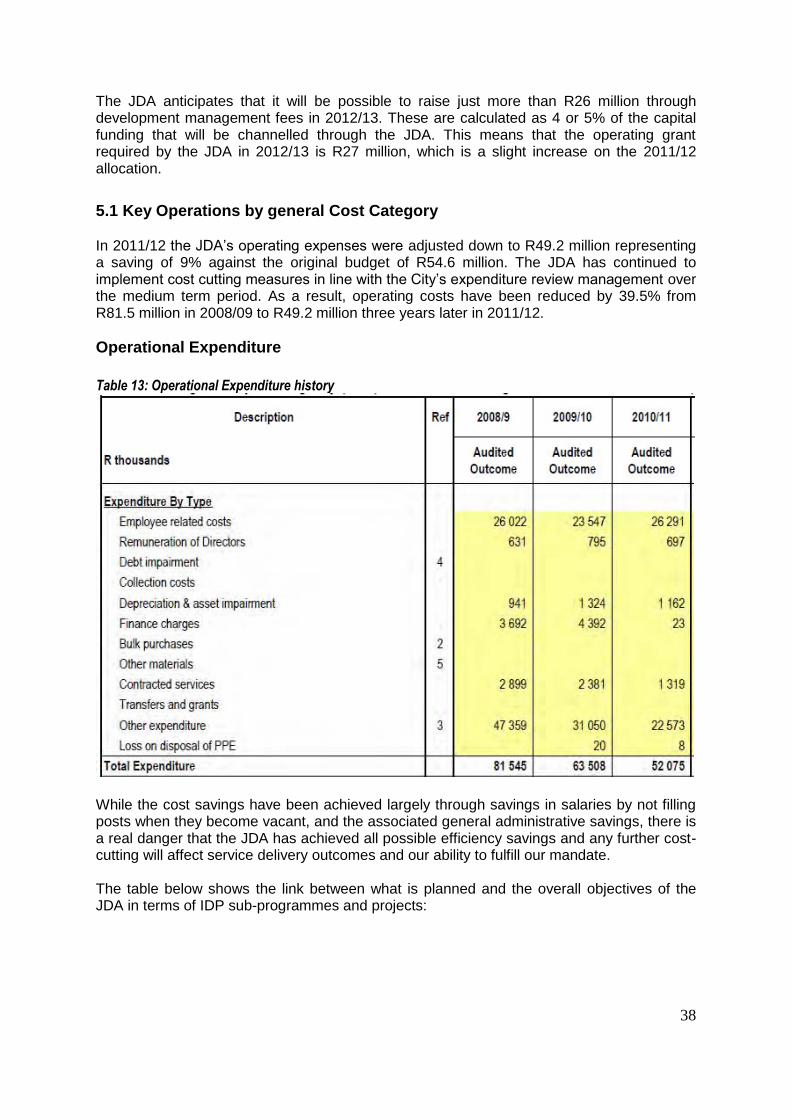
38
The JDA anticipates that it will be possible to raise just more than R26 million through development management fees in 2012/13. These are calculated as 4 or 5% of the capital funding that will be channelled through the JDA. This means that the operating grant required by the JDA in 2012/13 is R27 million, which is a slight increase on the 2011/12 allocation.
5.1 Key Operations by general Cost Category
In 2011/12 the JDA‟s operating expenses were adjusted down to R49.2 million representing a saving of 9% against the original budget of R54.6 million. The JDA has continued to implement cost cutting measures in line with the City‟s expenditure review management over the medium term period. As a result, operating costs have been reduced by 39.5% from R81.5 million in 2008/09 to R49.2 million three years later in 2011/12.
Operational Expenditure
Table 13: Operational Expenditure history
While the cost savings have been achieved largely through savings in salaries by not filling posts when they become vacant, and the associated general administrative savings, there is a real danger that the JDA has achieved all possible efficiency savings and any further cost-cutting will affect service delivery outcomes and our ability to fulfill our mandate. The table below shows the link between what is planned and the overall objectives of the JDA in terms of IDP sub-programmes and projects:
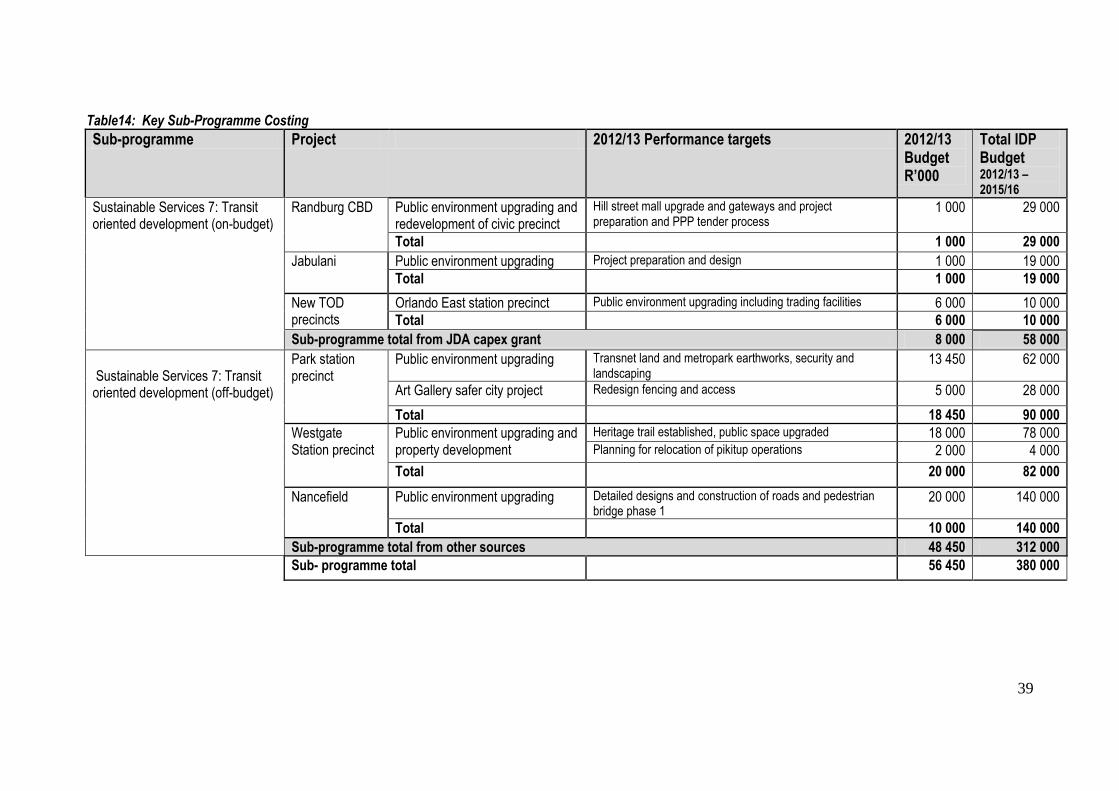
39
Table14: Key Sub-Programme Costing
Sub-programme Project 2012/13 Performance targets 2012/13 Budget R’000
Total IDP Budget 2012/13 – 2015/16
Sustainable Services 7: Transit oriented development (on-budget)
Randburg CBD Public environment upgrading and redevelopment of civic precinct
Hill street mall upgrade and gateways and project preparation and PPP tender process
1 000 29 000
Total 1 000 29 000
Jabulani Public environment upgrading Project preparation and design 1 000 19 000
Total 1 000 19 000
New TOD precincts
Orlando East station precinct Public environment upgrading including trading facilities 6 000 10 000
Total 6 000 10 000
Sub-programme total from JDA capex grant 8 000 58 000
Sustainable Services 7: Transit oriented development (off-budget)
Park station precinct
Public environment upgrading Transnet land and metropark earthworks, security and landscaping
13 450 62 000
Art Gallery safer city project Redesign fencing and access 5 000 28 000
Total 18 450 90 000
Westgate Station precinct
Public environment upgrading and property development
Heritage trail established, public space upgraded 18 000 78 000 Planning for relocation of pikitup operations 2 000 4 000
Total 20 000 82 000
Nancefield Public environment upgrading Detailed designs and construction of roads and pedestrian bridge phase 1
20 000 140 000
Total 10 000 140 000
Sub-programme total from other sources 48 450 312 000
Sub- programme total 56 450 380 000
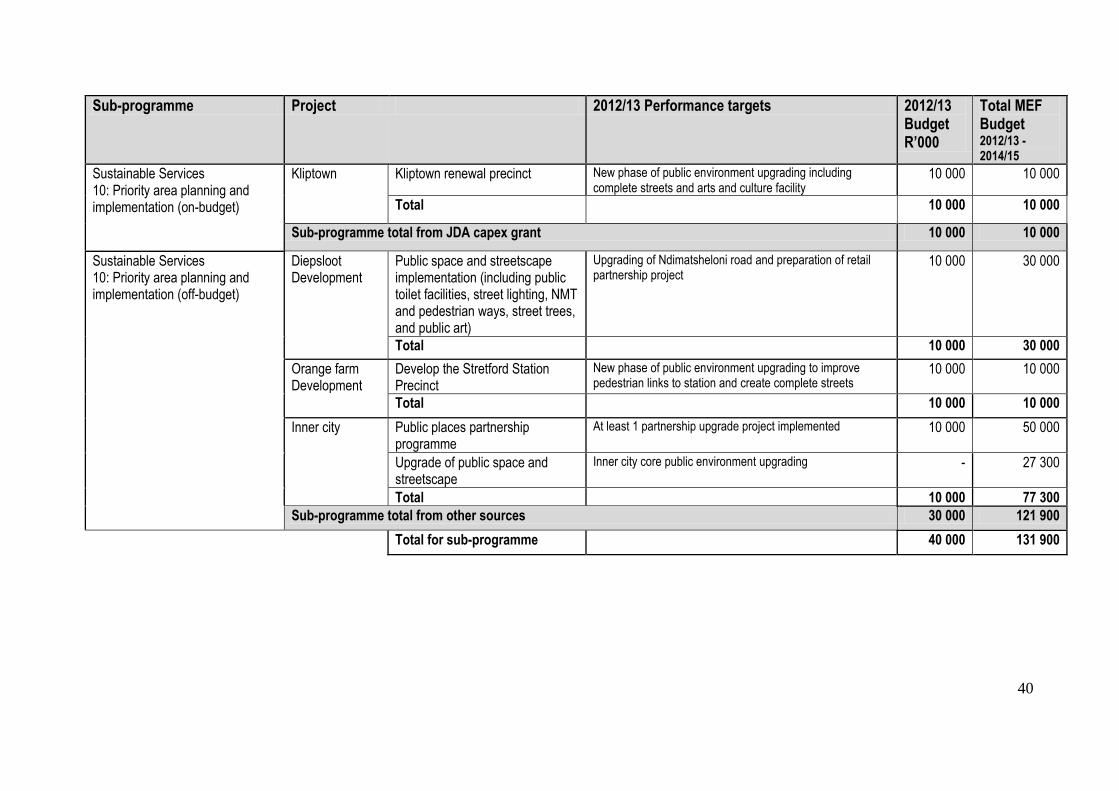
40
Sub-programme Project 2012/13 Performance targets 2012/13 Budget R’000
Total MEF Budget 2012/13 - 2014/15
Sustainable Services 10: Priority area planning and implementation (on-budget)
Kliptown Kliptown renewal precinct New phase of public environment upgrading including complete streets and arts and culture facility
10 000 10 000
Total 10 000 10 000
Sub-programme total from JDA capex grant 10 000 10 000
Sustainable Services 10: Priority area planning and implementation (off-budget)
Diepsloot Development
Public space and streetscape implementation (including public toilet facilities, street lighting, NMT and pedestrian ways, street trees, and public art)
Upgrading of Ndimatsheloni road and preparation of retail partnership project
10 000 30 000
Total 10 000 30 000
Orange farm Development
Develop the Stretford Station Precinct
New phase of public environment upgrading to improve pedestrian links to station and create complete streets
10 000 10 000
Total 10 000 10 000
Inner city Public places partnership programme
At least 1 partnership upgrade project implemented 10 000 50 000
Upgrade of public space and streetscape
Inner city core public environment upgrading - 27 300
Total 10 000 77 300
Sub-programme total from other sources 30 000 121 900
Total for sub-programme 40 000 131 900
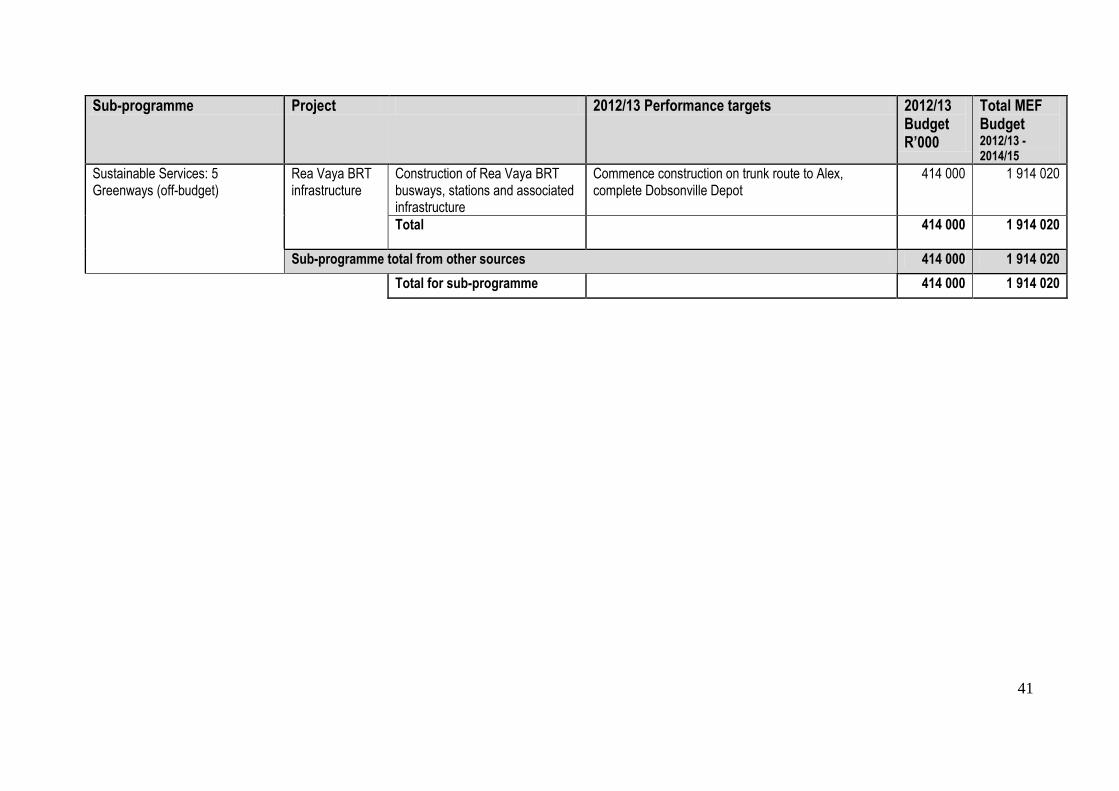
41
Sub-programme Project 2012/13 Performance targets 2012/13 Budget R’000
Total MEF Budget 2012/13 - 2014/15
Sustainable Services: 5 Greenways (off-budget)
Rea Vaya BRT infrastructure
Construction of Rea Vaya BRT busways, stations and associated infrastructure
Commence construction on trunk route to Alex, complete Dobsonville Depot
414 000 1 914 020
Total 414 000 1 914 020
Sub-programme total from other sources 414 000 1 914 020
Total for sub-programme 414 000 1 914 020
42
5.2 Capital Expenditure
While the JDA is anticipating that capital projects to the value of R427 million will be implemented during 2012/13, most of these are off-budget for the JDA as they are funded through allocations on the budgets of other departments and entities. The JDA‟s capital grant received from the City of Joburg amounts to R18 million, and will be spent as follows:
The Orlando East Station Precinct will be further improved with further work to link the station to Mooki street and construct traders facilities at a cost of R6 million in 2012/13.
The Randburg CBD transit precinct development will get underway with detailed design for the refurbishment of the Hill Street Mall to provide a safe and convenient pedestrian link to the CBD and installation of gateway artwork at a cost of R1 million in 2012/13.
The Jabulani station precinct upgrades need to be planned in more detail, and detailed designs and project plans will be generated at a cost of R1 million in 2012/13.
A further phase of the Kliptown Development (a multi-year project) will seek to ensure that economic development gains are extended to the communities living around the Walter Sisulu Square of Dedication. There is a need to extend the public environment upgrading project will focus on Union Street and beyond, and community facilities such as space for arts and culture activities will be constructed. In 2012/13 at a cost of R10 million.
5.3 Service Delivery Budget Implementation Programme
This business plan is aligned with the Service Delivery Budget Implementation Programme of the CoJ. The following tables are extracted from our input to this plan.
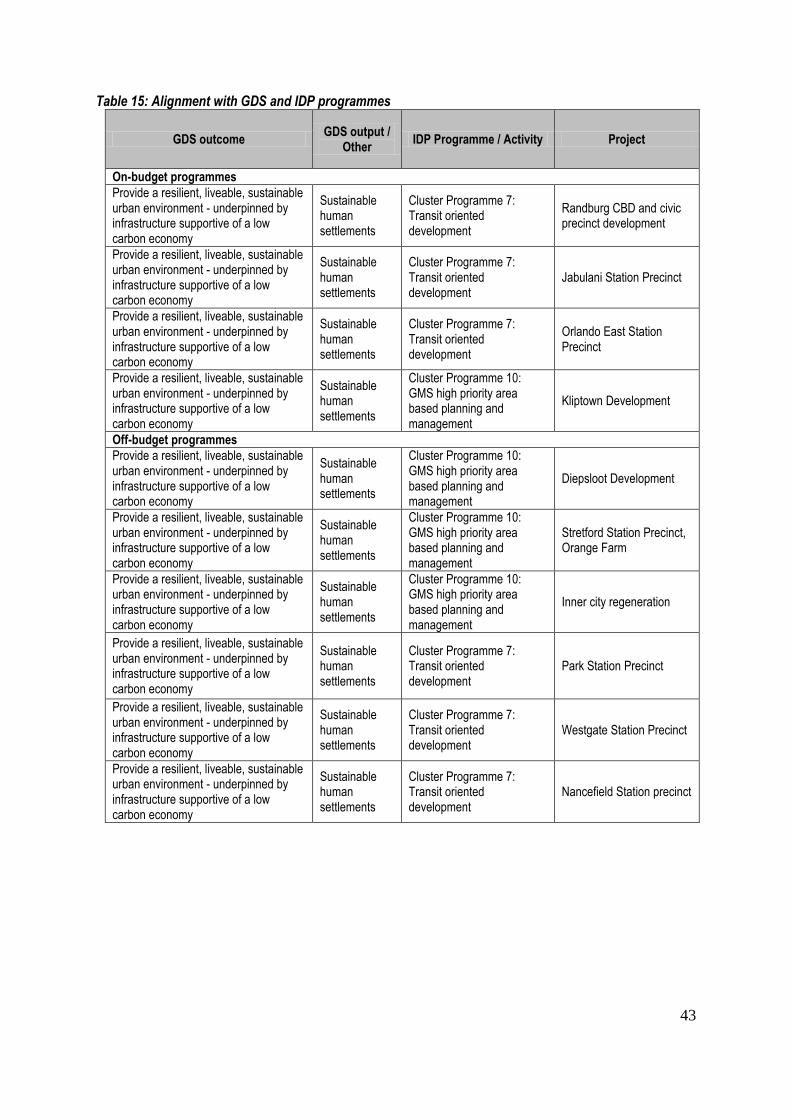
43
Table 15: Alignment with GDS and IDP programmes
GDS outcome GDS output /
Other IDP Programme / Activity Project
On-budget programmes
Provide a resilient, liveable, sustainable urban environment - underpinned by infrastructure supportive of a low carbon economy
Sustainable human settlements
Cluster Programme 7: Transit oriented development
Randburg CBD and civic precinct development
Provide a resilient, liveable, sustainable urban environment - underpinned by infrastructure supportive of a low carbon economy
Sustainable human settlements
Cluster Programme 7: Transit oriented development
Jabulani Station Precinct
Provide a resilient, liveable, sustainable urban environment - underpinned by infrastructure supportive of a low carbon economy
Sustainable human settlements
Cluster Programme 7: Transit oriented development
Orlando East Station Precinct
Provide a resilient, liveable, sustainable urban environment - underpinned by infrastructure supportive of a low carbon economy
Sustainable human settlements
Cluster Programme 10: GMS high priority area based planning and management
Kliptown Development
Off-budget programmes
Provide a resilient, liveable, sustainable urban environment - underpinned by infrastructure supportive of a low carbon economy
Sustainable human settlements
Cluster Programme 10: GMS high priority area based planning and management
Diepsloot Development
Provide a resilient, liveable, sustainable urban environment - underpinned by infrastructure supportive of a low carbon economy
Sustainable human settlements
Cluster Programme 10: GMS high priority area based planning and management
Stretford Station Precinct, Orange Farm
Provide a resilient, liveable, sustainable urban environment - underpinned by infrastructure supportive of a low carbon economy
Sustainable human settlements
Cluster Programme 10: GMS high priority area based planning and management
Inner city regeneration
Provide a resilient, liveable, sustainable urban environment - underpinned by infrastructure supportive of a low carbon economy
Sustainable human settlements
Cluster Programme 7: Transit oriented development
Park Station Precinct
Provide a resilient, liveable, sustainable urban environment - underpinned by infrastructure supportive of a low carbon economy
Sustainable human settlements
Cluster Programme 7: Transit oriented development
Westgate Station Precinct
Provide a resilient, liveable, sustainable urban environment - underpinned by infrastructure supportive of a low carbon economy
Sustainable human settlements
Cluster Programme 7: Transit oriented development
Nancefield Station precinct
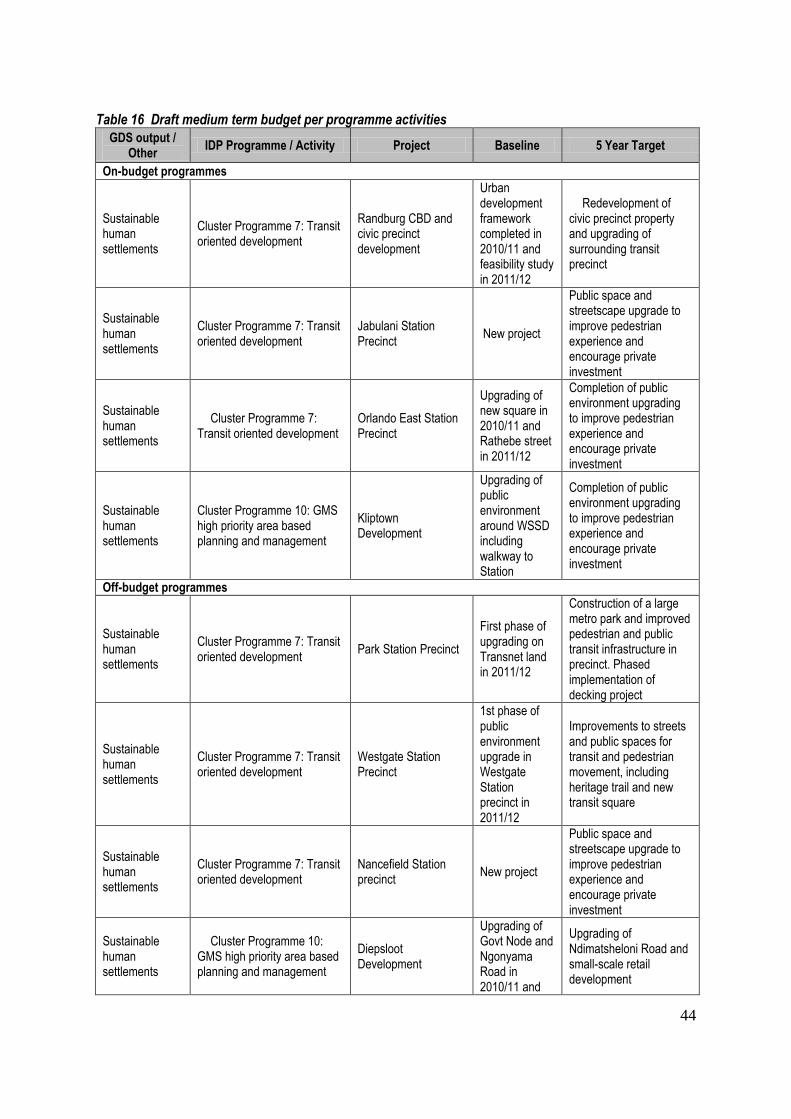
44
Table 16 Draft medium term budget per programme activities
GDS output / Other
IDP Programme / Activity Project Baseline 5 Year Target
On-budget programmes
Sustainable human settlements
Cluster Programme 7: Transit oriented development
Randburg CBD and civic precinct development
Urban development framework completed in 2010/11 and feasibility study in 2011/12
Redevelopment of civic precinct property and upgrading of surrounding transit precinct
Sustainable human settlements
Cluster Programme 7: Transit oriented development
Jabulani Station Precinct
New project
Public space and streetscape upgrade to improve pedestrian experience and encourage private investment
Sustainable human settlements
Cluster Programme 7: Transit oriented development
Orlando East Station Precinct
Upgrading of new square in 2010/11 and Rathebe street in 2011/12
Completion of public environment upgrading to improve pedestrian experience and encourage private investment
Sustainable human settlements
Cluster Programme 10: GMS high priority area based planning and management
Kliptown Development
Upgrading of public environment around WSSD including walkway to Station
Completion of public environment upgrading to improve pedestrian experience and encourage private investment
Off-budget programmes
Sustainable human settlements
Cluster Programme 7: Transit oriented development
Park Station Precinct
First phase of upgrading on Transnet land in 2011/12
Construction of a large metro park and improved pedestrian and public transit infrastructure in precinct. Phased implementation of decking project
Sustainable human settlements
Cluster Programme 7: Transit oriented development
Westgate Station Precinct
1st phase of public environment upgrade in Westgate Station precinct in 2011/12
Improvements to streets and public spaces for transit and pedestrian movement, including heritage trail and new transit square
Sustainable human settlements
Cluster Programme 7: Transit oriented development
Nancefield Station precinct
New project
Public space and streetscape upgrade to improve pedestrian experience and encourage private investment
Sustainable human settlements
Cluster Programme 10: GMS high priority area based planning and management
Diepsloot Development
Upgrading of Govt Node and Ngonyama Road in 2010/11 and
Upgrading of Ndimatsheloni Road and small-scale retail development
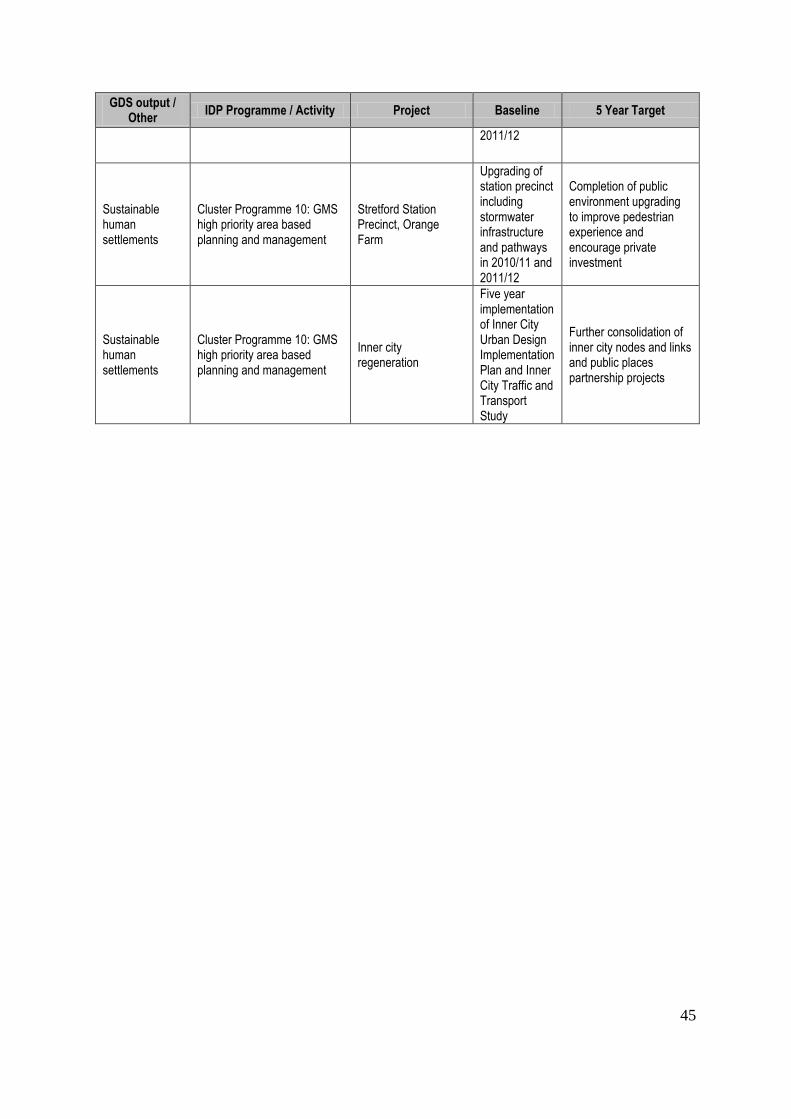
45
GDS output / Other
IDP Programme / Activity Project Baseline 5 Year Target
2011/12
Sustainable human settlements
Cluster Programme 10: GMS high priority area based planning and management
Stretford Station Precinct, Orange Farm
Upgrading of station precinct including stormwater infrastructure and pathways in 2010/11 and 2011/12
Completion of public environment upgrading to improve pedestrian experience and encourage private investment
Sustainable human settlements
Cluster Programme 10: GMS high priority area based planning and management
Inner city regeneration
Five year implementation of Inner City Urban Design Implementation Plan and Inner City Traffic and Transport Study
Further consolidation of inner city nodes and links and public places partnership projects
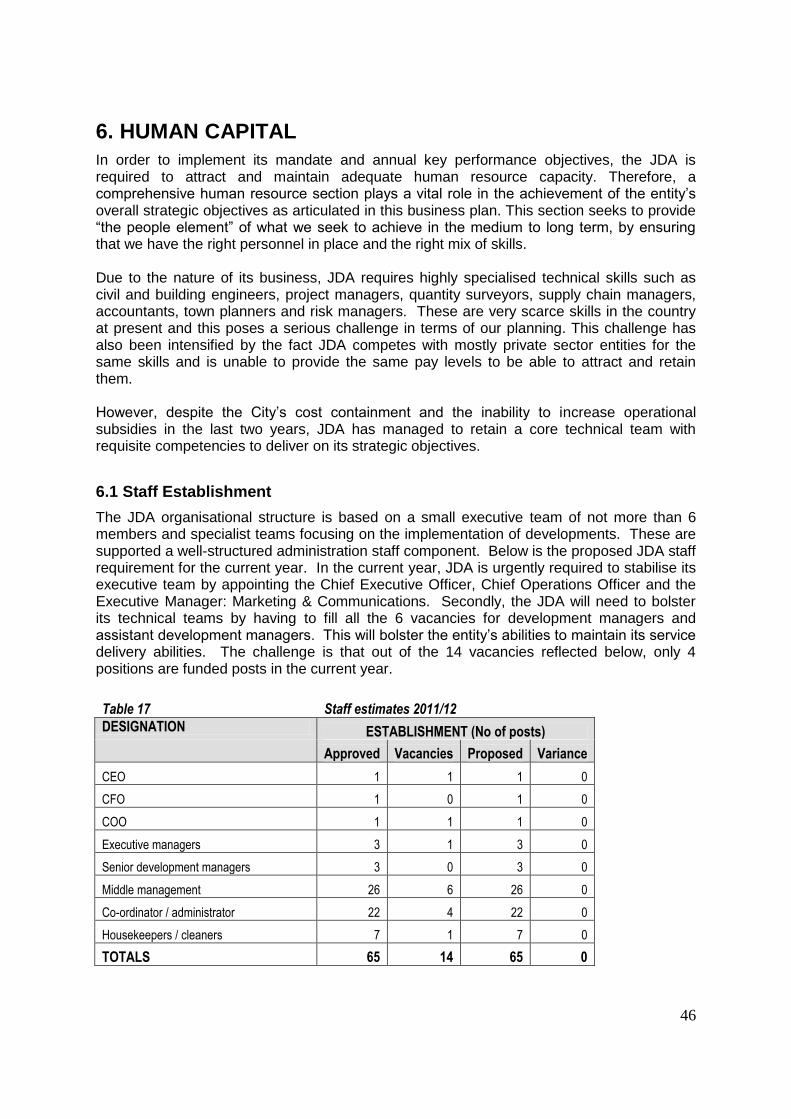
46
6. HUMAN CAPITAL
In order to implement its mandate and annual key performance objectives, the JDA is required to attract and maintain adequate human resource capacity. Therefore, a comprehensive human resource section plays a vital role in the achievement of the entity‟s overall strategic objectives as articulated in this business plan. This section seeks to provide “the people element” of what we seek to achieve in the medium to long term, by ensuring that we have the right personnel in place and the right mix of skills. Due to the nature of its business, JDA requires highly specialised technical skills such as civil and building engineers, project managers, quantity surveyors, supply chain managers, accountants, town planners and risk managers. These are very scarce skills in the country at present and this poses a serious challenge in terms of our planning. This challenge has also been intensified by the fact JDA competes with mostly private sector entities for the same skills and is unable to provide the same pay levels to be able to attract and retain them. However, despite the City‟s cost containment and the inability to increase operational subsidies in the last two years, JDA has managed to retain a core technical team with requisite competencies to deliver on its strategic objectives.
6.1 Staff Establishment
The JDA organisational structure is based on a small executive team of not more than 6 members and specialist teams focusing on the implementation of developments. These are supported a well-structured administration staff component. Below is the proposed JDA staff requirement for the current year. In the current year, JDA is urgently required to stabilise its executive team by appointing the Chief Executive Officer, Chief Operations Officer and the Executive Manager: Marketing & Communications. Secondly, the JDA will need to bolster its technical teams by having to fill all the 6 vacancies for development managers and assistant development managers. This will bolster the entity‟s abilities to maintain its service delivery abilities. The challenge is that out of the 14 vacancies reflected below, only 4 positions are funded posts in the current year.
Table 17 Staff estimates 2011/12 DESIGNATION ESTABLISHMENT (No of posts)
Approved Vacancies Proposed Variance
CEO 1 1 1 0
CFO 1 0 1 0
COO 1 1 1 0
Executive managers 3 1 3 0
Senior development managers 3 0 3 0
Middle management 26 6 26 0
Co-ordinator / administrator 22 4 22 0
Housekeepers / cleaners 7 1 7 0
TOTALS 65 14 65 0
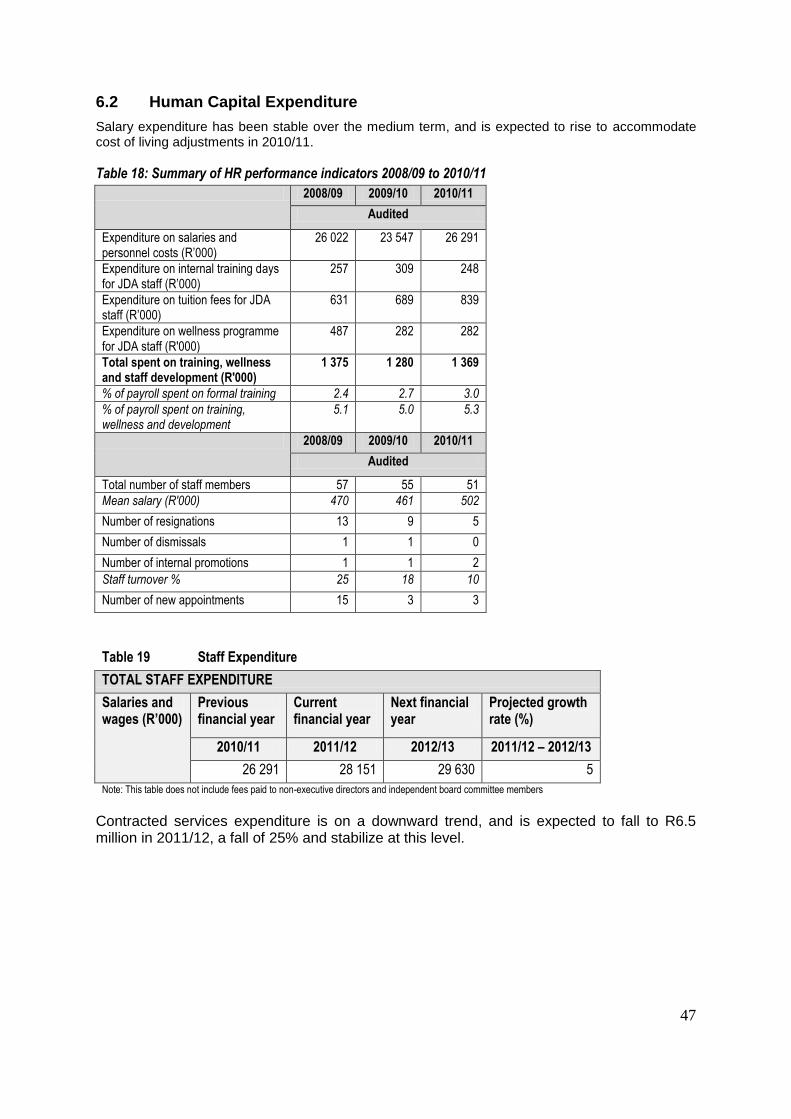
47
6.2 Human Capital Expenditure
Salary expenditure has been stable over the medium term, and is expected to rise to accommodate cost of living adjustments in 2010/11.
Table 18: Summary of HR performance indicators 2008/09 to 2010/11
2008/09 2009/10 2010/11
Audited
Expenditure on salaries and personnel costs (R‟000)
26 022 23 547 26 291
Expenditure on internal training days for JDA staff (R‟000)
257 309 248
Expenditure on tuition fees for JDA staff (R‟000)
631 689 839
Expenditure on wellness programme for JDA staff (R'000)
487 282 282
Total spent on training, wellness and staff development (R'000)
1 375 1 280 1 369
% of payroll spent on formal training 2.4 2.7 3.0
% of payroll spent on training, wellness and development
5.1 5.0 5.3
2008/09 2009/10 2010/11
Audited
Total number of staff members 57 55 51
Mean salary (R'000) 470 461 502
Number of resignations 13 9 5
Number of dismissals 1 1 0
Number of internal promotions 1 1 2
Staff turnover % 25 18 10
Number of new appointments 15 3 3
Table 19 Staff Expenditure
TOTAL STAFF EXPENDITURE
Salaries and wages (R’000)
Previous financial year
Current financial year
Next financial year
Projected growth rate (%)
2010/11 2011/12 2012/13 2011/12 – 2012/13
26 291 28 151 29 630 5
Note: This table does not include fees paid to non-executive directors and independent board committee members Contracted services expenditure is on a downward trend, and is expected to fall to R6.5 million in 2011/12, a fall of 25% and stabilize at this level.
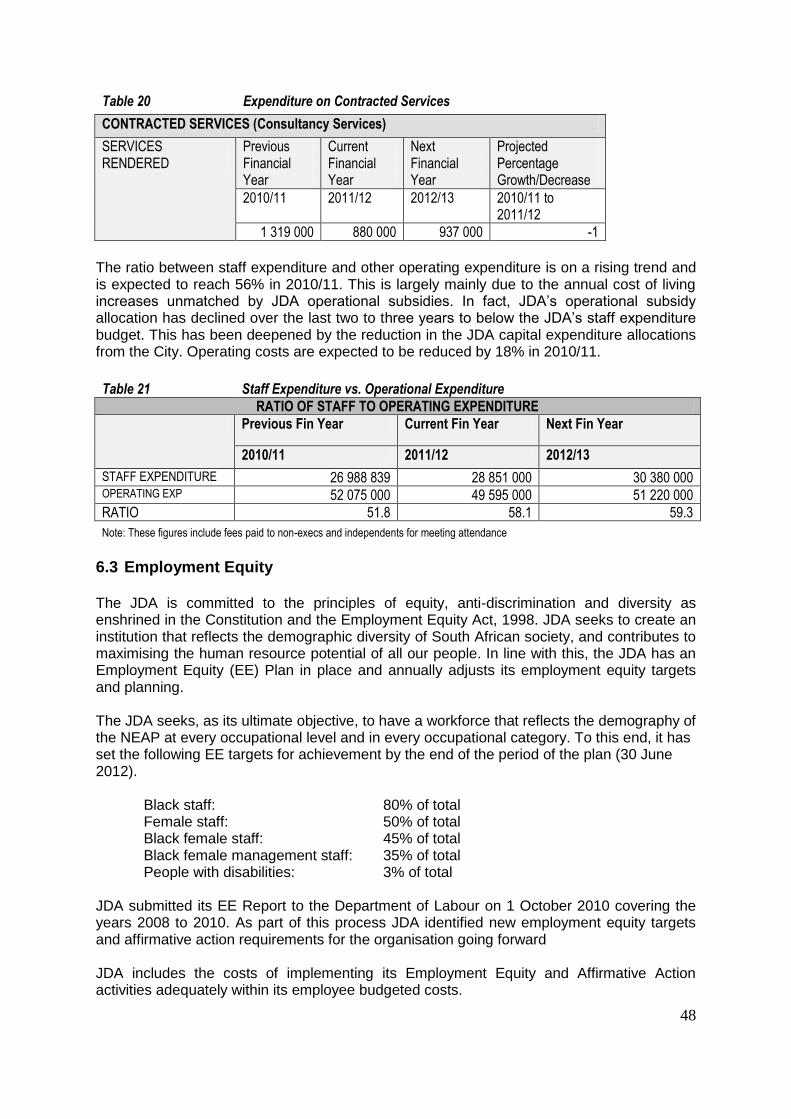
48
Table 20 Expenditure on Contracted Services
CONTRACTED SERVICES (Consultancy Services)
SERVICES RENDERED
Previous Financial Year
Current Financial Year
Next Financial Year
Projected Percentage Growth/Decrease
2010/11 2011/12 2012/13 2010/11 to 2011/12
1 319 000 880 000 937 000 -1
The ratio between staff expenditure and other operating expenditure is on a rising trend and is expected to reach 56% in 2010/11. This is largely mainly due to the annual cost of living increases unmatched by JDA operational subsidies. In fact, JDA‟s operational subsidy allocation has declined over the last two to three years to below the JDA‟s staff expenditure budget. This has been deepened by the reduction in the JDA capital expenditure allocations from the City. Operating costs are expected to be reduced by 18% in 2010/11.
Table 21 Staff Expenditure vs. Operational Expenditure
RATIO OF STAFF TO OPERATING EXPENDITURE
Previous Fin Year Current Fin Year Next Fin Year
2010/11 2011/12 2012/13
STAFF EXPENDITURE 26 988 839 28 851 000 30 380 000 OPERATING EXP 52 075 000 49 595 000 51 220 000
RATIO 51.8 58.1 59.3
Note: These figures include fees paid to non-execs and independents for meeting attendance
6.3 Employment Equity The JDA is committed to the principles of equity, anti-discrimination and diversity as enshrined in the Constitution and the Employment Equity Act, 1998. JDA seeks to create an institution that reflects the demographic diversity of South African society, and contributes to maximising the human resource potential of all our people. In line with this, the JDA has an Employment Equity (EE) Plan in place and annually adjusts its employment equity targets and planning. The JDA seeks, as its ultimate objective, to have a workforce that reflects the demography of the NEAP at every occupational level and in every occupational category. To this end, it has set the following EE targets for achievement by the end of the period of the plan (30 June 2012).
Black staff: 80% of total Female staff: 50% of total Black female staff: 45% of total Black female management staff: 35% of total People with disabilities: 3% of total
JDA submitted its EE Report to the Department of Labour on 1 October 2010 covering the years 2008 to 2010. As part of this process JDA identified new employment equity targets and affirmative action requirements for the organisation going forward JDA includes the costs of implementing its Employment Equity and Affirmative Action activities adequately within its employee budgeted costs.
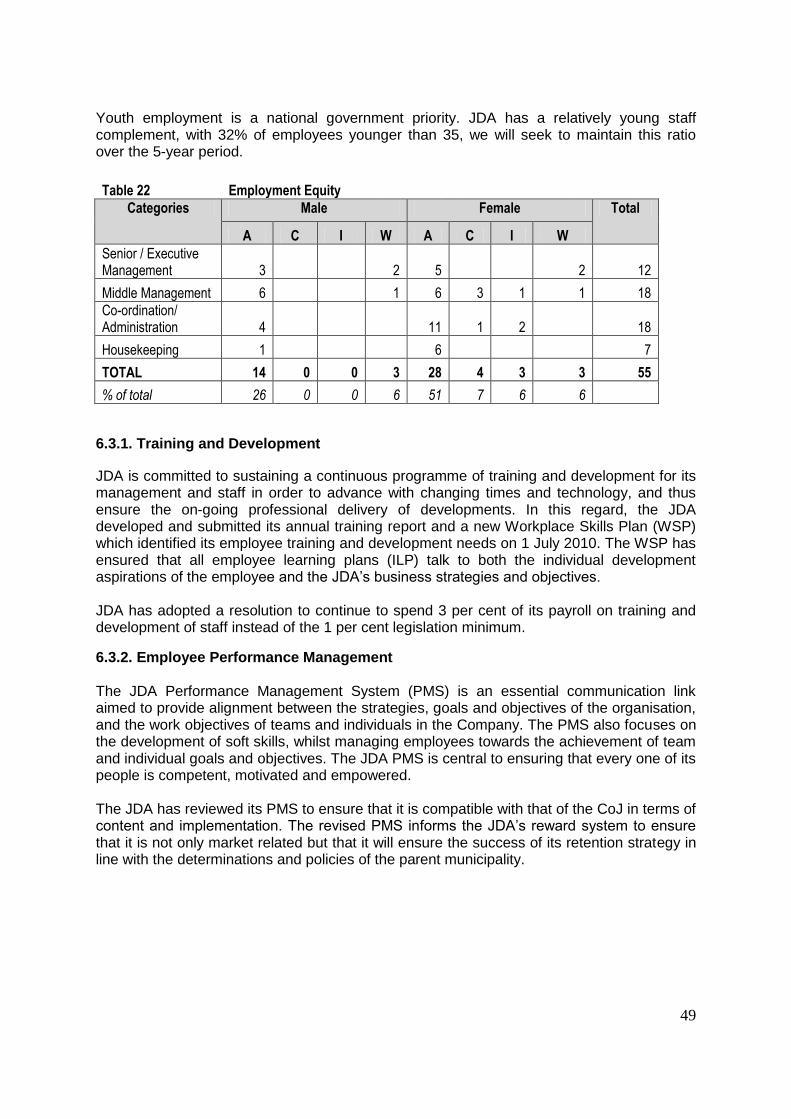
49
Youth employment is a national government priority. JDA has a relatively young staff complement, with 32% of employees younger than 35, we will seek to maintain this ratio over the 5-year period.
Table 22 Employment Equity Categories Male Female Total
A C I W A C I W
Senior / Executive Management 3 2 5 2 12
Middle Management 6 1 6 3 1 1 18
Co-ordination/ Administration 4 11 1 2 18
Housekeeping 1 6 7
TOTAL 14 0 0 3 28 4 3 3 55
% of total 26 0 0 6 51 7 6 6
6.3.1. Training and Development
JDA is committed to sustaining a continuous programme of training and development for its management and staff in order to advance with changing times and technology, and thus ensure the on-going professional delivery of developments. In this regard, the JDA developed and submitted its annual training report and a new Workplace Skills Plan (WSP) which identified its employee training and development needs on 1 July 2010. The WSP has ensured that all employee learning plans (ILP) talk to both the individual development aspirations of the employee and the JDA‟s business strategies and objectives. JDA has adopted a resolution to continue to spend 3 per cent of its payroll on training and development of staff instead of the 1 per cent legislation minimum.
6.3.2. Employee Performance Management The JDA Performance Management System (PMS) is an essential communication link aimed to provide alignment between the strategies, goals and objectives of the organisation, and the work objectives of teams and individuals in the Company. The PMS also focuses on the development of soft skills, whilst managing employees towards the achievement of team and individual goals and objectives. The JDA PMS is central to ensuring that every one of its people is competent, motivated and empowered. The JDA has reviewed its PMS to ensure that it is compatible with that of the CoJ in terms of content and implementation. The revised PMS informs the JDA‟s reward system to ensure that it is not only market related but that it will ensure the success of its retention strategy in line with the determinations and policies of the parent municipality.
50
7. RISK ASSESSMENT
The JDA Board monitors risks through a Development & Risk Committee. The Committee is responsible for evaluating development proposals with a view to making recommendations for approval to the Board. This entails examining risks associated with the proposed projects such as the risk financing, risk returns and risk profiles. Further, and primarily, the Committee bears accountability for ensuring that, there is an effective risk management process and system within the organisation. This approach does not relieve the JDA Board of its accountability and responsibility in ensuring that, an adequate and effective risk management system and process is in place, as the Board is expected to exercise the duty of care, skill, and diligence identifying, assessing and monitoring risks as presented by the Developments & Risk Committee. It recommends to the Board risk strategies and policies that need to be set, implemented and monitored. JDA‟s risk management strategy is guided by the principles of the enterprise-wide risk management system in terms of which all identified risk areas are managed systematically and continuously at the departmental level. The JDA has a risk register in place which is treated as a working risk management document of which the identified risks are constantly recorded and properly managed. The JDA‟s management monitors and evaluates the implementation and efficiency of management‟s controls and such actions identified as actions to improve current controls in the risk register. The JDA provides its risk management reports to the City‟s Group Risk Management Committee (GRMC). The GRMC assesses all risk affecting the City and its municipal entities in a holistic manner and provides advice and recommendations to the City Manager and Council on the general effectiveness of risk management processes within the whole City. All risk financing activities are managed holistically for the entire group by the City of Johannesburg. Key to this is ensuring that all risk financing activities are consolidated and managed centrally taking into account the City‟s business requirements and processes. CoJ maintains a combined third party insurance cover and self-insurance funding as one of the appropriate risk financing mechanism. The JDA ensures effective internal controls. This is undertaken through various functional divisions across the organisation. These functional division, where practically possible, maintain strict segregation of duties. These include the various Development Units, Supply Chain Management Unit, Risk & Compliance Unit and Finance Department.
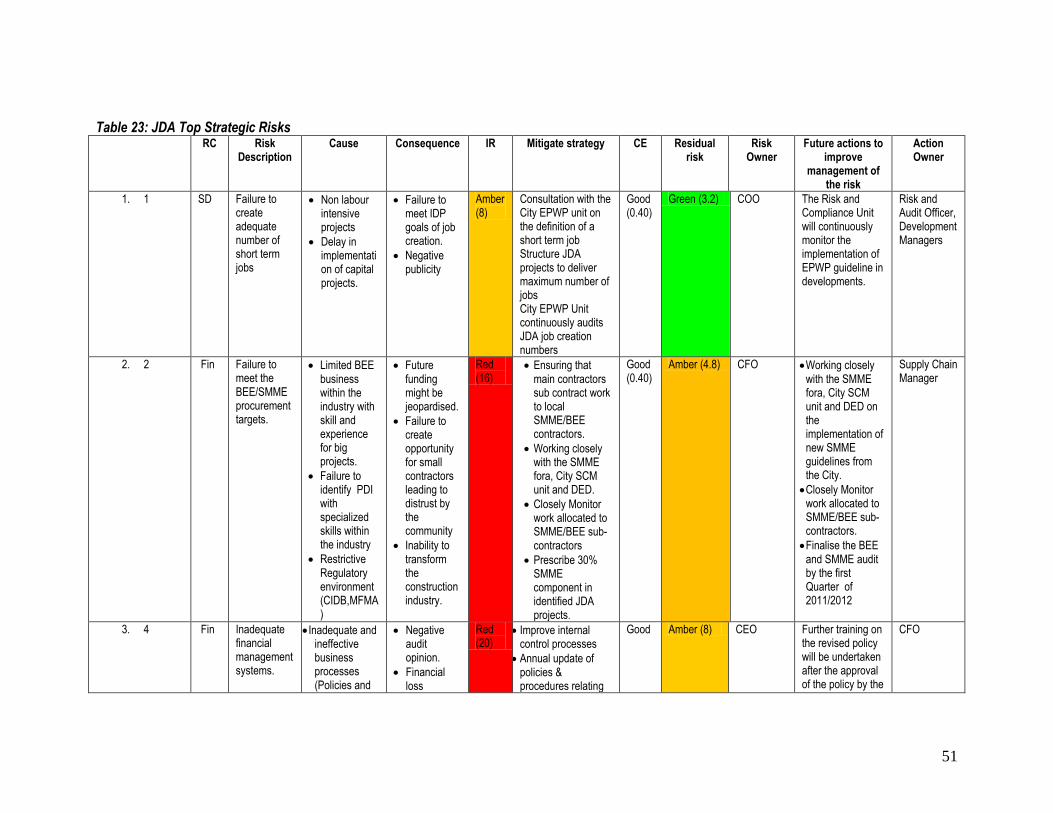
51
Table 23: JDA Top Strategic Risks
No
RC Risk Description
Cause Consequence IR Mitigate strategy CE Residual risk
Risk Owner
Future actions to improve
management of the risk
Action Owner
1. 1 SD Failure to create adequate number of short term jobs
Non labour intensive projects
Delay in implementation of capital projects.
Failure to meet IDP goals of job creation.
Negative publicity
Amber (8)
Consultation with the City EPWP unit on the definition of a short term job Structure JDA projects to deliver maximum number of jobs City EPWP Unit continuously audits JDA job creation numbers
Good (0.40)
Green (3.2) COO The Risk and Compliance Unit will continuously monitor the implementation of EPWP guideline in developments.
Risk and Audit Officer, Development Managers
2. 2 Fin Failure to meet the BEE/SMME procurement targets.
Limited BEE business within the industry with skill and experience for big projects.
Failure to identify PDI with specialized skills within the industry
Restrictive Regulatory environment (CIDB,MFMA)
Future funding might be jeopardised.
Failure to create opportunity for small contractors leading to distrust by the community
Inability to transform the construction industry.
Red (16)
Ensuring that main contractors sub contract work to local SMME/BEE contractors.
Working closely with the SMME fora, City SCM unit and DED.
Closely Monitor work allocated to SMME/BEE sub-contractors
Prescribe 30% SMME component in identified JDA projects.
Good (0.40)
Amber (4.8) CFO Working closely with the SMME fora, City SCM unit and DED on the implementation of new SMME guidelines from the City.
Closely Monitor work allocated to SMME/BEE sub-contractors.
Finalise the BEE and SMME audit by the first Quarter of 2011/2012
Supply Chain Manager
3. 4 Fin Inadequate financial management systems.
Inadequate and ineffective business processes (Policies and
Negative audit opinion.
Financial loss
Red (20)
Improve internal control processes
Annual update of policies & procedures relating
Good Amber (8) CEO Further training on the revised policy will be undertaken after the approval of the policy by the
CFO
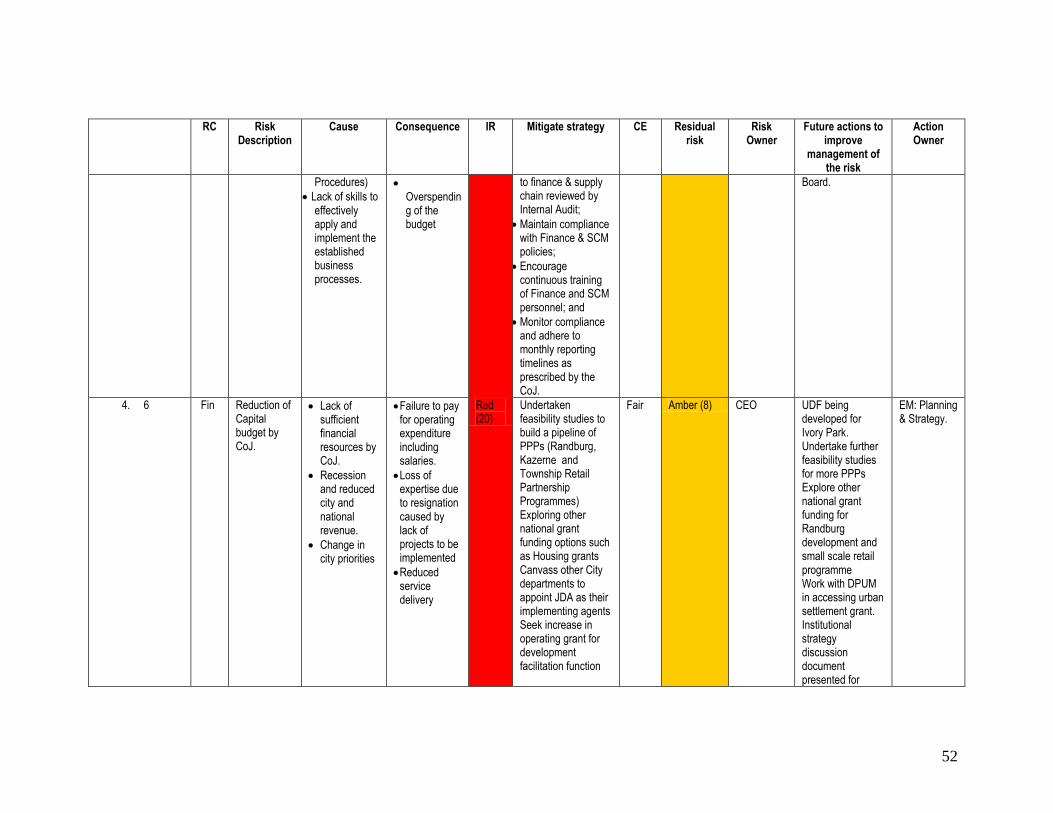
52
No
RC Risk Description
Cause Consequence IR Mitigate strategy CE Residual risk
Risk Owner
Future actions to improve
management of the risk
Action Owner
Procedures)
Lack of skills to effectively apply and implement the established business processes.
Overspending of the budget
to finance & supply chain reviewed by Internal Audit;
Maintain compliance with Finance & SCM policies;
Encourage continuous training of Finance and SCM personnel; and
Monitor compliance and adhere to monthly reporting timelines as prescribed by the CoJ.
Board.
4. 6 Fin Reduction of Capital budget by CoJ.
Lack of sufficient financial resources by CoJ.
Recession and reduced city and national revenue.
Change in city priorities
Failure to pay for operating expenditure including salaries.
Loss of expertise due to resignation caused by lack of projects to be implemented
Reduced service delivery
Red (20)
Undertaken feasibility studies to build a pipeline of PPPs (Randburg, Kazerne and Township Retail Partnership Programmes) Exploring other national grant funding options such as Housing grants Canvass other City departments to appoint JDA as their implementing agents Seek increase in operating grant for development facilitation function
Fair Amber (8) CEO UDF being developed for Ivory Park. Undertake further feasibility studies for more PPPs Explore other national grant funding for Randburg development and small scale retail programme Work with DPUM in accessing urban settlement grant. Institutional strategy discussion document presented for
EM: Planning & Strategy.
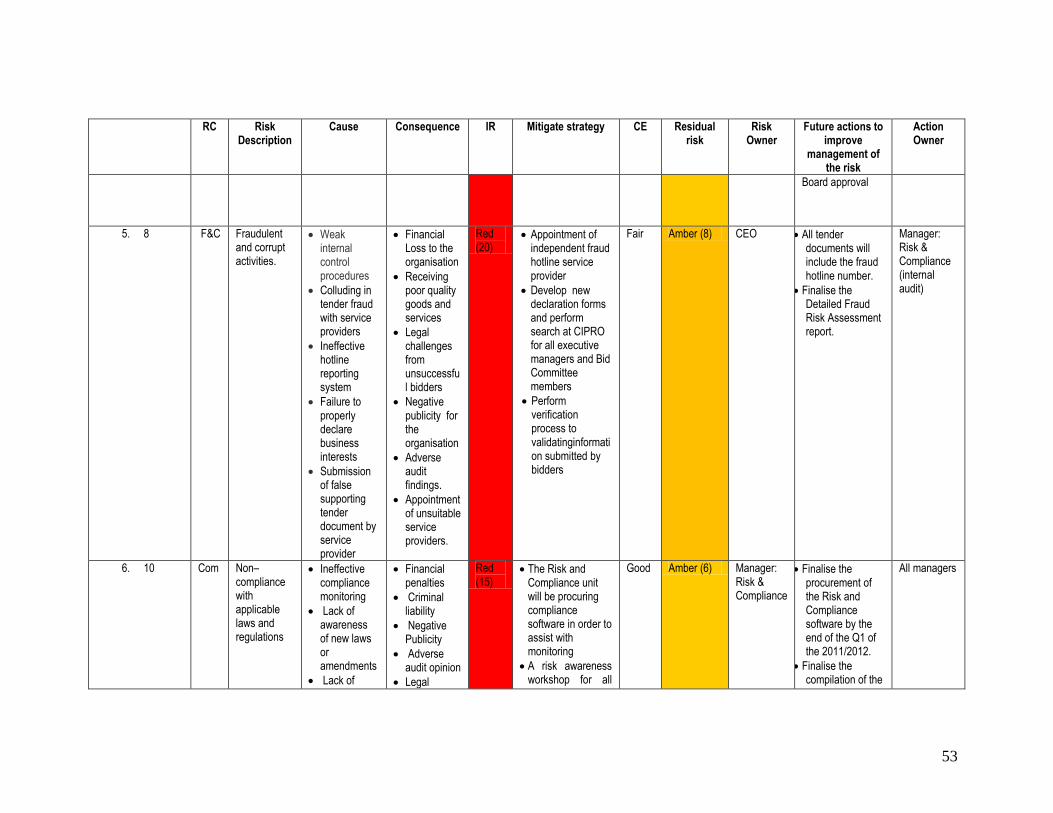
53
No
RC Risk Description
Cause Consequence IR Mitigate strategy CE Residual risk
Risk Owner
Future actions to improve
management of the risk
Action Owner
Board approval
5. 8 F&C Fraudulent and corrupt activities.
Weak internal control procedures
Colluding in tender fraud with service providers
Ineffective hotline reporting system
Failure to properly declare business interests
Submission of false supporting tender document by service provider
Financial Loss to the organisation
Receiving poor quality goods and services
Legal challenges from unsuccessful bidders
Negative publicity for the organisation
Adverse audit findings.
Appointment of unsuitable service providers.
Red (20)
Appointment of independent fraud hotline service provider
Develop new declaration forms and perform search at CIPRO for all executive managers and Bid Committee members
Perform verification process to validatinginformation submitted by bidders
Fair Amber (8) CEO All tender documents will include the fraud hotline number.
Finalise the Detailed Fraud Risk Assessment report.
Manager: Risk & Compliance (internal audit)
6. 10 Com Non–compliance with applicable laws and regulations
Ineffective compliance monitoring
Lack of awareness of new laws or amendments
Lack of
Financial penalties
Criminal liability
Negative Publicity
Adverse audit opinion
Legal
Red (15)
The Risk and Compliance unit will be procuring compliance software in order to assist with monitoring
A risk awareness workshop for all
Good Amber (6) Manager: Risk & Compliance
Finalise the procurement of the Risk and Compliance software by the end of the Q1 of the 2011/2012.
Finalise the compilation of the
All managers
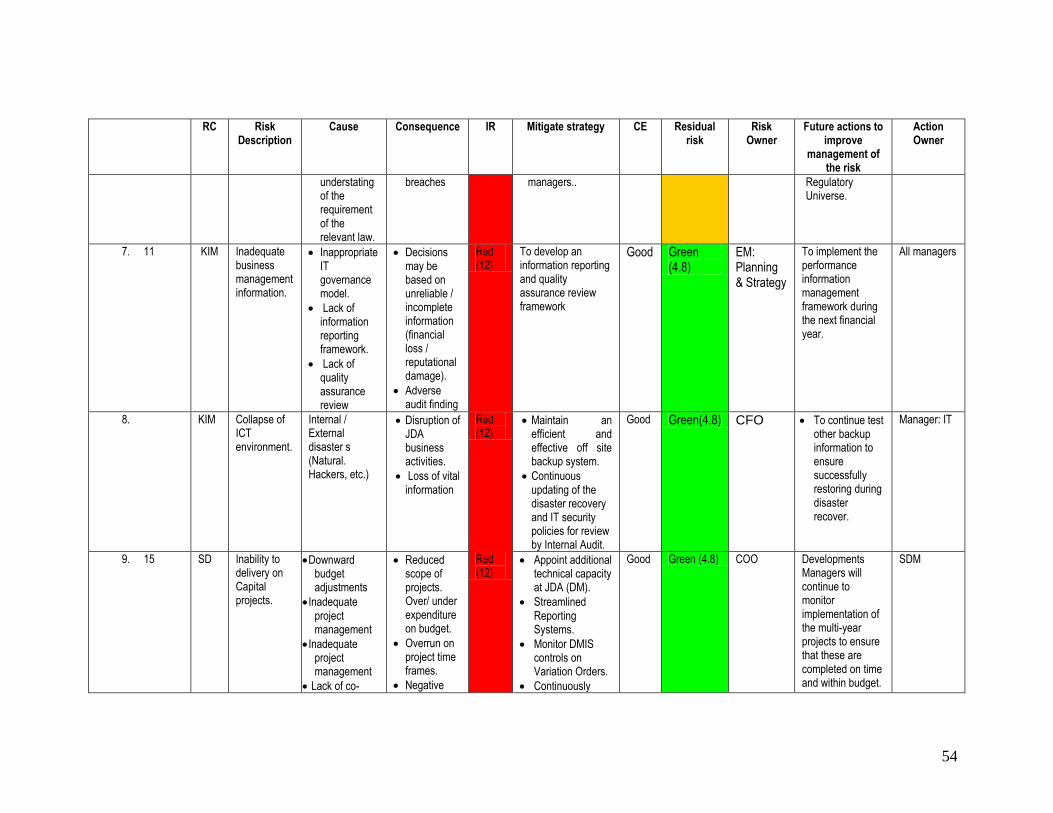
54
No
RC Risk Description
Cause Consequence IR Mitigate strategy CE Residual risk
Risk Owner
Future actions to improve
management of the risk
Action Owner
understating of the requirement of the relevant law.
breaches managers.. Regulatory Universe.
7. 11 KIM Inadequate business management information.
Inappropriate IT governance model.
Lack of information reporting framework.
Lack of quality assurance review
Decisions may be based on unreliable / incomplete information (financial loss / reputational damage).
Adverse audit finding
Red (12)
To develop an information reporting and quality assurance review framework
Good Green (4.8)
EM: Planning & Strategy
To implement the performance information management framework during the next financial year.
All managers
8. KIM Collapse of ICT environment.
Internal / External disaster s (Natural. Hackers, etc.)
Disruption of JDA business activities.
Loss of vital information
Red (12)
Maintain an efficient and effective off site backup system.
Continuous updating of the disaster recovery and IT security policies for review by Internal Audit.
Good Green(4.8) CFO To continue test other backup information to ensure successfully restoring during disaster recover.
Manager: IT
9. 15 SD Inability to delivery on Capital projects.
Downward budget adjustments
Inadequate project management
Inadequate project management
Lack of co-
Reduced scope of projects. Over/ under expenditure on budget.
Overrun on project time frames.
Negative
Red (12)
Appoint additional technical capacity at JDA (DM).
Streamlined Reporting Systems.
Monitor DMIS controls on Variation Orders.
Continuously
Good Green (4.8) COO Developments Managers will continue to monitor implementation of the multi-year projects to ensure that these are completed on time and within budget.
SDM
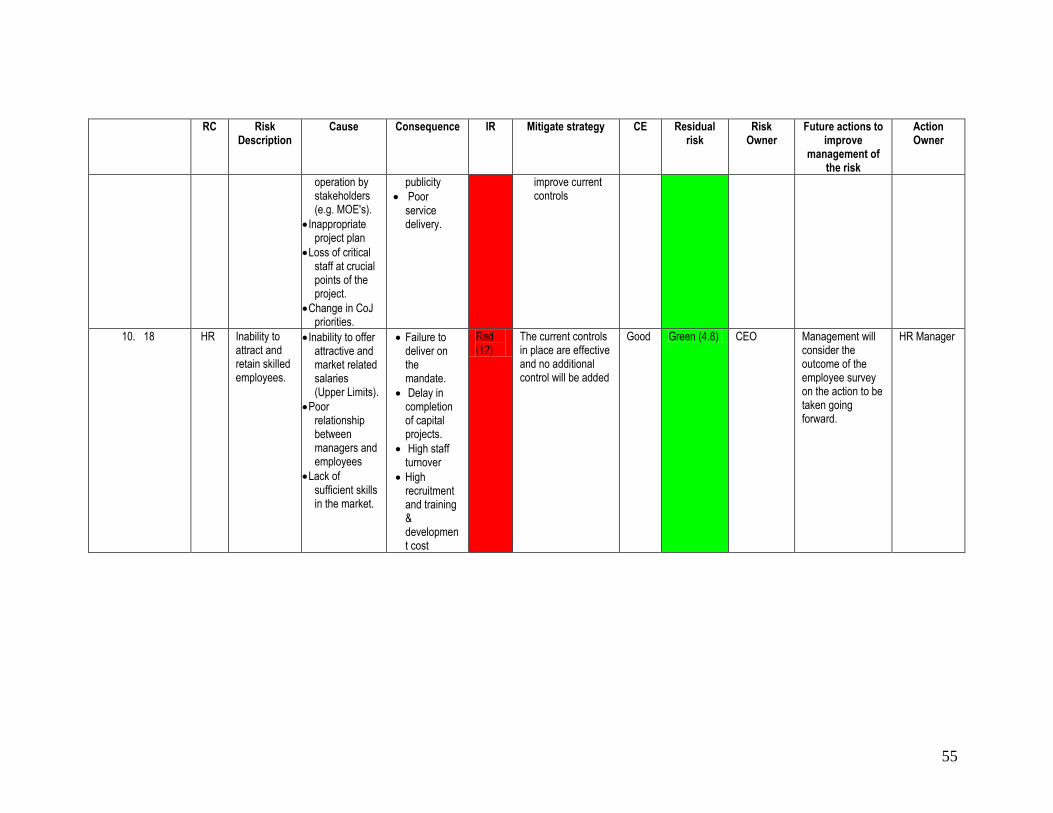
55
No
RC Risk Description
Cause Consequence IR Mitigate strategy CE Residual risk
Risk Owner
Future actions to improve
management of the risk
Action Owner
operation by stakeholders (e.g. MOE's).
Inappropriate project plan
Loss of critical staff at crucial points of the project.
Change in CoJ priorities.
publicity
Poor service delivery.
improve current controls
10. 18 HR Inability to attract and retain skilled employees.
Inability to offer attractive and market related salaries (Upper Limits).
Poor relationship between managers and employees
Lack of sufficient skills in the market.
Failure to deliver on the mandate.
Delay in completion of capital projects.
High staff turnover
High recruitment and training & development cost
Red (12)
The current controls in place are effective and no additional control will be added
Good Green (4.8) CEO Management will consider the outcome of the employee survey on the action to be taken going forward.
HR Manager

56
8. APPENDICES
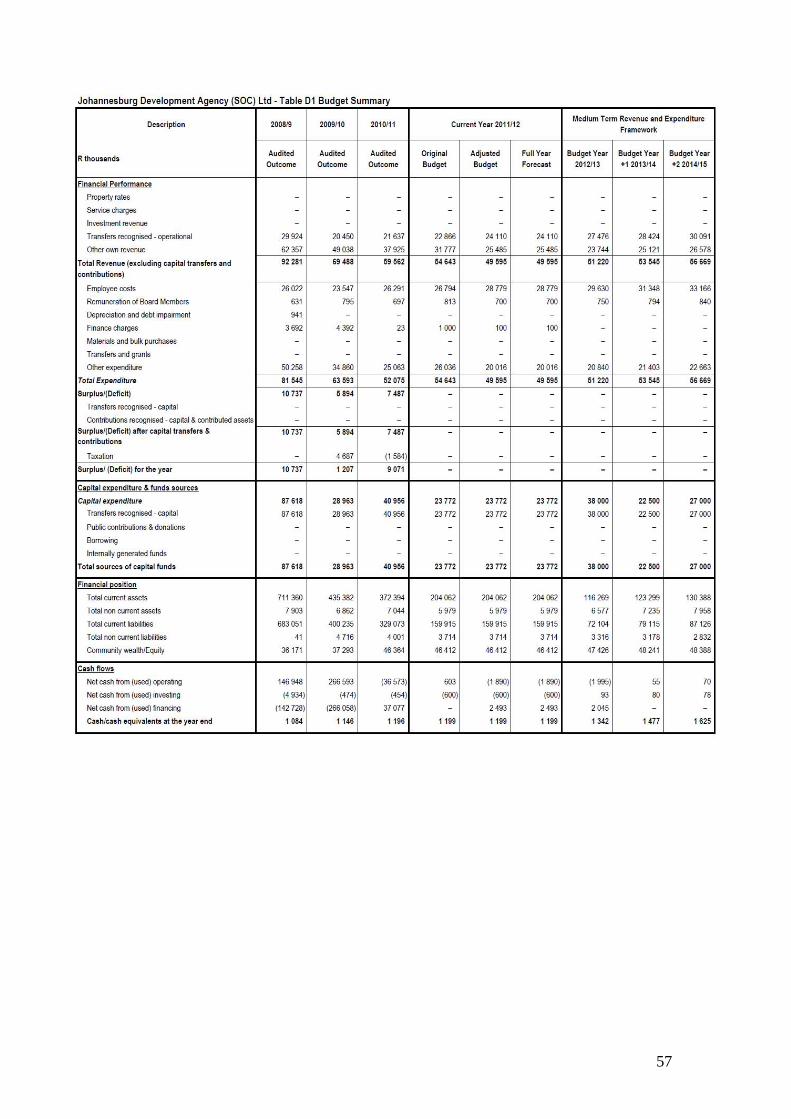
57
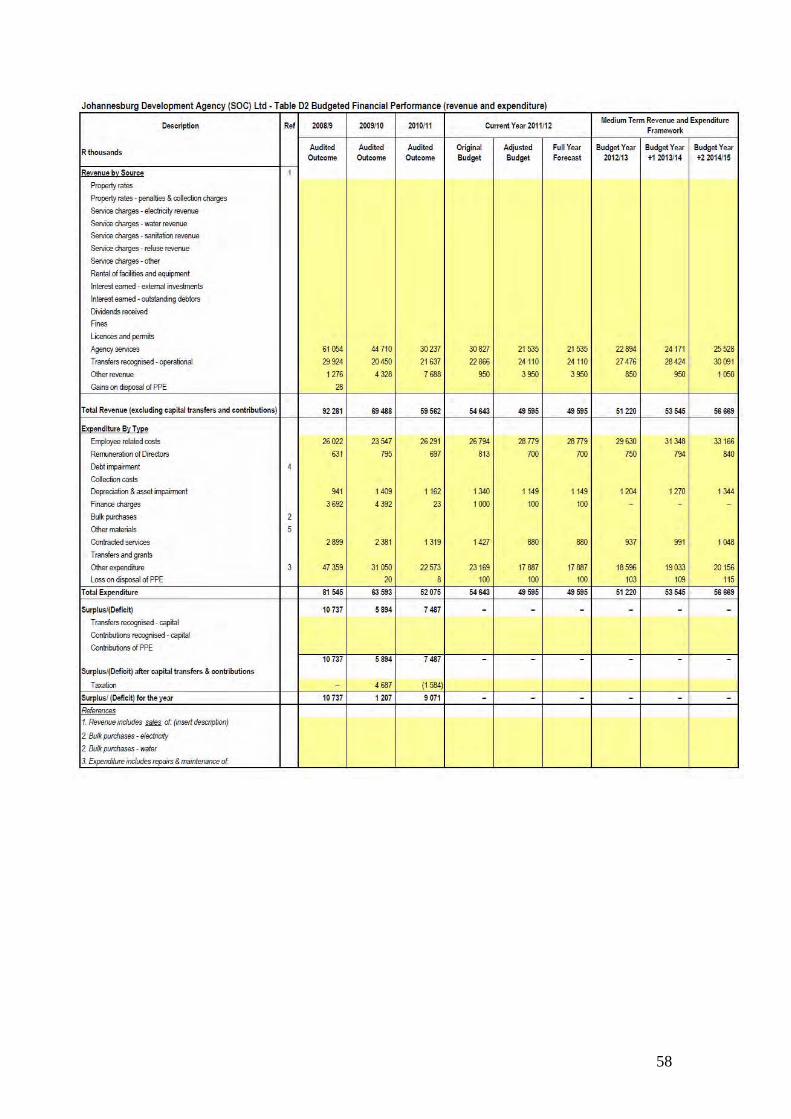
58
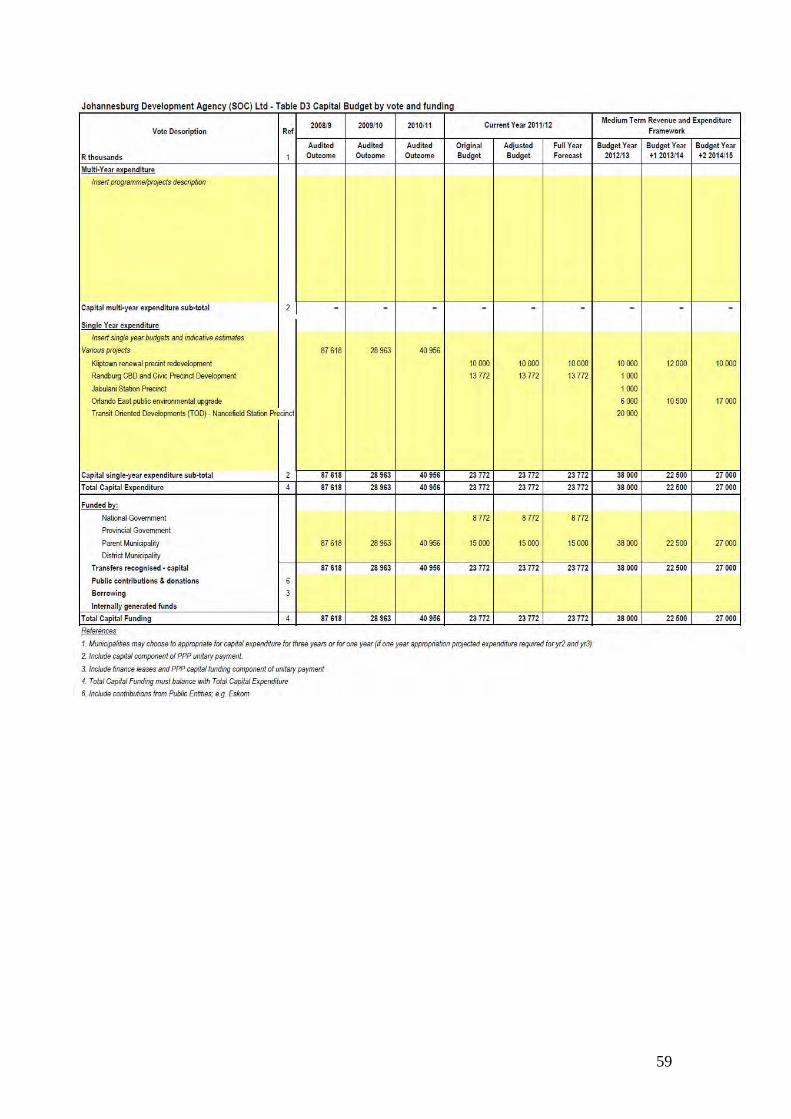
59
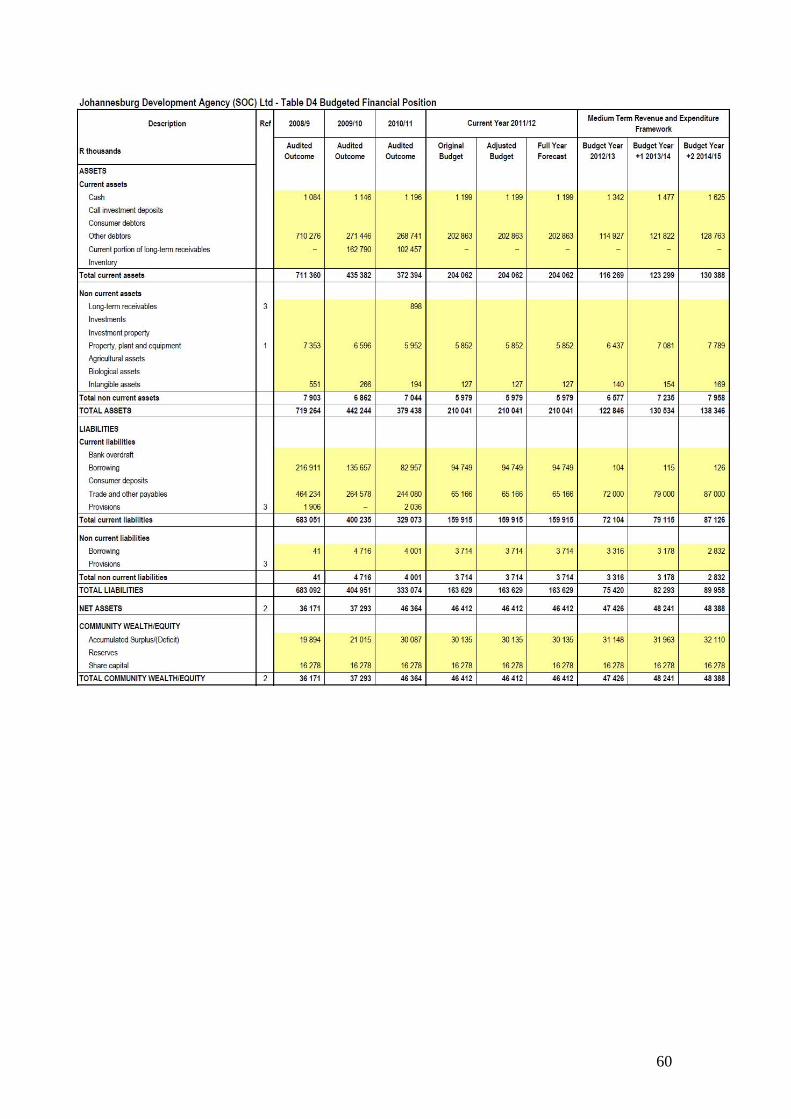
60
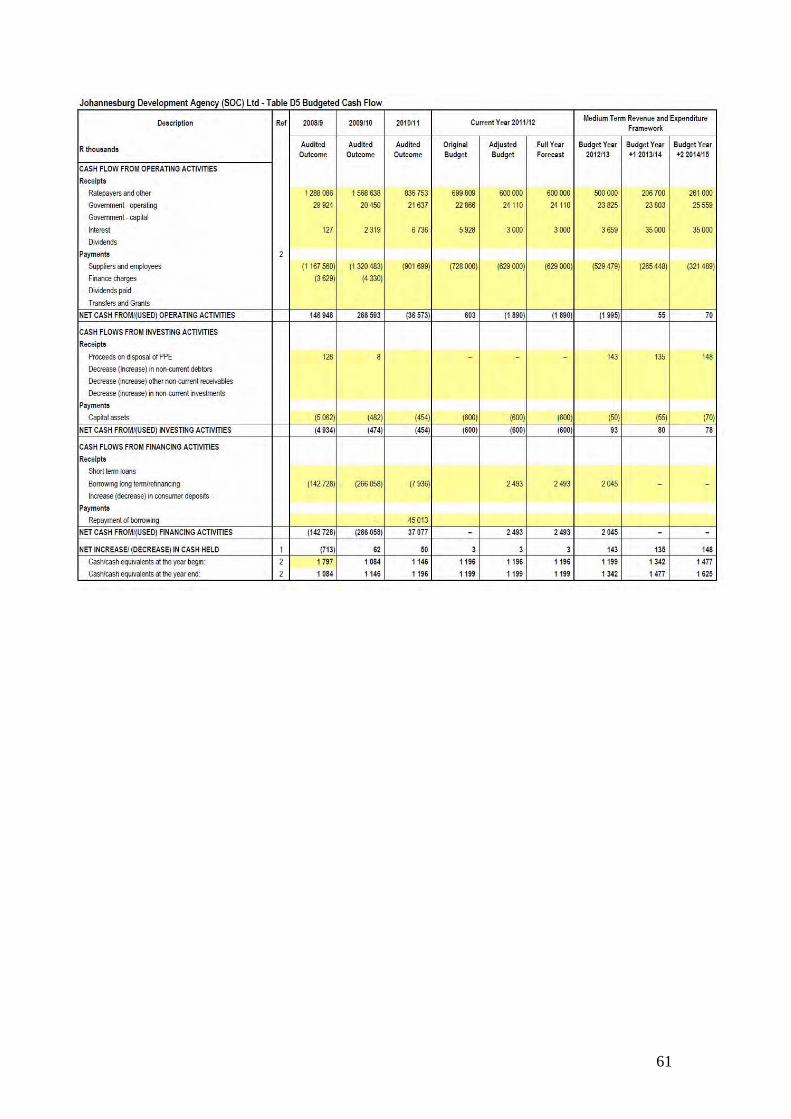
61
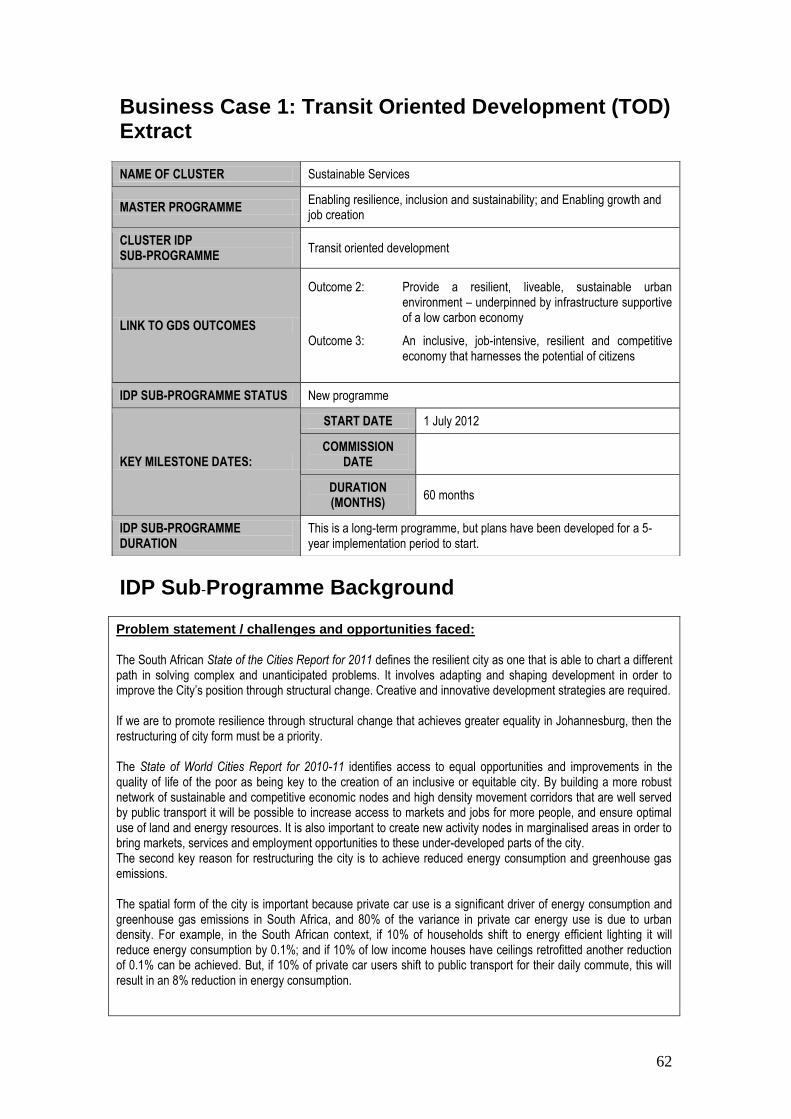
62
Business Case 1: Transit Oriented Development (TOD) Extract
IDP Sub-Programme Background
Problem statement / challenges and opportunities faced: The South African State of the Cities Report for 2011 defines the resilient city as one that is able to chart a different path in solving complex and unanticipated problems. It involves adapting and shaping development in order to improve the City‟s position through structural change. Creative and innovative development strategies are required. If we are to promote resilience through structural change that achieves greater equality in Johannesburg, then the restructuring of city form must be a priority. The State of World Cities Report for 2010-11 identifies access to equal opportunities and improvements in the quality of life of the poor as being key to the creation of an inclusive or equitable city. By building a more robust network of sustainable and competitive economic nodes and high density movement corridors that are well served by public transport it will be possible to increase access to markets and jobs for more people, and ensure optimal use of land and energy resources. It is also important to create new activity nodes in marginalised areas in order to bring markets, services and employment opportunities to these under-developed parts of the city. The second key reason for restructuring the city is to achieve reduced energy consumption and greenhouse gas emissions. The spatial form of the city is important because private car use is a significant driver of energy consumption and greenhouse gas emissions in South Africa, and 80% of the variance in private car energy use is due to urban density. For example, in the South African context, if 10% of households shift to energy efficient lighting it will reduce energy consumption by 0.1%; and if 10% of low income houses have ceilings retrofitted another reduction of 0.1% can be achieved. But, if 10% of private car users shift to public transport for their daily commute, this will result in an 8% reduction in energy consumption.
NAME OF CLUSTER Sustainable Services
MASTER PROGRAMME Enabling resilience, inclusion and sustainability; and Enabling growth and job creation
CLUSTER IDP SUB-PROGRAMME
Transit oriented development
LINK TO GDS OUTCOMES
Outcome 2: Provide a resilient, liveable, sustainable urban environment – underpinned by infrastructure supportive of a low carbon economy
Outcome 3: An inclusive, job-intensive, resilient and competitive economy that harnesses the potential of citizens
IDP SUB-PROGRAMME STATUS New programme
KEY MILESTONE DATES:
START DATE 1 July 2012
COMMISSION DATE
DURATION (MONTHS)
60 months
IDP SUB-PROGRAMME DURATION
This is a long-term programme, but plans have been developed for a 5-year implementation period to start.
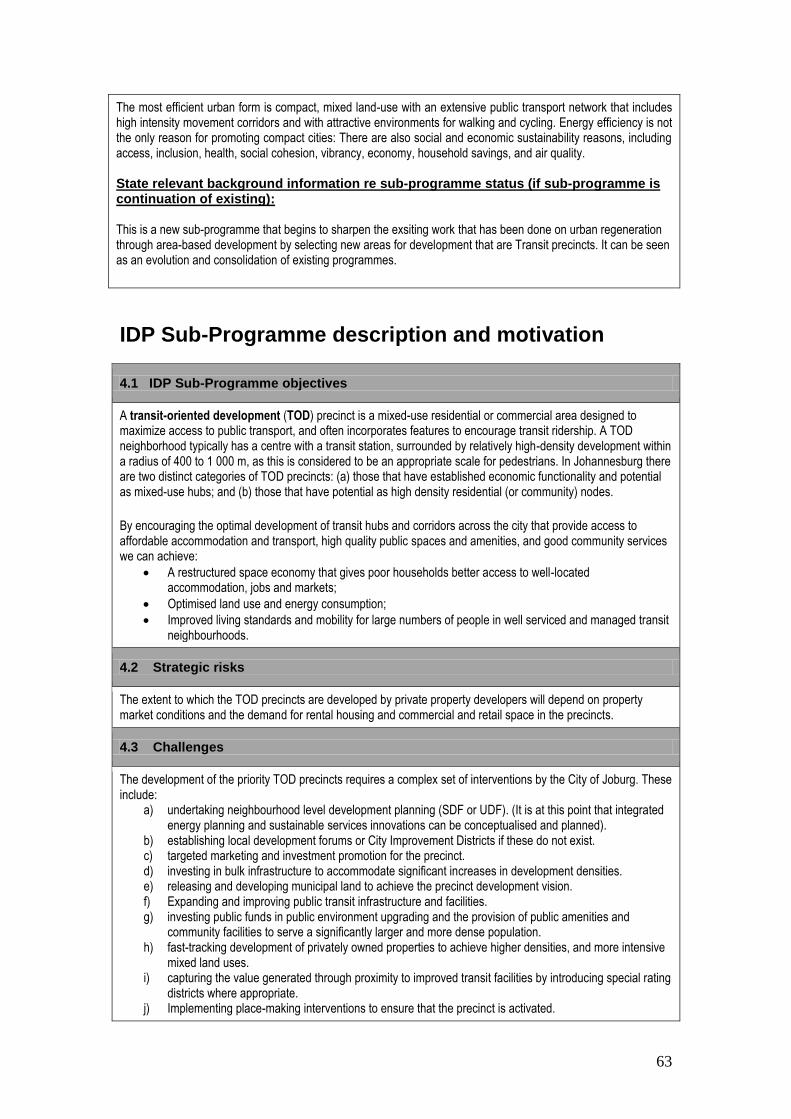
63
The most efficient urban form is compact, mixed land-use with an extensive public transport network that includes high intensity movement corridors and with attractive environments for walking and cycling. Energy efficiency is not the only reason for promoting compact cities: There are also social and economic sustainability reasons, including access, inclusion, health, social cohesion, vibrancy, economy, household savings, and air quality. State relevant background information re sub-programme status (if sub-programme is continuation of existing): This is a new sub-programme that begins to sharpen the exsiting work that has been done on urban regeneration through area-based development by selecting new areas for development that are Transit precincts. It can be seen as an evolution and consolidation of existing programmes.
IDP Sub-Programme description and motivation
4.1 IDP Sub-Programme objectives
A transit-oriented development (TOD) precinct is a mixed-use residential or commercial area designed to maximize access to public transport, and often incorporates features to encourage transit ridership. A TOD neighborhood typically has a centre with a transit station, surrounded by relatively high-density development within a radius of 400 to 1 000 m, as this is considered to be an appropriate scale for pedestrians. In Johannesburg there are two distinct categories of TOD precincts: (a) those that have established economic functionality and potential as mixed-use hubs; and (b) those that have potential as high density residential (or community) nodes.
By encouraging the optimal development of transit hubs and corridors across the city that provide access to affordable accommodation and transport, high quality public spaces and amenities, and good community services we can achieve:
A restructured space economy that gives poor households better access to well-located accommodation, jobs and markets;
Optimised land use and energy consumption;
Improved living standards and mobility for large numbers of people in well serviced and managed transit neighbourhoods.
4.2 Strategic risks
The extent to which the TOD precincts are developed by private property developers will depend on property market conditions and the demand for rental housing and commercial and retail space in the precincts.
4.3 Challenges
The development of the priority TOD precincts requires a complex set of interventions by the City of Joburg. These include:
a) undertaking neighbourhood level development planning (SDF or UDF). (It is at this point that integrated energy planning and sustainable services innovations can be conceptualised and planned).
b) establishing local development forums or City Improvement Districts if these do not exist. c) targeted marketing and investment promotion for the precinct. d) investing in bulk infrastructure to accommodate significant increases in development densities. e) releasing and developing municipal land to achieve the precinct development vision. f) Expanding and improving public transit infrastructure and facilities. g) investing public funds in public environment upgrading and the provision of public amenities and
community facilities to serve a significantly larger and more dense population. h) fast-tracking development of privately owned properties to achieve higher densities, and more intensive
mixed land uses. i) capturing the value generated through proximity to improved transit facilities by introducing special rating
districts where appropriate. j) Implementing place-making interventions to ensure that the precinct is activated.
64
In order to ensure that these activities are coordinated and appropriately sequenced, there is a need for over-arching development facilitation capacity. The existing Development Planning and Facilitation capacity is not adequate for this purpose.
4.4 Dependencies
The achievement of optimal land use and population densities in the TOD precincts will depend on a collective effort by all of the identified departments and entities. Other key dependencies include achieving inclusionary housing targets through deals with private property developers; and releasing suitable city-owned properties for development.
4.5 Innovation
While Transit Oriented Development is an internationally recognized leading practice, in almost every case the resultant rising land values and rentals cause the displacement of poor people. The up-market retail that surrounds most railway stations in European cities provides an example. In Johannesburg the TOD programme is primarily about restructuring the space economy to ensure that there is a significant supply of affordable housing and inclusionary retail in all TOD precincts (and especially those precincts in established parts of town like the inner city, Randburg and Sandton. This inclusive approach to TOD represents innovation in terms of „making markets work for the poor‟ (M4P) principles in particular.
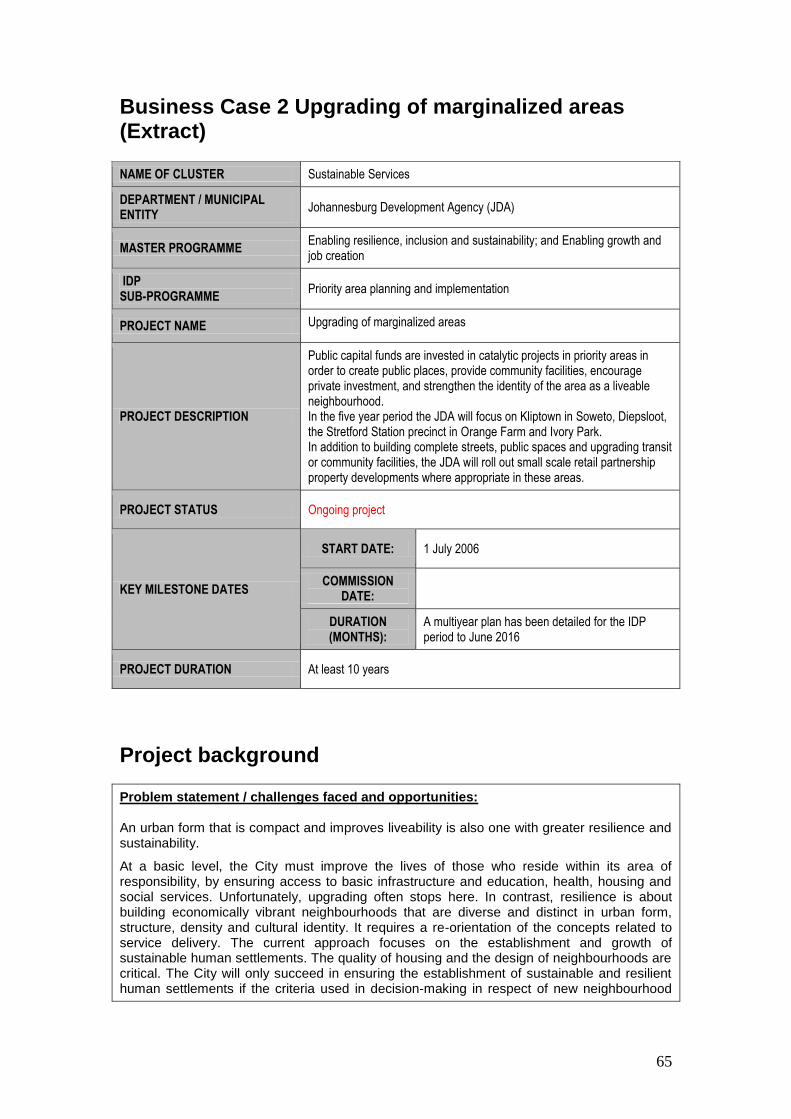
65
Business Case 2 Upgrading of marginalized areas (Extract)
Project background
Problem statement / challenges faced and opportunities: An urban form that is compact and improves liveability is also one with greater resilience and sustainability.
At a basic level, the City must improve the lives of those who reside within its area of responsibility, by ensuring access to basic infrastructure and education, health, housing and social services. Unfortunately, upgrading often stops here. In contrast, resilience is about building economically vibrant neighbourhoods that are diverse and distinct in urban form, structure, density and cultural identity. It requires a re-orientation of the concepts related to service delivery. The current approach focuses on the establishment and growth of sustainable human settlements. The quality of housing and the design of neighbourhoods are critical. The City will only succeed in ensuring the establishment of sustainable and resilient human settlements if the criteria used in decision-making in respect of new neighbourhood
NAME OF CLUSTER Sustainable Services
DEPARTMENT / MUNICIPAL ENTITY
Johannesburg Development Agency (JDA)
MASTER PROGRAMME Enabling resilience, inclusion and sustainability; and Enabling growth and job creation
IDP SUB-PROGRAMME
Priority area planning and implementation
PROJECT NAME Upgrading of marginalized areas
PROJECT DESCRIPTION
Public capital funds are invested in catalytic projects in priority areas in order to create public places, provide community facilities, encourage private investment, and strengthen the identity of the area as a liveable neighbourhood. In the five year period the JDA will focus on Kliptown in Soweto, Diepsloot, the Stretford Station precinct in Orange Farm and Ivory Park. In addition to building complete streets, public spaces and upgrading transit or community facilities, the JDA will roll out small scale retail partnership property developments where appropriate in these areas.
PROJECT STATUS Ongoing project
KEY MILESTONE DATES
START DATE: 1 July 2006
COMMISSION DATE:
DURATION (MONTHS):
A multiyear plan has been detailed for the IDP period to June 2016
PROJECT DURATION At least 10 years
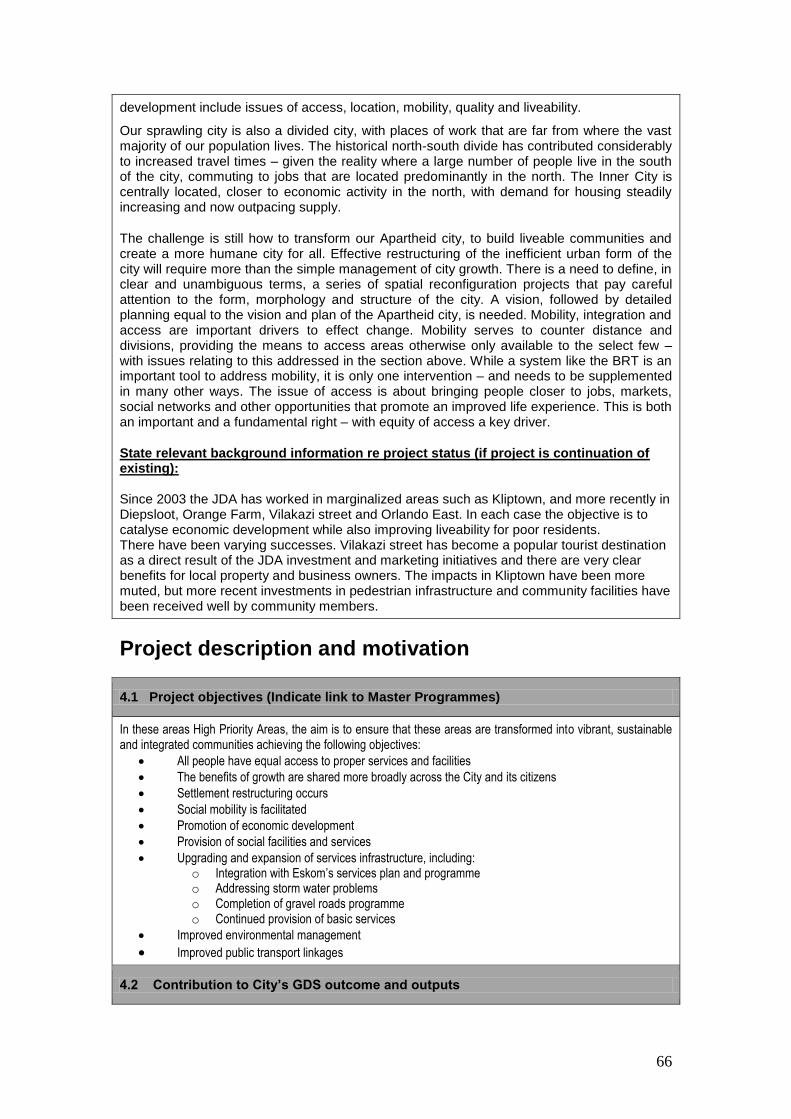
66
development include issues of access, location, mobility, quality and liveability.
Our sprawling city is also a divided city, with places of work that are far from where the vast majority of our population lives. The historical north-south divide has contributed considerably to increased travel times – given the reality where a large number of people live in the south of the city, commuting to jobs that are located predominantly in the north. The Inner City is centrally located, closer to economic activity in the north, with demand for housing steadily increasing and now outpacing supply.
The challenge is still how to transform our Apartheid city, to build liveable communities and create a more humane city for all. Effective restructuring of the inefficient urban form of the city will require more than the simple management of city growth. There is a need to define, in clear and unambiguous terms, a series of spatial reconfiguration projects that pay careful attention to the form, morphology and structure of the city. A vision, followed by detailed planning equal to the vision and plan of the Apartheid city, is needed. Mobility, integration and access are important drivers to effect change. Mobility serves to counter distance and divisions, providing the means to access areas otherwise only available to the select few – with issues relating to this addressed in the section above. While a system like the BRT is an important tool to address mobility, it is only one intervention – and needs to be supplemented in many other ways. The issue of access is about bringing people closer to jobs, markets, social networks and other opportunities that promote an improved life experience. This is both an important and a fundamental right – with equity of access a key driver.
State relevant background information re project status (if project is continuation of existing): Since 2003 the JDA has worked in marginalized areas such as Kliptown, and more recently in Diepsloot, Orange Farm, Vilakazi street and Orlando East. In each case the objective is to catalyse economic development while also improving liveability for poor residents. There have been varying successes. Vilakazi street has become a popular tourist destination as a direct result of the JDA investment and marketing initiatives and there are very clear benefits for local property and business owners. The impacts in Kliptown have been more muted, but more recent investments in pedestrian infrastructure and community facilities have been received well by community members.
Project description and motivation
4.1 Project objectives (Indicate link to Master Programmes)
In these areas High Priority Areas, the aim is to ensure that these areas are transformed into vibrant, sustainable and integrated communities achieving the following objectives:
All people have equal access to proper services and facilities
The benefits of growth are shared more broadly across the City and its citizens
Settlement restructuring occurs
Social mobility is facilitated
Promotion of economic development
Provision of social facilities and services
Upgrading and expansion of services infrastructure, including: o Integration with Eskom‟s services plan and programme o Addressing storm water problems o Completion of gravel roads programme o Continued provision of basic services
Improved environmental management
Improved public transport linkages
4.2 Contribution to City’s GDS outcome and outputs
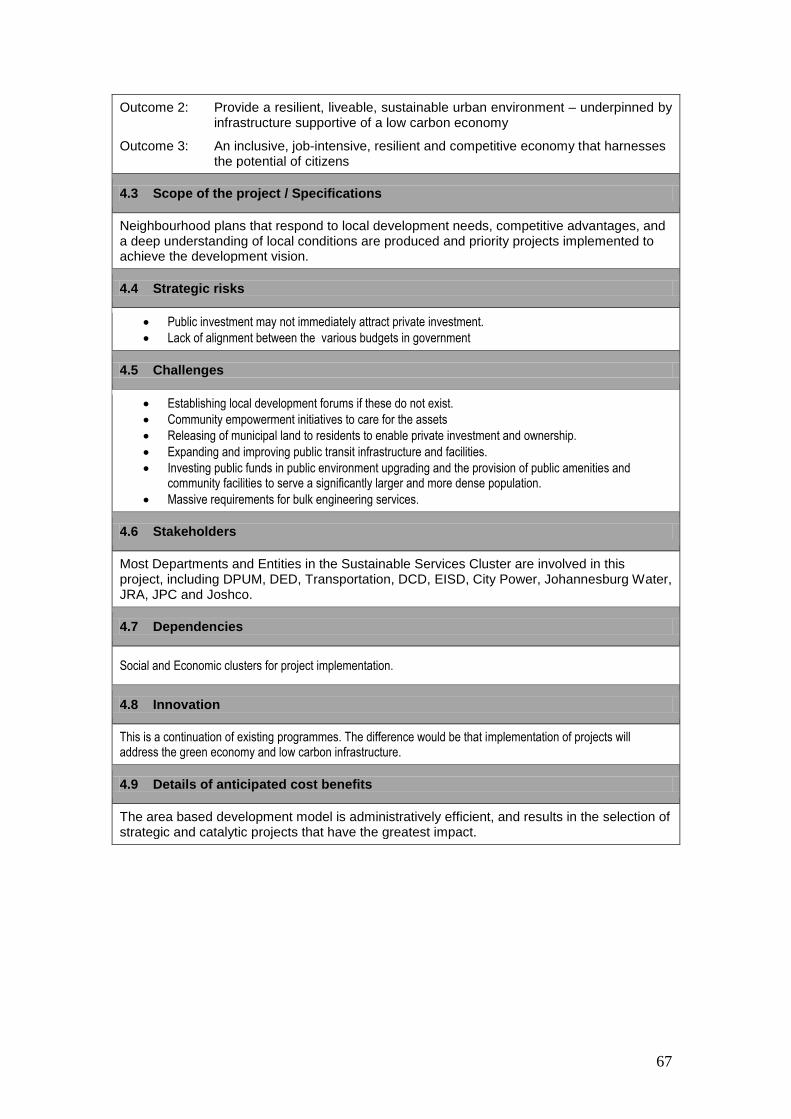
67
Outcome 2: Provide a resilient, liveable, sustainable urban environment – underpinned by infrastructure supportive of a low carbon economy
Outcome 3: An inclusive, job-intensive, resilient and competitive economy that harnesses the potential of citizens
4.3 Scope of the project / Specifications
Neighbourhood plans that respond to local development needs, competitive advantages, and a deep understanding of local conditions are produced and priority projects implemented to achieve the development vision.
4.4 Strategic risks
Public investment may not immediately attract private investment.
Lack of alignment between the various budgets in government
4.5 Challenges
Establishing local development forums if these do not exist.
Community empowerment initiatives to care for the assets
Releasing of municipal land to residents to enable private investment and ownership.
Expanding and improving public transit infrastructure and facilities.
Investing public funds in public environment upgrading and the provision of public amenities and community facilities to serve a significantly larger and more dense population.
Massive requirements for bulk engineering services.
4.6 Stakeholders
Most Departments and Entities in the Sustainable Services Cluster are involved in this project, including DPUM, DED, Transportation, DCD, EISD, City Power, Johannesburg Water, JRA, JPC and Joshco.
4.7 Dependencies
Social and Economic clusters for project implementation.
4.8 Innovation
This is a continuation of existing programmes. The difference would be that implementation of projects will address the green economy and low carbon infrastructure.
4.9 Details of anticipated cost benefits
The area based development model is administratively efficient, and results in the selection of strategic and catalytic projects that have the greatest impact.
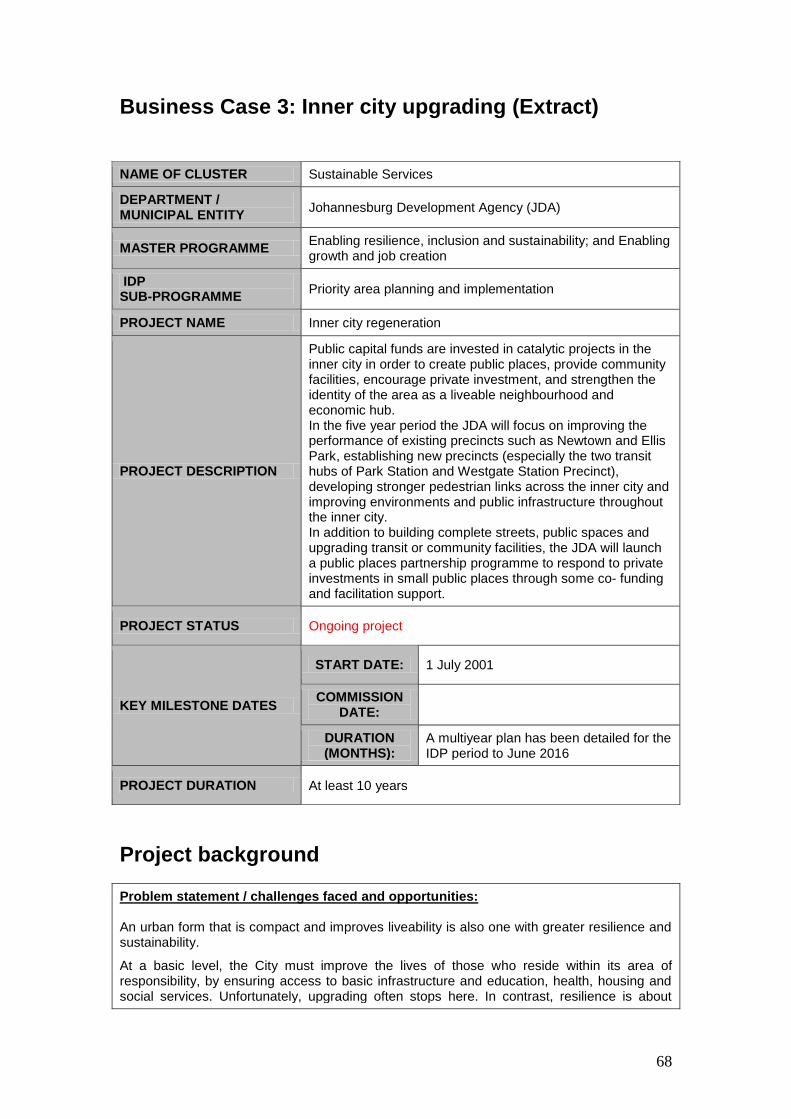
68
Business Case 3: Inner city upgrading (Extract)
Project background
Problem statement / challenges faced and opportunities: An urban form that is compact and improves liveability is also one with greater resilience and sustainability.
At a basic level, the City must improve the lives of those who reside within its area of responsibility, by ensuring access to basic infrastructure and education, health, housing and social services. Unfortunately, upgrading often stops here. In contrast, resilience is about
NAME OF CLUSTER Sustainable Services
DEPARTMENT / MUNICIPAL ENTITY
Johannesburg Development Agency (JDA)
MASTER PROGRAMME Enabling resilience, inclusion and sustainability; and Enabling growth and job creation
IDP SUB-PROGRAMME
Priority area planning and implementation
PROJECT NAME Inner city regeneration
PROJECT DESCRIPTION
Public capital funds are invested in catalytic projects in the inner city in order to create public places, provide community facilities, encourage private investment, and strengthen the identity of the area as a liveable neighbourhood and economic hub. In the five year period the JDA will focus on improving the performance of existing precincts such as Newtown and Ellis Park, establishing new precincts (especially the two transit hubs of Park Station and Westgate Station Precinct), developing stronger pedestrian links across the inner city and improving environments and public infrastructure throughout the inner city. In addition to building complete streets, public spaces and upgrading transit or community facilities, the JDA will launch a public places partnership programme to respond to private investments in small public places through some co- funding and facilitation support.
PROJECT STATUS Ongoing project
KEY MILESTONE DATES
START DATE: 1 July 2001
COMMISSION DATE:
DURATION (MONTHS):
A multiyear plan has been detailed for the IDP period to June 2016
PROJECT DURATION At least 10 years
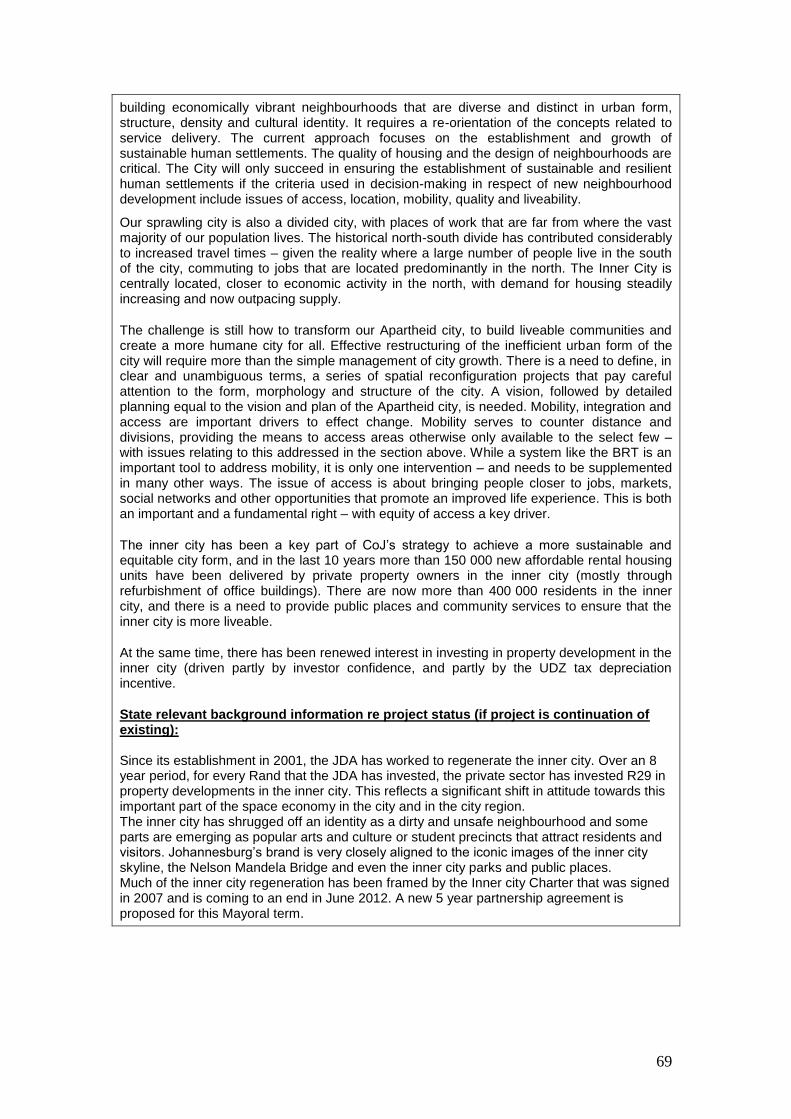
69
building economically vibrant neighbourhoods that are diverse and distinct in urban form, structure, density and cultural identity. It requires a re-orientation of the concepts related to service delivery. The current approach focuses on the establishment and growth of sustainable human settlements. The quality of housing and the design of neighbourhoods are critical. The City will only succeed in ensuring the establishment of sustainable and resilient human settlements if the criteria used in decision-making in respect of new neighbourhood development include issues of access, location, mobility, quality and liveability.
Our sprawling city is also a divided city, with places of work that are far from where the vast majority of our population lives. The historical north-south divide has contributed considerably to increased travel times – given the reality where a large number of people live in the south of the city, commuting to jobs that are located predominantly in the north. The Inner City is centrally located, closer to economic activity in the north, with demand for housing steadily increasing and now outpacing supply.
The challenge is still how to transform our Apartheid city, to build liveable communities and create a more humane city for all. Effective restructuring of the inefficient urban form of the city will require more than the simple management of city growth. There is a need to define, in clear and unambiguous terms, a series of spatial reconfiguration projects that pay careful attention to the form, morphology and structure of the city. A vision, followed by detailed planning equal to the vision and plan of the Apartheid city, is needed. Mobility, integration and access are important drivers to effect change. Mobility serves to counter distance and divisions, providing the means to access areas otherwise only available to the select few – with issues relating to this addressed in the section above. While a system like the BRT is an important tool to address mobility, it is only one intervention – and needs to be supplemented in many other ways. The issue of access is about bringing people closer to jobs, markets, social networks and other opportunities that promote an improved life experience. This is both an important and a fundamental right – with equity of access a key driver.
The inner city has been a key part of CoJ‟s strategy to achieve a more sustainable and equitable city form, and in the last 10 years more than 150 000 new affordable rental housing units have been delivered by private property owners in the inner city (mostly through refurbishment of office buildings). There are now more than 400 000 residents in the inner city, and there is a need to provide public places and community services to ensure that the inner city is more liveable.
At the same time, there has been renewed interest in investing in property development in the inner city (driven partly by investor confidence, and partly by the UDZ tax depreciation incentive.
State relevant background information re project status (if project is continuation of existing): Since its establishment in 2001, the JDA has worked to regenerate the inner city. Over an 8 year period, for every Rand that the JDA has invested, the private sector has invested R29 in property developments in the inner city. This reflects a significant shift in attitude towards this important part of the space economy in the city and in the city region. The inner city has shrugged off an identity as a dirty and unsafe neighbourhood and some parts are emerging as popular arts and culture or student precincts that attract residents and visitors. Johannesburg‟s brand is very closely aligned to the iconic images of the inner city skyline, the Nelson Mandela Bridge and even the inner city parks and public places. Much of the inner city regeneration has been framed by the Inner city Charter that was signed in 2007 and is coming to an end in June 2012. A new 5 year partnership agreement is proposed for this Mayoral term.
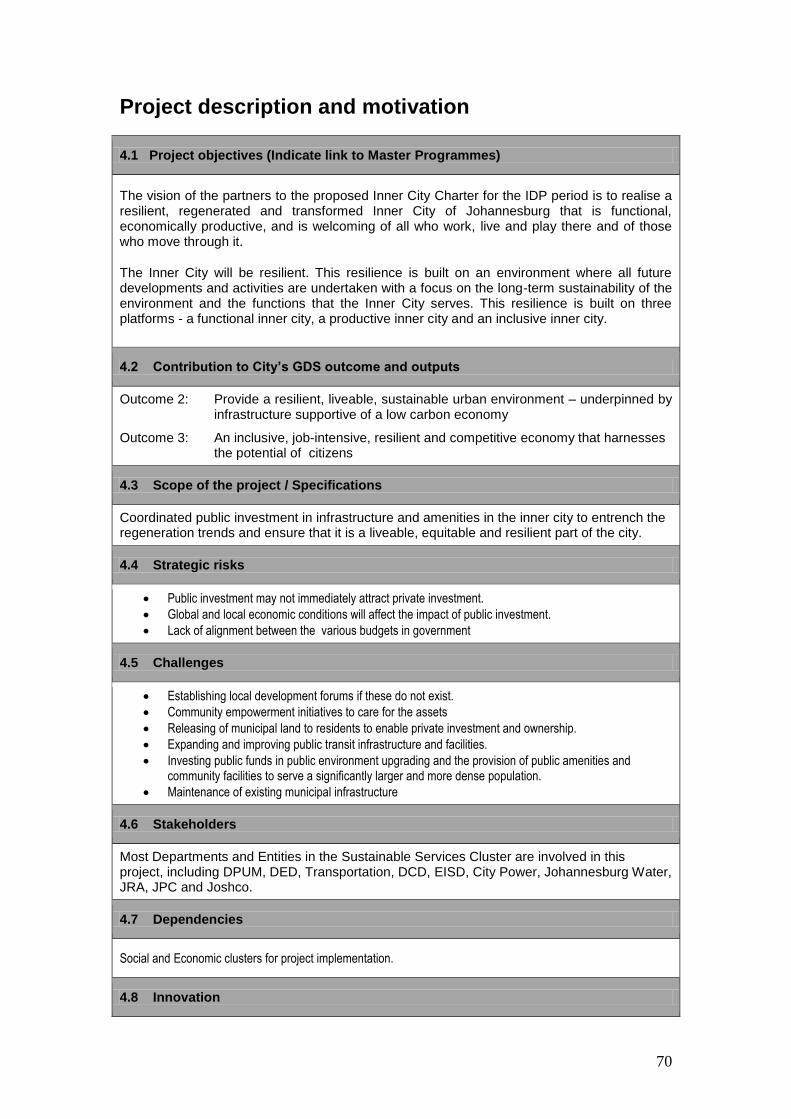
70
Project description and motivation
4.1 Project objectives (Indicate link to Master Programmes)
The vision of the partners to the proposed Inner City Charter for the IDP period is to realise a resilient, regenerated and transformed Inner City of Johannesburg that is functional, economically productive, and is welcoming of all who work, live and play there and of those who move through it.
The Inner City will be resilient. This resilience is built on an environment where all future developments and activities are undertaken with a focus on the long-term sustainability of the environment and the functions that the Inner City serves. This resilience is built on three platforms - a functional inner city, a productive inner city and an inclusive inner city.
4.2 Contribution to City’s GDS outcome and outputs
Outcome 2: Provide a resilient, liveable, sustainable urban environment – underpinned by infrastructure supportive of a low carbon economy
Outcome 3: An inclusive, job-intensive, resilient and competitive economy that harnesses the potential of citizens
4.3 Scope of the project / Specifications
Coordinated public investment in infrastructure and amenities in the inner city to entrench the regeneration trends and ensure that it is a liveable, equitable and resilient part of the city.
4.4 Strategic risks
Public investment may not immediately attract private investment.
Global and local economic conditions will affect the impact of public investment.
Lack of alignment between the various budgets in government
4.5 Challenges
Establishing local development forums if these do not exist.
Community empowerment initiatives to care for the assets
Releasing of municipal land to residents to enable private investment and ownership.
Expanding and improving public transit infrastructure and facilities.
Investing public funds in public environment upgrading and the provision of public amenities and community facilities to serve a significantly larger and more dense population.
Maintenance of existing municipal infrastructure
4.6 Stakeholders
Most Departments and Entities in the Sustainable Services Cluster are involved in this project, including DPUM, DED, Transportation, DCD, EISD, City Power, Johannesburg Water, JRA, JPC and Joshco.
4.7 Dependencies
Social and Economic clusters for project implementation.
4.8 Innovation
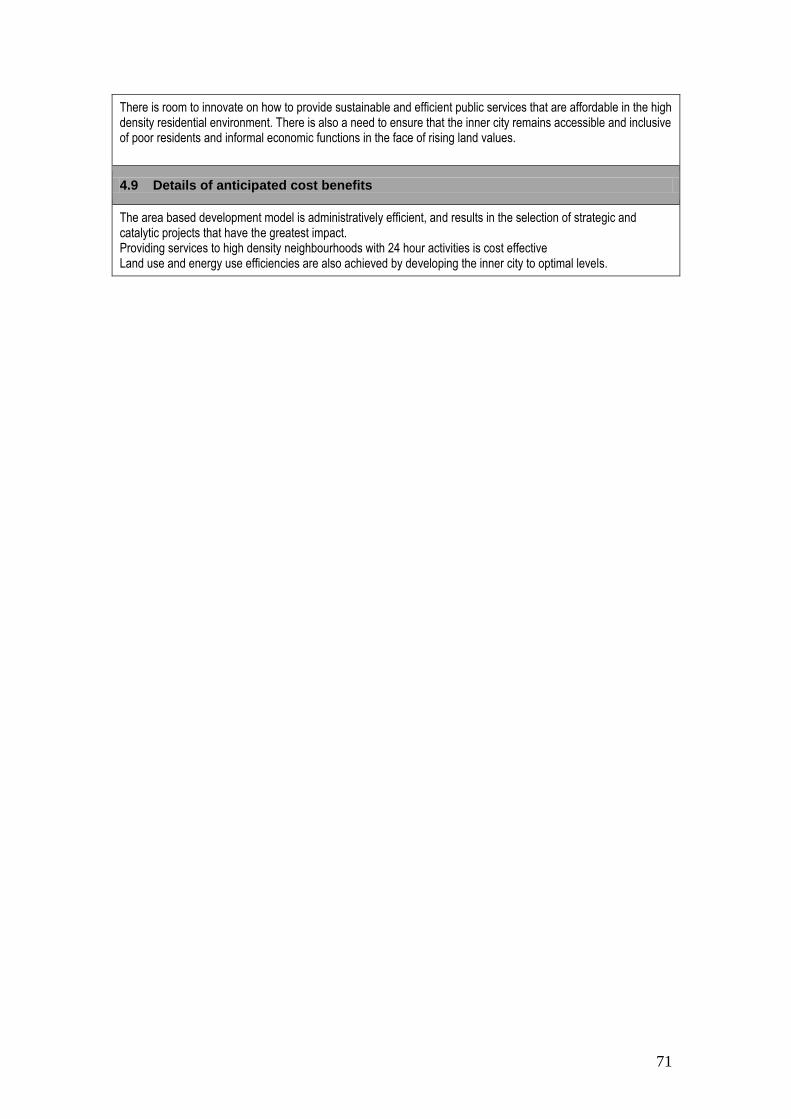
71
There is room to innovate on how to provide sustainable and efficient public services that are affordable in the high density residential environment. There is also a need to ensure that the inner city remains accessible and inclusive of poor residents and informal economic functions in the face of rising land values.
4.9 Details of anticipated cost benefits
The area based development model is administratively efficient, and results in the selection of strategic and catalytic projects that have the greatest impact. Providing services to high density neighbourhoods with 24 hour activities is cost effective Land use and energy use efficiencies are also achieved by developing the inner city to optimal levels.
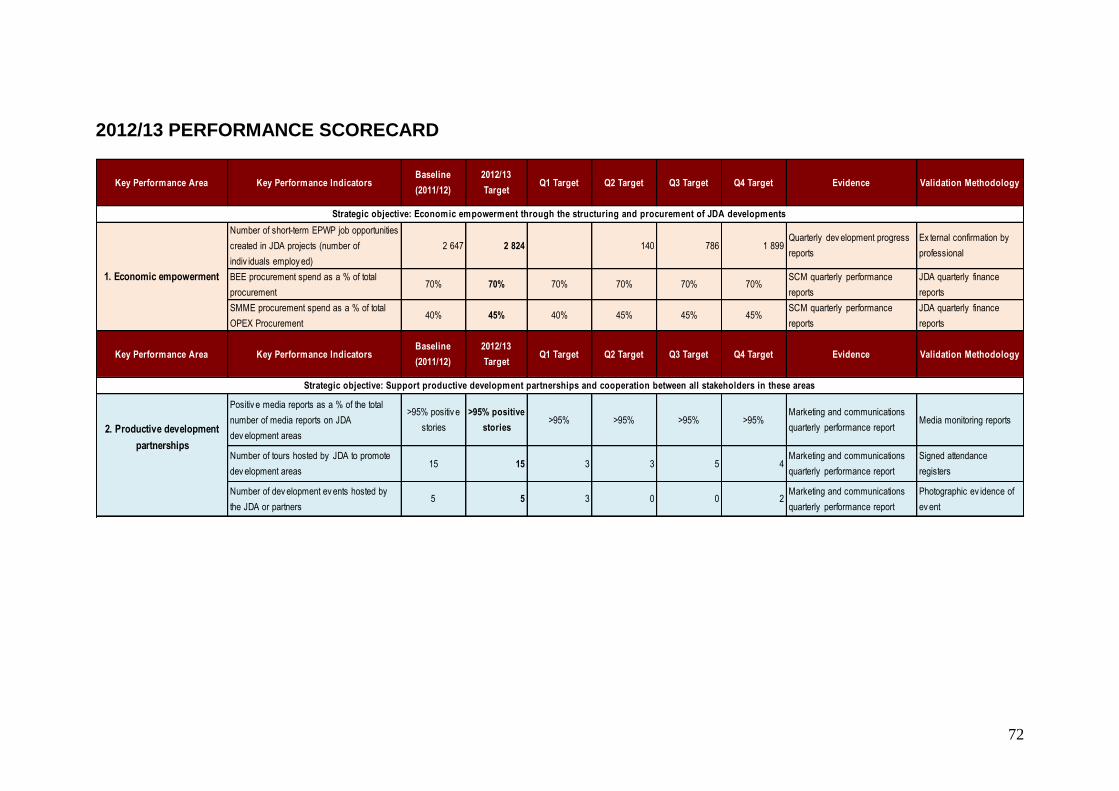
72
2012/13 PERFORMANCE SCORECARD
Key Performance Area Key Performance IndicatorsBaseline
(2011/12)
2012/13
TargetQ1 Target Q2 Target Q3 Target Q4 Target Evidence Validation Methodology
Number of short-term EPWP job opportunities
created in JDA projects (number of
indiv iduals employ ed)
2 647 2 824 140 786 1 899Quarterly dev elopment progress
reports
Ex ternal confirmation by
professional
BEE procurement spend as a % of total
procurement70% 70% 70% 70% 70% 70%
SCM quarterly performance
reports
JDA quarterly finance
reports
SMME procurement spend as a % of total
OPEX Procurement 40% 45% 40% 45% 45% 45%
SCM quarterly performance
reports
JDA quarterly finance
reports
Key Performance Area Key Performance IndicatorsBaseline
(2011/12)
2012/13
TargetQ1 Target Q2 Target Q3 Target Q4 Target Evidence Validation Methodology
Positiv e media reports as a % of the total
number of media reports on JDA
dev elopment areas
>95% positiv e
stories
>95% positive
stories>95% >95% >95% >95%
Marketing and communications
quarterly performance reportMedia monitoring reports
Number of tours hosted by JDA to promote
dev elopment areas15 15 3 3 5 4
Marketing and communications
quarterly performance report
Signed attendance
registers
Number of dev elopment ev ents hosted by
the JDA or partners5 5 3 0 0 2
Marketing and communications
quarterly performance report
Photographic ev idence of
ev ent
2. Productive development
partnerships
Strategic objective: Economic empowerment through the structuring and procurement of JDA developments
Strategic objective: Support productive development partnerships and cooperation between all stakeholders in these areas
1. Economic empowerment
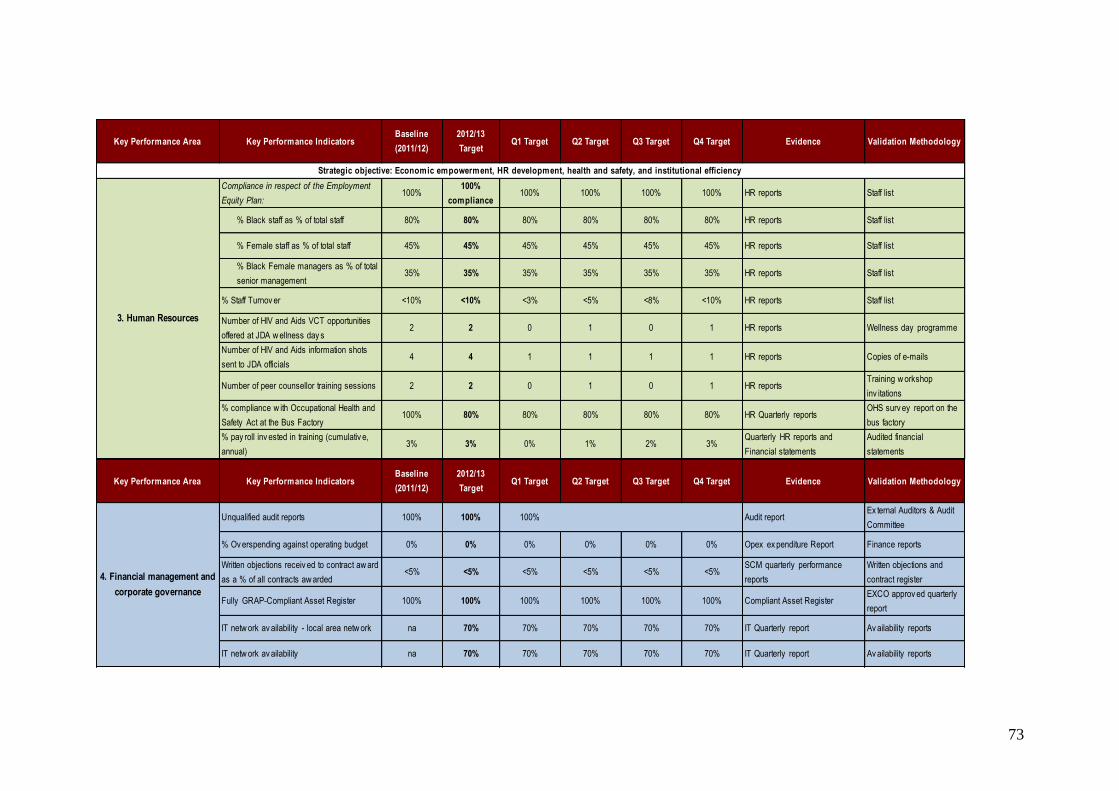
73
Key Performance Area Key Performance IndicatorsBaseline
(2011/12)
2012/13
TargetQ1 Target Q2 Target Q3 Target Q4 Target Evidence Validation Methodology
Compliance in respect of the Employment
Equity Plan:100%
100%
compliance100% 100% 100% 100% HR reports Staff list
% Black staff as % of total staff 80% 80% 80% 80% 80% 80% HR reports Staff list
% Female staff as % of total staff 45% 45% 45% 45% 45% 45% HR reports Staff list
% Black Female managers as % of total
senior management35% 35% 35% 35% 35% 35% HR reports Staff list
% Staff Turnov er <10% <10% <3% <5% <8% <10% HR reports Staff list
Number of HIV and Aids VCT opportunities
offered at JDA w ellness day s2 2 0 1 0 1 HR reports Wellness day programme
Number of HIV and Aids information shots
sent to JDA officials4 4 1 1 1 1 HR reports Copies of e-mails
Number of peer counsellor training sessions 2 2 0 1 0 1 HR reportsTraining w orkshop
inv itations
% compliance w ith Occupational Health and
Safety Act at the Bus Factory100% 80% 80% 80% 80% 80% HR Quarterly reports
OHS surv ey report on the
bus factory
% pay roll inv ested in training (cumulativ e,
annual)3% 3% 0% 1% 2% 3%
Quarterly HR reports and
Financial statements
Audited financial
statements
Strategic objective: Economic empowerment, HR development, health and safety, and institutional efficiency
3. Human Resources
Key Performance Area Key Performance IndicatorsBaseline
(2011/12)
2012/13
TargetQ1 Target Q2 Target Q3 Target Q4 Target Evidence Validation Methodology
Unqualified audit reports 100% 100% Audit reportEx ternal Auditors & Audit
Committee
% Ov erspending against operating budget 0% 0% 0% 0% 0% 0% Opex ex penditure Report Finance reports
Written objections receiv ed to contract aw ard
as a % of all contracts aw arded<5% <5% <5% <5% <5% <5%
SCM quarterly performance
reports
Written objections and
contract register
Fully GRAP-Compliant Asset Register 100% 100% 100% 100% 100% 100% Compliant Asset RegisterEXCO approv ed quarterly
report
IT netw ork av ailability - local area netw ork na 70% 70% 70% 70% 70% IT Quarterly report Av ailability reports
IT netw ork av ailability na 70% 70% 70% 70% 70% IT Quarterly report Av ailability reports
4. Financial management and
corporate governance
100%
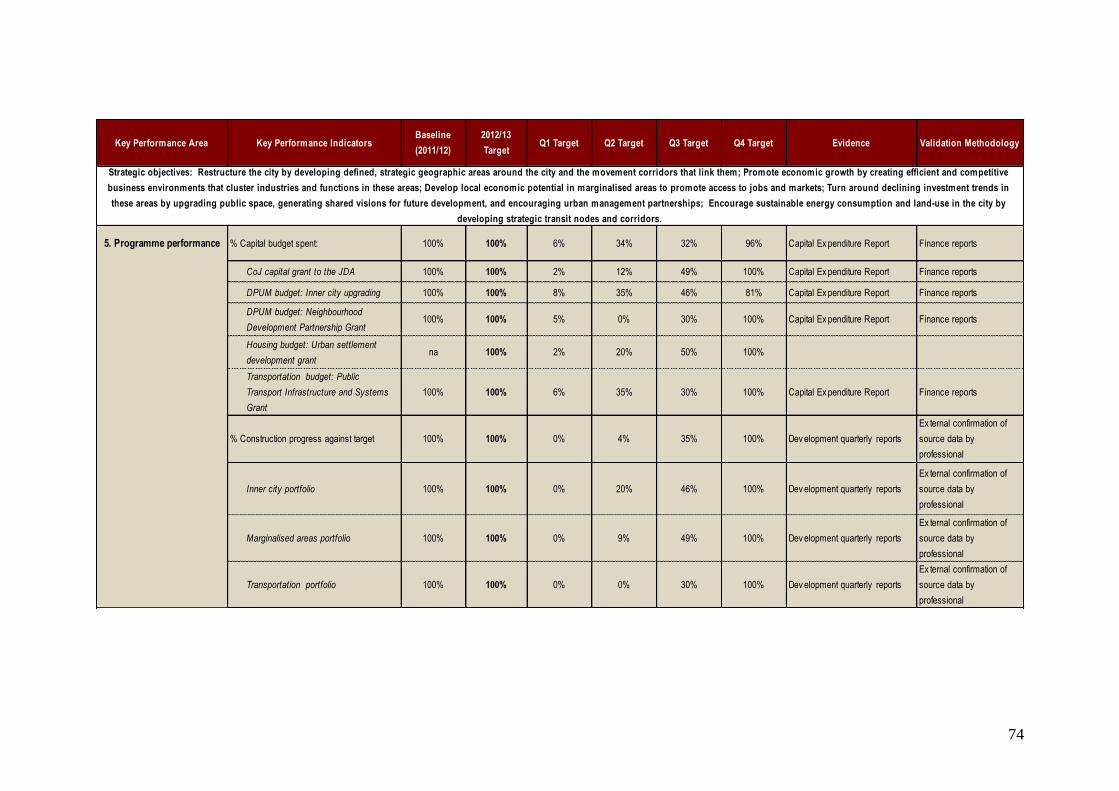
74
Key Performance Area Key Performance IndicatorsBaseline
(2011/12)
2012/13
TargetQ1 Target Q2 Target Q3 Target Q4 Target Evidence Validation Methodology
5. Programme performance % Capital budget spent: 100% 100% 6% 34% 32% 96% Capital Ex penditure Report Finance reports
CoJ capital grant to the JDA 100% 100% 2% 12% 49% 100% Capital Ex penditure Report Finance reports
DPUM budget: Inner city upgrading 100% 100% 8% 35% 46% 81% Capital Ex penditure Report Finance reports
DPUM budget: Neighbourhood
Development Partnership Grant100% 100% 5% 0% 30% 100% Capital Ex penditure Report Finance reports
Housing budget: Urban settlement
development grantna 100% 2% 20% 50% 100%
Transportation budget: Public
Transport Infrastructure and Systems
Grant
100% 100% 6% 35% 30% 100% Capital Ex penditure Report Finance reports
% Construction progress against target 100% 100% 0% 4% 35% 100% Dev elopment quarterly reports
Ex ternal confirmation of
source data by
professional
Inner city portfolio 100% 100% 0% 20% 46% 100% Dev elopment quarterly reports
Ex ternal confirmation of
source data by
professional
Marginalised areas portfolio 100% 100% 0% 9% 49% 100% Dev elopment quarterly reports
Ex ternal confirmation of
source data by
professional
Transportation portfolio 100% 100% 0% 0% 30% 100% Dev elopment quarterly reports
Ex ternal confirmation of
source data by
professional
Strategic objectives: Restructure the city by developing defined, strategic geographic areas around the city and the movement corridors that link them; Promote economic growth by creating efficient and competitive
business environments that cluster industries and functions in these areas; Develop local economic potential in marginalised areas to promote access to jobs and markets; Turn around declining investment trends in
these areas by upgrading public space, generating shared visions for future development, and encouraging urban management partnerships; Encourage sustainable energy consumption and land-use in the city by
developing strategic transit nodes and corridors.
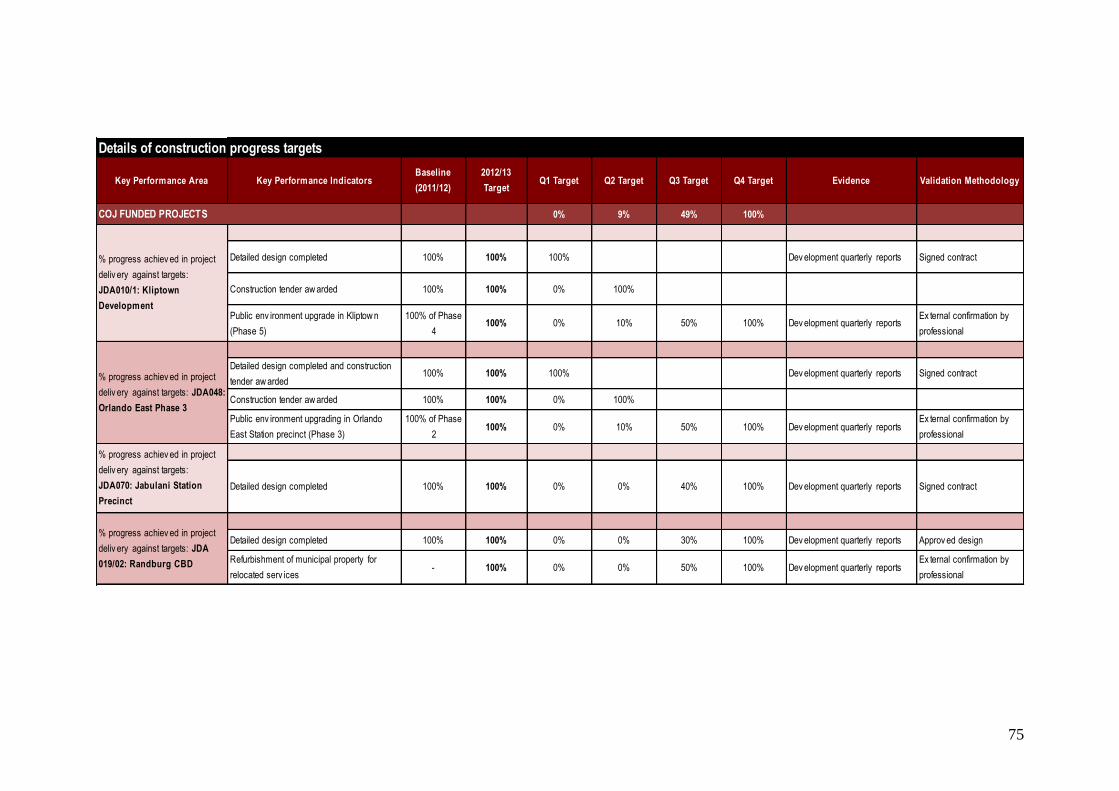
75
Details of construction progress targets
Key Performance Area Key Performance IndicatorsBaseline
(2011/12)
2012/13
TargetQ1 Target Q2 Target Q3 Target Q4 Target Evidence Validation Methodology
0% 9% 49% 100%
Detailed design completed 100% 100% 100% Dev elopment quarterly reports Signed contract
Construction tender aw arded 100% 100% 0% 100%
Public env ironment upgrade in Kliptow n
(Phase 5)
100% of Phase
4100% 0% 10% 50% 100% Dev elopment quarterly reports
Ex ternal confirmation by
professional
Detailed design completed and construction
tender aw arded100% 100% 100% Dev elopment quarterly reports Signed contract
Construction tender aw arded 100% 100% 0% 100%
Public env ironment upgrading in Orlando
East Station precinct (Phase 3)
100% of Phase
2100% 0% 10% 50% 100% Dev elopment quarterly reports
Ex ternal confirmation by
professional
Detailed design completed 100% 100% 0% 0% 40% 100% Dev elopment quarterly reports Signed contract
Detailed design completed 100% 100% 0% 0% 30% 100% Dev elopment quarterly reports Approv ed design
Refurbishment of municipal property for
relocated serv ices- 100% 0% 0% 50% 100% Dev elopment quarterly reports
Ex ternal confirmation by
professional
COJ FUNDED PROJECTS
% progress achiev ed in project
deliv ery against targets: JDA048:
Orlando East Phase 3
% progress achiev ed in project
deliv ery against targets:
JDA070: Jabulani Station
Precinct
% progress achiev ed in project
deliv ery against targets: JDA
019/02: Randburg CBD
% progress achiev ed in project
deliv ery against targets:
JDA010/1: Kliptown
Development
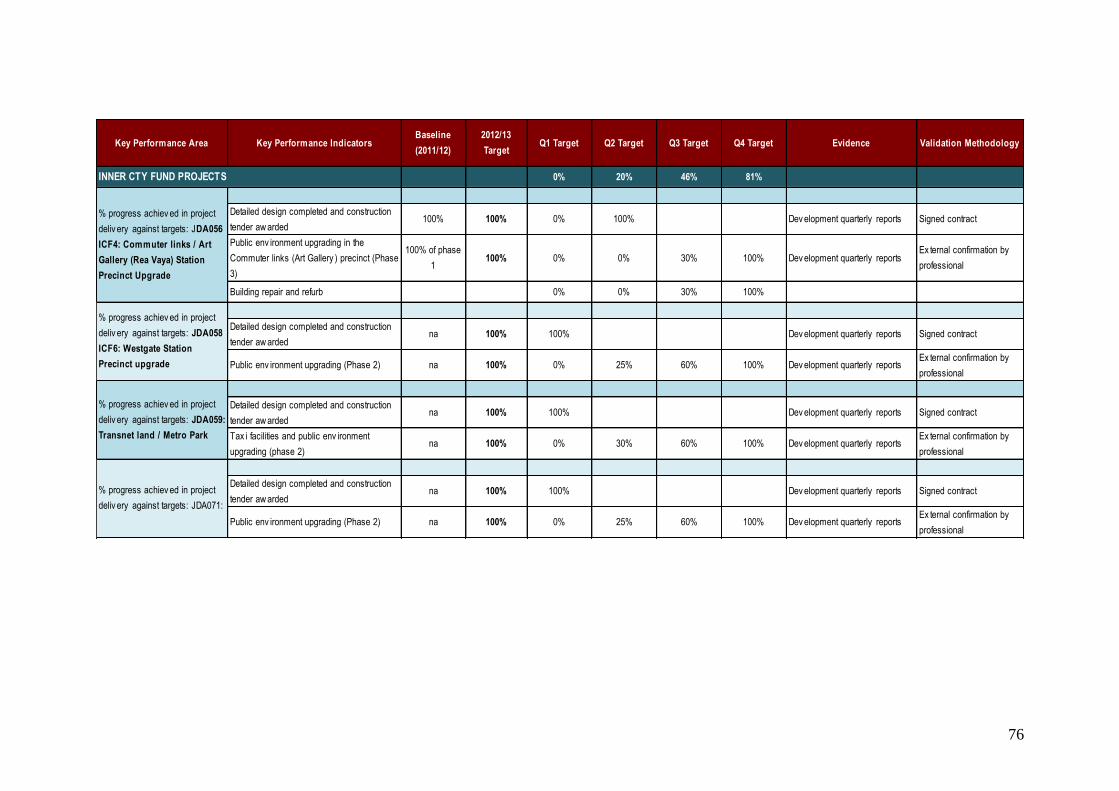
76
Key Performance Area Key Performance IndicatorsBaseline
(2011/12)
2012/13
TargetQ1 Target Q2 Target Q3 Target Q4 Target Evidence Validation Methodology
0% 20% 46% 81%
Detailed design completed and construction
tender aw arded100% 100% 0% 100% Dev elopment quarterly reports Signed contract
Public env ironment upgrading in the
Commuter links (Art Gallery ) precinct (Phase
3)
100% of phase
1100% 0% 0% 30% 100% Dev elopment quarterly reports
Ex ternal confirmation by
professional
Building repair and refurb 0% 0% 30% 100%
Detailed design completed and construction
tender aw ardedna 100% 100% Dev elopment quarterly reports Signed contract
Public env ironment upgrading (Phase 2) na 100% 0% 25% 60% 100% Dev elopment quarterly reportsEx ternal confirmation by
professional
Detailed design completed and construction
tender aw ardedna 100% 100% Dev elopment quarterly reports Signed contract
Tax i facilities and public env ironment
upgrading (phase 2)na 100% 0% 30% 60% 100% Dev elopment quarterly reports
Ex ternal confirmation by
professional
Detailed design completed and construction
tender aw ardedna 100% 100% Dev elopment quarterly reports Signed contract
Public env ironment upgrading (Phase 2) na 100% 0% 25% 60% 100% Dev elopment quarterly reportsEx ternal confirmation by
professional
INNER CTY FUND PROJECTS
% progress achiev ed in project
deliv ery against targets: JDA059:
Transnet land / Metro Park
% progress achiev ed in project
deliv ery against targets: JDA058
ICF6: Westgate Station
Precinct upgrade
% progress achiev ed in project
deliv ery against targets: JDA056
ICF4: Commuter links / Art
Gallery (Rea Vaya) Station
Precinct Upgrade
% progress achiev ed in project
deliv ery against targets: JDA071:
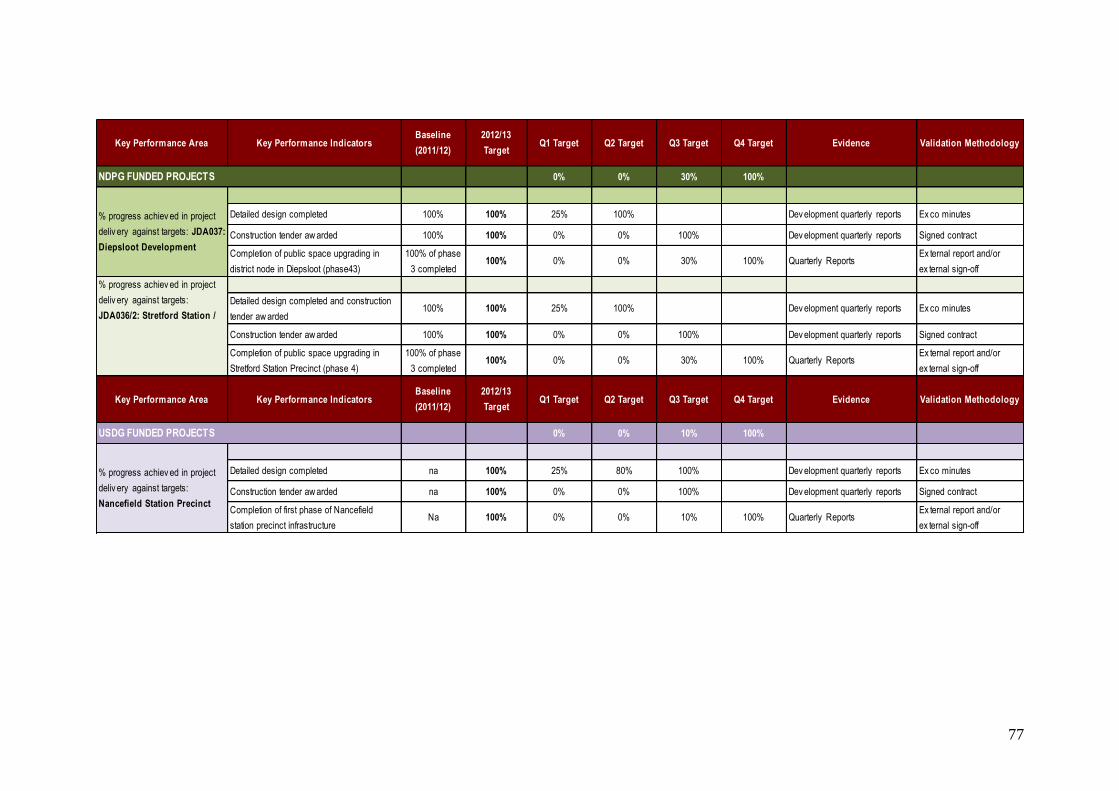
77
Key Performance Area Key Performance IndicatorsBaseline
(2011/12)
2012/13
TargetQ1 Target Q2 Target Q3 Target Q4 Target Evidence Validation Methodology
0% 0% 30% 100%
Detailed design completed 100% 100% 25% 100% Dev elopment quarterly reports Ex co minutes
Construction tender aw arded 100% 100% 0% 0% 100% Dev elopment quarterly reports Signed contract
Completion of public space upgrading in
district node in Diepsloot (phase43)
100% of phase
3 completed100% 0% 0% 30% 100% Quarterly Reports
Ex ternal report and/or
ex ternal sign-off
Detailed design completed and construction
tender aw arded100% 100% 25% 100% Dev elopment quarterly reports Ex co minutes
Construction tender aw arded 100% 100% 0% 0% 100% Dev elopment quarterly reports Signed contract
Completion of public space upgrading in
Stretford Station Precinct (phase 4)
100% of phase
3 completed100% 0% 0% 30% 100% Quarterly Reports
Ex ternal report and/or
ex ternal sign-off
Key Performance Area Key Performance IndicatorsBaseline
(2011/12)
2012/13
TargetQ1 Target Q2 Target Q3 Target Q4 Target Evidence Validation Methodology
0% 0% 10% 100%
Detailed design completed na 100% 25% 80% 100% Dev elopment quarterly reports Ex co minutes
Construction tender aw arded na 100% 0% 0% 100% Dev elopment quarterly reports Signed contract
Completion of first phase of Nancefield
station precinct infrastructure Na 100% 0% 0% 10% 100% Quarterly Reports
Ex ternal report and/or
ex ternal sign-off
USDG FUNDED PROJECTS
% progress achiev ed in project
deliv ery against targets:
Nancefield Station Precinct
% progress achiev ed in project
deliv ery against targets:
JDA036/2: Stretford Station /
NDPG FUNDED PROJECTS
% progress achiev ed in project
deliv ery against targets: JDA037:
Diepsloot Development
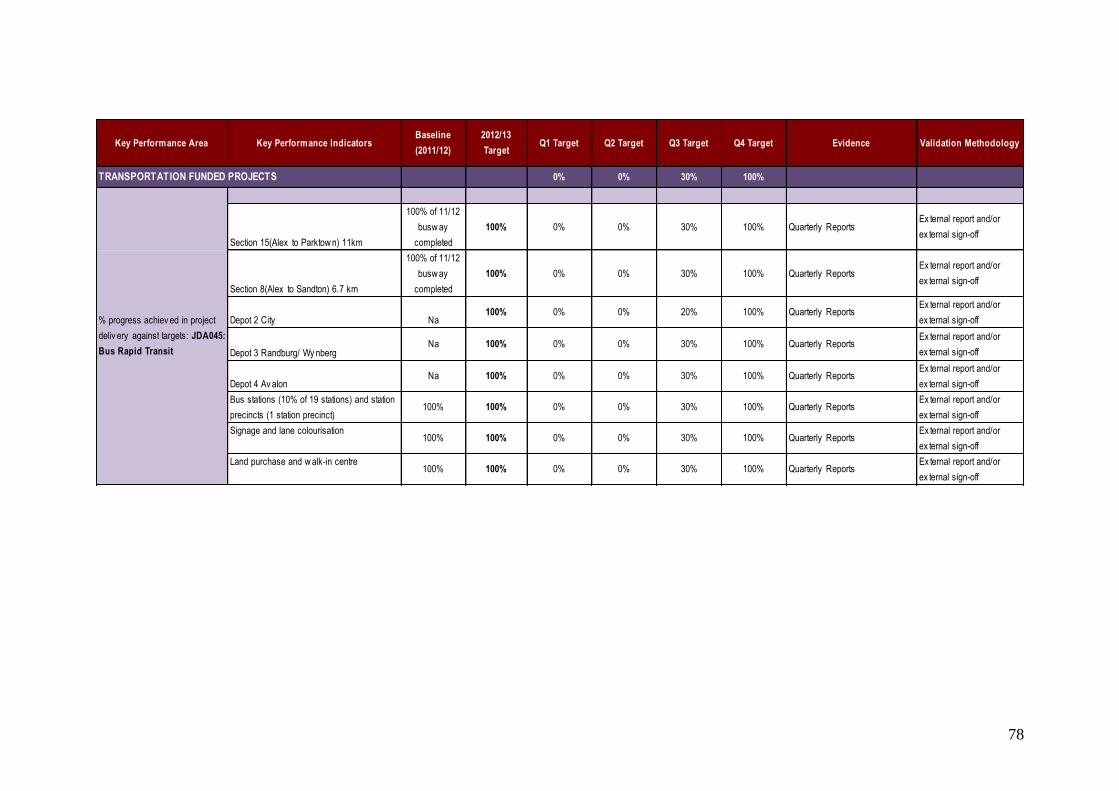
78
Key Performance Area Key Performance IndicatorsBaseline
(2011/12)
2012/13
TargetQ1 Target Q2 Target Q3 Target Q4 Target Evidence Validation Methodology
0% 0% 30% 100%
Section 15(Alex to Parktow n) 11km
100% of 11/12
busw ay
completed
100% 0% 0% 30% 100% Quarterly ReportsEx ternal report and/or
ex ternal sign-off
Section 8(Alex to Sandton) 6.7 km
100% of 11/12
busw ay
completed
100% 0% 0% 30% 100% Quarterly ReportsEx ternal report and/or
ex ternal sign-off
Depot 2 City Na100% 0% 0% 20% 100% Quarterly Reports
Ex ternal report and/or
ex ternal sign-off
Depot 3 Randburg/ Wy nbergNa 100% 0% 0% 30% 100% Quarterly Reports
Ex ternal report and/or
ex ternal sign-off
Depot 4 Av alonNa 100% 0% 0% 30% 100% Quarterly Reports
Ex ternal report and/or
ex ternal sign-off
Bus stations (10% of 19 stations) and station
precincts (1 station precinct)100% 100% 0% 0% 30% 100% Quarterly Reports
Ex ternal report and/or
ex ternal sign-off
Signage and lane colourisation100% 100% 0% 0% 30% 100% Quarterly Reports
Ex ternal report and/or
ex ternal sign-off
Land purchase and w alk-in centre100% 100% 0% 0% 30% 100% Quarterly Reports
Ex ternal report and/or
ex ternal sign-off
% progress achiev ed in project
deliv ery against targets: JDA045:
Bus Rapid Transit
TRANSPORTATION FUNDED PROJECTS