Embed Size (px)
Citation preview

Business Performance Benchmark Study 2017 – Page 1. © Altify 2017

Business Performance Benchmark Study 2017 – Page 2. © Altify 2017
The Business Performance Benchmark Study 2017 The Business Performance Benchmark Study is primary research conducted by Altify in
conjunction with IDD Consult. It was designed to illuminate the challenges that face
enterprise business-to-business (B2B) companies in 2017 – exploring strategic initiatives,
revenue considerations, top priorities for businesses, and metrics that can be used to
gauge progress. The data for this study was collected over a period of three months
between early November 2016 and late January 2017. The opinion, viewpoint and
conclusions in this report are based on Altify’s experience working with executives and
go-to-market leadership from a range of companies around the world; from small and
medium size operations to some of the world’s largest B2B enterprises.
To gain a broad perspective of opinion and to make this the definitive global guide to the
challenges and opportunities that we all face in 2017, we were joined by a number of
distribution partners in this endeavor: Buyers Meeting Point, Docusign, eQuiddity,
Gainsight, NewVoiceMedia, Sales Hacker, Salesforce and Xactly. We are extremely
grateful for their participation.
No part of this publication may be reproduced, stored in a retrieval system, or
transmitted in any form or by any means, electronic, mechanical, photocopying,
recording, scanning, or otherwise, except as permitted under section 107 or 108 of the
1976 United States Copyright Act, without the prior written permission of Altify, Inc.
Requests for permission should be addressed to Altify Inc., 803 Kirkland Avenue, Suite
100, Kirkland, WA 98033, USA, or by email to [email protected].

Business Performance Benchmark Study 2017 – Page 3. © Altify 2017
Contents Introduction 4
Executive Summary 6
Your Benchmark 11
Analysis and Insights: Strategic and Cultural 13
2017 is a year for Optimism: Business Performance Outlook 14
Strategic Imperatives for 2017 18
Disruptive Forces 23
Trust in Corporations and Government 28
People Trust Peers, Company Reputation, but not the CEO 33
Diversity Drives Business Results 38
Analysis and Insights: Revenue and Performance 44
Spotlight on Sales 45
Five Opportunities for Improvement in Sales 46
Spotlight on Marketing 50
Six Opportunities for Improvement in Marketing 52
Spotlight on Sales Management 55
Four Opportunities for Improvement in Sales Management 57
Spotlight on the Customer 60
Three Opportunities for Improvement in Customer-centricity 61
Priority Projects 64
Customer Related Priority Projects 68
Revenue Related Priority Projects 70
Whose Story Is This? 75

Business Performance Benchmark Study 2017 – Page 4. © Altify 2017
Introduction

Business Performance Benchmark Study 2017 – Page 5. © Altify 2017
Introduction The Business Performance Benchmark Study explores strategic directions, revenue
growth considerations, improvement priorities and metrics to gauge progress. It outlines
strategic imperatives for 2017, impending disruptive factors and the business impact of
societal factors such as trust and diversity. It assesses the opinions of business leaders,
management and individual contributors on sales and marketing effectiveness, and
examines relationships between the efficacy of best practices, the degree to which a
company’s customer guides its actions, and the consequent company performance.
The study analyzed over 60,000 data points; their interrelations and correlations, across
all regions of the globe in 12 different industry segments. It measured effectiveness and
output and is one of the world’s richest insight sources on how some organizations
consistently perform better than others. For business leaders who are tasked with
driving profitable, predictable revenue growth, or improving customer experiences, this
report is particularly relevant to those in Sales, Sales Operations, Marketing or Customer
Service, though all business leaders will gain insight.
How Do You Compare?
To assess your own performance, compare against this benchmark, and get
recommendations for improvement, please contact me or email [email protected].
I hope that you get value from the study and I am grateful to the participants who shared
their data. Without you this would not have been possible.
Thank you.

Business Performance Benchmark Study 2017 – Page 6. © Altify 2017
Executive Summary

Business Performance Benchmark Study 2017 – Page 7. © Altify 2017
Executive Summary The Business Performance Benchmark Study was conducted between November 2016
and January 2017. The submissions from the 833 participants, from 60 countries,
provided an in-depth perspective on the current state of business performance and
outlook around the world.
Top 15 Insights for 2017
1. Business Outlook Is Positive
Despite 2016 being a year that many people seem to want to
forget, the outlook for 2017 is positive. 87 percent expect a Minor or
Major Improvement in their business in 2017 compared to 2016. The
feeling we get from the study, also reflected in much of the media,
is one of #Goodbye2016.
2. #1 Strategic Initiative – Customer Retention
On a global basis, with some regional variations, Customer
Retention just beat Revenue Growth to the top spot as the #1
Strategic Imperative for 2017. 87.3 percent of participants selected
Customer Retention as a strategic focus for 2017, just ahead of the
86.6 percent who choose Revenue Growth as a key strategic area.
3. #1 Cause of Disruption – Digital Transformation
The winner – if that’s the right term for disruption – was very clearly Digital
Transformation. 48 percent of study participants believe that Digital

Business Performance Benchmark Study 2017 – Page 8. © Altify 2017
Transformation will cause significant disruption to business in 2017. Even
as we looked through every lens; regional, role, industry, company size, etc., the
perspective did not change. Digital Transformation has rocketed to the top of
everyone’s list of priorities, well ahead of Advancement in AI (27 pecent) and
Currency Volatility (26 percent) in second and third places.
4. Currency Volatility and Brexit Demand Attention in EMEA
Perhaps unsurprisingly, those in EMEA fear disruption in 2017 from Currency
Volatility (41 percent) and Brexit (39 percent) almost as much as they expect
disruption from Digital Transformation (43 percent).
5. Trust in Corporations & Government is Declining
Trust in both Corporations and Government has declined in the last 12 months,
with 15.4 percent of participants saying that they trust corporations less
than a year ago. The situation with Government is worse, 42 percent of
participants trust government less than last year, and only 8 percent say
they trust government more.
6. People Value Company Reputation and Trust Opinion of Peers
When asked “Who do you trust to provide advice when making a purchase
decision from a company?” 54 percent trust Company Reputation and 53
percent trust Peers in other companies, while only 29 percent trust the
Company CEO.
7. Diversity Drives Business Results
70 percent believe that a diversity policy has impact on the business
performance of their organization. Similarly, 61 percent of the respondents
believe their companies’ track record on diversity is either Good or Great, and

Business Performance Benchmark Study 2017 – Page 9. © Altify 2017
companies with a positive track record have 50 percent better customer
retention performance, and a 17 percent greater Win Rate, and 17 percent
shorter sales cycle.
8. Sales Metric #1 – Access to key buying influencers
39 percent of companies say their sellers are not good at accessing key
buying influencers. The impact is significant. Those who are effective at
accessing key players have a 28 percent better Win Rate.
9. Sales Metric #2 – Uncovering the customer’s business problem
When sellers are able to uncover the customer’s business problem, their
sales cycle decreases by 21 percent. But not all sellers have this skill nailed.
32 percent say they are not effective at uncovering the customer’s
business problem.
10. Marketing Metric #1 – Failing to deliver qualified opportunities
Just 40 percent of companies, including 61 percent of marketers, say that
Marketing delivers a reasonable number of opportunities, and 50 percent
of sellers think that Marketing does not understand their customers. The
submissions to this study paint a pretty grim picture on the effectiveness of
marketing.
11. Marketing Metric #2 – Marketers don't understand the customer
In addition, in a more specific and possibly more damning indictment of
Marketing, 43 percent of study participants do not believe Marketing
understand customers. If we look at the opinions of the Sales contingent, half
of Sales concur with that viewpoint.

Business Performance Benchmark Study 2017 – Page 10. © Altify 2017
12. Sales Management Metric #1 – Sales forecasting is still broken
Among the companies represented by participants in the study just one
third (33 percent) of companies close deals as originally forecasted. The
consequence of inaccurate forecasts can be devastating for a sales manager
and the company. In companies where sales forecasting is accurate, Win
Rate is up 18 percent and sales cycle is down 23 percent.
13. Customer Metric #1 – The customer is king but not all sellers are aligned
83 percent of study contributors say “Customers are more in control of the
buy/sell process than ever before.” 90 percent of marketers and 84 percent of
sales believe this to be true, but while most (77 percent) agree that the sales
person is an advocate for their customer, only 65 percent of sellers align their
sales process with the customer's buying process.
14. #1 Priority Project – New Customer Acquisition
The #1 priority project for 2017 among the participants in the study is New
Customer Acquisition. 81 percent of submissions identified this as a 2017
priority. This is slightly at odds with the #1 Strategic Imperative being Customer
Retention, though fully aligned with Revenue Growth – a close second Strategic
Imperative.
15. #1 Customer Related Priority Project – Revenue from existing customers
Nearly two-thirds of participants (65 percent) nominated Revenue from
existing customers as a 2017 priority project. It is by far the most frequently
selected customer related project, followed by Connect solutions to customer's
business problems (48 percent) and Understanding the customer's business (37
percent).
Business Performance Benchmark Study 2017 – Page 11. © Altify 2017
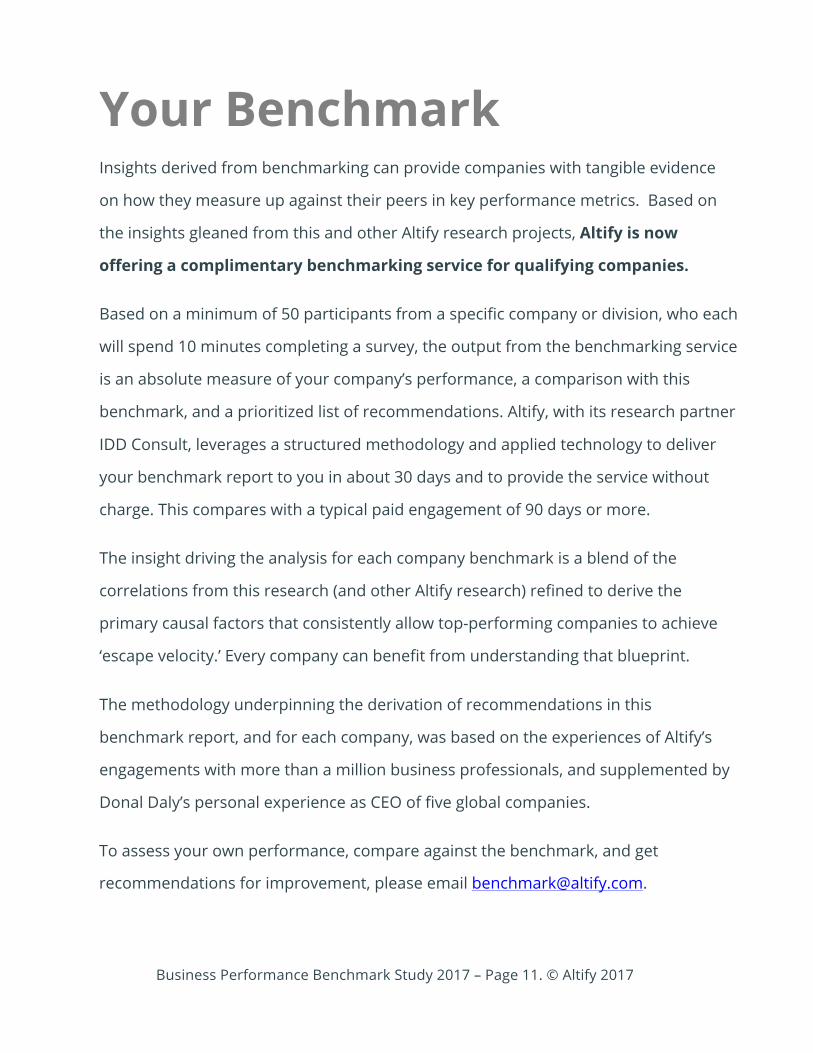
Your Benchmark Insights derived from benchmarking can provide companies with tangible evidence
on how they measure up against their peers in key performance metrics. Based on
the insights gleaned from this and other Altify research projects, Altify is now
offering a complimentary benchmarking service for qualifying companies.
Based on a minimum of 50 participants from a specific company or division, who each
will spend 10 minutes completing a survey, the output from the benchmarking service
is an absolute measure of your company’s performance, a comparison with this
benchmark, and a prioritized list of recommendations. Altify, with its research partner
IDD Consult, leverages a structured methodology and applied technology to deliver
your benchmark report to you in about 30 days and to provide the service without
charge. This compares with a typical paid engagement of 90 days or more.
The insight driving the analysis for each company benchmark is a blend of the
correlations from this research (and other Altify research) refined to derive the
primary causal factors that consistently allow top-performing companies to achieve
‘escape velocity.’ Every company can benefit from understanding that blueprint.
The methodology underpinning the derivation of recommendations in this
benchmark report, and for each company, was based on the experiences of Altify’s
engagements with more than a million business professionals, and supplemented by
Donal Daly’s personal experience as CEO of five global companies.
To assess your own performance, compare against the benchmark, and get
recommendations for improvement, please email [email protected].

Business Performance Benchmark Study 2017 – Page 12. © Altify 2017
About Altify
For B2B sales organizations, Altify provides proven enterprise sales methodology in
software sellers want to use. The Altify platform helps sales teams win the deals that
matter and increase wallet share in existing customers. With Altify, sales people,
managers and executives achieve revenue growth consistently. Customers include:
Autodesk, BMC, Brocade, BT, GE, Honeywell, HP Enterprise, Johnson Controls, Optum,
Salesforce, and Software AG.
About the Author
Donal Daly is Executive Chairman of Altify, having
founded the company in 2005. He is author of
numerous books and ebooks including the Amazon #1
Best-sellers Account Planning in Salesforce and
Tomorrow | Today: How AI Impacts How We Work, Live,
and Think. Donal combines his expertise in enterprise
software applications, artificial intelligence, and sales
methodology, as he continues to transform how
progressive organizations grow. Altify is Donal’s fifth
global business enterprise.
Connect on LinkedIn

Business Performance Benchmark Study 2017 – Page 13. © Altify 2017
Analysis & Insights
Strategic and Cultural

Business Performance Benchmark Study 2017 – Page 14. © Altify 2017
1. 2017 is a year for Optimism: Business Performance Outlook
The world belongs to optimists. Pessimists are only spectators.
François Guizot
The World Bank is forecasting the global economy will accelerate in 2017 after 2016
delivered the worst performance since 2008. "We are encouraged to see stronger economic
prospects on the horizon," said World Bank President Jim Yong Kim. The participants in the
study are also feeling optimistic.
87 percent expect a Minor or Major Improvement in their business in 2017 compared
to 2016. The feeling we get from the study, also reflected in much of the media, is one of
#Goodbye2016. Almost regardless of age, gender, region, industry and role the world has
an optimistic outlook facing into 2017. (The 0.88 percent who expect a Major Decline in
2017 is so negligible we grouped it with Minor Decline for other analysis.)

Business Performance Benchmark Study 2017 – Page 15. © Altify 2017
From a regional perspective, we can see that those from RoW are most optimistic; 45
percent expect a Major Improvement. When we dissect the Major Improvement category,
we found the smallest percentage of EMEA participants taking this view, being more
cautious than both the Americas and RoW. Linking this to the insights of the strategic
considerations we have learned the consequence of Brexit and the attendant Currency
Volatility have a major impact on the psyche of EMEA business people today.
While the instability in China gave rise to some concerns and challenges for 2017 for our
RoW participants it does not seem to materially temper their optimistic prognosis.
There is a distinct and direct correlation between Seniority and 2017 business outlook.
Perhaps Executives feel more in control of the future or may have greater visibility into
the growth plans of the company, but at 48 percent, nearly half are expecting a Major
Improvement in business in the next 12 months. This compares with just 24 percent for
Individual Contributors.

Business Performance Benchmark Study 2017 – Page 16. © Altify 2017
Perhaps from the higher floors you can see further and from the perspective of
Executives the horizon looks inviting. It is encouraging to see that positive change is most
expected by those who work on the business rather than in the business.
The onus is on these business leaders to share their perspective with the broader
company to have a commonly understood vision and to articulate a plan that the
Individual Contributors and Management can understand and execute. Top-down vision
needs to be met with bottom-up execution for the improvement to materialize.
Business Performance Benchmark Study 2017 – Page 17. © Altify 2017
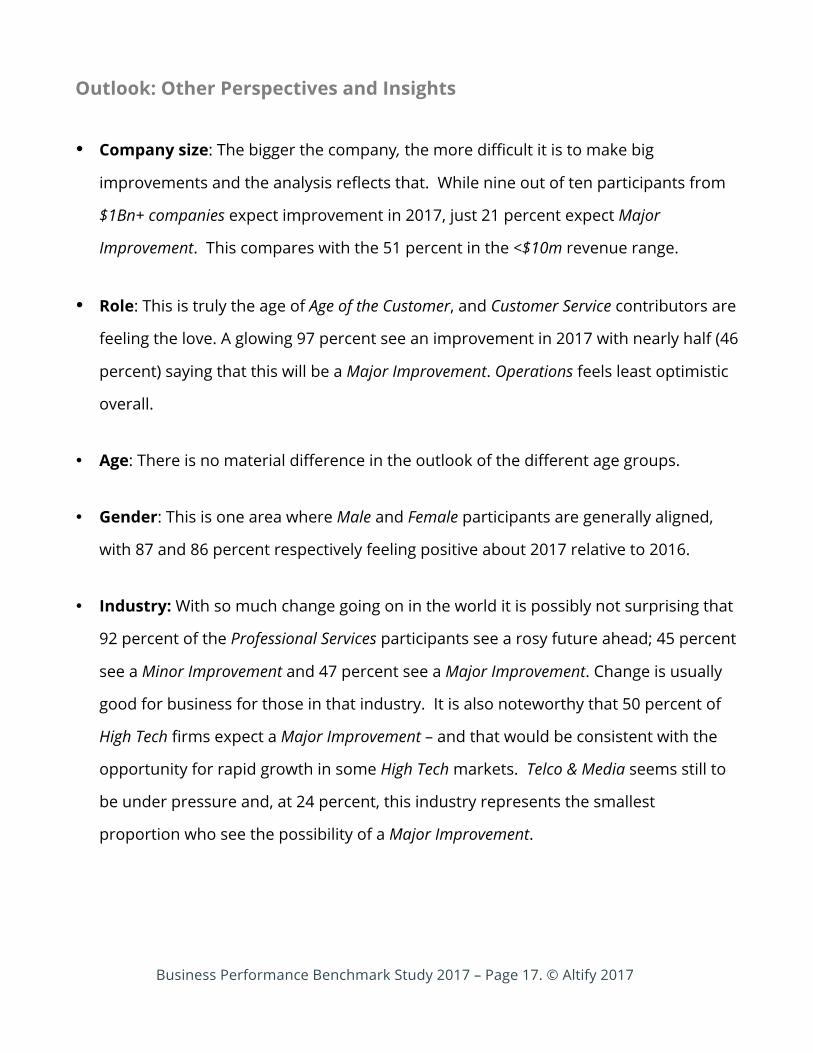
Outlook: Other Perspectives and Insights
• Company size: The bigger the company, the more difficult it is to make big
improvements and the analysis reflects that. While nine out of ten participants from
$1Bn+ companies expect improvement in 2017, just 21 percent expect Major
Improvement. This compares with the 51 percent in the <$10m revenue range.
• Role: This is truly the age of Age of the Customer, and Customer Service contributors are
feeling the love. A glowing 97 percent see an improvement in 2017 with nearly half (46
percent) saying that this will be a Major Improvement. Operations feels least optimistic
overall.
• Age: There is no material difference in the outlook of the different age groups.
• Gender: This is one area where Male and Female participants are generally aligned,
with 87 and 86 percent respectively feeling positive about 2017 relative to 2016.
• Industry: With so much change going on in the world it is possibly not surprising that
92 percent of the Professional Services participants see a rosy future ahead; 45 percent
see a Minor Improvement and 47 percent see a Major Improvement. Change is usually
good for business for those in that industry. It is also noteworthy that 50 percent of
High Tech firms expect a Major Improvement – and that would be consistent with the
opportunity for rapid growth in some High Tech markets. Telco & Media seems still to
be under pressure and, at 24 percent, this industry represents the smallest
proportion who see the possibility of a Major Improvement.

Business Performance Benchmark Study 2017 – Page 18. © Altify 2017
2. Strategic Imperatives for 2017
There has been much talk about the growing importance of putting the customer at the
center of all business activities. The analysis shows that company strategies around the
world now reflect a ‘customer-first’ approach. The growth of the subscription economy,
the recognition of customer–centricity as a key driver for business growth, and the
increased power of the customer, fueled by the Internet and the ubiquity of information,
has put into focus the need to retain existing customers.
Our analysis shows 83 percent believe that customers are more in control of the
buy/sell process than ever before, but only 69 percent state customer retention is
materially in line with plan. The increased focus on Customer Retention is possibly an
attempt to grow that 68 percent.
Yes 83%
No 17%
Customers are more in control of buy/sell process
Yes 69%
No 31%
Customer retention rate in line with plan

Business Performance Benchmark Study 2017 – Page 19. © Altify 2017
On a global basis, with some regional variations, Customer Retention beat Revenue
Growth to the top spot as the #1 Strategic Imperative for 2017.
• 87.3 percent of participants selected Customer Retention as a strategic focus
for 2017, just ahead of the
• 86.6 percent who choose Revenue Growth as a key strategic area.
This increased focus on Customer Retention is all good news for the customer. The selling
organization needs to maintain a customer-centric focus throughout the lifetime of their
relationship with the customer and continue to deliver value after the sale.
Customer centricity starts with the first promise you make and ends with the first
promise you break. When you are doing business in the different regions of the world,
it is important to know what is uppermost in the minds of your business counterparts.
The general focus on Customer Retention is almost universal, but there are some regional
variations.

Business Performance Benchmark Study 2017 – Page 20. © Altify 2017
In the Americas, Customer Retention and Revenue Growth come in at the same level with 91
percent of submissions from those regions selecting these two initiatives as Very
Important or Critical in 2017. The absolute numbers are not as high in EMEA, but it is the
relative measures that count, and in EMEA, Customer Retention, at 83 percent, is a few
points ahead of Revenue Growth. In RoW, we see a variation in the priorities. Not only is
Revenue Growth (94 percent) ahead of Customer Retention (86 percent), the number of
participants (53 percent) in RoW who identified Cost Reduction as Very Important or Critical
in 2017 is much higher than the Americas or EMEA.
The variance is reflective of the maturity of those markets, where almost two-thirds of
the participants categorized as RoW come from emerging economies.
It is generally a truism that Executives care about the future, Management cares about the
present and Individual Contributors care about the past. Like all generalizations, there are
exceptions to this rule, but the analysis from this study supports this thesis.

Business Performance Benchmark Study 2017 – Page 21. © Altify 2017
Executive Management Individual
Cost Reduction 34% 42% 37%
Increased Market Share 59% 68% 69%
Operational Efficiency 61% 69% 67%
Profit Growth 69% 74% 79%
Revenue Growth 87% 85% 89%
Customer Retention 87% 87% 89%
Relatively speaking; Executives care least about Cost Reduction (34 percent) and
Operational Efficiency (61 percent). The Executives’ focus is definitely forward-looking and
growth oriented. They give instructions to Management who, you will observe, have a
relatively increased emphasis on these three areas. Individual Contributors, typically
younger and less experienced than their Executive or Management colleagues, are less
discerning in selecting what they deem to be important. A high proportion of the
Individual Contributors in the study want to focus on nearly all of the strategic elements
at the same time.
Further analysis demonstrates parallels between small companies, less established
economies (RoW) and Millennials. Larger companies, more established economies, and
older participants have less extreme views and are less singularly focused.
Strategic Focus | Other Insights
• Size: Bigger companies have to worry about everything and, in most cases, view all of
the Strategic Imperatives as Very Important or Critical – though there is a clear priority,
where 94 percent of companies with revenue over $1Bn have selected Customer
Retention. But for these big companies, they can’t ignore any of the Strategic

Business Performance Benchmark Study 2017 – Page 22. © Altify 2017
Imperatives. Cost Reduction, the lowest ranking item across all company sizes, is still
viewed as Very Important or Critical by more than half (53 percent) of the largest
companies.
• Age: Millennials are focused on Revenue Growth while Baby Boomers and Gen X care
more about Customer Retention.
• Role: Sales and Marketing care about Revenue Growth while Customer Service focus on
Customer Retention.
• Industry: Financial Services are most focused on Revenue Growth and Customer
Retention, while Professional Services are least concerned with Cost Reduction.
• Gender: There is no material difference in the perspectives of Males and Females.

Business Performance Benchmark Study 2017 – Page 23. © Altify 2017
3. Disruptive Forces The winner – if that’s the right term for a disruption – was very clearly Digital
Transformation. 48 percent of study participants believe that Digital Transformation
will cause significant disruption to business in 2017. Even as we looked through every
lens; regional, role, industry, company size etc., the perspective did not change. Digital
Transformation has rocketed to the top of everyone’s list of priorities.
Constellation Research defines Digital Transformation as more than a technology shift:
The digital disruption comes from both transforming business models and
shifting how brands, enterprises, people, and machines will engage.
Our research has uncovered that today Digital Transformation is ‘top of mind’ for nearly
half the companies we surveyed, irrespective of size, or industry.

Business Performance Benchmark Study 2017 – Page 24. © Altify 2017
More populist reports call it the ‘Uber-ization of everything’, a fear of disruption by non-
traditional competitors, and a well-founded belief that Digital Transformation is more
than the application of technology for efficiencies.
Causes of Disruption of Business (% of participants)
Digital Transformation 48%
Currency Volatility 27%
Advancement in AI 26%
Instability in EU - Brexit 20%
Political Change in the US 19%
Instability in China 12%
Global Terrorism 8%
Advancements in AI is identified by many as an area to watch. In my book, Tomorrow
Today: How AI Impacts How We Work, Live, and Think, I highlight the threat and opportunity
that AI brings:
The risk is that we don’t stop and fully consider how to apply these technological
advancements to our betterment. Most successful advances result from a conscious
purposeful search for innovation opportunities. They are rarely accidental and they
demand an uncommon level of domain-specific knowledge to be successful. Today’s
technology enables innovations in processes, products and marketplaces at a pace we
have never seen before. In addition to the technological advances, successful innovation
requires ingenuity, focus and, above all else, insight into the problem being solved. That
demands deep domain knowledge—particularly when applied to knowledge workers.
These principles apply equally to both Digital Transformation and Advancements in AI.
Business Performance Benchmark Study 2017 – Page 25. © Altify 2017
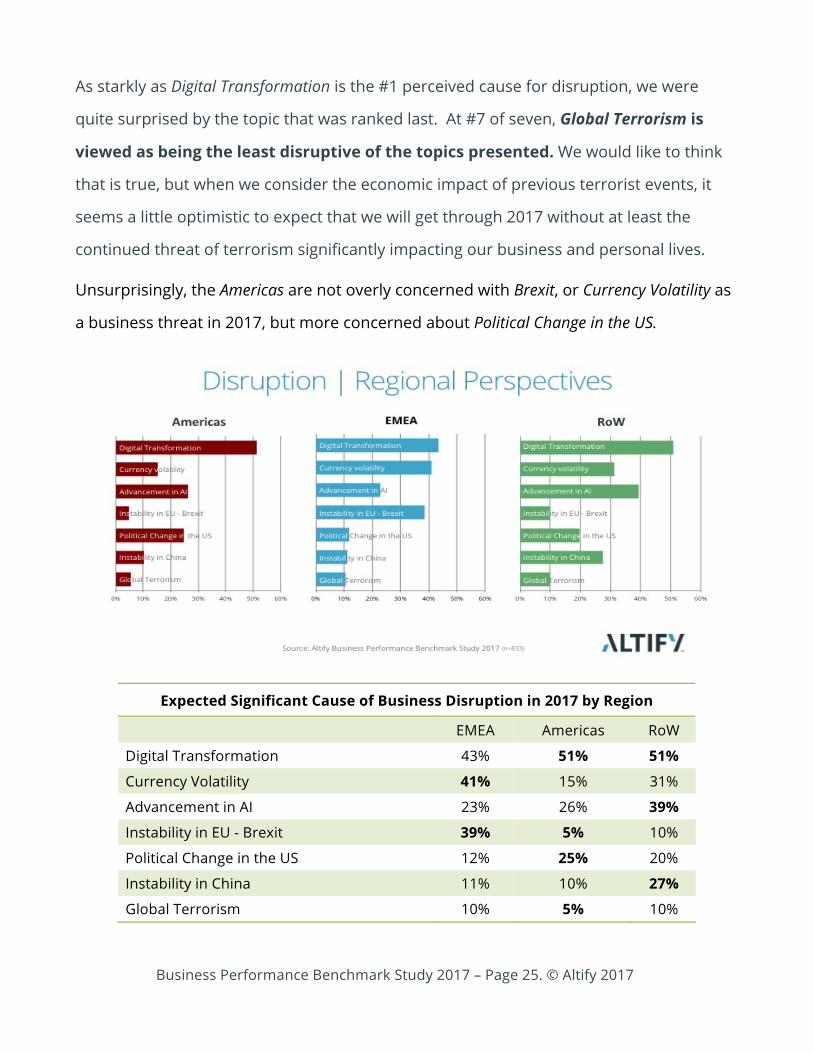
As starkly as Digital Transformation is the #1 perceived cause for disruption, we were
quite surprised by the topic that was ranked last. At #7 of seven, Global Terrorism is
viewed as being the least disruptive of the topics presented. We would like to think
that is true, but when we consider the economic impact of previous terrorist events, it
seems a little optimistic to expect that we will get through 2017 without at least the
continued threat of terrorism significantly impacting our business and personal lives.
Unsurprisingly, the Americas are not overly concerned with Brexit, or Currency Volatility as
a business threat in 2017, but more concerned about Political Change in the US.
Expected Significant Cause of Business Disruption in 2017 by Region
EMEA Americas RoW
Digital Transformation 43% 51% 51%
Currency Volatility 41% 15% 31%
Advancement in AI 23% 26% 39%
Instability in EU - Brexit 39% 5% 10%
Political Change in the US 12% 25% 20%
Instability in China 11% 10% 27%
Global Terrorism 10% 5% 10%

Business Performance Benchmark Study 2017 – Page 26. © Altify 2017
Those in EMEA are understandably focused on Currency Volatility and Instability in the EU –
Brexit as issues they should be concerned about. We would suggest that the Americas
should pay greater attention to these topics as much of the American economy is
dependent on international trade.
According to the US Chamber of Commerce:
America cannot have a growing economy or lift the wages and incomes of our
citizens unless we continue to reach beyond our borders and sell products,
produce, and services to the 95% of the world’s population that lives outside the
United States. Manufacturing is the sector that exports the most, with more than
$1.4 trillion worth of exports in 2014. U.S. exports of services are also booming,
topping $716 billion in 2015 and achieving a trade surplus in services of $227
billion.
Disruption | Other Insights
• Company Size: Digital Transformation is a big deal for big companies. A full two-
thirds of companies with revenues over $1 billion are concerned about its impact
in 2017. This compares with less than half of all other study participants citing it as
a threat. The causal factor for this discrepancy is the longer-term horizon that
large companies adopt, as evidenced by their focus on Customer Retention as their
#1 Strategic Imperative. As a group, these large companies are also most
concerned about Currency Volatility and Advancements in AI, the former reflecting
the global nature of their business, and the latter being seen as a fellow traveler of
Digital Transformation.
• Industry: The analysis by Industry shows some very distinct perspectives that
align with the different industry profiles. 69 percent of Telco and Media
companies are focused on Digital Transformation as a key disruptive

Business Performance Benchmark Study 2017 – Page 27. © Altify 2017
influence in 2017, and 36 percent also selected Advancement in AI. As you
would expect High Tech and Financial Services are also very high on Digital and AI.
With the changing of the guard in the White House and the polarized Republican /
Democrat perspectives on the Affordable Care Act, it is not surprising that the
Healthcare industry (31 percent) cares more about Political Change in the US than
any other group. Manufacturing bucks the Digital Transformation trend with only
one in four from that sector expressing particular interest in Digital but Currency
Volatility and Instability in China come to the fore for both Manufacturing and Retail
and Consumer. That’s to be expected given the likelihood of the manufactured or
sourced goods coming from non-national sources.
• Role: Of all the roles, IT cares most about Digital Transformation.
• Seniority: Other than a greater focus on Political Change in the US by Individual
Contributors and Management worrying about Currency Volatility, there is no
material difference in the perspectives of Executives, Management and Individual
Contributors.
• Age: Millennials are focused on Digital Transformation while Baby Boomers care
most about Political Change in the US.
• Gender: There is no material difference in the perspectives of Males and Females.

Business Performance Benchmark Study 2017 – Page 28. © Altify 2017
4. Trust in Corporations and Government
Trust is the fulcrum upon which every relationship pivots. It is a valuable currency that
must be earned, but never spent. Trust is built one step at a time, and unless protected,
can be blown away in a moment. Complete trust between people is infrequent, and
between companies or governments and individuals even more rare. Trust is not
attainable by request or appeal and it is not transferrable. It sits on the three pillars of
authenticity, integrity and honesty; promising only what you can give, and giving what
you promise. Attitude and preference are as likely to be informed by whether a customer
feels they can trust you as by the capabilities your company can provide.
The 2017 Edelman Trust Barometer reveals that trust is in crisis around the world:
The general population’s trust in all four key institutions — business, government,
NGOs, and media — has declined broadly, a phenomenon not reported since
Edelman began tracking trust among this segment in 2012.
Reference 1: 2017 Edelman Trust Barometer

Business Performance Benchmark Study 2017 – Page 29. © Altify 2017
In many cases, companies and governments have defaulted on their obligations to
customers and citizens, who feel ignored, poorly treated, and perceive that their
concerns are rarely heard. In Account Planning in Salesforce, I examined the factors at the
crux of sustained customer relationships and referred to this deficit in trust as the Trust
Default. 1
Our analysis supports the Edelman findings. Trust of Corporations and Governments by
consumers and citizens is in a pretty dire state and declining over time. The findings from
the study illustrate this plainly. For corporations, trust has declined over the last year.
For our participants, in 15.4 percent of cases, they trust corporations less than a
year ago, nearly three times as much as those (5.7 percent) who say they trust
corporations more than before. The interesting thing about this finding is that the
majority of participants in the study are themselves in corporations, though they don't
necessarily always adopt that perspective.
1 To discover how to build trust with your customer through Account planning; Read: Account Planning in Salesforce
2 To discover how to create an effective call plan;

Business Performance Benchmark Study 2017 – Page 30. © Altify 2017
The situation with governments is worse. In the study, 42 percent of participants trust
government less than last year, and only 8 percent say they trust government
more. When regional perspectives are factored in the analysis became even more stark.
When we analyze trust in government from a regional perspective, the story that is
unfolding from the Americas and EMEA is not at all what we would want to see. There has
definitely been an increased polarization of perspectives. One might have expected that
those who supported the winners of the recent Brexit and US Election battles might feel
more secure in their government but with only 6 percent and 7 percent in EMEA and
Americas respectively saying they trust government more that appears not to be the case.
This substantiates the position of some commentators who classify those victories
somewhat as the result of a protest vote.
Change in Trust in Government More Less
Americas 7% 44%
EMEA 6% 42%
RoW 22% 25%

Business Performance Benchmark Study 2017 – Page 31. © Altify 2017
Trust in Corporations and Government | Other Insights
• Seniority: A higher percentage of Individual Contributors (20 percent) are losing trust
in corporations faster than Management (15 percent) and Executives (14 percent). With
respect to government, the same trend applies; 39 percent of Executives, 41 percent of
Management and 52 percent of Individual Contributors trust their government less now
than a year ago.
• Company Size: At 19 percent of participants, companies with revenue <$10m say they
trust corporations less. In response to the question about change in trust in
government, 11 percent with revenue greater than $1Bn say they trust government
more, while the leading distrusters are those in companies with a revenue range of
$100m-$1Bn. 46 percent of this cohort say they trust government less.
• Age: Consistent with the other extreme views of Millennials, at 18 percent, they lead
the pack saying they trust corporations less. Gen X is at 13 percent and Boomers are at
17 percent. A similar pattern emerges for those who are losing trust in government.
Millennials are at 52 percent, Gen X at 27 percent and Boomers are at 43 percent.
• Role: It is noteworthy that none of the Customer Service participants in the study trust
corporations more than last year, and 14 percent trust them less. IT and Marketing are
most disenfranchised, each at 18 percent have a decreased level of trust in business.
On the other hand, Customer Service is again the outlier when looking at trust in
government. At 38 percent saying they trust government less, this group is the
smallest distrusting percentage of all participants, while G&A has the highest rank in
this area at 49 percent.
• Industry: With respect to trust in corporations, Healthcare is an outlier – with a net
increase in trust, 11 percent trust more and 6 percent trust less than a year ago. High

Business Performance Benchmark Study 2017 – Page 32. © Altify 2017
Tech has become most disenfranchised with 18 percent of that contingent saying their
level of trust in corporations has declined. Healthcare is again consistent, taking the
lowest percentage (31 percent) of those who say they trust government less. The
highest (47 percent) is Financial Services. Is it a bit ironic that nearly half of Financial
Services participants say they trust government less?
• Gender: There is no material difference in the perspectives of Males (16 percent trust
less) and Females (15 percent trust less) with respect to how much their trust in
corporations has changed. Nearly half of the female participants in the study (49
percent) say they trust government less than this time last year, compared to 41
percent of their male counterparts.
5. People Trust Peers, Company Reputation, but not the CEO
We have seen from the previous section that trust in institutions is declining. As we make
decisions we generally seek input from other sources to help us. In this section we were
interested in whose advice we trust when making a purchase decision.
Other than Your own independent research, at 69 percent, Company’s reputation (53
percent) tops the leader board as a trusted source, above Peers in other companies (52
percent) or Experts in the company (51 percent).

Business Performance Benchmark Study 2017 – Page 33. © Altify 2017
We tend to help ourselves by consciously or subconsciously building our own decision
matrix, a series of questions that you require answers to in order to place the possible
alternatives into a comparative order. It is probable, or at least possible, that the reason
why Your own independent research is most frequently cited as a trusted source is
because it is an aggregation of many of the other sources.
The buying process is a funny thing. People often use information and data after the fact,
to rationalize the very personal emotional decisions made during the buying process.
While this is certainly truer in personal consumer purchases than in the corporate buying
process, it is important to understand the different legs of the journey that customers
will travel as they head towards their buying decision – and while we don't as yet have
any direct proof to substantiate this – we would suggest that people look to different
sources at the different stages of their buying engagement.
All through a buying cycle, buyers are concerned about risk and price. They seek
evidence and assurance the supplier is trustworthy and can meet their needs. However,
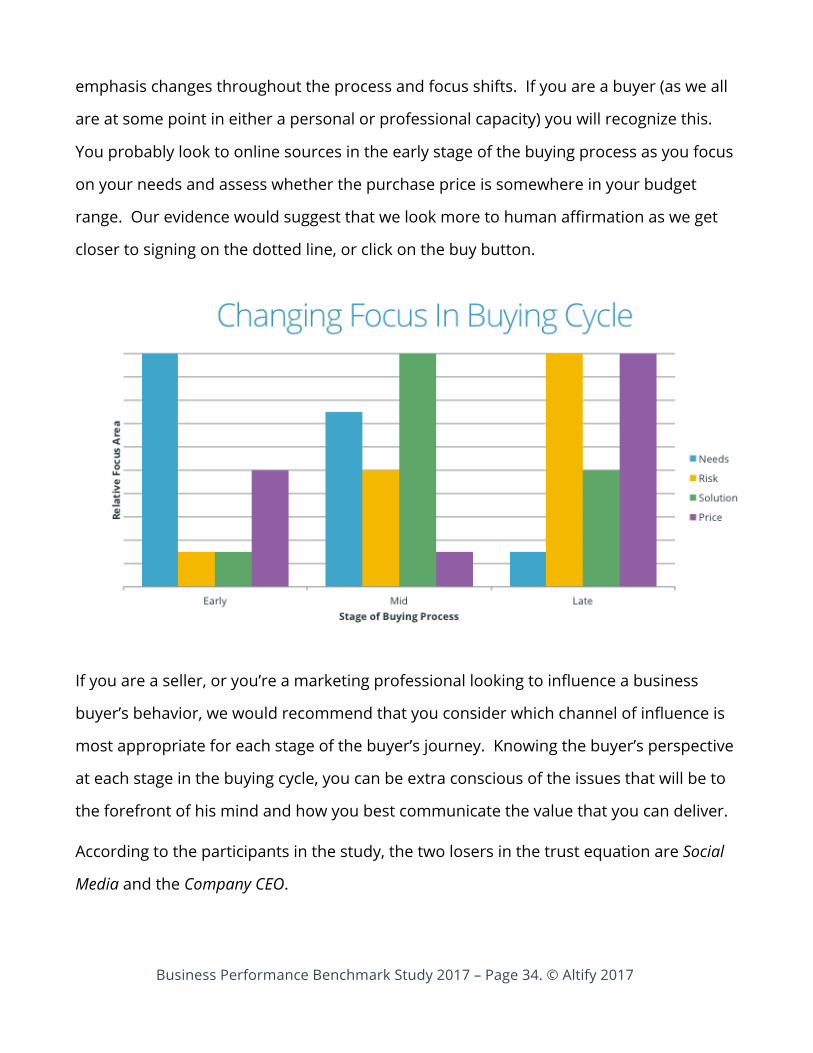
Business Performance Benchmark Study 2017 – Page 34. © Altify 2017
emphasis changes throughout the process and focus shifts. If you are a buyer (as we all
are at some point in either a personal or professional capacity) you will recognize this.
You probably look to online sources in the early stage of the buying process as you focus
on your needs and assess whether the purchase price is somewhere in your budget
range. Our evidence would suggest that we look more to human affirmation as we get
closer to signing on the dotted line, or click on the buy button.
If you are a seller, or you’re a marketing professional looking to influence a business
buyer’s behavior, we would recommend that you consider which channel of influence is
most appropriate for each stage of the buyer’s journey. Knowing the buyer’s perspective
at each stage in the buying cycle, you can be extra conscious of the issues that will be to
the forefront of his mind and how you best communicate the value that you can deliver.
According to the participants in the study, the two losers in the trust equation are Social
Media and the Company CEO.

Business Performance Benchmark Study 2017 – Page 35. © Altify 2017
• Just 15 percent of study participants use Social Media as a trusted source to
influence a buying decision.
• Less than a third (30 percent) consider the Company CEO as an authority
they should place their trust in when making a purchase from the CEO’s
company.
It is hard to know how to advise CEOs. Leadership is judged on results, but also on the
integrity of actions. In most cases, the CEO of the organization has a large amount of
influence in the lives of their employees, and in turn on the customers of that company.
We follow a great leader not for him but for ourselves. There are leaders and
there are those who lead. Leaders hold a position of power, authority, those who
lead, inspire us - Simon Sinek
The type of workplace great CEOs create, the inspiration they provide, the benefits and
opportunities they afford and the moral compass that guides them are critical
ingredients to individual and economic well-being. In our current, often less than civil
society, in a world where understanding and including diverse cultures and viewpoints is
vital, the role of these leaders takes on even more significance. While there are many
great CEOs who ‘walk the talk,’ there is clearly a perception among the participants in our
study that there is yet much work to be done to earn the trust of the market.
In contrast to the Americas and EMEA regions, more of the RoW participants (67 percent)
value The expert in the company. They are also less distrusting of the CEO.

Business Performance Benchmark Study 2017 – Page 36. © Altify 2017
Trust for Purchase Decisions | Other Insights
The charts on the following pages illustrate other insights on trusted sources:
• Industry: At 43 percent, Retail & Consumer is the industry with the highest percentage
that selected the Company CEO as a trusted source.
• Role: Among all of the roles represented in the study Marketing (26 percent) and IT
(28 percent) are the greatest fans of social media as a source that you can rely on,
while IT (42 percent) represents a stronghold for people who trust the CEO – well
above average.
• Age: Perhaps surprisingly, Gen X (18 percent) out-paces Millennials (13 percent) in
their outlook on Social Media as a trusted source even though according to Pew
Research, Millennials are much higher users of Social Media. Meanwhile Millennials (39
percent) are the highest supporters of the Company CEO.
• Seniority: Unsurprisingly Executives (34 percent) are more in support of the Company
CEO than either Management (29 percent) or Individual Contributors (21 percent).

Business Performance Benchmark Study 2017 – Page 37. © Altify 2017
• Gender: The ladies in the study generally trust more than the men. Either they are
less critical or just more trusting. The exception is when it comes to trusting the CEO.
When compared with their male counterparts, a smaller percentage of women feel
they can look to the CEO as a trusted source.
• Size: Except in the case of the CEO, there is no material difference in the trend of
what sources we trust. With respect to the CEO, there is an inverse relationship
between size and percentage who trust the CEO: the bigger the company, the less
trust; 22 percent for $1Bn+ companies versus 34 percent for those with less than
$10m in revenue.
• Role: 26 percent of Marketing believes social media is a trustworthy source for buying
decisions. This is in contrast with the other roles where the average is 15 percent.
• Industry: Financial Services (at 80 percent) is top on Independent Research while Retail
& Consumer (43 percent) and Professional Services (37 percent) score highest in their
trust in the company’s CEO.
Business Performance Benchmark Study 2017 – Page 38. © Altify 2017
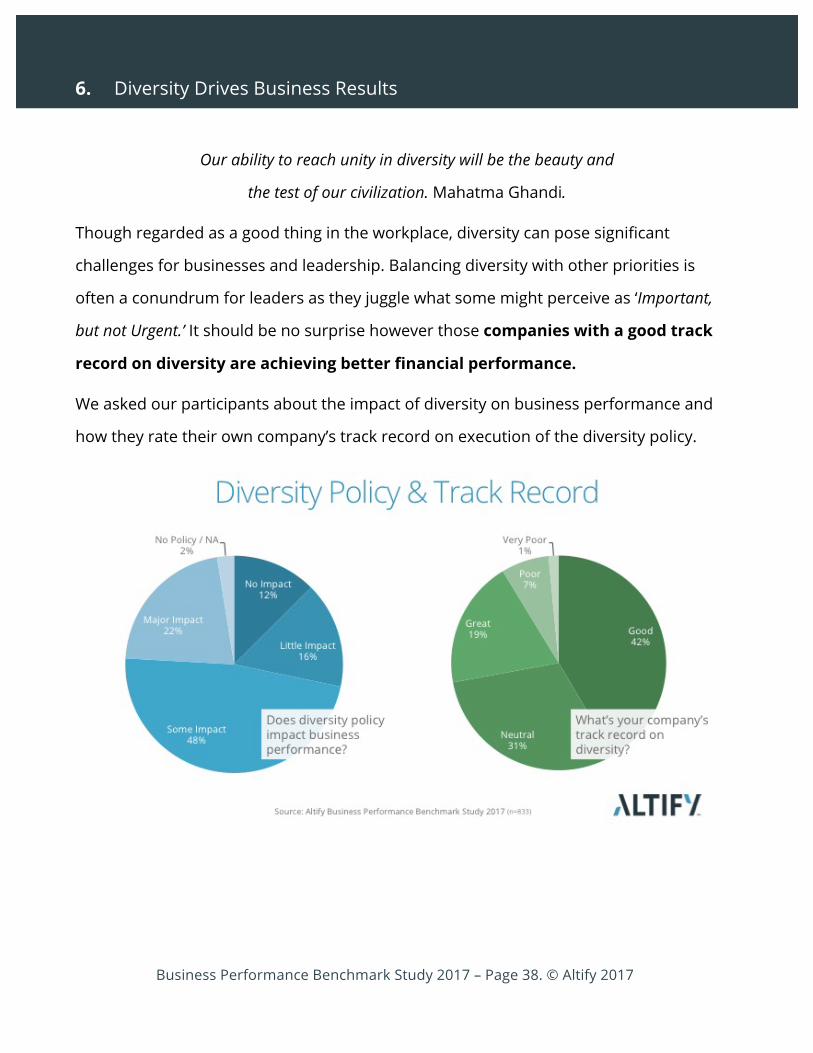
6. Diversity Drives Business Results
Our ability to reach unity in diversity will be the beauty and
the test of our civilization. Mahatma Ghandi.
Though regarded as a good thing in the workplace, diversity can pose significant
challenges for businesses and leadership. Balancing diversity with other priorities is
often a conundrum for leaders as they juggle what some might perceive as ‘Important,
but not Urgent.’ It should be no surprise however those companies with a good track
record on diversity are achieving better financial performance.
We asked our participants about the impact of diversity on business performance and
how they rate their own company’s track record on execution of the diversity policy.

Business Performance Benchmark Study 2017 – Page 39. © Altify 2017
The initial numbers are encouraging. 70 percent believe that a diversity policy has
impact on the business performance of their organization. Similarly, 61 percent of
believe their companies’ track record on diversity is either Good or Great.
A recent McKinsey report suggests 15-35 percent better financial results are achieved in
companies where diversity is being promoted.
While correlation does not equal causation, the results indicate that when companies
commit themselves to diversity they are more successful. Our analysis supports this.
We consider Diversity to be a cornerstone of interpersonal respect, and hypothesized that
companies with a strong track record in performance in this area probably had a better
relationship with their customers. The customer’s experience of dealing with a company
is usually a reflection of the company’s values. If this is true, then it should follow that
Customer Retention would be better for companies where Diversity was part of the culture.

Business Performance Benchmark Study 2017 – Page 40. © Altify 2017
The hypothesis proved out. The Customer Retention performance for companies with
a Good or Great track record in Diversity exceeded those with a Very Poor or Poor
track record by 50 percent.
While 70 percent (those who believe that a diversity policy has impact on the business
performance) is a very respectable number, there were 30 percent of participants who
believe it has Little Impact or No Impact on the performance of the company. Our analysis
would suggest that re-evaluating that perspective might be worthwhile.
It is also clear that overall business performance is impacted when a company is
supportive of a diverse culture. Companies with a Good or Great track record in Diversity
had an average Win Rate 17 percent (or 7 points) greater and an average Sales Cycle 17
percent (or 22 days) shorter than those with a Very Poor or Poor track record in diversity.

Business Performance Benchmark Study 2017 – Page 41. © Altify 2017
As technology seeps further into the everyday domain of all workers in business, there is
both risk and opportunity. Because we are constantly pounded by so much external
stimulus we tend to filter the input, select our preferences and consume that which only
confirms our own inherent biases. Bias is an increasingly worrying problem and Diversity
can be an antidote to bias.
We constantly see the echo-chamber effect where people converse or interact only with
those of a like-minded opinion. This symptom has been all too prevalent in the recent
polarized political races in both the US and EMEA. This is not a way to learn or to broaden
one’s perspective. It does not build a network of trust. It is not how we will experience
different thinking or expand or question our viewpoint.
By embracing diversity we can embrace other opinions, other cultures and other
perspectives to offset the risk of a potentially narrowing mindset.
In Canada, we got a very important thing right, not perfect, but right. In Canada,
we see Diversity as a source of strength, not weakness. Our country is strong, not

Business Performance Benchmark Study 2017 – Page 42. © Altify 2017
in spite of our differences, but because of them. Justin Trudeau, Prime Minister
of Canada, UN General Assembly, 2016
The emerging economies in RoW firmly believe (83 percent) that a diversity policy has
Some Impact or Major Impact on the business performance and more (67 percent) of the
participants from RoW are positive about their companies’ track record in this area.
The implementation of diversity is better in RoW than in Americas or EMEA. While Americas
is closing the gap on the RoW when it comes to executing the diversity policy, EMEA is
lagging behind both regions on their delivery of tangible results of diversity policies.
Diversity: Other Perspectives and Insights
• Seniority: Management (74 percent) is more convinced that there is an impact on
business of a diversity policy. Worryingly, Executives (64 percent) are the least aligned
with this perspective. On the other hand Management represent the lowest relative
number (59 percent) who are impressed with their companies’ track record.

Business Performance Benchmark Study 2017 – Page 43. © Altify 2017
• Company size: The bigger the company, the more they realize the impact of a
diversity policy (74 percent of $1Bn+ companies) and the more satisfied they are with
their track record. 72 percent of $1Bn+ companies are happy with their track record,
versus just 56 percent of $100m-$1Bn companies who are the laggard in this measure.
• Gender: There is a measurable difference of opinion between the genders with
respect to diversity. 79 percent of Female participants believe that a diversity policy
impacts business performance. This compares with just 66 percent of their Male
counterparts.
• Age: There is no material difference in the age groups on the diversity measures.
• Role: IT (82 percent) is well ahead of the average in recognizing the importance of a
diversity policy, but second last (56 percent) in being satisfied with their companies’
track record. Fewer than half (48 percent) of the Marketing participants in the study
says that their companies have a Good or Great track record with respect to diversity.
• Industry: Healthcare (75 percent) and Professional Services (74 percent) see most value
in a diversity policy, though most industries fare pretty well. The most satisfied
industry is Financial Services where 73 percent of participants believe that their
companies deserve a Good or Great ranking when it comes to their track record in
supporting diversity.

Business Performance Benchmark Study 2017 – Page 44. © Altify 2017
Analysis & Insights
Revenue and Performance

Business Performance Benchmark Study 2017 – Page 45. © Altify 2017
7. Spotlight on Sales
Our analysis shows the area that requires most attention for Sales relates to growing
revenue from their existing accounts. Less than half of Sales (48 percent) and just
over a third of Marketing (35 percent) believe that their companies are good at
maximizing the potential revenue from major accounts. When all submissions from
all participants are collated, the result is still a low 45 percent.
The opinion of Sales is generally more positive than that of their colleagues, perhaps
most notably in respect of Marketing’s opinion of the seller’s ability to mine their existing
customers for more business.
In every case though, the perspective of Sales on their skills or the effectiveness of their
activities is more positive than the broader community.
The following table is a summary of the results for this section from All participants in the
study, as well as the submissions from Sales and Marketing recorded separately.

Business Performance Benchmark Study 2017 – Page 46. © Altify 2017
Do you agree with the following in the context of your company? Sales Marketing All
We are effective at maximizing the potential revenue from our major accounts
48% 35% 45%
Before most customer meetings, the seller has a clear plan on what they should achieve, and how to achieve it
62% 58% 59%
Our sales team is effective at gaining access to key buying influencers 61% 52% 59%
Our sales team is good at uncovering the customer's business problem 68% 64% 64%
Our sales team is effective at qualifying sales opportunities 71% 52% 66%
Our sales team can present our unique value to customers 76% 66% 74%
The salesperson cares deeply about the customer's success 87% 70% 80%
Five Opportunities for Improvement in Sales
Based on the submissions by those in the study who classified themselves as part of the
Sales community, we identified five key areas for improvement.
Those who agreed with these statements recorded greater performance over those who disagreed with the assertion
Sales Cycle Win Rate
We are effective at maximizing the potential revenue from our major accounts
-10% +8%
Before most customer meetings, the seller has a clear plan on what they should achieve, and how to achieve it
-12% +17%
Our sales team is effective at gaining access to key buying influencers
-21% +28%
Our sales team is good at uncovering the customer’s business problem
-18% +21%
Our sales team is effective at qualifying sales opportunities -17% +20%

Business Performance Benchmark Study 2017 – Page 47. © Altify 2017
We compared the Win Rate and Sales Cycle for those who classified themselves as
effective with those who did not agree with the assertion. The charts illustrate that those
who are effective experienced improved Win Rates and reduced Sales Cycles.
Now that we know Customer Retention is the #1 Strategic Imperative, we would hope
that Sales would leverage those efforts to grow their business from their existing
accounts. The Account Planning Book of Evidence 2016 shows how leading organizations
are using account planning methodology, powered by software, to grow their key
account revenue by over 200 percent.
It is well known that selling to existing customers is easier and more profitable than
acquiring new customers. If a company is not effective at maximizing the potential from
major accounts the best way to address this deficiency is to engage in effective account
planning and management. Notice we have separated the two. First you have to plan,
and then you have to execute. We have seen too many occasions where one part is done
and the other ignored. If your major accounts are indeed 'major,’ then you can't do this

Business Performance Benchmark Study 2017 – Page 48. © Altify 2017
on your own, and you need corporate level buy in and sustained commitment. Major
account development takes time before it provides a return, and there is no point in
trying to develop major accounts unless your company has the infrastructure, inclination
and ability to apply the necessary resources to make it work.
Only 62 percent of sellers believe they have a clear plan on how they should have a
successful meeting with a customer. The Altify Buyer / Seller Value Index 2016
research study shows that most (62 percent) of customer meetings with sales are a
waste of time, and just 38 percent progress to a next meeting. B2B sellers waste, on
average, over $38,000 per year in direct costs on meetings that do not go anywhere.
Planning a sales call or meeting with a customer is something that is wholly within the
control of the sales team, and methodology and software solutions exist that sellers can
use to end ineffective sales calls. 2
The results of the study show that only 62 percent of sellers are effective at gaining
access to key buying influencers. Those who are effective have a 28 percent
greater Win Rate and a reduction in Sales Cycle of 21 percent. As the saying goes -
companies don't buy, people buy. Failing to gain access to key influencers in a deal is
definitely one of the main reasons why deals are lost - and unfortunately it seems a
sizable majority of the companies represented in the study have some work to do here.
The first step is to identify who the real influencers are; and then consider things from
their perspective. Usually senior executives - who are often the key influencers - will only
take a meeting if someone in their internal organization asks them to. The second key
most likely to open the door is a referral from someone in their industry, perhaps a peer
2 To discover how to create an effective call plan;
Download: 10 Elements of a Sales Call Plan
Business Performance Benchmark Study 2017 – Page 49. © Altify 2017
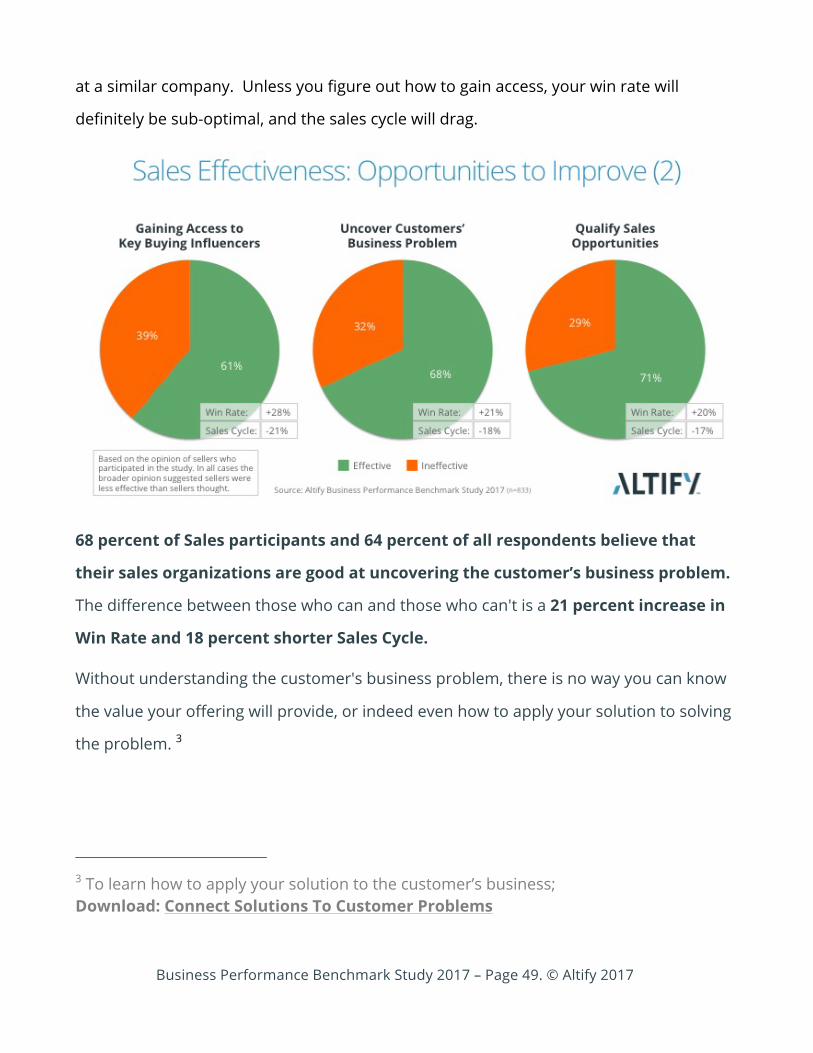
at a similar company. Unless you figure out how to gain access, your win rate will
definitely be sub-optimal, and the sales cycle will drag.
68 percent of Sales participants and 64 percent of all respondents believe that
their sales organizations are good at uncovering the customer’s business problem.
The difference between those who can and those who can't is a 21 percent increase in
Win Rate and 18 percent shorter Sales Cycle.
Without understanding the customer's business problem, there is no way you can know
the value your offering will provide, or indeed even how to apply your solution to solving
the problem. 3
3 To learn how to apply your solution to the customer’s business; Download: Connect Solutions To Customer Problems
Business Performance Benchmark Study 2017 – Page 50. © Altify 2017
8. Spotlight on Marketing
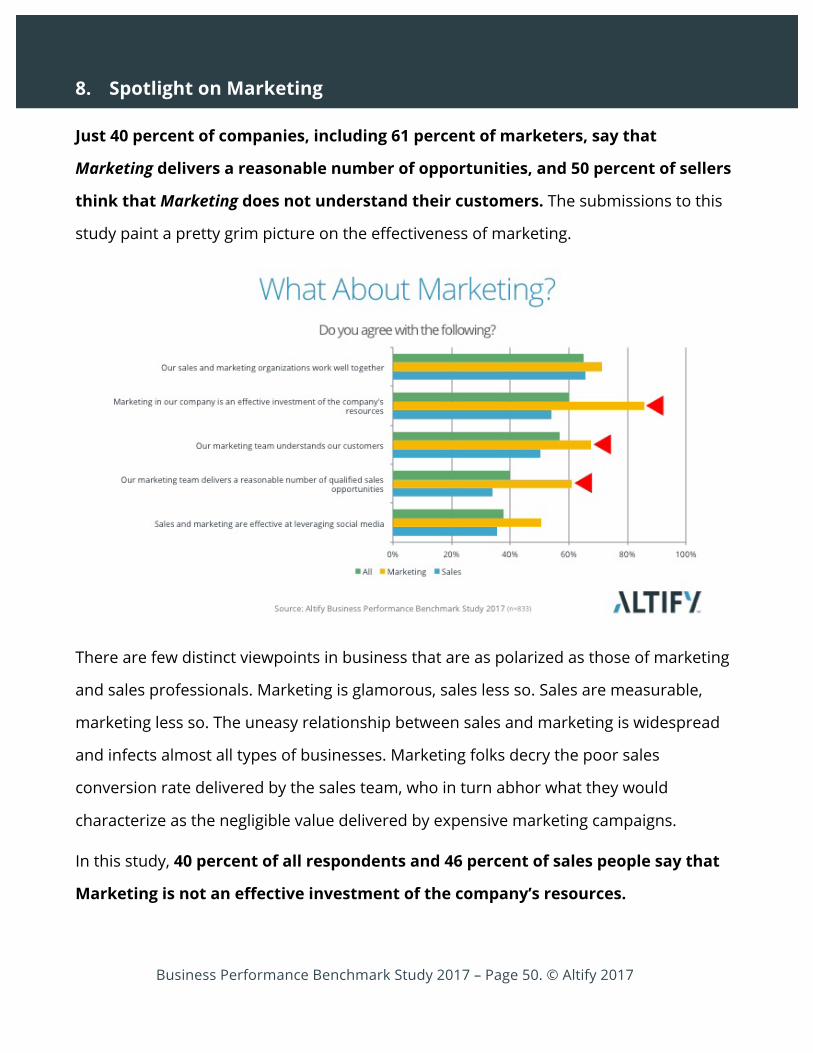
Just 40 percent of companies, including 61 percent of marketers, say that
Marketing delivers a reasonable number of opportunities, and 50 percent of sellers
think that Marketing does not understand their customers. The submissions to this
study paint a pretty grim picture on the effectiveness of marketing.
There are few distinct viewpoints in business that are as polarized as those of marketing
and sales professionals. Marketing is glamorous, sales less so. Sales are measurable,
marketing less so. The uneasy relationship between sales and marketing is widespread
and infects almost all types of businesses. Marketing folks decry the poor sales
conversion rate delivered by the sales team, who in turn abhor what they would
characterize as the negligible value delivered by expensive marketing campaigns.
In this study, 40 percent of all respondents and 46 percent of sales people say that
Marketing is not an effective investment of the company’s resources.

Business Performance Benchmark Study 2017 – Page 51. © Altify 2017
Do you agree with the following in the context of your company?
Sales Marketing All
Sales and marketing are effective at leveraging social media 36% 51% 38%
Our marketing team delivers a reasonable number of qualified sales opportunities
34% 61% 40%
Our marketing team understands our customers 50% 68% 57%
Marketing in our company is an effective investment of the company's resources
54% 86% 60%
Our sales and marketing organizations work well together 66% 71% 65%
Our marketing team understands our products 71% 78% 73%
In addition, in a more specific and possibly more damning indictment of Marketing, 43 of
study participants do not believe Marketing understand customers.4 If we look at the
opinions of the Sales contingent, half of Sales concur with that viewpoint. From the
Marketing perspective, just two-thirds (68 percent) of marketers themselves believe they
understand their customers. On the other hand, most marketers understand the
company’s products, with about three-quarters (73 percent) of all participants, and 78
percent of Marketing sharing that viewpoint. But the reality is, relatively speaking,
understanding your products, but not your customer, is a recipe for mediocre
performance at best. As you can see from the chart below, other than the organizational
velocity that happens when Sales and Marketing work well together, the positive impact
of Marketing understanding the customer outweighs all other performance
indicators.
4 To learn how to apply your solution to the customer’s business; Download: Connect Solutions To Customer Problems

Business Performance Benchmark Study 2017 – Page 52. © Altify 2017
Six Opportunities for Improvement for Marketing
Like many opposing forces, however, the true interdependence between Sales and
Marketing is often understated and sometimes unclear. Let us be clear in this report.
According to the participants in our study, and the analysis of their recorded
performance, Sales and Marketing working well together is the single biggest
marketing contribution to improved results.
Those who agreed with these statements recorded greater performance over those who disagreed with the assertion
Sales Cycle Win Rate
Our marketing team understands our customers -17% +21%
Marketing in our company is an effective investment of the company’s resources
-13% +10%
Our marketing team understands our products -15% +7
Our sales and marketing organizations work well together -18% +26%
Our marketing team delivers a reasonable number of qualified sales opportunities
-15% +15%
Sales and marketing are effective at leveraging social media -16% +11%

Business Performance Benchmark Study 2017 – Page 53. © Altify 2017
In some cases where sales and marketing are not aligned around the customer, the
strategic marketing function believes that it sets out the game plan, only to find that
there are no players who understand the strategy.
In other scenarios, Sales execute plays, without understanding the corporate goal. On
today’s playing field, successful selling encapsulates the best of strategic marketing, but
at an individual customer level. Today’s sales winners eschew their previous role as
vehicles for communication of marketing messages, and take responsibility for value
creation, delivered to carefully chosen prospects – to convert them to valued and
valuable customers. This development means that Sales and Marketing must be in synch.
According to this study; for those organizations where Sales and Marketing work well
together Win Rate is 18 percent higher and Sales Cycle is reduced by 26 percent.
There are very few organizations that we have encountered where Sales is happy with
the number or quality of sales opportunities delivered by Marketing. The study bears this
out. 66 percent of sellers say that Marketing does not deliver a reasonable number

Business Performance Benchmark Study 2017 – Page 54. © Altify 2017
of qualified opportunities, and 39 percent of marketers agree that their
performance in this area is inadequate.
However, the focus on marketing developed opportunities and the common chant from
Sales of “We need more leads” may well be misplaced energy. Where we have sales
organizations outperforming their competitors, we have also seen an accompanying
acceptance that Sales owns the opportunity pipeline, and that Marketing is the supporting
player, not the leading role.
The difference in performance is not that dramatic between companies where Marketing
delivers a reasonable number of qualified opportunities and those who don’t – just a 15
percent improvement in both Win Rate and Sales Cycle. While this difference is not
insignificant, it is a correlation, and not definitively a causal factor.
As is true with any of the metrics in this report, isolating one factor to predict outcomes is
never enough. In many cases, good performance in any one area is both valuable in
itself, but also probably an indicator of broader good business discipline.
Elsewhere in the study we examined the trusted sources to which people turn when
choosing to do business with a company. Social Media was at the bottom of the list. In
this case, just 38 percent of all participants (51 percent of Marketing) say that Sales
and Marketing are effective at leveraging social media. Is this a missed opportunity?
Well, maybe so. Based on the results presented by the participants in the study, Win
Rate and Sales Cycle are better by 11 percent and 16 percent respectively in those
organizations where Sales and Marketing are effectively leveraging social media.

Business Performance Benchmark Study 2017 – Page 55. © Altify 2017
9. Spotlight on Sales Management
Frontline sales managers have the toughest job in sales. They are the last link between
the company and the sales team’s interaction with the customer. For a company to be
successful, the sales management function must perform. But sales managers are pulled
in so many different directions, by so many people, it can be hard for them to find the
time to focus on effective sales performance management. Even if they have the time, it
can be hard to get the insights they need from the flood of data in the CRM. These
factors often lead to Sales Management having little time to coach, inaccurate sales
forecasts, and an underperforming sales team.
Nearly two-thirds (62 percent) believe that the first-line sales managers in their
companies are able to do their job effectively. However, some of the other measures
from the analysis might call into question their efficacy in certain areas.

Business Performance Benchmark Study 2017 – Page 56. © Altify 2017
Sales management expertise needs to be at the core of any sales organization. If sales
management does not have expertise, domain knowledge, experience and a ‘nose’ for
what’s right, they can’t apply the qualitative input – making it hard to connect the dots.
Nevertheless, there are leading sales organizations that are doing this well. They’re adept
at combining sales expertise with coaching and data analysis, and using software to ask
the right questions, derive the pertinent insights, and scale the coaching solution to gain
significant benefits.
• Increased performance of the sales team based on more informed sales
management and more knowledgeable sales coaching
• Improved sales productivity for individual sellers with automated coaching and
visualization of results for greater alignment and motivation
• Accelerated sales velocity by measurement and analysis of win rate, sales cycle,
deal size and pipeline health to reduce risk and take advantage of opportunities
Among the companies represented by participants in the study just one third (33
percent) of companies close deals as originally forecasted. The consequence of
inaccurate forecasts can be devastating for a sales manager and the company. While the
increased performance associated with those companies who can forecast accurately, at
18 percent increase in Win Rate and 23 percent reduction in Sales Cycle are valuable – this
measure is really a reflection of the aggregate impact of the rest of the sales best
practice measures, rather than a performance boost because of forecasting skill.
Business Performance Benchmark Study 2017 – Page 57. © Altify 2017
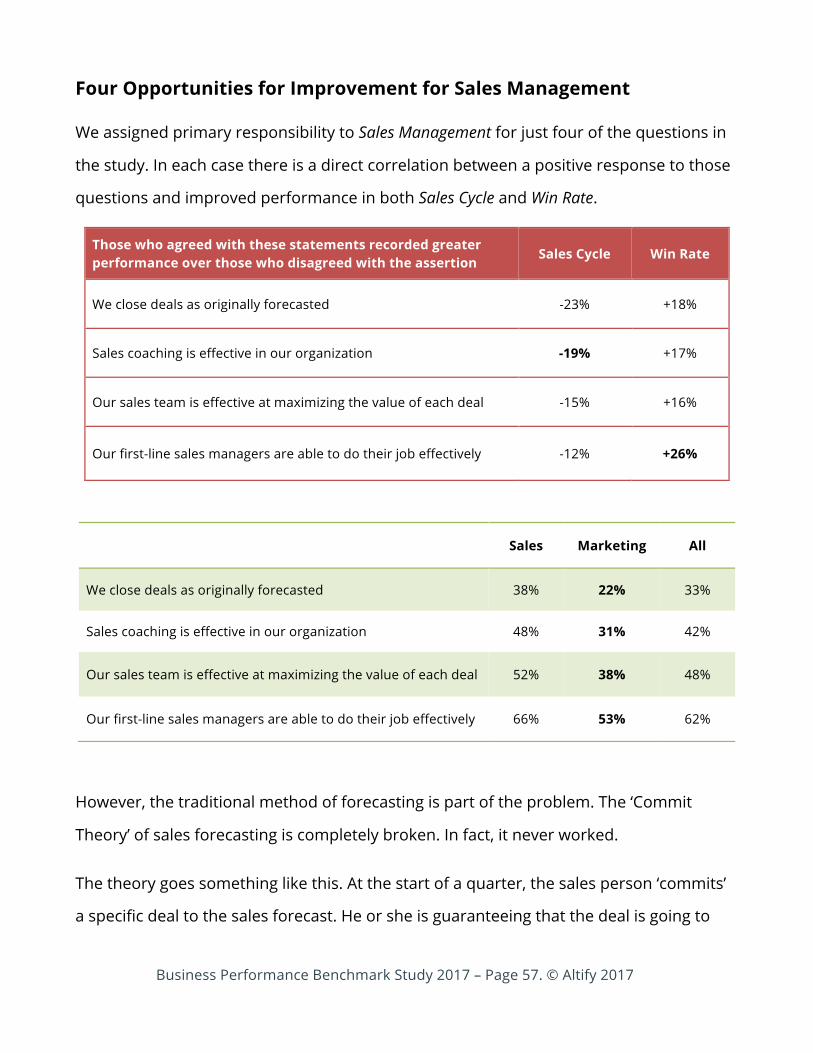
Four Opportunities for Improvement for Sales Management
We assigned primary responsibility to Sales Management for just four of the questions in
the study. In each case there is a direct correlation between a positive response to those
questions and improved performance in both Sales Cycle and Win Rate.
Those who agreed with these statements recorded greater performance over those who disagreed with the assertion
Sales Cycle Win Rate
We close deals as originally forecasted -23% +18%
Sales coaching is effective in our organization -19% +17%
Our sales team is effective at maximizing the value of each deal -15% +16%
Our first-line sales managers are able to do their job effectively -12% +26%
Sales Marketing All
We close deals as originally forecasted 38% 22% 33%
Sales coaching is effective in our organization 48% 31% 42%
Our sales team is effective at maximizing the value of each deal 52% 38% 48%
Our first-line sales managers are able to do their job effectively 66% 53% 62%
However, the traditional method of forecasting is part of the problem. The ‘Commit
Theory’ of sales forecasting is completely broken. In fact, it never worked.
The theory goes something like this. At the start of a quarter, the sales person ‘commits’
a specific deal to the sales forecast. He or she is guaranteeing that the deal is going to

Business Performance Benchmark Study 2017 – Page 58. © Altify 2017
close in the quarter. In its worst manifestation, this commitment is an unbreakable
contract between the sales person and his or her manager. The theory is that the
resultant pressure is enough to ensure that the sales person will get the deal. That’s a
pretty flawed theory, and one of the reasons why 50% of forecasted deals don’t close.
Accountability is good – but the misguided use of commitment is dangerous. It can be
the enemy of good sales practice, and has the potential to alienate good sales people
and damage customer relationships. Making, or accepting a commitment, without an
objective assessment of the ability to deliver on the commitment, is counterproductive.
Sales expectations are misaligned, and subsequent actions that are taken - based on the
commitment - are built on a flawed foundation. 5
Even though coaching is recognized as being a true driver of sales productivity, most
5 For guidance on how to address this and other sales management problems;
Download: Winning Sales Performance Management

Business Performance Benchmark Study 2017 – Page 59. © Altify 2017
sales managers don’t coach on a regular basis. In fact, 73% of sales managers spend less
than 5% of their time coaching. The theory of regular coaching is great, but in most cases,
it’s not working in practice; largely because the infrastructure required to consistently
deliver effective coaching - for even a moderately sized sales team - is lacking.
The math better illustrates this phenomenon. Let’s assume that the sales manager has
eight people on his team, each working six material opportunities, and a 90-day sales
cycle. That’s 48 opportunities in his universe, at any given time. Even if he tries to coach
just half of these opportunities effectively each month, spending two hours per
opportunity, he runs out of time. The consequence then is that the manager cannot
support the seller to maximize the value of each deal by selling value truly aligned with
the customer’s business need. It is no surprise that the efficacy levels for coaching and
maximizing deal value is similar.
Business Performance Benchmark Study 2017 – Page 60. © Altify 2017
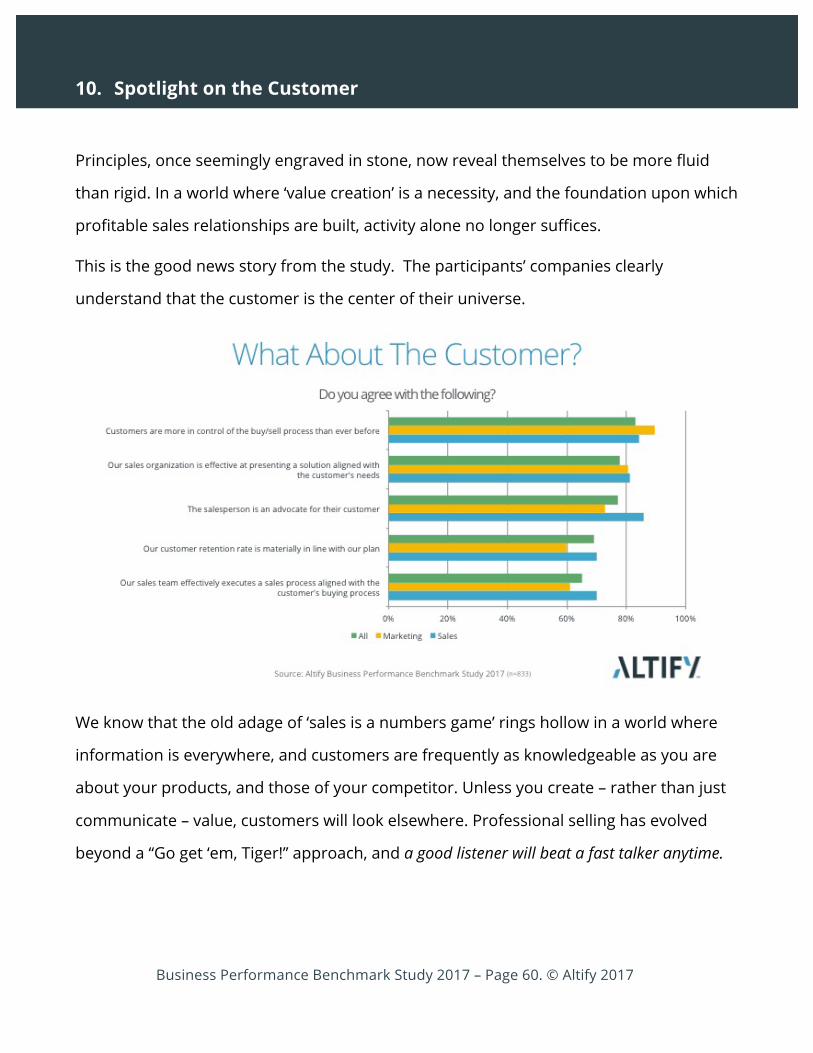
10. Spotlight on the Customer
Principles, once seemingly engraved in stone, now reveal themselves to be more fluid
than rigid. In a world where ‘value creation’ is a necessity, and the foundation upon which
profitable sales relationships are built, activity alone no longer suffices.
This is the good news story from the study. The participants’ companies clearly
understand that the customer is the center of their universe.
We know that the old adage of ‘sales is a numbers game’ rings hollow in a world where
information is everywhere, and customers are frequently as knowledgeable as you are
about your products, and those of your competitor. Unless you create – rather than just
communicate – value, customers will look elsewhere. Professional selling has evolved
beyond a “Go get ‘em, Tiger!” approach, and a good listener will beat a fast talker anytime.

Business Performance Benchmark Study 2017 – Page 61. © Altify 2017
Sales Marketing All
Our sales team effectively executes a sales process aligned with the customer's buying process
70% 61% 65%
Our customer retention rate is materially in line with our plan 70% 60% 69%
The salesperson is an advocate for their customer 86% 73% 77%
Our sales organization is effective at presenting a solution aligned with the customer's needs
81% 81% 78%
Customers are more in control of the buy/sell process than ever before
84% 90% 83%
Customers now look to a seller as their partner in developing a future vision for their
organizations. They expect actions – not just words. The winning professional
salesperson is becoming a customer confidante, a trusted advisor in his industry, and
both company and customer benefit.
Three Opportunities for Improvement in Customer-centricity
Based on the input received pertaining to customer-focused activity, we identified three
key areas for improvement.
Those who agreed with these statements recorded greater performance over those who disagreed with the assertion
Sales Cycle Win Rate
Our sales organization is effective at presenting a solution aligned with the customer's needs
-21% +33%
Our sales team effectively executes a sales process aligned with the customer's buying process
-22% +22%
The salesperson is an advocate for their customer -13% +15%

Business Performance Benchmark Study 2017 – Page 62. © Altify 2017
We compared the Win Rate and Sales Cycle for those who classified themselves as
effective with those who did not agree with the assertion. The charts illustrate that those
who are effective experienced improved Win Rates and reduced Sales Cycles.
There is a tremendous opportunity for improved sales performance when the sales
team’s presentation maps to what the customer wants. This may see obvious, but 31
percent are not effective at presenting a solution that is aligned to their
customer’s needs. For those who are in that 31 percent, the improvement opportunity
is significant. Win Rate improves by 33 percent, and Sales Cycle reduces by 21
percent when sellers can present a solution mapped to customer’s requirements. 6
Historically, sales processes were designed from the sales organization’s perspective and
6 For guidance on how to get closer to your customer;
Download: Putting the Customer At The Center

Business Performance Benchmark Study 2017 – Page 63. © Altify 2017
it went something like this: Qualify, Conduct Discovery, Present, Send Proposal, Negotiate
Pricing, Close. This approach was focused on internal activities, and did not consider the
customer’s buying process or how they preferred to engage. By adopting a buyer-centric
sales process, aligned to the buyer’s desired approach, sales activities can be mapped to
the customer’s buying activities, resulting in a less contentious interaction and more
fruitful endeavor.
According to the study, 65 percent of organizations adopt a sales process aligned to
the customer’s buying process. The difference in effectiveness is dramatic. When a
buyer-centric sales process is used, Win Rate increases 22 percent, and Sales Cycle
is reduced by 22 percent. 7
The third customer-focused area that emerged from the study was the role of sales
person as customer advocate. 77 percent of study participants say the sellers in
their organizations are advocates for the customer. Clearly that is a positive
development. It has not always been that way. And this behavior is not entirely altruistic.
Where sellers act as advocates for their customer, Win Rate is increased by 15
percent and sales cycles run 13 percent faster. This is one factor that clearly shows
the benefit of taking care of the customer. When you do the right thing, good things
happen.
7 For guidance on how to design a winning sales process;
Download: 12 Elements of a Great Sales Process

Business Performance Benchmark Study 2017 – Page 64. © Altify 2017
11. Priority Projects
In this section of the study we provided participants with a list of projects so they could
choose those that they wished to prioritize in 2017.
What are the top priority challenges to address for 2017?
Sales-cycle times Number of qualified sales opportunities
Revenue from existing customers
New customer acquisition Average size of deals with new customers
Alignment of Sales and Marketing
Understanding the customer's business
Account Based Marketing Effectiveness of first-line sales management
Opportunity Win Rate Time to on-board new sales hires
Connecting solutions to customer's business problem
The customer experience Product quality Utilization of Social Media
Sales systems and infrastructure
Marketing systems and infrastructure
Customer service systems and infrastructure
In life there are always choices you have to make and the same is true in business. Every
business leader, manager or individual contributor must set priorities and realize that
they cannot focus on everything. If your lens is too open your vision is blurred. Then it is
hard to see anything clearly. Not everything can assume equal importance. You cannot
be best at everything or take everything on at the same time. No one can have it all.
Concessions must always be made.
As you can see from the following chart the majority of participants (56 percent) selected
between four and eight priority projects. A small number did not pick any priority project
and we have discounted those from our analysis, but a fifth of participants selected more
than 10 priority projects. Unless there is abundant resource and great delegation, it will
be hard to achieve success with all of these initiatives.

Business Performance Benchmark Study 2017 – Page 65. © Altify 2017
The #1 priority project for 2017 among the participants in the study is New
customer acquisition. 81 percent of submissions identified this as a 2017 priority.

Business Performance Benchmark Study 2017 – Page 66. © Altify 2017
Priority Percent
1. New customer acquisition 81.21%
2. Revenue from existing customers 64.94%
3. Number of qualified sales opportunities 60.40%
4. The customer experience 55.61%
5. Opportunity Win Rate 52.96%
6. Connect solutions to customer's business problems 48.30%
7. Product quality 44.77%
8. Sales systems and infrastructure 39.22%
9. Understanding the customer's business 37.33%
10. Average size of deals with new customers 37.20%
11. Sales-cycle times 36.32%
12. Customer service systems and infrastructure 35.69%
13. Alignment of Sales and Marketing 32.91%
14. Marketing systems and infrastructure 31.65%
15. Effectiveness of first-line sales management 26.73%
16. Utilization of Social Media 26.23%
17. Time to on-board new sales hires 23.46%
18. Account Based Marketing 22.57%

Business Performance Benchmark Study 2017 – Page 67. © Altify 2017
Having New customer acquisition as the top priority is possibly at odds with Customer
Retention being the top strategic initiative as reported earlier in the report, though
obviously you have to have customers to retain. The second priority Revenue from existing
customers is more easily connected to Customer Retention; as you pay more attention to
existing customers, it drives better customer service.
We recommend these four initiatives to improve Customer Retention:
• Revenue from existing customers (2)
• The customer experience (4)
• Connect solutions to customer’s business problems (6)
• Understanding the customer’s business (9)
From a Revenue Growth perspective, we would focus on:
• New customer acquisition (1)
• Opportunity Win Rate (5)
• Connect solutions to customer’s business problems (6)
• Understanding the customer’s business (9)
• Revenue from existing customers (2)
• Effectiveness of first-line sales management (15)
Everything begins and ends with the customer – and both Customer Retention and
Revenue Growth are impacted by many of the priority projects identified.
To simplify the presentation of the findings we created two groups of topics; one
primarily Customer related, and the other Revenue related. Some of these could have
been in both groupings, but this segmentation provides an effective lens to assess
different perspectives.

Business Performance Benchmark Study 2017 – Page 68. © Altify 2017
Customer Related Projects # Revenue Related Projects #
Revenue from existing customers 1
New customer acquisition 1
The customer experience 2
Number of qualified sales opportunities 2
Connect solutions to customer's problems
3
Opportunity Win Rate 3
Product quality 4
Average size of deals with new customers
4
Understanding the customer's business 5
Sales-cycle times 5
Customer service systems 6
Effectiveness of first-line sales management
6
Customer Related Priority Projects
65 percent of participants plan to prioritize a project to increase Revenue from
existing customers, followed by: The customer experience, Connect solutions to customer's
problems, Product quality, Understanding the customer's business, and Customer service
systems.
Customer Focused Projects
1. Revenue from existing customers 65%
2. The customer experience 56%
3. Connect solutions to customer's problems 48%
4. Product quality 45%
5. Understanding the customer's business 37%
6. Customer service systems 36%

Business Performance Benchmark Study 2017 – Page 69. © Altify 2017
For an organization to increase the revenue it receives from its existing customers, it
should view that as a result of a number of other good behaviors that focus on a ‘mutual
value’ approach, which is the core of customer-centricity8, the compass by which all
actions must be guided to maximize revenue from existing customers.
Based on our experience, and empirical results, we would prioritize as follows:
1. Understanding of the customer’s business
This initiative was ranked fifth in the list of priorities from the study and only on the
list for 37 percent of all participants in the study. Without an understanding of the
customer’s business it is almost impossible to know how your solutions can be
applied to help the customer solve her problem.
2. Connect solutions to customer’s problems
This is the third most common customer focused project, with nearly half (48 percent)
identifying it as a priority project. Once you have an Understanding of the customer’s
business you should be able to help the customer understand how they might apply
your solution to solve their business problem. When you have a good understanding
of their goals, the internal and external pressures that they are dealing with, and the
obstacles to progress, you can directly link your solutions or specific elements thereof
to the particular broken processes that the customer has to fix or the specific tasks
that need to be undertaken to relieve the pressures and achieve the goals.
3. Maximize Revenue from existing customers
Both of the prior strategies should be applied whether you are pursuing an individual
sales opportunity or trying to expand your footprint in an existing account. However,
8 For a guide to customer-centricity; Download: Putting the Customer at the Center
Business Performance Benchmark Study 2017 – Page 70. © Altify 2017
if you already have a foothold in an existing account it is essential that you
understand the customer’s business and how your solution helps them make
progress. Effective account planning is a proven way to do this.
As you will have seen from earlier analysis in this report, those who are effective at
maximizing revenue from existing customers have a greater Win Rate (+8 percent) and a
shorter Sales Cycle (-10 percent) than the rest of the study participants. Those who excel
in this area are usually practitioners of account planning and management.
According to the Account Planning Book of Evidence 2016, other benefits that accrue from
this activity include: Increased Understanding of Customer’s Business, Better Customer
Loyalty, Increased Deal Size, Better Executive Access and Non-Competitive Deals.9
Revenue Related Priority Projects
81 percent of all participants plan to prioritize a project for New customer
acquisition. Customer acquisition is of course a pre-requisite to sustained revenue
growth.
Even though it is proven that gaining revenue from existing customers is particularly
effective as a revenue generator, you need to continue to acquire new customers so that
you can grow them.
9 For detailed insight on the benefits of Account Planning;
Download: Account Planning Book of Evidence 2016

Business Performance Benchmark Study 2017 – Page 71. © Altify 2017
Revenue Related Projects
1. New customer acquisition 81%
2. Number of qualified sales opportunities 60%
3. Opportunity Win Rate 53%
4. Average size of deals with new customers 37%
5. Sales-cycle times 36%
6. Effectiveness of first-line sales management 27%
As you strive to grow revenue you should consider the following: The revenue that you
can achieve is a function of the Number of Deals, your Win Rate, Average Deal Size and
length of Sales Cycle.10 When you combine these four factors you get the core elements
of your Sales Velocity - the measure of the revenue that can be achieved in a given
period. No matter how complex your business, these are the only four levers that you
can pull, and are each represented in the Revenue related projects as #2, #3, #4, and #5.
10 For deeper insight on the Sales Velocity Equation; Download: Optimize Sales Results with the Sales Velocity Equation
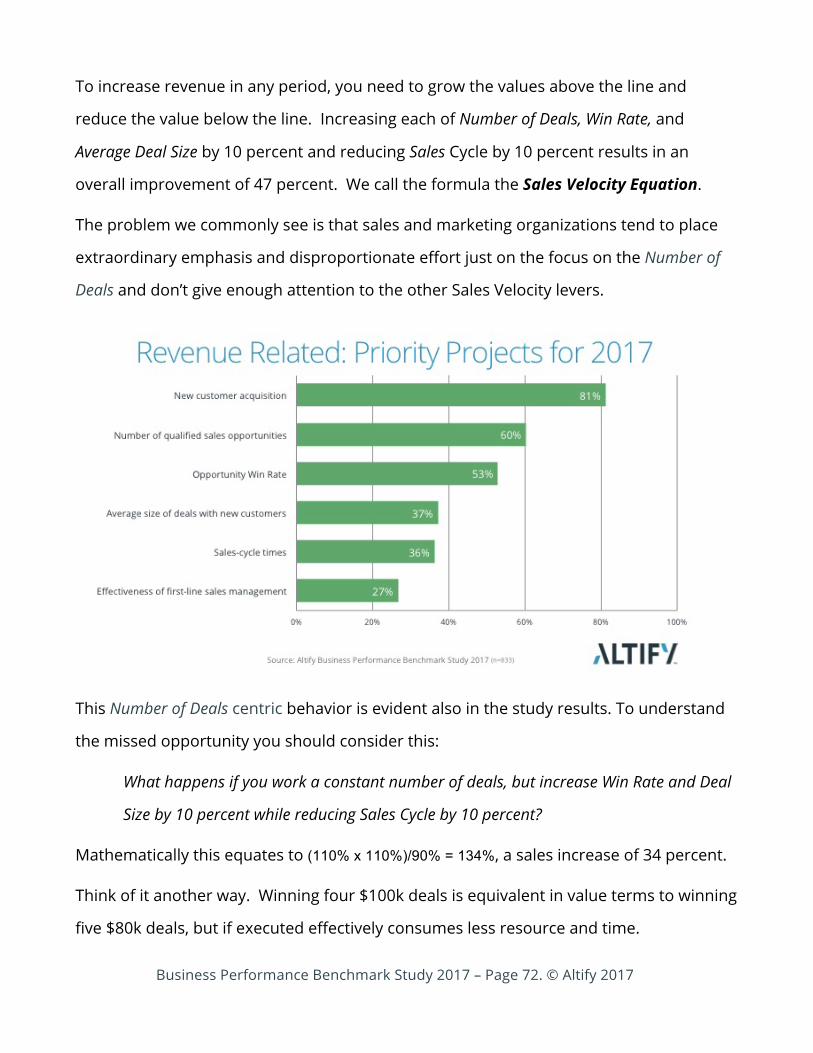
Business Performance Benchmark Study 2017 – Page 72. © Altify 2017
To increase revenue in any period, you need to grow the values above the line and
reduce the value below the line. Increasing each of Number of Deals, Win Rate, and
Average Deal Size by 10 percent and reducing Sales Cycle by 10 percent results in an
overall improvement of 47 percent. We call the formula the Sales Velocity Equation.
The problem we commonly see is that sales and marketing organizations tend to place
extraordinary emphasis and disproportionate effort just on the focus on the Number of
Deals and don’t give enough attention to the other Sales Velocity levers.
This Number of Deals centric behavior is evident also in the study results. To understand
the missed opportunity you should consider this:
What happens if you work a constant number of deals, but increase Win Rate and Deal
Size by 10 percent while reducing Sales Cycle by 10 percent?
Mathematically this equates to (110% x 110%)/90% = 134%, a sales increase of 34 percent.
Think of it another way. Winning four $100k deals is equivalent in value terms to winning
five $80k deals, but if executed effectively consumes less resource and time.

Business Performance Benchmark Study 2017 – Page 73. © Altify 2017
Only 37 percent of study participants selected a priority project to address Average
size of deals with new customers, though we know from earlier analysis that 52
percent are not effective at maximizing deal value. Similarly, just 36 percent have
prioritized fixing sales cycle times.
Deal slippage is one of the greatest culprits contributing to an inaccurate forecast, and
we know that more than two thirds of the study participants consider that they are not
effective at accurate forecasting.
60 percent of participants highlighted Number of qualified sales opportunities as an
area for priority focus in 2017. Getting in front of enough qualified prospects is critical
to revenue growth and should be considered the joint responsibility of both Sales and
Marketing. 72 percent of Sales, but only 57 percent of Marketing see Number of
qualified sales opportunities as a 2017 priority project.
This may partly explain only 34 percent of sellers and 61 percent of marketers
believe that Marketing delivers a reasonable number of qualified opportunities.
Salespeople have control over two things; what customers they meet and what they do
Business Performance Benchmark Study 2017 – Page 74. © Altify 2017
when they get to the meeting.11 Increasing the number of opportunities is not in itself
effective. These opportunities need to be with the right customer at the right time, and
the seller needs to fully understand how to apply their solutions to solve the customer’s
problem. Every part of the sales process should be aligned with the customer’s buying
process. Each deal should be qualified rigorously and continuously.
Every call or meeting must be planned with clear objectives and strategies for the
meeting or call. Most importantly, all sellers (and marketers and other customer facing
people) must remember that the customers care about their problems, their business
issues and how these might be solved. They care less about the vendor’s solution unless
they can clearly identify how to connect the solution to the their business problems. 12
Sales Management: The sixth and final topic in this section is Effectiveness of first-line sales
management. Just 27 percent of participant identified first-line sales management as an
area for focus in 2017. This may be because 62 percent say they believe that their sales
managers are effective, but there may also be a lack of understanding of the critical nature of
the role. We know that frontline sales management is one of the key levers. According to
the study, Win Rate is up by 26 percent when sales managers do their job effectively. The
study also found a small percentage of companies (42 percent) where Sales Coaching is
effective, and just a third where Sales Forecasting is accurate. Both of these activities fall
squarely within the remit of sales management. 13
11 To make sure every call or meeting with customers is effective;
Download: 10 Elements of a Sales Call Plan
12 To help customers understand how your solution addresses their business problem; Download: Connect Solutions to Customer Business Problems 13 To design an effective sales management cadence; Download: Winning Sales Performance Management

Business Performance Benchmark Study 2017 – Page 75. © Altify 2017
Whose Story Is This?

Business Performance Benchmark Study 2017 – Page 76. © Altify 2017
Whose Story Is This?
Contribution from Senior Executives
There were 833 participants from 60 countries who contributed to the Business
Performance Benchmark Study. Participants represented all levels in their respective
organizations though there was a strong senior level contribution with 83 percent
coming from Executive or Management roles.
Executive 40%
Management 43%
Individual 17%
833 Participants 60 Countries

Business Performance Benchmark Study 2017 – Page 77. © Altify 2017
Global Perspective
People came from far and wide to share their perspective. Sixty countries are
represented from Australia to Austria, Iceland to Ireland, and of course the United States
to the United Kingdom. You will see from the analysis that there is definitely a regional
bias that comes through some of the data points. Just over half (51 percent) of the
respondents are located in the Americas, followed closely by the EMEA delegation who
account for two out of five participants. At only 6 percent, the Rest of the World has light
representation.
Americas 51%
EMEA 42%
Rest of World 6%

Business Performance Benchmark Study 2017 – Page 78. © Altify 2017
Broad Range of Target Company Profiles
The economy of the future, and the world that we live in today, is made up of companies
of all shapes and sizes. How you design your engagement strategies; sales, marketing,
and customer service, can be informed by better understanding the perspectives of each.
Through the analysis, we segment the data by company size to bring clarity to the
different viewpoints.
As you would expect, the majority of respondents come from smaller companies. Two
thirds represent their position in companies with less than $100m in revenue. But there
is also a meaningful cohort above $100m and equally over $1Bn.
<$10m 42%
$10m-$100m 24%
$100m-$1Bn 15%
$1Bn+ 11%

Business Performance Benchmark Study 2017 – Page 79. © Altify 2017
Strong Representation from High Tech, Services, & Manufacturing
Among the participants, there is a good representation across most of the major
industries. As expected, there are significantly more participants from companies in High
Tech (28 percent) and Professional Services (24 percent), reflecting the technology and
service bias of today’s economy.
High Tech 28%
Professional Services 24%
Manufacturing 12%
Other 10%
Telecommunications & Media 7%
Retail & Consumer 7%
Financial Services 6%
Healthcare 5%
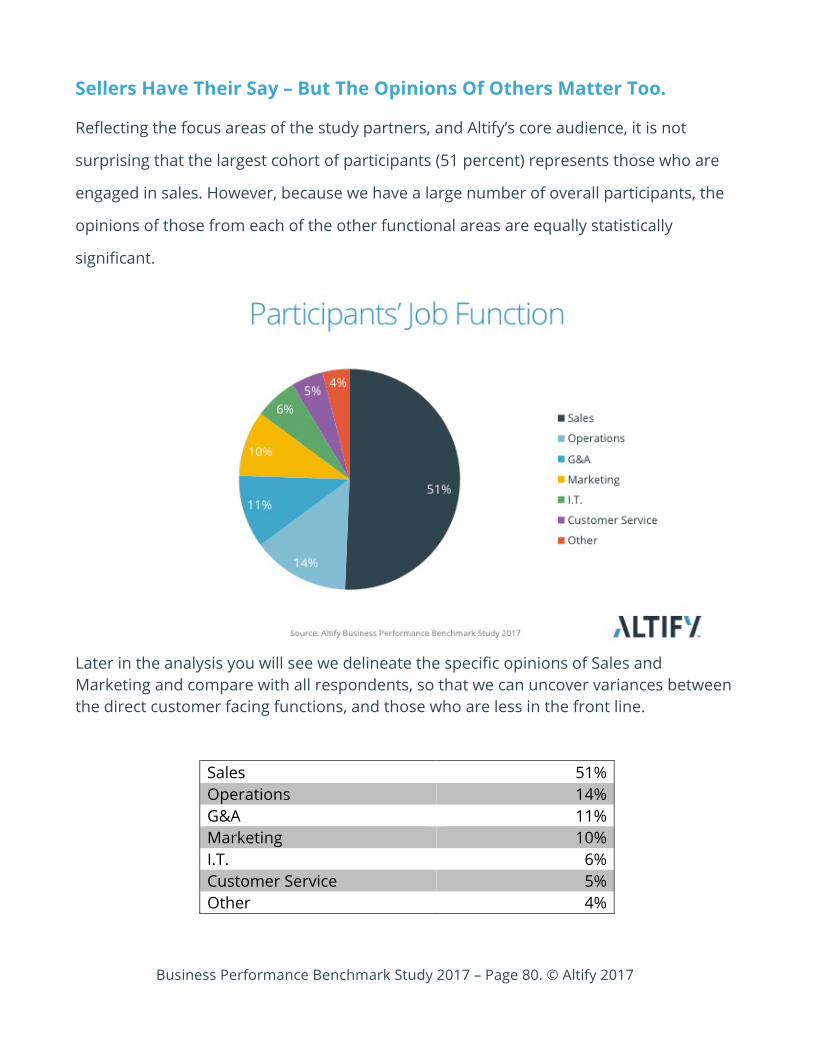
Business Performance Benchmark Study 2017 – Page 80. © Altify 2017
Sellers Have Their Say – But The Opinions Of Others Matter Too.
Reflecting the focus areas of the study partners, and Altify’s core audience, it is not
surprising that the largest cohort of participants (51 percent) represents those who are
engaged in sales. However, because we have a large number of overall participants, the
opinions of those from each of the other functional areas are equally statistically
significant.
Later in the analysis you will see we delineate the specific opinions of Sales and Marketing and compare with all respondents, so that we can uncover variances between the direct customer facing functions, and those who are less in the front line.
Sales 51% Operations 14% G&A 11% Marketing 10% I.T. 6% Customer Service 5% Other 4%

Business Performance Benchmark Study 2017 – Page 81. © Altify 2017
A Blend Of Age And Gender
Gen-Xers, those in the 35-50 age bracket, are the most represented group in the study at
46 percent of participants. However they are balanced well by the combined 50 percent
of Baby Boomers and Millennials, at 33 percent and 17 percent respectively.
In the analysis you will see
that the opinions of each
age group varies in many
of the points raised in the
study. This information will
be valuable if your
audience or marketplace is
more heavily represented
by a certain demographic.
From a gender perspective; the number of Male respondents (77 percent) greatly
outweighs the number of Female participants (20 percent). Given that women (in the US)
represent about 47 percent of
the workforce, this is a notable
anomaly, but probably
explained by the High Tech and
Sales bias in the respondent
demographic.
There is a further twist to that
tale: Even though one-in-five of
the respondents is female, only one-in-eight of the Executive respondents is female.

Business Performance Benchmark Study 2017 – Page 82. © Altify 2017