Embed Size (px)
Citation preview
24
NJB Vol. 65 , No.2 (Summer 2016) Erno Nykänen, Marko Järvenpää & Henri Teittinen
Business intelligence in decision makingin Finnish enterprises
Abstract
This exploratory study focuses on Finnish enterprises and examines how and why they are applying business intelligence today. Especially the process from data into knowledge and how business intel-ligence is utilized in decision making have been studied. We observed that BI tools improve the speed and quality of decision making and BI tools were coupled with actual decision making. BI tools are used frequently but those are only means to an end and in order to examine how they are used to attain specific outcomes. Most of the end users utilised the loosely-coupled approach, but half of the respondents also utilised BI with tighter coupling, structured human decisions, by using customised analyses and reports for certain problems and even creating ones themselves but the tightest form of coupling, automated decision making, remained rare.
Erno Nykänen, Marko Järvenpää & Henri Teittinen
Erno Nykänen is an SAP consultant at Gapgemini, FinlandMarko Järvenpää is a Professor of Accounting at the University of Jyväskylä, FinlandHenri Teittinen is a Post-Doctoral Researcher at Turku School of Economics, Finland
25
NJB Vol. 65 , No.2 (Summer 2016) Business intelligence in decision making
1. IntroductionIn the recent years, there has been an increas-ing interest towards business intelligence (BI) systems, not only among practitioners but also in the academia. Enterprise resource planning (ERP) systems, enterprise wide data warehouses and more sophisticated hardware and software allow for more versatile and powerful BI systems than ever before (Her-schel 2010; Davenport 2006; Negash 2004). The evolutions in information technology (IT) systems transform how data and infor-mation is collected and analysed in organ-isations, including their management and controlling functions (Bhimani & Willcocks, 2014). Consequently more research effort has been directed towards this prospering field of study, both from IT, management control and business disciplines.
Previous studies on Business Intelligence in Finland have focused particularly to the top 50 Finnish companies (see e.g. Hannula & Pirttimäki 2003, Hannula & Pirttimäki 2005, Pirttimäki 2006, Tyrväinen 2013). These stud-ies have argued and predicted that the activ-ity of Business Intelligence will be growing (Pirttimäki 2006), and while the biggest en-terprises have already implemented their BI systems, SME companies will probably follow. This growing trend has already been partly re-alised according to these earlier longitudinal studies on Finnish enterprises. Our study will contribute to that by adding understanding on business intelligence in the next wave of the diffusion of business intelligence in Finn-ish enterprises. Particularly our study contrib-utes to the studies on the state of business in-telligence in decision making (see e.g. Hershel 2011 and Wright & Calof 2006).
Granlund (2011) argues that there is still a surprisingly limited understanding of the everyday life of financial professionals and how they use IT systems (including BI systems) in their work. For example, research seems to be neglecting the fact that more than half of their working time may be used to tasks re-
lating to the implementation and selection of the software and training other employees to use it (ibid.).
Davenport (2010) found that, while in most organisations managers recognised the importance of decision making, they had not any explicit plans in place to develop it. Also, organisations rarely focus on whether or not the information generated by BI systems is actually being used in decision making. While the mainstream of BI research focuses on viewing BI as a rational tool, Shollo (2013) shows how it is not only such but can be uti-lised in a variety of ways in order to support the decision maker’s own goals.
Pirttimäki (2006) has conducted a survey study among top 50 Finnish enterprises. She has focused to the questions how BI is in re-lation to managerial activities, how BI can be measured and what is the state of Business Intelligence in large Finnish companies. The survey study presents that 95% of top Finnish enterprises are using BI systems. Respondents were satisfied particularly to the quality of the data of BI systems. Respondents also perceived that BI was particularly useful in dissemina-tion of information and level of awareness as well that measuring the BI is important to show the role and the process of BI.
In this study we seek to enhance the under-standing of how business intelligence systems are being implemented and used in today’s contemporary organisations. The research aims to explore how extensively and why are business intelligence systems implemented and used in decision making in Finnish or-ganisations. Research questions including “how” and “why” are often better addressed with a more qualitative research approach (Yin 2014, 9). However, we would like to high-light that this particular study is descriptive and explorative in nature as it intends to dis-cover the broader trends observable in the im-plementation and use of BI systems. While a survey cannot answer these “how” and “why” questions too definitely, it should be able to

26
NJB Vol. 65 , No.2 (Summer 2016)
provide at least some preliminary results to these questions. Additionally, the results can be used as a guideline where to direct a more qualitative and in-depth analysis, e.g. a case study, considering the same questions. These notions strongly emphasize the explorative nature of the study.
The results of our study indicate that ra-tional reasons dominate the reasons for using BI, and organizations are perceiving benefits from utilizing their BI processes. Individuals making more frequent use of BI perceived also stronger benefits for them and better usability of the BI system seemed to have an effect on the perceived benefits and while the technologi-cal factors are of importance, organisational factors such as top management support and organisational culture have potentially even larger effect on the benefits that the or-ganisation perceives. Our study also results that a wide variety of different data types and sources are used and while some are still rely-ing on spreadsheet-applications, other – more specialized and advanced – analysis and visu-alization BI tools are widely adopted and used in Finland. This study has been structured as follows. In this section we have indicated the motivation for our research question. The following section discusses the preliminary research in Business Intelligence in organi-zational context. Section three describes our research methods following research findings in chapter four. Finally, we discuss on our findings in conclusion chapter five.
2. Business intelligence
2.1. The definition of Business Intelligence
Elbashir et. al (2008) defines business intel-ligence (BI) as systems to “provide the ability to analyse business information in order to support and improve management decision making across a broad range of business activities”. (see also Chaudhuri et al. (2011; Popovič et al. 2012). Pirttimäki defines BI as a
management philosophy (p.2 ) following the definition presented by Gilad & Gilad (1986) who summarize the key tasks of BI: 1) to col-lect raw data, 2) to evaluate the validity and re-liability of data and information, 3) to analyze data and information, 4) to store information, and 5) to share the information processed with decision makers.
Côrte-Real et al. (2014) defines BI as a “techniques, technologies, systems, practices, methodologies, and applications that analyze critical business data to help an enterprise better understand its business and market and make timely business decisions”. Pirt-timäki (2006) see BI tools as a technology that enables and are used to help managing the business information and to make business decisions, both at operative and strategic level decisions (see also Gilad & Gilad, 1996).
According to literature, there seems to be two main approaches to define business intel-ligence. One view emphasizes technologic ap-proach. However, it’s noteworthy that while this definition doesn’t explicitly state enhanc-ing organisational performance to be the goal of BI systems, it is in fact implicitly assumed that by making data available BI systems as-sist in making better decisions and increase organisational performance. The other ap-proaches view BI as a process where technol-ogy plays smaller, supportive role and more weight is put on the process of transforming data in to information and knowledge in an organisation. Olszak & Ziemba (2012) state that: “From the business (organizational) per-spective, BI systems mean specific philosophy and methodology that refer to working with information and knowledge, open commu-nication and knowledge sharing along with the holistic and analytic approach to business processes in organizations” (Olszak & Ziemba 2012, 132). We can summarize that the major purpose of business intelligence is to enhance organisational performance through better decision making.
The explicit statement of improving or-
Erno Nykänen, Marko Järvenpää & Henri Teittinen

27
NJB Vol. 65 , No.2 (Summer 2016)
ganisational performance as an objective of the BI system is omitted but the underlying assumption is clear: by utilising informa-tion and knowledge and taking analytical approach to business problems will lead to better organisational performance as Wixom & Watson (2010) define Business Intelligence: “a broad category of the technologies, appli-cations, and processes for gathering, storing, accessing and analysing data to help its users make better decisions”.
In order to understand business intel-ligence better in decision making, a more in-depth and detailed depiction is required to better grasp the nature of BI (see for exam-ple Herschel 2010; Granlund 2011; Pirttimäki 2006; and Shollo 2013).
Our study will follow the study of Pirt-timäki (2006) exploring the role of BI in managerial tasks, and also identifying the performance of Business Intelligence, and utilization of BI in Finnish enterprises. How-ever, our study will focus also on smaller sized companies and more over to the usage and maturity level in organizations by building on the recent studies like Elbashir (2008); Yeoh & Koronios (2010); Isik et al. (2011); LaValle et al. (2011) and Shollo (2013) and Pirttimäki (2006).
2.2. Rationales for Adopting Business Intelligence
The underlying reason to implement busi-ness intelligence in an organisation is to en-hance organisational performance. Wixom & Watson (2010) identified three possible targets when implementing BI. Firstly, it can be implemented to tackle small, well defined problems. Secondly an organisation may aim at utilising organisation-wide BI infrastruc-ture and use an all-encompassing approach to collecting and analysing the data from all over the organisation. Thirdly, as a broadest goal, the purpose is to implement BI to assist in organisational transformation where busi-ness models are restructured and analysed us-
ing business intelligence. When strategies are revized, partial analysis of the organisation’s operations and environment will result in a strategy that only takes into account a part of the relevant factors affecting its operations. The target of the organisation thus dictates the technologies, processes and scope of the BI implementation.
Comparing BI rationales affecting to the diffusion of activity-based costing in Finland, Malmi (1999) has explored and divided the ra-tionales in to three categories: efficientchoice, forced selection and fashion & fad. Malmi found that efficient choice was the strongest explanation in the early stages of diffusion and the organisations adopting the new sys-tem and gaining benefits from it are the driver for the diffusion at this point. At the later stages of the diffusion both efficient choice and fashion perspective became significant rationales for adoption. The diffusion was also partly driven by consultant agencies. (Malmi 1999).
Once BI system has been implemented, it may be beneficial also to estimate how the system could be further developed. Maturity models build on the idea that the systems grow and develop systematically over time. They can thus be used as a tool to assess the stage of the BI system in the organisation and act as a rough guideline as to in what direc-tion it could be improved (see for example Rajterič 2010).
Current literature acknowledges a range of different business intelligence maturity models (cf. Brooks et al. 2015). Eckerson’s (2004) model identifies six stages in maturity development process. The model has since been further developed including also busi-ness intelligence aspect by the stages: Non-ex-istent, Preliminary, Repeatable, Managed and Optimized. The full maturity model assesses the BI system for 8 aspects or categories that are scope, sponsorship, funding, value, archi-tecture, data, development and delivery.
Maturity frameworks will give some in-
Business intelligence in decision making

28
NJB Vol. 65 , No.2 (Summer 2016)
sights how mature organisation’s BI system is. In this study we particularly focused on the scope of BI in the organizations. The scope how BI is used in organizations is examined from three different perspectives: dispersion, pervasiveness and strategic orientation. Dis-persion measures, how wide the BI activities are spread into organization; pervasiveness, how extensively they are used; and the last one, if BI supports strategic orientation. From managerial perspective it is very justifiable to identify the factors that one should focus on when selecting and implementing new soft-ware.
2.3. Type of data in Business IntelligenceData is the core element of business intelli-gence, yet current BI literature is not united regarding the terms data, information and knowledge. Data is objective facts with-out meanings, information adds meaning through e.g. contextualisation or categorisa-tion and finally knowledge is created when humans gain insight that is not readily avail-able as information (see for example Daven-port & Prusak, 1998).
The sources of data can be divided to ex-ternal and internal categories and the type of data can be distinct to structured, semi-struc-tured or unstructured data. Internal data re-lates to data inside the organisation e.g. ERP databases. As for external data, it’s sourced from outside the organisation, e.g. customer relationship management (CRM) systems.
Structured data is essentially everything that is easy to store in relational databases’ rows and columns whereas unstructured and semi-structured data need more appropri-ate ways for analysis (Baars & Kemper 2008). While the utilisation of structured data is today quite well managed in the regard that it is accurate and timely, the same cannot be said about semi-structured data. Even though semi-structured data is recognised as an im-portant asset for the company, its employ-ment faces technical difficulties as it is not as
straightforward procedure to apply analytics on semi-structured data as it is for structured data (Baars & Kemper 2008). Despite the in-ability to incorporate semi-structured data in to organisations information systems, it is in fact becoming increasingly important for many organisations.
LaValle et al. (2011) found in their survey that “strategic information has started arriv-ing through unstructured digital channels: social media, smart phone applications and an ever-increasing stream of emerging inter-net-based gadgets”. Thus the sources and types of data organisations utilise in their business intelligence systems is an important factor to consider when evaluating how organisations have adopted BI solutions. In addition, it is interesting to investigate what parts of the BI process and what technologies organisations utilise today and for what purposes have they implemented business intelligence.
We can summarize that the variety and amount of data available in today’s organisa-tions is rapidly increasing and the organisa-tions need to be able to identify the most im-portant pieces of information and know how to use them. Thus we are exploring, what kind of data is included and managed in Business Intelligence systems and processes in contem-porary organizations.
2.4. Business Intelligence in Decision Making
Decision making in organisations is often viewed from the perspective of rational choice theory where different options are evaluated based on the available information and the best option is chosen as a result of this eval-uation (Shollo 2013, 48). Business intelligence systems seem to suit well to support this kind of decision making as they provide more ac-curate, relevant and up to date information to the decision makers.
Davenport (2010) brings forth the im-portance of explicitly recognising how in-formation iscoupled with decision making.
Erno Nykänen, Marko Järvenpää & Henri Teittinen

29
NJB Vol. 65 , No.2 (Summer 2016)
According to the mainstream BI research, organisations often consider decision making as a rational process and assume that if infor-mation is available it is being used.
Typically information comes from various sources, combined to serve a specific area of business. Automated decisions provide the tightest coupling between information and decision making as in this case decisions are made entirely based on the information. This approach can be utilised when decisions are made in an automated fashion, based on cer-tain rules. Most examples seem to come from financial applications where data is very accu-rate and decisions are made within strict lim-its, for example in a credit approval system. (Davenport, 2010).
While the mainstream of BI research treats business intelligence systems as rational tools of analysis and focuses on how to optimise the process of utilising them, Shollo (2013) takes a slightly differing view by illustrating how BI output can be employed in a variety of ways in decision making. She specifies that it is the output that decision makers use in the decision making process rather than the analytical process that precedes it. Further, she describes BI output as a “device” in order to communicate its ability to submit itself to various purposes of its use.
Shollo (2013) has in addition identified four tactics for the use of the BI output, be-sides its solely informative and rational one. Supplementation became an alternative use when the output alone wasn’t enough to per-suade other decision makers and additional devices had to be used to achieve consensus. BI output was also sometimes substituted when it was seen as containing false information or when it was generated for political purposes. Sometimes the output was ambiguous and left room for interpreting the results conven-iently from the decision maker’s point of view. Those involved in the process of producing the BI output also had the option to reframe it by adjusting underlying assumptions and
predictions in a way that provided an output that forwarded their own agenda.
The findings above are very interesting, since they open the discussion of business intelligence systems as a more subjective and interpretative approach to decision making. In order to gain more relevance to practition-ers, research should look more deeply at how management accounting, of which analytics is becoming a big part of, should be done (Malmi & Granlund 2009). Hence it would be beneficial to understand better all the differ-ent possible purposes of use and when, how and where they are applied. Shollo (2013, 236) proposes for example that it would be fruit-ful to examine in which situation is each of the aforementioned tactics optimal and how do the different uses relate to each other. For these reasons we are in this study exploring, how Business Intelligence is actually used in organizations in decision making.
2.5. Performance of Business Intelligence
Successful technical implementation of BI is not necessarily successful from the organisa-tion’s managerial and performance perspec-tive (cf. Yeoh & Koronios. 2010). To determine whether or not a BI system is improving or-ganisational performance, one must be able to locate where it is having an impact.
Elbashir et al. (2008) set out to investigate what kind of effects BI systems have on organ-isation by studying how different business processes, e.g. marketing, affect the organisa-tional performance. By pointing at the factors that increase organisation’s process and over-all performance, they highlight the areas that a BI system should enhance in order to have a positive impact on the organisational perfor-mance. They divided the measures affecting business process performance, and conse-quently organisational performance, in to three different factors all of which proved to be significant indicators of business process performance. The three factors are customer
Business intelligence in decision making

30
NJB Vol. 65 , No.2 (Summer 2016)
intelligence, supplier relations and internal efficiency. Customer intelligence refers to knowing the customer’s habits and being able to predict their behaviour, thus enabling proactive decision making. Supplier relations affect process performance by enhancing coordination and possibly integration with suppliers, resulting in better effectiveness and lower transaction costs with suppliers. Internal efficiency relates to the processes within the organisation, e.g. decision making and manufacturing. They found all the three factors positively correlating with business process performance which in turn correlated positively with organisational performance. Their main finding is that if one wishes to achieve better organisational performance through an implementation of a BI system, one has to analyse the organisational pro-cesses and carefully design the system to sup-port them. Elbashir et al. (2008).
Yeoh & Koronios (2010) have explored factors that contribute to the success of a busi-ness intelligence system. Based on the results they created a framework with organisational, process related and technological factors that contributed to the success of the system. In order to achieve success in implementing a BI system, one must thoroughly assess how the system will and how it should affect the or-ganisation and the processes within. Techno-logical aspects are important as well but they should only be focused on after the business impacts are investigated. In their case studies they found that organisations that first and foremost focused on the technical issues, tended neglect the business perspective and this led to worse implementation results and even to a complete failure to implement the system.
Lönnqvist & Pirttimäki (2006) propose that the value comes from how the user of the BI system (e.g. mid-tier-manager) per-ceives the benefits gained from the usage. The system might produce the most accurate, re-al-time data in flashy dashboard format but if
the manager is not able to reap any additional benefits from this compared to the legacy sys-tem that was in use previously, it is arguable whether BI has any value at all.
For evaluating how the BI process is per-forming, it should be taken into account per-spectives of gathering and storing data, ana-lysing information and using the knowledge acquired when it comes down to decision making. In this study we aim to take this bal-anced approach when surveying the respond-ents and include different aspects of the BI system in the questionnaire.
3. Research methodThis study aims to describe the current state of BI in Finland, exploring the organisational orientation towards business intelligence and how it is used. This was done by focusing to the issues: what have been the reasons to use and utilize Business Intelligence; what kind of data are used and managed in Business Intel-ligence; how Business Intelligence are used in decision making; and how users perceive the success of Business Intelligence.
The aim of this research is similar to Kohn & Hüsig (2006) who have analysed the current state of software adoptions and bar-riers in German companies. They conducted explorative field study on software adoption in German companies, and despite of the low response rate (n=33; see also Pirttimäki (2006) n=46), they explored first impression of the state of developments including business intelligence and project planning and man-agement software. They also argue that future studies should be focused on cultural and in-stitutional factors in adoption of softwares as well as to clarify the national differences.
A survey is unlikely to be able to give a sufficiently deep understanding of the usage of BI and the types of effects it is having on an organisation in order to establish its value or impact. However, by using survey method, we are able to shed some explorative light to the matter and reaffirming previous research
Erno Nykänen, Marko Järvenpää & Henri Teittinen
31
NJB Vol. 65 , No.2 (Summer 2016)
results or hinting at new directions. For that purpose an explorative survey method was chosen as it provides a suitable tool for such descriptive and explorative approach (see also Hansen and Van der Stede 2004; and Davila 2005).
A careful consideration was undertaken when constructing the survey form, aiming to ensure sufficient validity and reliability for the study. The survey form consisted of four sections. Background information provides information on the roles and titles of respond-ents in their respective organisations as well as the turnover and number of employees em-ployed in the organisations. Organisational BI orientation consists of questions related to the drivers and inhibitors behind BI usage. These questions are able to provide some insights into the rationales for using or not using BI; the types of data and different tools conducting business intelligence activities; “how” organisations use their business intel-ligence and for what purposes; how the top management views BI and benefits whether or not BI reduced costs, increased revenues, improved coordination with suppliers or customer and if it supports the business pro-cesses. Personal BI orientation questions were focused on respondents’ daily activities by BI. In the last section of the survey the utilisation of BI in decision making context was under scrutiny. Uses of BI tackled the questions of multiple uses of BI whether or not BI was used in strategic and operations-specific context and whether or not BI improved the speed or quality of the decision making.
The survey was carried out as an internet survey where the 2180 respondents received an invitation to take part in the survey via e-mail wherein a link to the survey was pro-vided. The initial invitation was sent on 12th of February 2015 and followed by two reminders.
The recipients of the survey invitation were executives and high-level managers in large enterprises whose turnover were over two million euros and employed over 200 people.
Respondents were from different functions of the enterprise, including top management, finance and IT. Enterprises spanned over sev-eral different industries ranging from manu-facturing to financial and insurance services. As a quantitative study, a comprehensive sam-ple would have been preferred (>100 observa-tions) in order to be able to conduct statistical analyses of the data. However, as is often the case with internet surveys, the response rate remained low (~2 %) and resulted in only 41 observations (n=41). Important aspect to con-sider is that while the statistics may indicate significances, they need to be considered as initial results at best. Still, with 19 content related questions, of which some were mul-tiple- and other single-choice-questions, this resulted in approximately 3000 data points which does provide some tools for reaching the explorative oriented research objectives.
In explorative spirit, the most basic method used for analysing the survey data is describing the frequency distributions of responses in figures and tables. Especially when handling relatively small samples, the frequency distributions present the data more suitably. Also, as the survey constituted mainly of nominal and ordinal measures, arithmetic mean and standard deviation are not the best choices for describing such data. Still, they are provided where deemed fitting. Thus, the explorative analysis of this survey’s data relies mainly providing frequency distri-bution descriptions and interpreting them.
4. Findings
4.1. Rationales for adopting, using and utilizing BI
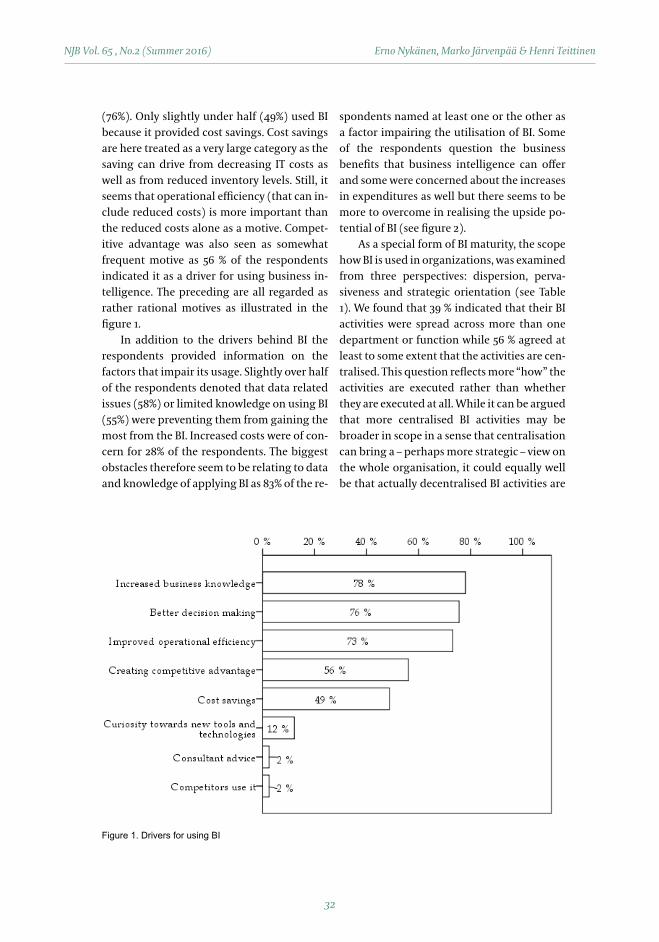
Our survey focused firstly on exploring drivers and inhibitors towards business intelligence in Finnish organizations. Our survey resulted that rationales for using business intelligence were mostly argued by the increased busi-ness knowledge (78%), improved operational efficiency (73%) and better decision making
Business intelligence in decision making
32
NJB Vol. 65 , No.2 (Summer 2016)
(76%). Only slightly under half (49%) used BI because it provided cost savings. Cost savings are here treated as a very large category as the saving can drive from decreasing IT costs as well as from reduced inventory levels. Still, it seems that operational efficiency (that can in-clude reduced costs) is more important than the reduced costs alone as a motive. Compet-itive advantage was also seen as somewhat frequent motive as 56 % of the respondents indicated it as a driver for using business in-telligence. The preceding are all regarded as rather rational motives as illustrated in the figure 1.
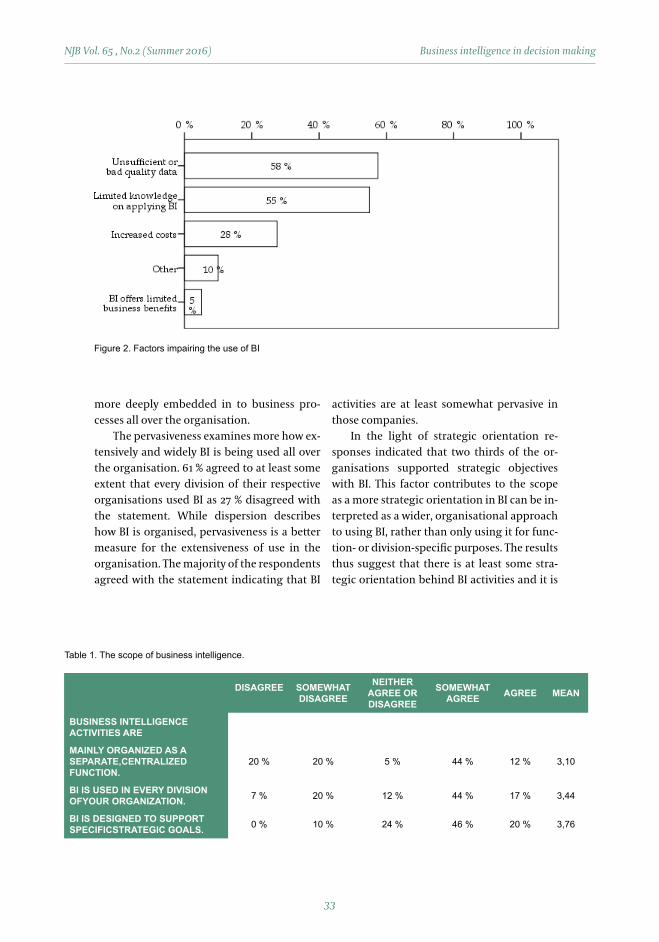
In addition to the drivers behind BI the respondents provided information on the factors that impair its usage. Slightly over half of the respondents denoted that data related issues (58%) or limited knowledge on using BI (55%) were preventing them from gaining the most from the BI. Increased costs were of con-cern for 28% of the respondents. The biggest obstacles therefore seem to be relating to data and knowledge of applying BI as 83% of the re-
Figure 1. Drivers for using BI
spondents named at least one or the other as a factor impairing the utilisation of BI. Some of the respondents question the business benefits that business intelligence can offer and some were concerned about the increases in expenditures as well but there seems to be more to overcome in realising the upside po-tential of BI (see figure 2).
As a special form of BI maturity, the scope how BI is used in organizations, was examined from three perspectives: dispersion, perva-siveness and strategic orientation (see Table 1). We found that 39 % indicated that their BI activities were spread across more than one department or function while 56 % agreed at least to some extent that the activities are cen-tralised. This question reflects more “how” the activities are executed rather than whether they are executed at all. While it can be argued that more centralised BI activities may be broader in scope in a sense that centralisation can bring a – perhaps more strategic – view on the whole organisation, it could equally well be that actually decentralised BI activities are
19
Figure 1. Drivers for using BI
In addition to the drivers behind BI the respondents provided information on the factors
that impair its usage. Slightly over half of the respondents denoted that data related issues
(58%) or limited knowledge on using BI (55%) were preventing them from gaining the
most from the BI. Increased costs were of concern for 28% of the respondents. The biggest
obstacles therefore seem to be relating to data and knowledge of applying BI as 83% of the
respondents named at least one or the other as a factor impairing the utilisation of BI.
Some of the respondents question the business benefits that business intelligence can offer
and some were concerned about the increases in expenditures as well but there seems to
be more to overcome in realising the upside potential of BI (see figure 2).
Erno Nykänen, Marko Järvenpää & Henri Teittinen
33
NJB Vol. 65 , No.2 (Summer 2016)
Figure 2. Factors impairing the use of BI
more deeply embedded in to business pro-cesses all over the organisation.
The pervasiveness examines more how ex-tensively and widely BI is being used all over the organisation. 61 % agreed to at least some extent that every division of their respective organisations used BI as 27 % disagreed with the statement. While dispersion describes how BI is organised, pervasiveness is a better measure for the extensiveness of use in the organisation. The majority of the respondents agreed with the statement indicating that BI
DISAGREE SOMEWHATDISAGREE
NEITHER AGREE OR DISAGREE
SOMEWHATAGREE AGREE MEAN
BUSINESS INTELLIGENCE ACTIVITIES ARE
MAINLY ORGANIZED AS A SEPARATE,CENTRALIZED FUNCTION.
20 % 20 % 5 % 44 % 12 % 3,10
BI IS USED IN EVERY DIVISION OFYOUR ORGANIZATION. 7 % 20 % 12 % 44 % 17 % 3,44
BI IS DESIGNED TO SUPPORT SPECIFICSTRATEGIC GOALS. 0 % 10 % 24 % 46 % 20 % 3,76
20
Figure 2. Factors impairing the use of BI
As a special form of BI maturity, the scope how BI is used in organizations, was examined
from three perspectives: dispersion, pervasiveness and strategic orientation (see Table 1).
We found that 39 % indicated that their BI activities were spread across more than one
department or function while 56 % agreed at least to some extent that the activities are
centralised. This question reflects more “how” the activities are executed rather than
whether they are executed at all. While it can be argued that more centralised BI activities
may be broader in scope in a sense that centralisation can bring a – perhaps more strategic
– view on the whole organisation, it could equally well be that actually decentralised BI
activities are more deeply embedded in to business processes all over the organisation.
Table 1. The scope of business intelligence.
activities are at least somewhat pervasive in those companies.
In the light of strategic orientation re-sponses indicated that two thirds of the or-ganisations supported strategic objectives with BI. This factor contributes to the scope as a more strategic orientation in BI can be in-terpreted as a wider, organisational approach to using BI, rather than only using it for func-tion- or division-specific purposes. The results thus suggest that there is at least some stra-tegic orientation behind BI activities and it is
Business intelligence in decision making

34
NJB Vol. 65 , No.2 (Summer 2016)
not solely implemented for operational and ad hoc purposes.
We also found that in 83% of the organisa-tions BI was considered as a high priority by top management and a strategic asset for 59% of the organisations (see the Table 2). These two factors were also markedly correlated (correlation coefficient 0,673, p=0,001) and they can be interpreted as presenting overall organisational importance of BI. A sum factor including the preceding two items (Cron-bach’s alpha=0,795) has a statistically signif-icant positive correlation coefficient (Spear-man’s rho=0,580, p=0,001) with perceived organisational benefits, indicating that, as suggested by literature before, organisational importance is closely related to the benefits that the BI system offers.
Organisational culture is something that is undeniably very hard to measure and in this survey the focus was solely on how fact-based decision-making and culture is promoted by the leaders of the organisation. The mean for this factor (measured by two items in the sur-vey, Cronbach’s alpha=0,759) was 3,94 as 85% of the organisations scored over 3 on the scale from one to five. This seems to signal that fact-
Table 2. The role of BI in organizational decision making processes.
DISAGREE SOMEWHATDISAGREE
NEITHER AGREE OR DISAGREE
SOMEWHATAGREE AGREE MEAN
MAINLY ORGANIZED AS A SEPARATE,CENTRALIZED FUNCTION.
2 % 5 % 10 % 56 % 27 % 4,00
BI IS REGARDED AS A STRATEGIC ASSETIN YOUR ORGANIZATION.
2 % 10 % 29 % 41 % 17 % 3,61
FACT-BASED DECISION MAKING AND OPERATIONAL IMPROVEMENTS AREENCOURAGED BY EXECUTIVES AND MANAGERS.
0 % 7 % 10 % 56 % 27 % 4,02
IN YOUR ORGANIZATION, FACT-BASED DECISION MAKING CULTURE IS PROMOTED.
2 % 5 % 15 % 61 % 17 % 3,85
based decision making culture is promoted in the organisations included in this survey. Like the organisational importance factor above, this cultural factor is significantly and positively correlating with the perceived ben-efits of the BI system (Spearman’s rho=0,594, p=0,001).
We also explored utilizations of different tools in BI activity in organisations. Every or-ganisation uses at least the very basic form of BI, a spreadsheet application. Specialised data visualisation tools were in use in 83% of the or-ganisations and 59% of the organisations used dedicated data analysis tools. The more ad-vanced techniques such as data mining or pre-dictive modelling were less frequently used as they were utilised in 24 % of the organizations. Only 15% of the respondents indicated that some form of machine learning or automated algorithms were in place.
It can be argued that the tools and tech-nologies themselves do not create value. It is only through the value chain of the organisa-tion that benefits are realised and BI tools and technologies are only in the supporting role in that process.
Erno Nykänen, Marko Järvenpää & Henri Teittinen
35
NJB Vol. 65 , No.2 (Summer 2016)
4.2. Types and quality of dataThe data that were utilised in organisations were mainly structured type of data. 95% of data comes from internal and 83% from ex-ternal data sources. Also semi-structured data was somewhat often used in BI activities. 51% of the respondents indicated that internal semi-structured data was in use and 63% that external semi-structured data was in use.
It should be noted however that in this par-ticular question, it was not specified whether or not the data was stored in IT systems. For example, an executive can use printed market reports for activities that do fall under the definition of business intelligence, such as reviewing market outlooks, even if that report is not integrated in to the organizations BI systems. Thus the results do not represent the ability of BI systems to use different data types but rather what types are considered useful and therefore used in BI activities.
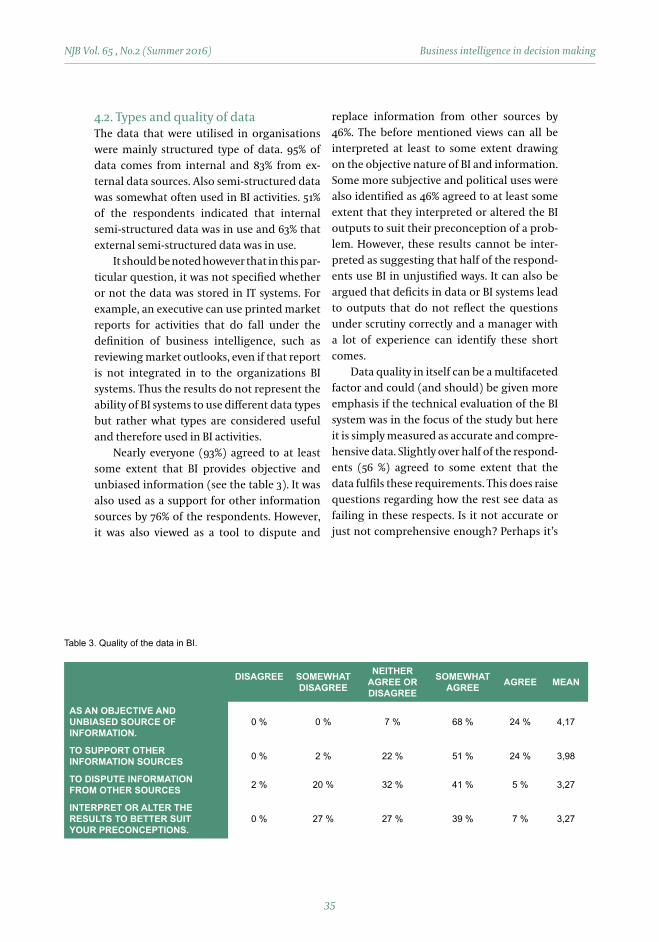
Nearly everyone (93%) agreed to at least some extent that BI provides objective and unbiased information (see the table 3). It was also used as a support for other information sources by 76% of the respondents. However, it was also viewed as a tool to dispute and
replace information from other sources by 46%. The before mentioned views can all be interpreted at least to some extent drawing on the objective nature of BI and information. Some more subjective and political uses were also identified as 46% agreed to at least some extent that they interpreted or altered the BI outputs to suit their preconception of a prob-lem. However, these results cannot be inter-preted as suggesting that half of the respond-ents use BI in unjustified ways. It can also be argued that deficits in data or BI systems lead to outputs that do not reflect the questions under scrutiny correctly and a manager with a lot of experience can identify these short comes.
Data quality in itself can be a multifaceted factor and could (and should) be given more emphasis if the technical evaluation of the BI system was in the focus of the study but here it is simply measured as accurate and compre-hensive data. Slightly over half of the respond-ents (56 %) agreed to some extent that the data fulfils these requirements. This does raise questions regarding how the rest see data as failing in these respects. Is it not accurate or just not comprehensive enough? Perhaps it’s
DISAGREE SOMEWHATDISAGREE
NEITHER AGREE OR DISAGREE
SOMEWHATAGREE AGREE MEAN
AS AN OBJECTIVE AND UNBIASED SOURCE OF INFORMATION.
0 % 0 % 7 % 68 % 24 % 4,17
TO SUPPORT OTHER INFORMATION SOURCES 0 % 2 % 22 % 51 % 24 % 3,98
TO DISPUTE INFORMATION FROM OTHER SOURCES 2 % 20 % 32 % 41 % 5 % 3,27
INTERPRET OR ALTER THE RESULTS TO BETTER SUIT YOUR PRECONCEPTIONS.
0 % 27 % 27 % 39 % 7 % 3,27
Table 3. Quality of the data in BI.
Business intelligence in decision making
36
NJB Vol. 65 , No.2 (Summer 2016)
not timely and thus irrelevant? Data are the building blocks of any BI system and therefore it could be argued that its quality should be quite high.
Our results indicate that it’s often not very easy to get the data from where it is stored to an application where it could be analysed. An-alytics professionals often use dedicated tools for this and it is likely safe to assume that top management probably does not possess these tool or skills to use them and applications in themselves are not able to do procedures sufficiently. As such, organisations’ BI systems appear to fail to provide sufficient integration with different applications and data sources.
4.3. Utilisation in decision making context
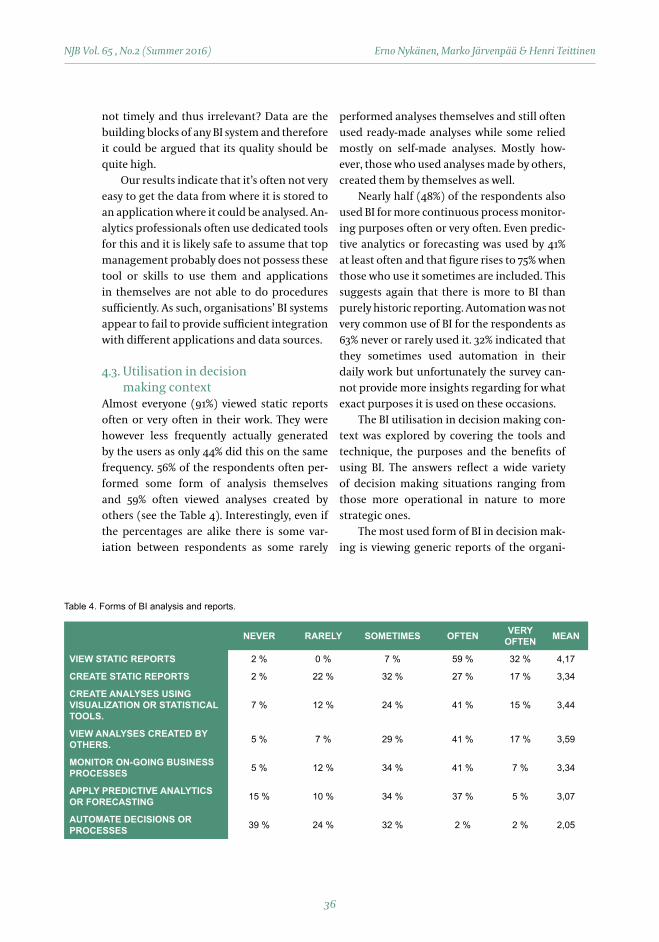
Almost everyone (91%) viewed static reports often or very often in their work. They were however less frequently actually generated by the users as only 44% did this on the same frequency. 56% of the respondents often per-formed some form of analysis themselves and 59% often viewed analyses created by others (see the Table 4). Interestingly, even if the percentages are alike there is some var-iation between respondents as some rarely
performed analyses themselves and still often used ready-made analyses while some relied mostly on self-made analyses. Mostly how-ever, those who used analyses made by others, created them by themselves as well.
Nearly half (48%) of the respondents also used BI for more continuous process monitor-ing purposes often or very often. Even predic-tive analytics or forecasting was used by 41% at least often and that figure rises to 75% when those who use it sometimes are included. This suggests again that there is more to BI than purely historic reporting. Automation was not very common use of BI for the respondents as 63% never or rarely used it. 32% indicated that they sometimes used automation in their daily work but unfortunately the survey can-not provide more insights regarding for what exact purposes it is used on these occasions.
The BI utilisation in decision making con-text was explored by covering the tools and technique, the purposes and the benefits of using BI. The answers reflect a wide variety of decision making situations ranging from those more operational in nature to more strategic ones.
The most used form of BI in decision mak-ing is viewing generic reports of the organi-
NEVER RARELY SOMETIMES OFTEN VERY OFTEN MEAN
VIEW STATIC REPORTS 2 % 0 % 7 % 59 % 32 % 4,17
CREATE STATIC REPORTS 2 % 22 % 32 % 27 % 17 % 3,34
CREATE ANALYSES USING VISUALIZATION OR STATISTICAL TOOLS.
7 % 12 % 24 % 41 % 15 % 3,44
VIEW ANALYSES CREATED BY OTHERS. 5 % 7 % 29 % 41 % 17 % 3,59
MONITOR ON-GOING BUSINESSPROCESSES 5 % 12 % 34 % 41 % 7 % 3,34
APPLY PREDICTIVE ANALYTICS OR FORECASTING 15 % 10 % 34 % 37 % 5 % 3,07
AUTOMATE DECISIONS OR PROCESSES 39 % 24 % 32 % 2 % 2 % 2,05
Table 4. Forms of BI analysis and reports.
Erno Nykänen, Marko Järvenpää & Henri Teittinen

37
NJB Vol. 65 , No.2 (Summer 2016)
sations operations as 85% of the respondents this type of BI often or very often and only two indicated that they never or only rarely used BI in decision making (see the table 5). This type of reporting consists usually of items such as last month’s sales or annual profit develop-ment. Also quite frequently used are custom-ized reports or analyses designed to support decision making as 59% indicated that they use this type of reporting often or very often and further 39% used them at least sometimes. Slightly smaller number of the respondents indicated that they were themselves creating analyses to answer emerging needs, 44% often or very often and 32% at least sometimes. Least often used was automation by algorithm or rules as 56% never or rarely used this type of BI and only 10% indicated that they were using it often or very often.
The results suggest that for the most part, BI outputs support decision making by a wide variety of generic reports and analyses. Half of the respondents also utilise the more customised and tailored analyses that are sometimes produced by the decision-maker him- or herself. This suggests a slightly tighter coupling between BI and decision making for that half of the respondents but the tightest form of coupling, automation, remains quite infrequent.
Table 5. Forms of BI used in decision making
NEVER RARELY SOMETIMES OFTEN VERY OFTEN MEAN
USE READILY AVAILABLE GENERIC PURPOSE REPORTS. 2 % 2 % 10 % 56 % 29 % 4,07
USE REPORTS THAT ARE CREATED WITH A SPECIAL PURPOSE IN MIND.
2 % 0 % 39 % 41 % 17 % 3,71
CREATE ANALYSES YOURSELF TO ANSWER EMERGING PROBLEMS.
7 % 17 % 32 % 34 % 10 % 3,22
USE AUTOMATION OR ALGORITHMS 37 % 20 % 34 % 7 % 2 % 2,20
4.4. Performance of Business Intelligence
The benefits of the BI system can be difficult to measure as pointed out by Lönnqvist & Pirt-timäki (2006). The respondents were asked for estimates on whether or not BI a) reduces costs b) increases revenues c) improves coor-dination with suppliers d) improves coordi-nation with customers or e) supports business processes. The responses are summarised be-low in Table 6.
All of the benefits scored over three on the scale from one to five, indicating that BI is per-ceived somewhat beneficial on average. The strongest benefit appeared to be coordination with customer (mean=3,88) which suggests that BI offers information and insights about customers that would not be available in the absence of the BI system. Cost reductions were second-most named benefit of the BI system with a mean of 3,66. This result is somewhat more difficult to interpret as BI can poten-tially reduce costs by a number of different ways, including everything from reduced soft-ware licencing costs to improved operating efficiency. Overall, all the benefits indicates that BI systems are beneficial with a mean of 3,57 on the scale from 1 to 5. This sum factor is used below in the evaluations of scope’s and top management support’s correlations with the overall benefits of the BI system.
Business intelligence in decision making

38
NJB Vol. 65 , No.2 (Summer 2016)
DISAGREE SOMEWHATDISAGREE
NEITHER AGREE OR DISAGREE
SOMEWHATAGREE AGREE MEAN
BI REDUCES COSTS 0 % 12 % 24 % 49 % 15 % 3,66
BI INCREASES REVENUES 0 % 12 % 34 % 39 % 15 % 3,56
BI IMPROVES COORDINATIONWITH SUPPLIERS 7 % 15 % 34 % 37 % 7 % 3,22
BI IMPROVES COORDINATIONWITH CUSTOMERS 2 % 2 % 20 % 56 % 20 % 3,88
BI SUPPORTS BUSINESSPROCESSES 0 % 15 % 29 % 46 % 10 % 3,51
Table 6. Perceived benefits of the BI system for the organisation
Respondents were also asked to evaluate the overall value of their BI system for their daily work (not limiting to decision making). Answers are outlined in Table 7 below.
Of the respondents, 78% agreed at least to some extent that BI improved the speed of their decision making and 93% said the same about improving the quality of decision mak-ing. These are quite high figures and suggest that business intelligence is able to provide significant improvements to the decision making process. Interestingly, “only” 78% con-sidered BI valuable for their daily work over-all. Perhaps the improved quality of decision making alone is not sufficient for BI to be val-uable overall or the frequency of BI utilisation is so low that some of the respondents felt it
DISAGREE SOMEWHATDISAGREE
NEITHER AGREE OR DISAGREE
SOMEWHATAGREE AGREE MEAN
BI IMPROVES THE SPEED OFDECISION MAKING. 0 % 10 % 12 % 59 % 20 % 3,88
BI IMPROVES THE QUALITY OFTHE DECISIONS BY SUPPORTING THEM WITH FACTS.
0 % 0 % 7 % 46 % 46 % 4,39
OVERALL, BI IS VALUABLE FORYOUR DAILY WORK 0 % 5 % 17 % 51 % 27 % 4,00
Table 7. Benefits of the BI system from personal perspective
was not providing value on a daily basis. How-ever, in general BI is seen as valuable for the respondents as on average it was estimated to be somewhat valuable (mean=4,00).
We also found that users were not satis-fied for the user-friendliness of BI systems (see the table 8). Only 29% agreed to even some extent with the statement that BI applications are user-friendly while 32% disagreed. Users were more satisfied with BI’s ability to fulfil their information and analysis needs as 51% agreed to some extent and only 17% somewhat disagreed with this. It is interesting that while the users see data- and userfriendliness re-lated problems with BI, they still appear to be somewhat satisfied with the information they receive from it.
Erno Nykänen, Marko Järvenpää & Henri Teittinen

39
NJB Vol. 65 , No.2 (Summer 2016)
Table 8. Usability of the BI system
DISAGREE SOMEWHATDISAGREE
NEITHER AGREE OR DISAGREE
SOMEWHATAGREE AGREE MEAN
THE DATA IS OF GOOD QUALITY(ACCURATE AND COMPREHENSIVE):
0 % 17 % 27 % 49 % 7 % 3,46
THE APPLICATIONS ARE USER-FRIENDLY. 2 % 29 % 39 % 24 % 5 % 3,00
THE APPLICATIONS FULFIL YOURINFORMATION AND ANALYSIS NEEDS.
0 % 17 % 32 % 44 % 7 % 3,41
IT IS EASY TO GATHER ALL THE DATA REQUIRED FOR REPORTING OR ANALYSIS.
2 % 49 % 24 % 22 % 2 % 2,73
IT’S EASY TO SHARE THE ANALYSES AND INSIGHTS WITH OTHER USERS.
0 % 15 % 27 % 46 % 12 % 3,56
DIFFERENT SOFTWARE INTEGRATE WELL WITH EACH OTHER WHEN NEEDED.
12 % 34 % 39 % 15 % 0 % 2,56
APPLICATIONS CAN USE MANYDIFFERENT DATA SOURCES WHEN NEEDED.
15 % 20 % 17 % 34 % 15 % 3,15
5. Conclusions
5.1. DiscussionThe purpose of this study was to explore how and why are business intelligence systems implemented and used in Finnish organisa-tions. Nearly every of the organisations stated that the “efficient-choice”-rationales, as pre-sented by Malmi (1999), were the reasons for using the BI system. These included improved business knowledge, better decision making and increased operational efficiency as well as creating competitive advantage and cost savings. Only few respondents gave hints that “fashion and fad”-rationales had influenced their BI systems but as Malmi (1999) pointed out in his study, humans tend to rational-ise their choices even if their initial reasons would have been different. Previous findings by Hannula & Pirttimäki (2003) were along the same lines as the ones in this study as the most cited rationales were focused on realis-ing upside benefits of the BI system, such as
increased operational efficiency, rather than minimising the downside drawbacks, such as costs. This was also evident as the respondents indicated that the biggest challenges in real-ising benefits from the BI system came from data related issues and lack of knowledge on utilising BI. Our results support also previous findings that top management support and organisational culture have been found to af-fect BI activities (Elbashir et al. 2008; Isik et al. 2011; Olszak & Ziemba 2012; Yeoh & Koronios 2010).
Data is arguably the backbone of any business intelligence system (Baars & Kemper 2008; Bhimani & Willcocks 2014; LaValle et al. 2011). Traditionally business intelligence activities have relied mostly on internal struc-tured data in the IT systems, combined with experience and insight from the organisa-tion (Davenport 2013; Hannula & Pirttimäki 2003). Today however, the organisations are utilising a wide variety of different data types
Business intelligence in decision making

40
NJB Vol. 65 , No.2 (Summer 2016)
and sources. External structured data usage is already widespread among the surveyed com-panies and internal and external semi-struc-tured data is also being used quite exten-sively, roughly by half of the respondents. All the different types and sources of data do not necessarily need to be incorporated in to or-ganisation’s IT systems as long as they are sys-temically utilised in the business intelligence processes, ensuring that organisations use all the operationally and strategically relevant data that is available. It is of course difficult if not impossible to evaluate whether or not the data potential is exhausted to the point that the marginal costs exceed the benefits but the fact that a wide variety of data types and sources are used, indicates that the potential is acknowledged and acted upon in the com-panies.
The analysis of the data, or transformation in to information, is conducted in a variety of ways in the organisations. Traditional spread-sheets continue to dominate as the ubiqui-tously utilised form of analysis but dedicated data visualisation tools were also used in eight out of ten surveyed organisations and special-ised analysis tools in six out of ten. This may be due to the increasing number of different data types and sources as traditional analysis methods provided by spreadsheets no longer cope with the changing requirements. These methods include data mining, predictive an-alytics and other methods that are often cou-pled with large sets of data. These findings are largely in line with previous ones by Kiron et al. (2011) where these different methods were quite similarly distributed across organisa-tions. Only few organisations indicated that some type of machine learning or automated optimisation was implemented. They present the current cutting edge technologies and require rigorous IT systems and it is thus not very surprising that their deployment is not very widespread. It should be noted how-ever that merely applying advanced tools and technologies does not create value for
the organisations as the survey did not find any significant correlation between the tools used and the benefits reaped. Information technology systems play an important but ultimately a secondary role in the value chain of an organisation by supporting the primary activities as Porter (1985) puts it. Thus they are required for creating the value but do not drive the value-creating process.
Shollo (2013) and Davenport (2010) crit-icise often assumed view that once business intelligence tools are in place, they are utilised and therefore provide benefits to the organi-sation. The survey conducted for this study focused on exploring one of the most cited uses of BI: decision making. Following Dav-enport’s framework for coupling BI with deci-sion making, a great majority of respondents utilised the loosely-coupled approach as they often relied on generic reports in supporting decision making. Still, half of the respondents also utilised BI with tighter coupling, struc-tured human decisions, by using customised analyses and reports for certain problems and even creating ones themselves but the tightest form of coupling, automated decision mak-ing, remained quite infrequent among the respondents of this study. The results suggest that the decision makers do actually utilise BI rather frequently but the question remains; how is it used?
Tyrväinen (2013) explored the functions where BI was used in organization and for which purposes BI was used (business surveil-lance, strategic planning, financial forecast-ing, budgeting, predicting the future, goal setting and personnel management). In our study we have particularly explored why BI has been implemented and how it has been implemented (reasons) and used in organiza-tions (maturity).
The ways for using BI in decision making were also explored in this study. Business intelligence was seen mostly as an unbiased information provider as nine out of ten re-spondents agreed with this view. However,
Erno Nykänen, Marko Järvenpää & Henri Teittinen
41
NJB Vol. 65 , No.2 (Summer 2016)
more political and possibly biased uses of BI also emerged as more than half of the re-spondents admitted that they interpreted or even altered the BI outputs to better confine to their views of the matter. The reasons can be multifaceted and perhaps the aforemen-tioned challenges in data quality and lack of knowledge on applying BI attribute to it as well. A more in depth study, like a case study is certainly required to further examine these perspectives.
The reasons for using BI in decision mak-ing were clear among the respondents as nearly everyone found BI improving the speed or quality of the decision making process. Eight out of ten also found BI to be valuable for their daily work overall which is to say that at least on personal level, the benefits of BI are being realised. But as promoted by Shollo (2013) and Davenport (2010), the ben-efits seem to be realised only through actually using the BI tools. Individuals making more frequent use of BI also perceived stronger benefits for them and better usability of the BI system likewise seemed to have an effect on the perceived benefits, much like Isik et al. (2011) also found in their study. This linkage between using the BI systems and perceiving the benefits from it calls for further examina-tion on how exactly are the benefits realised and why others are not using the BI systems, hence also not receiving the benefits from it.
Our results highlight the use of business intelligence systems in other organizations than in top 50 Finnish enterprises (cf. Han-nula & Pirttimäki 2003, Hannula & Pirttimäki 2005, Pirttimäki 2007, Tyrväinen 2013). Nearly every organisation in our survey indicated at least some benefits from their BI systems but the strength of these benefits varied. Benefits relating to realising the upside potential (e.g. increased revenues or improved coordination with customers) appeared to be more sub-stantial than those concentrating on minimis-ing costs. Previous studies have found several benefits derived from the BI systems (Elbashir
et al. 2008; Isik et al. 2011; LaValle et al. 2011; Yeoh & Koronios 2010). This study fell mostly in line with previous findings as organisa-tional, rather than technological, factors were found to be important for the benefits per-ceived. Organisational importance (including top management support) and culture were both found to be closely related to perceived benefits for the organisation, results akin to what has been suggested previously in the lit-erature. Even if the technological aspects did not arise as significant factors, they should not be discarded as entirely unimportant. However, the findings do further underline the importance of organisational factors of the BI system and suggest that they are more important for the overall success than the technological ones. The distinction between technological and organisational perspec-tives is however not as strict as presented above but rather they are interrelated and the nature of their relationship is not likely to be depicted in fullest of diversity in a simple sur-vey study (c.f. Granlund 2011).
Our study also highlights the evaluation and performance of the BI systems in decision making both at the organizational and indi-vidual levels. At the macro level (at the organ-izational level) the use and spread of business intelligence systems in decision making de-pends on organizations strategic orientation, whereas at the micro level (at the individual level) the use of the system depends on the end users’ evaluation how BI system can add value in decision making situations.
5.2. Limitations and future research opportunities
The validity of this study has been ensured by careful literature review, covering the most important perspectives to business intelligence. However, the small number of respondents (n=41) does result in inherent randomness and reliability issues in the data. The results do not have the explanation power they would have in a more comprehensive
Business intelligence in decision making

42
NJB Vol. 65 , No.2 (Summer 2016)
sample. In this sense, we may say that this study reminds the quantitatively oriented field study approach and provides an explor-ative state of the art of the BI usage in Finland. Doing this it provides also several further questions to be studied in the future.
This study has but scratched the surface of business intelligence in Finnish organi-sations and there remains an ample amount of research to conduct. Firstly, an in-depth examination of how and for what purposes is BI used in organisations is needed to further clarify its role in the decision making process and in organisations overall. Also, more em-phasis could be given to how controllers and other finance professionals view BI as only five respondents from finance function were included in this study. Arguably, modern finance function could benefit from BI e.g. in budgeting, forecasting and performance management and it would be interesting to examine to what extent this is the case in to-day’s organisations.
Business intelligence studies have been fo-cused into the use of BI systems. However, we argue that it is also necessary to pay attention to the BI system implementations. This is es-pecially due that in smaller size organizations there are scarce resources for development projects. This is relevant future research issue also from management accountants’ point of view, because half of their time is used work-ing with various management control systems (see. eg. Granlund, 2011)
We also explored the perceived quality of the data of BI systems. The quality of the data
was perceived to be good also in our study, but reason why the data was good for decision making was not explored. This might also be one interesting future research topic.
Business intelligence can be perceived either as a process or as a system. There are several definitions on business intelligence in prior literature and the clear definition seems to be difficult to define (see also Pirttimäki 2006). We argue that the practices in different environments and in different type of decision making situations shape our understanding how BI systems are perceived and defined. This is supported by the findings that there can be several data sources simultaneously. Sometimes we are using spreadsheets, some-times ERP systems, BI systems or some other reporting systems, for supporting decision making situations. Thus we can argue that the use and definition of business intelligence depends on a decision making situation, deci-sion type and decision-making process.
We’d like to conclude by hoping that in part, this study has forwarded the agenda of bringing research closer to practitioners (Malmi & Granlund, 2009) and that the find-ings are of relevance for larger audience than the academia alone. Business intelligence research seems to be at the advanced level in Finland, but it is important that discussion on BI issues and research methodologies will continue. Our study has shown that there is also need for more in-depth studies, and particularly in small and medium sized com-panies.
Erno Nykänen, Marko Järvenpää & Henri Teittinen
43
NJB Vol. 65 , No.2 (Summer 2016)
ReferencesBaars, H. & Kemper, H.-G. (2008). Management Support with Structured and Unstructured
Data – An Integrated Business Intelligence Framework. Information Systems Management, Vol. 25, pp. 132–148.
Bhimani, A. & Willcocks, L. (2014). Digitisation, ‘Big Data’ and the transformation of account-ing information. Accounting and Business Research. Vol. 44, pp. 469–490.
Brooks, P., El-Gayar, O. & Sarnikar, S. (2015). A framework for developing a domain specific business intelligence maturity model: Application to healthcare. International Journal of Information Management. Vol. 35, pp. 337–345.
Chaudhuri, S., Dayal, U. & Narasayya, V. (2011). An Overview of Business Intelligence Technol-ogy. Communications of the ACM. Vol. 54, pp. 88-98.
Côrte-Real, N., Ruivo, P. & Oliveira, T. (2014). The diffusion stages of business intelligence & analytics (BI&A): A systematic mapping study. Procedia Technology. Vol. 16, pp. 172–179.
Davenport, T. (2006). Competing on Analytics. Harvard Business Review. Vol. 84, pp. 98–107.Davenport, T. (2010). Business Intelligence and Organizational Decisions. International Jour-
nal of Business Intelligence Research. Vol. 1, pp. 1–12.Davenport, T. & Prusak, L. (1998). Working Knowledge: How Organizations Manage What They
Know. Harvard Business School Press.Davila, T. (2005). An exploratory study on the emergence of management control systems: for-
malizing human resources in small growing firms. Accounting, Organizations and Society. Vol. 30, pp. 223–248.
Eckerson, W. (2004). Gauge Your Data Warehouse Maturity. Referred 25.11.2014. http://www.information-management.com/issues/20041101/1012391-1.html
Elbashir, M., Collier, P. & Davern, M. (2008). Measuring the effects of business intelligence sys-tems: The relationship between business process and organizational performance. Inter-national Journal of Accounting Information Systems. Vol. 9, pp. 135–153.
Gilad B. & Gilad T. (1985). A systems Approach to Business Intelligence. Business Horizons. Vol. 28, No. 5, pp. 65-70.
Granlund, M. (2011). Extending AIS research to management accounting and control issues: A research note. International Journal of Accounting Information Systems. Vol. 12, pp. 3–9.
Hannula, M. & Pirttimäki, V. (2003). Business Intelligence Empirical Study on the Top 50 Finn-ish Companies. Journal of American Academy of Business. Vol. 2, pp. 593–601.
Hannula, M. & Pirttimäki, V. (2005). A Cube of Business Information, Journal of Competitive Intelligence and Management, Vol. 3, no. 1, pp. 34–40.
Hansen, S. C. & Van der Stede, W. A. (2004). Multiple facets of budgeting: an exploratory analy-sis. Management Accounting Research. Vol. 15, pp. 415–439.
Herschel, R. (2010). Editorial Preface. International Journal of Business Intelligence Research 1 (1), i.
Isik, O., Jones, M. & Sidorova, A. (2011). Business intelligence (BI) success and the role of BI ca-pabilities. Intelligent Systems in Accounting, Finance and Management. Vol. 18, pp. 161-176.
Kiron, D., Shockley, R., Kruschwitz, N., Finch, G. & Haydock, M. (2011). Analytics: The Widening Divide. Sloan Management Review, Research report, Fall 2011.
Kohn S. & Hüsig S. (2006). Potential benefits, current supply, utilization and barriers to adop-tion: An exploratory study on German SMEs and innovation software. Technovation. Vol. 26, pp. 988–998.
Business intelligence in decision making

44
NJB Vol. 65 , No.2 (Summer 2016)
LaValle, S., Lesser, E. , Shokley, R., Hopkins, M. & Kruschwitz, N. (2011). Big data, analytics and the path from insight to value. Sloan Management Review, Vol. 52, pp. 21–31.
Lönnqvist, A. & Pirttimäki, V. (2006). The Measurement of Business Intelligence. Information Systems Management. Vol. 23, pp. 32–40.
Malmi, T. (1999). Activity-based costing diffusion across organizations: an exploratory empir-ical analysis of Finnish firms. Accounting, Organizations and Society. Vol. 24, pp. 649–672.
Malmi, T. & Granlund, M. (2009). In search of Management Accounting Theory. European Ac-counting Review. Vol. 18, pp. 597–620.
Negash, S. (2004). Business Intelligence. Communications of the Association for Information Systems. Vol. 13, pp. 177–195.
Olszak, C. & Ziemba, E. (2012). Critical success factors for implementing business intelligence systems in small and medium enterprises on the example of upper Silesia, Poland. Interdis-ciplinary Journal of Information, Knowledge, and Management. Vol. 7, pp. 129–150.
Pirttimäki V. (2006). Business Intelligence as a Managerial Tool in Large Finnish Companies. Tampere University of Technology. Publication 646. Tampere, Finland.
Popovič, A., Hackney R., Coelho P.S. & Jaklič J. (2012). Towards business intelligence systems success: effects of maturity and culture on analytical decision making. Decision Support Systems. Vol. 54, pp. 729–739.
Porter, M. (1985). Competitive advantage: Creating and sustaining superior performance. New York: Free Press.
Rajterič, I. (2010). Overview of Business Intelligence Maturity Models. Management. Vol. 15, pp. 47–67.
Shollo, A. (2013). The Role of Business Intelligence in Organizational Decision-making. Copen-hagen Business School: Department of IT Management: PhD Series 10.
Tyrväinen T. (2013). Business Intelligence Trends in Finland in 2013. TampereUniversity of Tech-nology. Tampere. Finland.
Wixom, B & Watson, H. (2010). The BI-Based Organization. International Journal of Business Intelligence Research. Vol. 1, pp. 13–28.
Yeoh, W. & Koronios, A. (2010). Critical success factors for business intelligence systems. The Journal of Computer Information systems. Vol. 50, pp. 23–32.
Yin, R. (2014). Case Study Research: Design and Methods. Los Angeles: SAGE.
Erno Nykänen, Marko Järvenpää & Henri Teittinen