Embed Size (px)
Citation preview
<Insert Picture Here>
Business Intelligence FoundationMit Standards die Qualität steigern, Kosten senken, Sicherheit verbessern
Andreas Klein
Senior Manager Sales Consultants BI
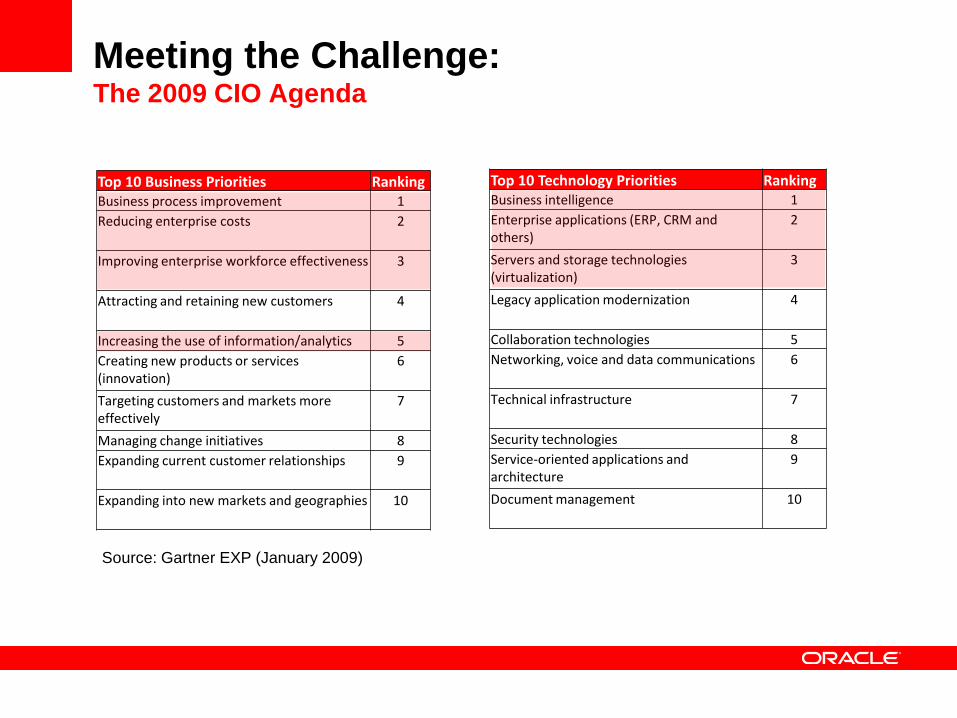
Meeting the Challenge: The 2009 CIO Agenda
Top 10 Business Priorities RankingBusiness process improvement 1
Reducing enterprise costs 2
Improving enterprise workforce effectiveness 3
Attracting and retaining new customers 4
Increasing the use of information/analytics 5
Creating new products or services (innovation)
6
Targeting customers and markets more effectively
7
Managing change initiatives 8
Expanding current customer relationships 9
Expanding into new markets and geographies 10
Top 10 Technology Priorities RankingBusiness intelligence 1
Enterprise applications (ERP, CRM and others)
2
Servers and storage technologies (virtualization)
3
Legacy application modernization 4
Collaboration technologies 5
Networking, voice and data communications 6
Technical infrastructure 7
Security technologies 8
Service-oriented applications and architecture
9
Document management 10
Source: Gartner EXP (January 2009)
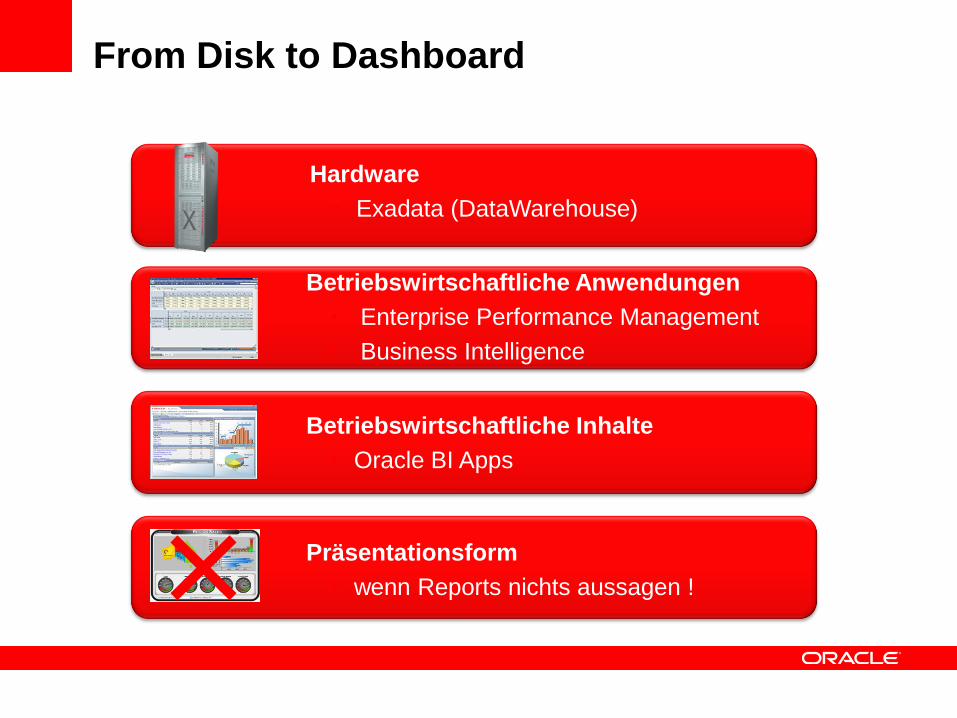
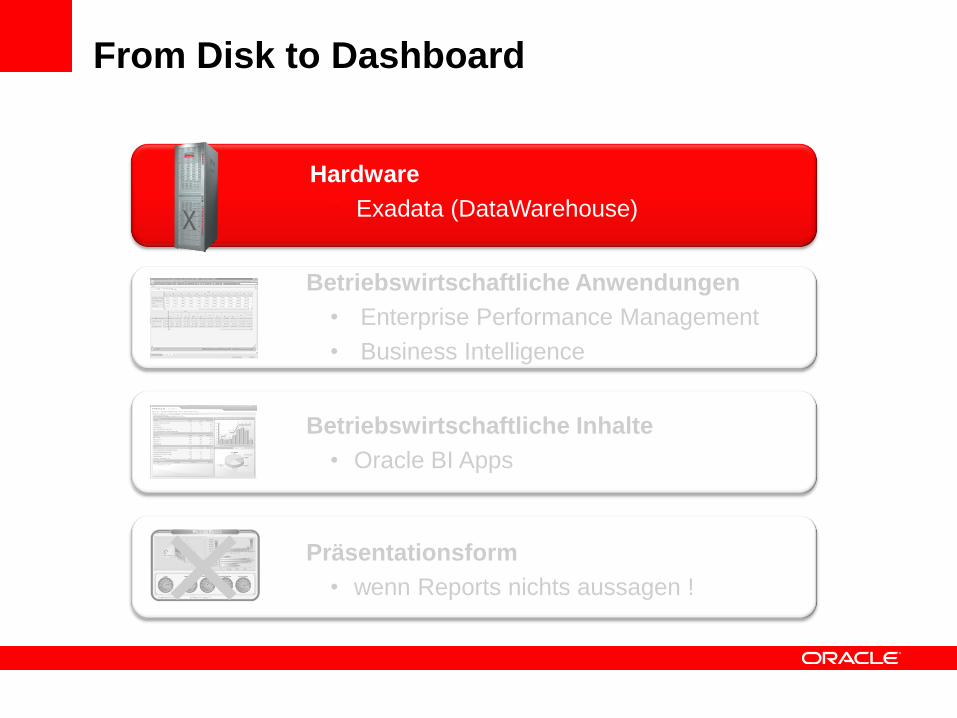
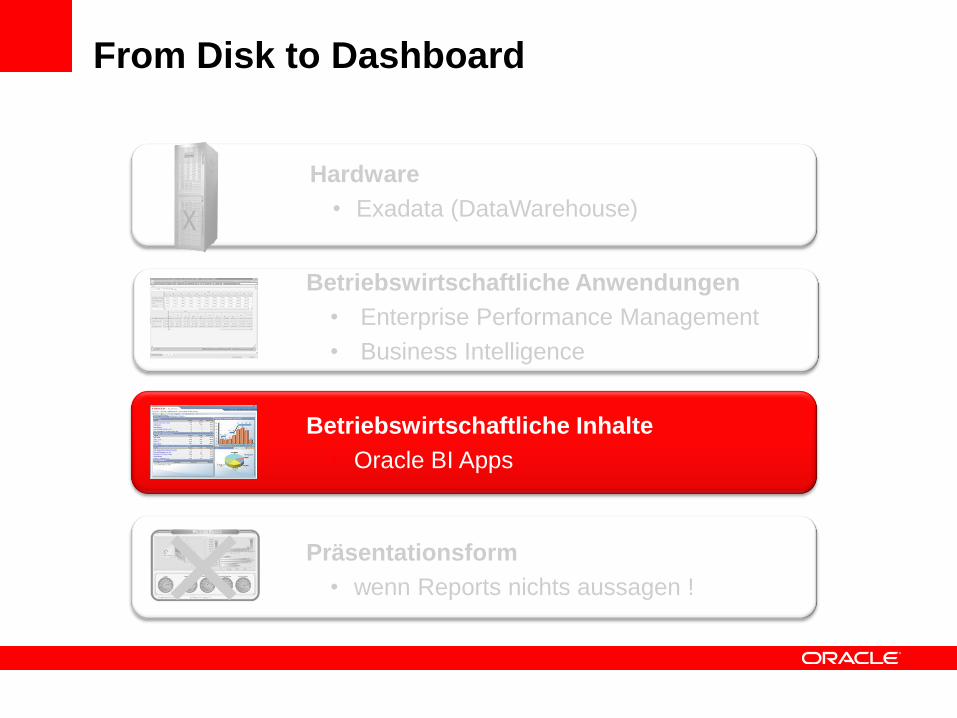
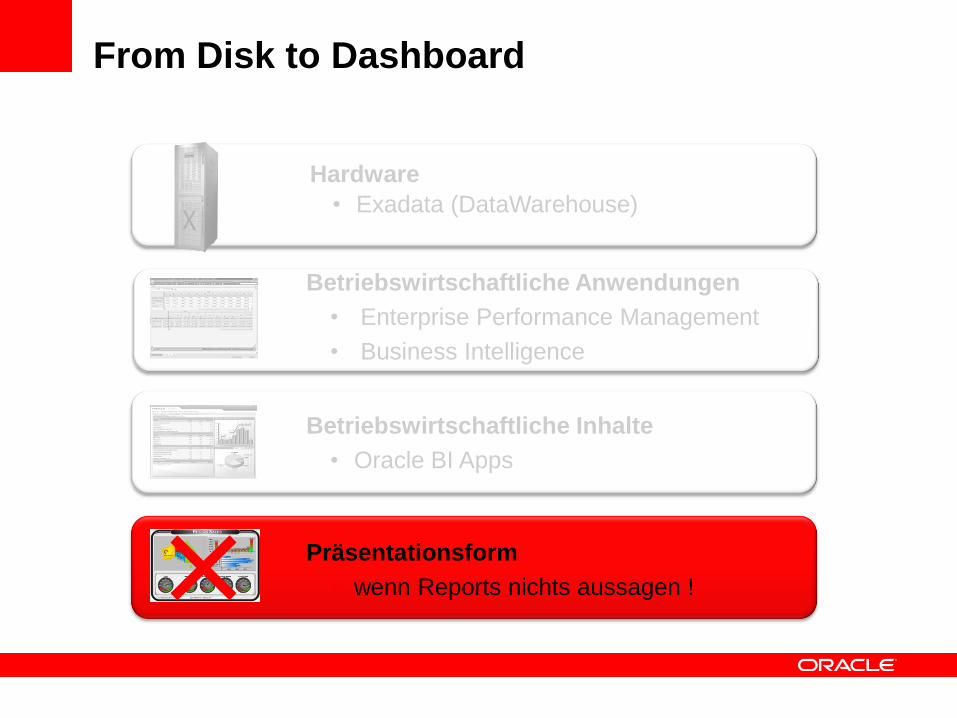
From Disk to Dashboard
Hardware
• Exadata (DataWarehouse)
Betriebswirtschaftliche Anwendungen
• Enterprise Performance Management
• Business Intelligence
Betriebswirtschaftliche Inhalte
• Oracle BI Apps
Präsentationsform
• wenn Reports nichts aussagen !
From Disk to Dashboard
Hardware
• Exadata (DataWarehouse)
Betriebswirtschaftliche Anwendungen
• Enterprise Performance Management
• Business Intelligence
Betriebswirtschaftliche Inhalte
• Oracle BI Apps
Präsentationsform
• wenn Reports nichts aussagen !
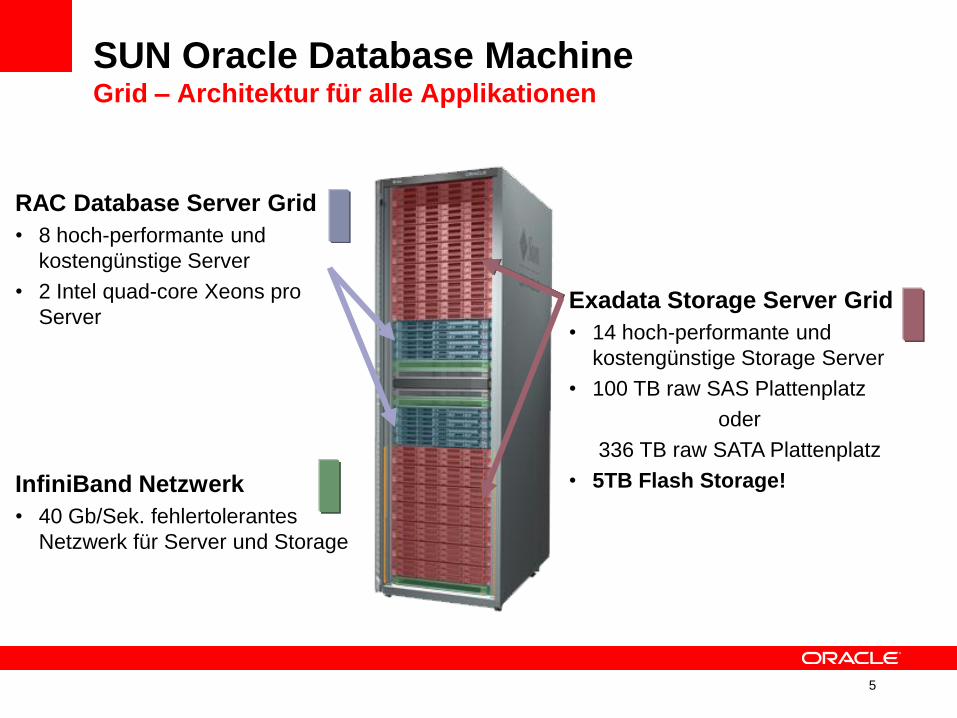
SUN Oracle Database MachineGrid – Architektur für alle Applikationen
5
Exadata Storage Server Grid
• 14 hoch-performante und
kostengünstige Storage Server
• 100 TB raw SAS Plattenplatz
oder
336 TB raw SATA Plattenplatz
• 5TB Flash Storage!
RAC Database Server Grid
• 8 hoch-performante und
kostengünstige Server
• 2 Intel quad-core Xeons pro
Server
InfiniBand Netzwerk
• 40 Gb/Sek. fehlertolerantes
Netzwerk für Server und Storage
6
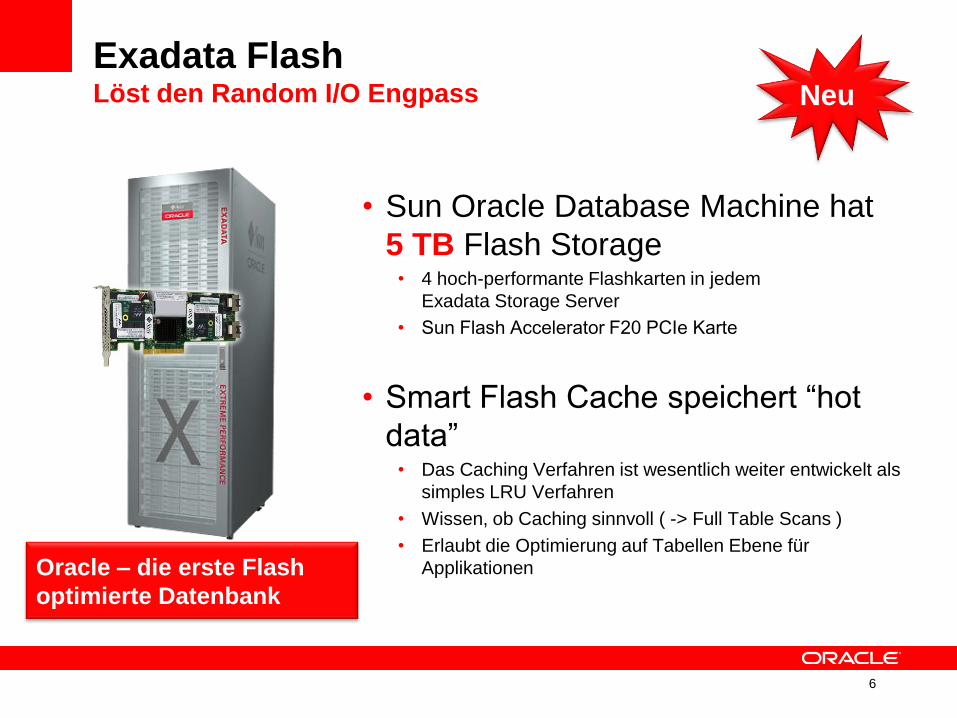
Exadata Flash Löst den Random I/O Engpass
• Sun Oracle Database Machine hat
5 TB Flash Storage• 4 hoch-performante Flashkarten in jedem
Exadata Storage Server
• Sun Flash Accelerator F20 PCIe Karte
• Smart Flash Cache speichert “hot
data”• Das Caching Verfahren ist wesentlich weiter entwickelt als
simples LRU Verfahren
• Wissen, ob Caching sinnvoll ( -> Full Table Scans )
• Erlaubt die Optimierung auf Tabellen Ebene für
ApplikationenOracle – die erste Flash
optimierte Datenbank
Neu
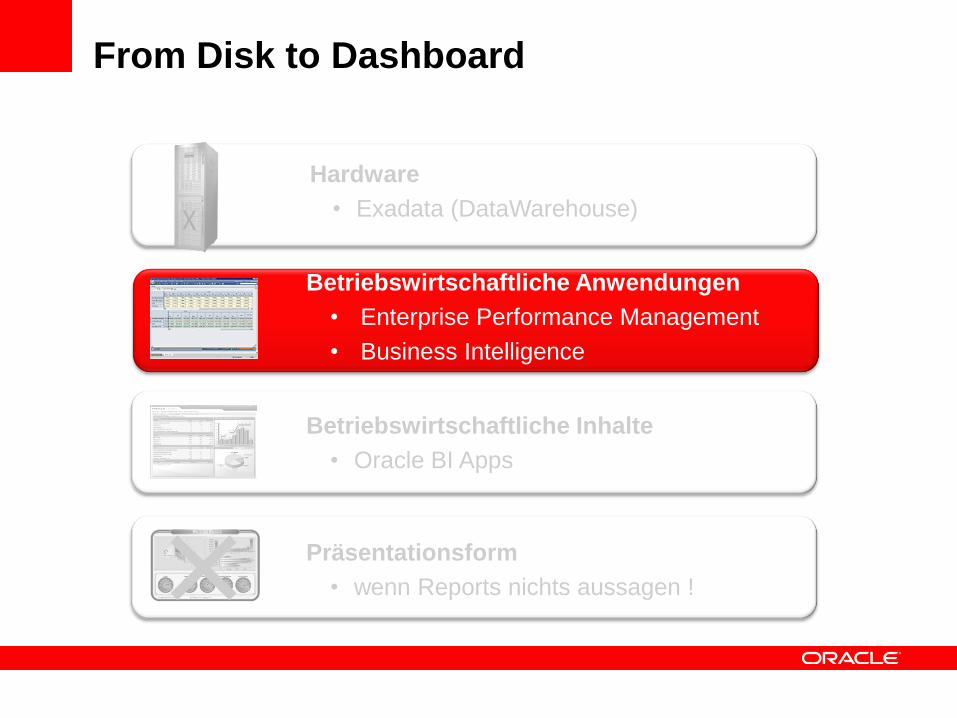
From Disk to Dashboard
Hardware
• Exadata (DataWarehouse)
Betriebswirtschaftliche Anwendungen
• Enterprise Performance Management
• Business Intelligence
Betriebswirtschaftliche Inhalte
• Oracle BI Apps
Präsentationsform
• wenn Reports nichts aussagen !
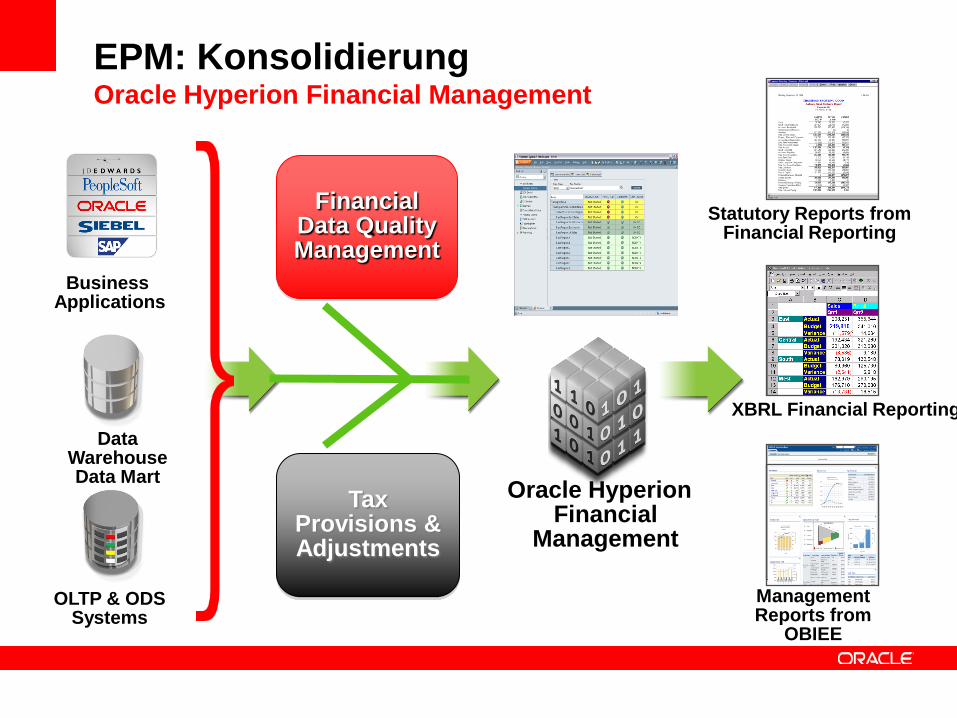
Oracle Hyperion Financial
Management
Data WarehouseData Mart
OLTP & ODS Systems
Business Applications
Statutory Reports from Financial Reporting
XBRL Financial Reporting
Management Reports from
OBIEE
Financial Data QualityManagement
Tax Provisions & Adjustments
EPM: KonsolidierungOracle Hyperion Financial Management
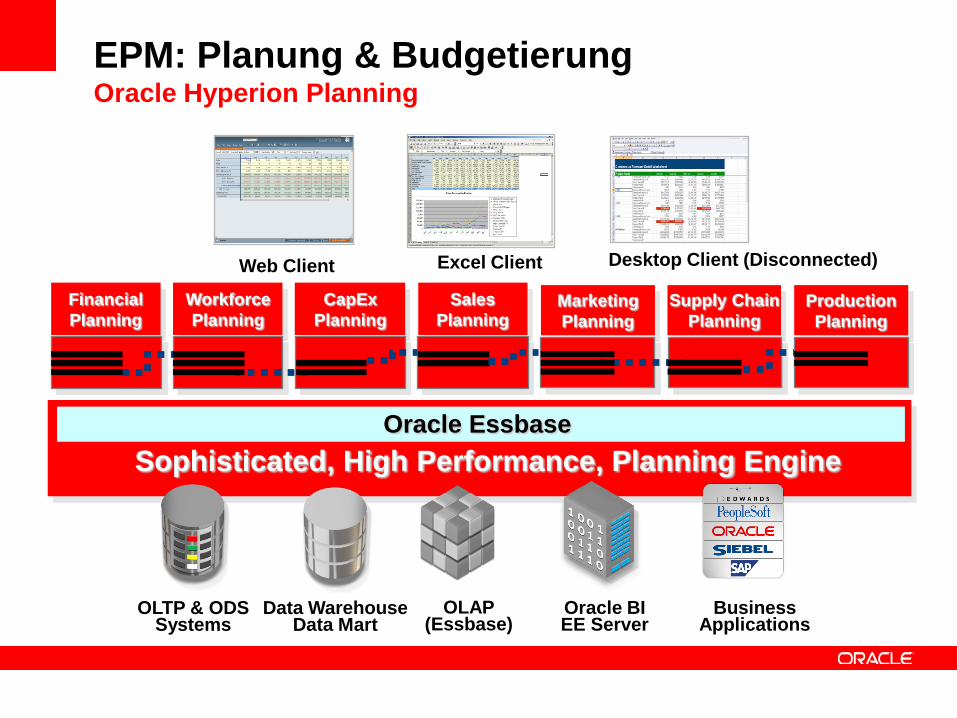
Sophisticated, High Performance, Planning Engine
Oracle Essbase
Web Client Excel Client Desktop Client (Disconnected)
Financial
Planning
Workforce
Planning
CapEx
Planning
Sales
PlanningMarketing
Planning
Supply Chain
Planning
Production
Planning
BusinessApplications
Oracle BIEE Server
Data WarehouseData Mart
OLAP(Essbase)
OLTP & ODSSystems
EPM: Planung & BudgetierungOracle Hyperion Planning
Copyright © 2009, Oracle and / or its affiliates. All rights reserved.
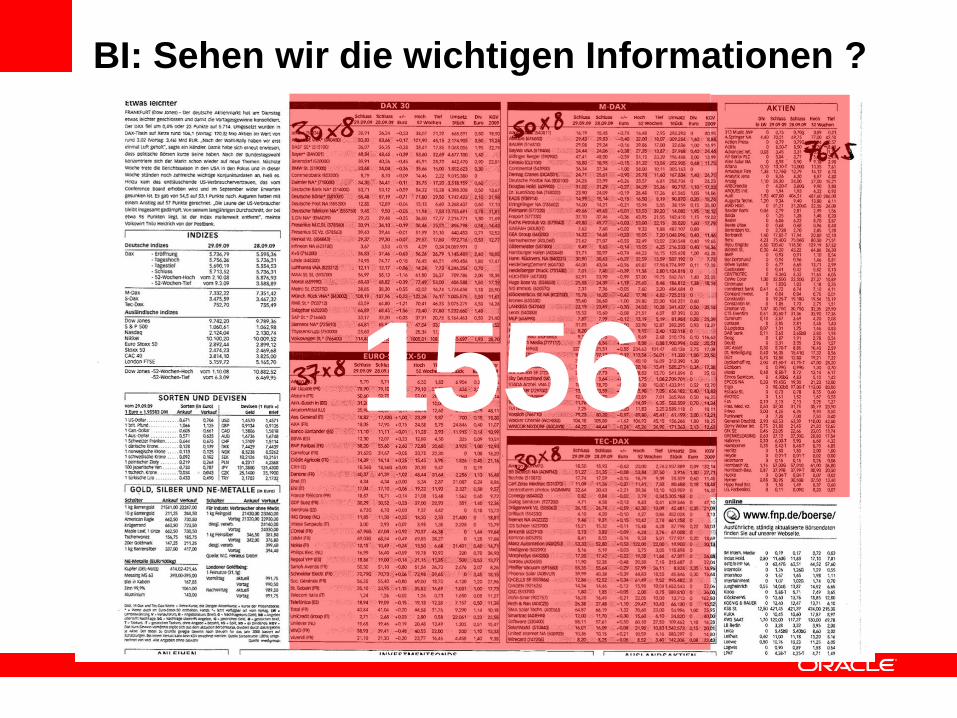
BI: Sehen wir die wichtigen Informationen ?
1556
Copyright © 2009, Oracle and / or its affiliates. All rights reserved.
BI: Unattentional BlindnessWas können wir eigentlich wahnehmen?
• Youtube-Video:
• http://www.youtube.com/watch?v=Ahg6qcgoay4
• University of Illinois
• http://viscog.beckman.illinois.edu/flashmovie/15.php
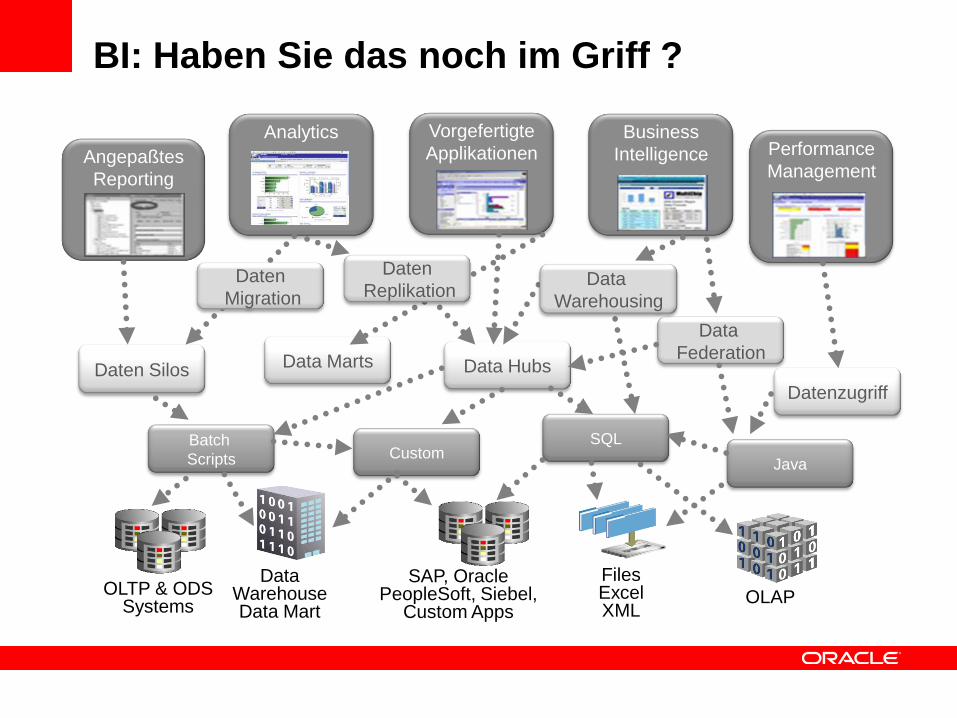
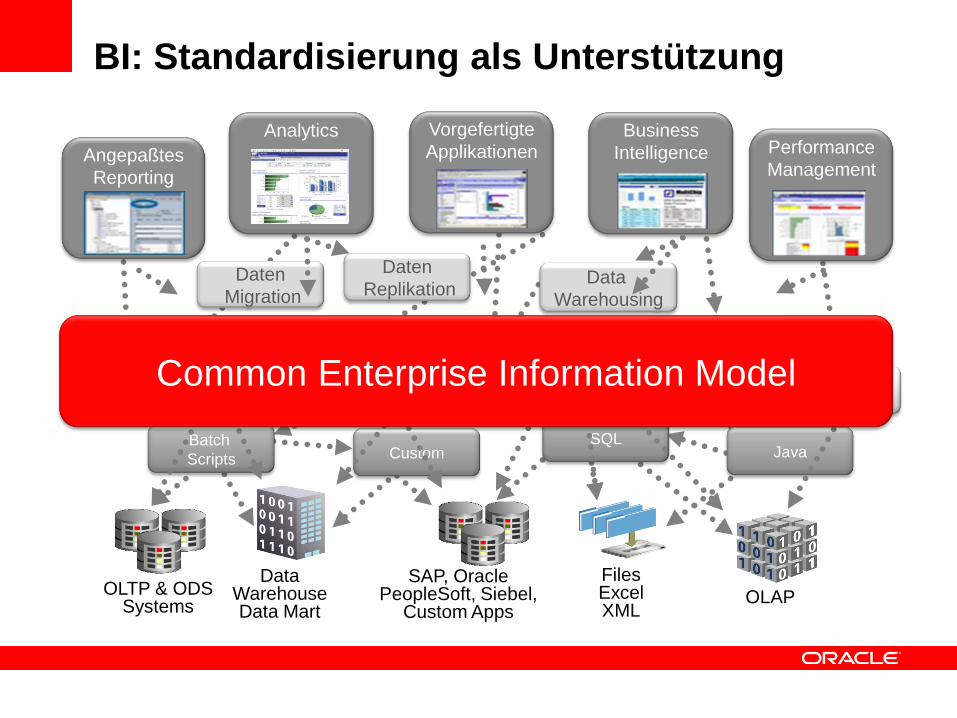
OLTP & ODSSystems
DataWarehouseData Mart
SAP, OraclePeopleSoft, Siebel,
Custom Apps
FilesExcelXML
Performance
ManagementAngepaßtes
Reporting
Vorgefertigte
ApplikationenBusiness
Intelligence
Analytics
Data
Federation
Custom
Data Marts
Datenzugriff
Daten Silos
SQLBatch
Scripts
Data Hubs
OLAP
Daten
Migration
Java
Daten
ReplikationData
Warehousing
BI: Haben Sie das noch im Griff ?
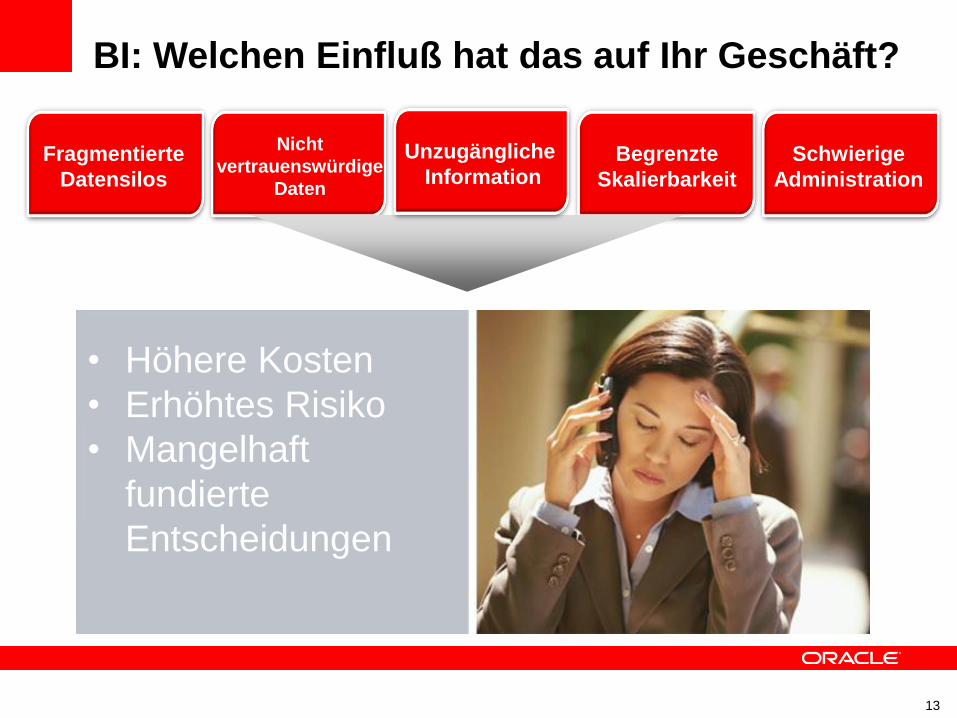
13
Schwierige
Administration
Begrenzte
Skalierbarkeit
Nicht
vertrauenswürdige
Daten
Fragmentierte
Datensilos
Fragmented
data Silos• Higher Costs
• Increased Risk
• Poor Decision Making
• Höhere Kosten
• Erhöhtes Risiko
• Mangelhaft
fundierte
Entscheidungen
BI: Welchen Einfluß hat das auf Ihr Geschäft?
Unzugängliche
Information
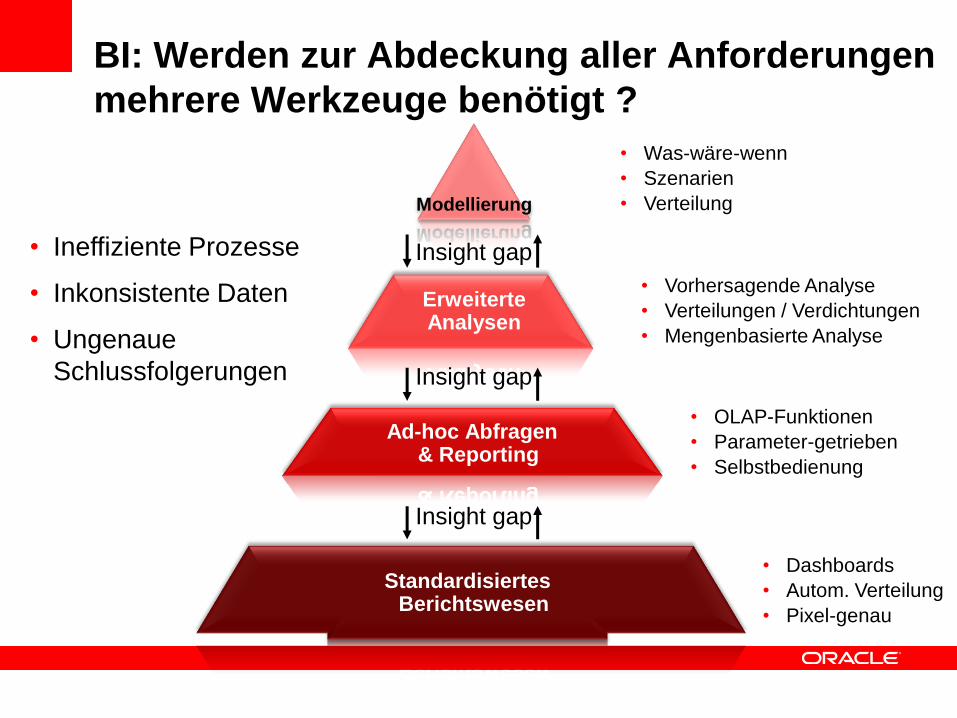
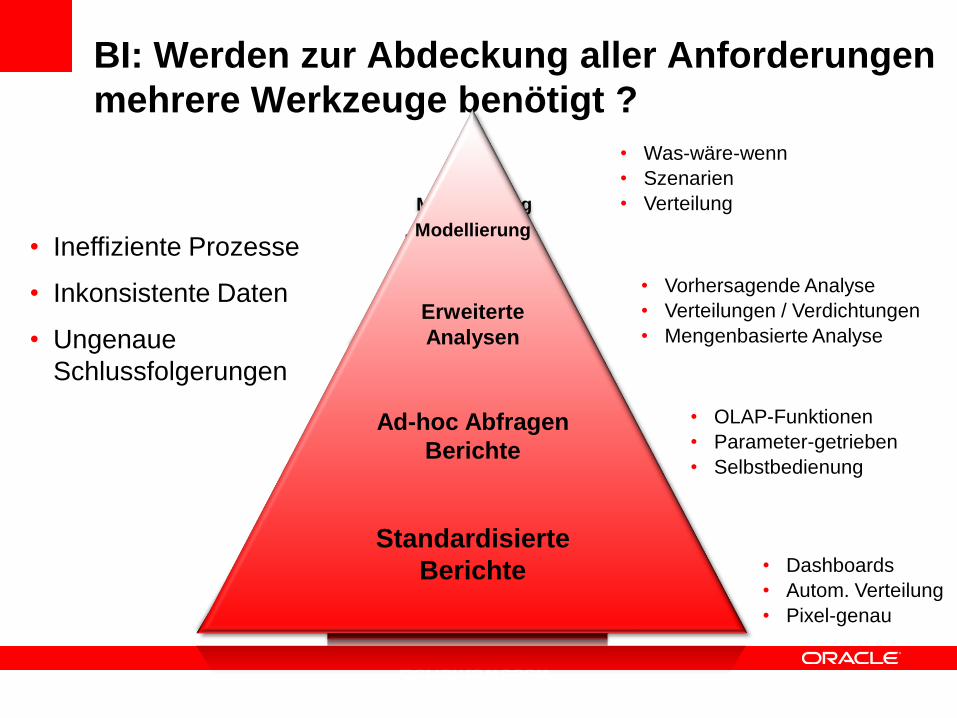
Standardisiertes Berichtswesen
ErweiterteAnalysen
Ad-hoc Abfragen & Reporting
BI: Werden zur Abdeckung aller Anforderungen
mehrere Werkzeuge benötigt ?
• Ineffiziente Prozesse
• Inkonsistente Daten
• Ungenaue
Schlussfolgerungen
Modellierung
Insight gap
Insight gap
Insight gap
• Dashboards
• Autom. Verteilung
• Pixel-genau
• Was-wäre-wenn
• Szenarien
• Verteilung
• OLAP-Funktionen
• Parameter-getrieben
• Selbstbedienung
• Vorhersagende Analyse
• Verteilungen / Verdichtungen
• Mengenbasierte Analyse
Modellierung
Erweiterte
Analysen
Ad-hoc Abfragen
Berichte
Standardisierte
Berichte
OLTP & ODSSystems
DataWarehouseData Mart
SAP, OraclePeopleSoft, Siebel,
Custom Apps
FilesExcelXML
Performance
ManagementAngepaßtes
Reporting
Vorgefertigte
ApplikationenBusiness
Intelligence
Analytics
Data
Federation
Custom
Data Marts
Datenzugriff
Daten Silos
SQLBatch
Scripts
Data Hubs
OLAP
Daten
Migration
Java
Daten
ReplikationData
Warehousing
BI: Haben Sie das noch im Griff ?
Common Enterprise Information Model
BI: Standardisierung als Unterstützung
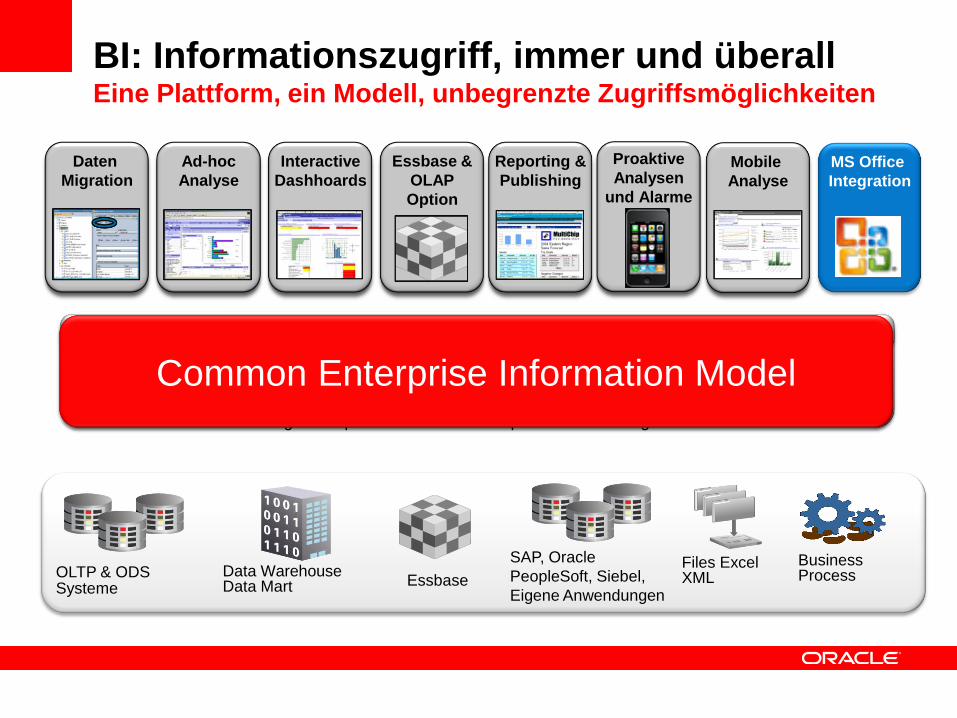
BI: Informationszugriff, immer und überallEine Plattform, ein Modell, unbegrenzte Zugriffsmöglichkeiten
Data WarehouseData Mart
SAP, Oracle
PeopleSoft, Siebel,
Eigene Anwendungen
Files ExcelXML
BusinessProcessEssbase
Daten
Migration
Ad-hoc
Analyse
Interactive
Dashhoards
Reporting &
PublishingMobile
Analyse
OLTP & ODSSysteme
Essbase &
OLAP
Option
BI Server
Common Enterprise Information Model
Integrierte Sicherheit, Benutzerverwaltung, Personalisierung
Multidimensionale Berechnungen und Integration
“Intelligent Request Generation” und optimierter Datenzugriff
MS Office
Integration
Proaktive
Analysen
und Alarme
Common Enterprise Information Model
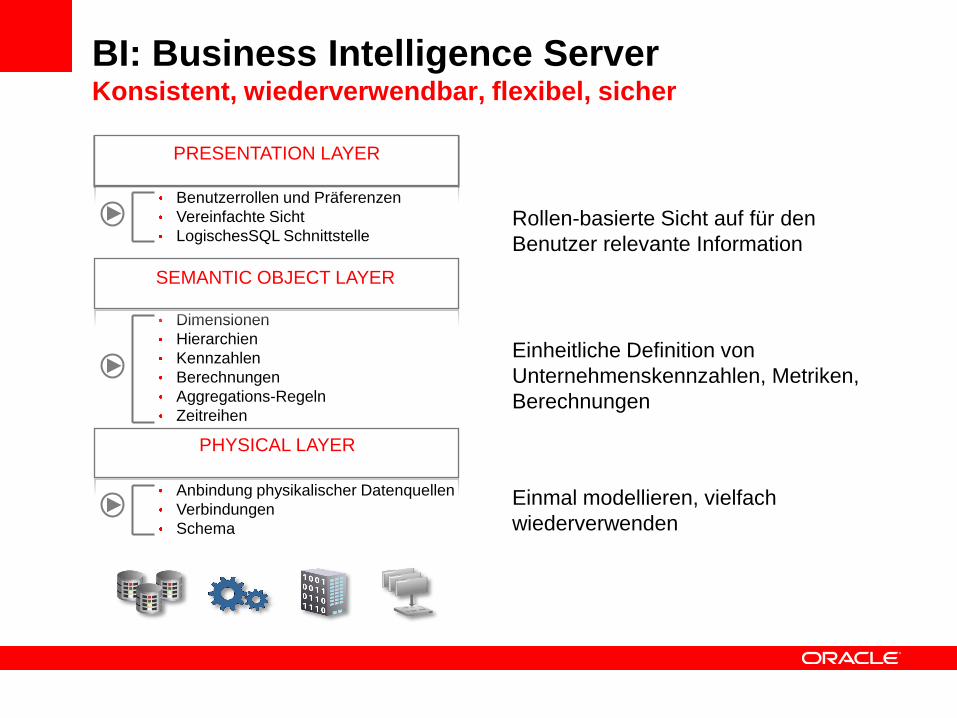
BI: Business Intelligence ServerKonsistent, wiederverwendbar, flexibel, sicher
Benutzerrollen und Präferenzen
Vereinfachte Sicht
LogischesSQL Schnittstelle
PRESENTATION LAYER
Dimensionen
Hierarchien
Kennzahlen
Berechnungen
Aggregations-Regeln
Zeitreihen
SEMANTIC OBJECT LAYER
PHYSICAL LAYER
Anbindung physikalischer Datenquellen
Verbindungen
Schema
Rollen-basierte Sicht auf für den
Benutzer relevante Information
Einheitliche Definition von
Unternehmenskennzahlen, Metriken,
Berechnungen
Einmal modellieren, vielfach
wiederverwenden
From Disk to Dashboard
Hardware
• Exadata (DataWarehouse)
Betriebswirtschaftliche Anwendungen
• Enterprise Performance Management
• Business Intelligence
Betriebswirtschaftliche Inhalte
• Oracle BI Apps
Präsentationsform
• wenn Reports nichts aussagen !
Copyright © 2009, Oracle and / or its affiliates. All rights reserved.
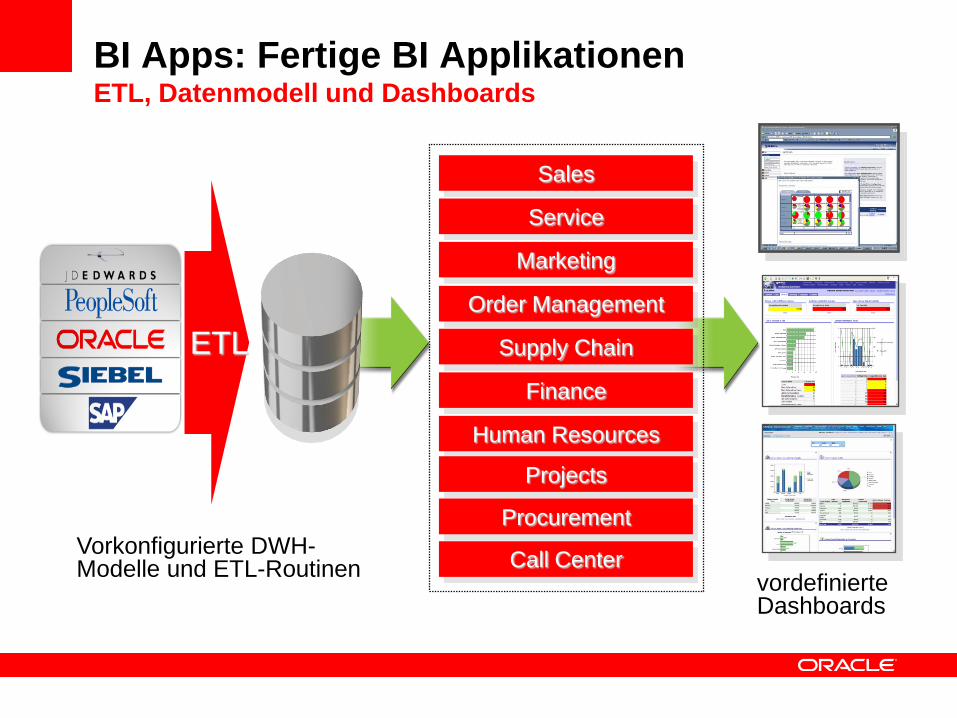
ETL
Vorkonfigurierte DWH-Modelle und ETL-Routinen
vordefinierte Dashboards
Sales
Service
Marketing
Order Management
Supply Chain
Finance
Human Resources
Projects
Procurement
Call Center
BI Apps: Fertige BI ApplikationenETL, Datenmodell und Dashboards
Copyright © 2009, Oracle and / or its affiliates. All rights reserved.
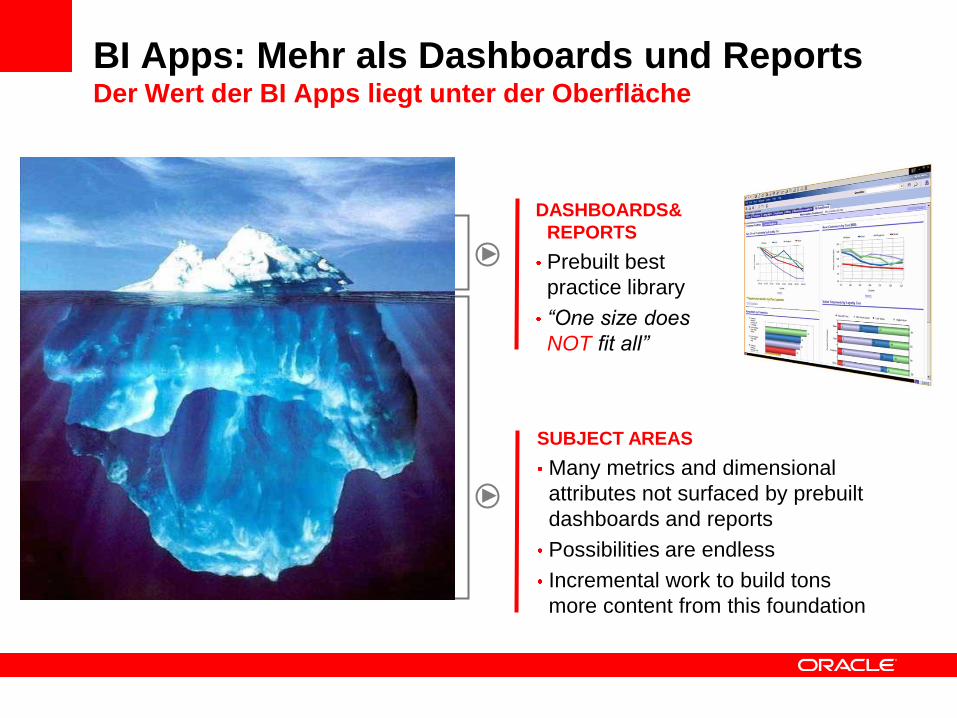
DASHBOARDS&
REPORTS
Prebuilt best
practice library
―One size does
NOT fit all‖
SUBJECT AREAS
Many metrics and dimensional
attributes not surfaced by prebuilt
dashboards and reports
Possibilities are endless
Incremental work to build tons
more content from this foundation
BI Apps: Mehr als Dashboards und ReportsDer Wert der BI Apps liegt unter der Oberfläche
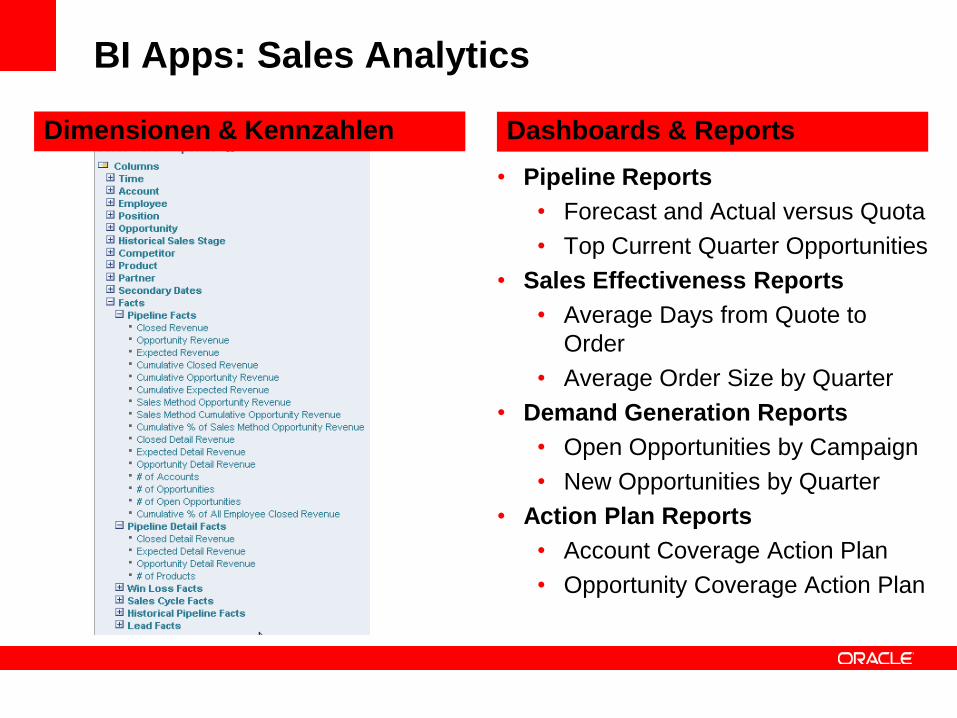
BI Apps: Sales Analytics
• Pipeline Reports
• Forecast and Actual versus Quota
• Top Current Quarter Opportunities
• Sales Effectiveness Reports
• Average Days from Quote to
Order
• Average Order Size by Quarter
• Demand Generation Reports
• Open Opportunities by Campaign
• New Opportunities by Quarter
• Action Plan Reports
• Account Coverage Action Plan
• Opportunity Coverage Action Plan
Dashboards & ReportsDimensionen & Kennzahlen
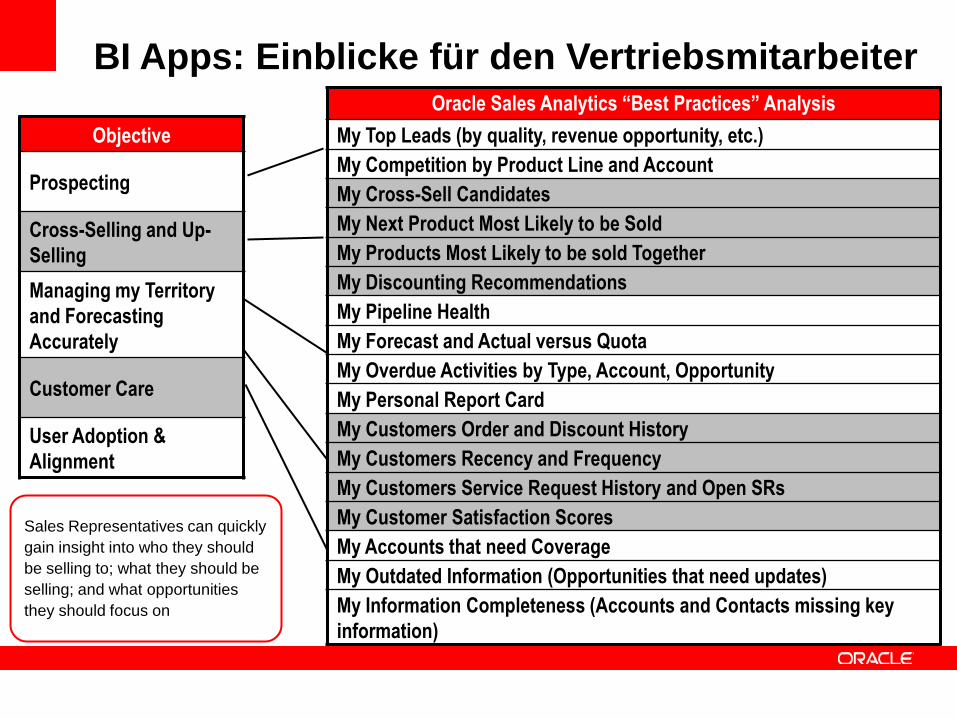
Objective
Prospecting
Cross-Selling and Up-
Selling
Managing my Territory
and Forecasting
Accurately
Customer Care
User Adoption &
Alignment
Oracle Sales Analytics “Best Practices” Analysis
My Top Leads (by quality, revenue opportunity, etc.)
My Competition by Product Line and Account
My Cross-Sell Candidates
My Next Product Most Likely to be Sold
My Products Most Likely to be sold Together
My Discounting Recommendations
My Pipeline Health
My Forecast and Actual versus Quota
My Overdue Activities by Type, Account, Opportunity
My Personal Report Card
My Customers Order and Discount History
My Customers Recency and Frequency
My Customers Service Request History and Open SRs
My Customer Satisfaction Scores
My Accounts that need Coverage
My Outdated Information (Opportunities that need updates)
My Information Completeness (Accounts and Contacts missing key
information)
Sales Representatives can quickly
gain insight into who they should
be selling to; what they should be
selling; and what opportunities
they should focus on
BI Apps: Einblicke für den Vertriebsmitarbeiter
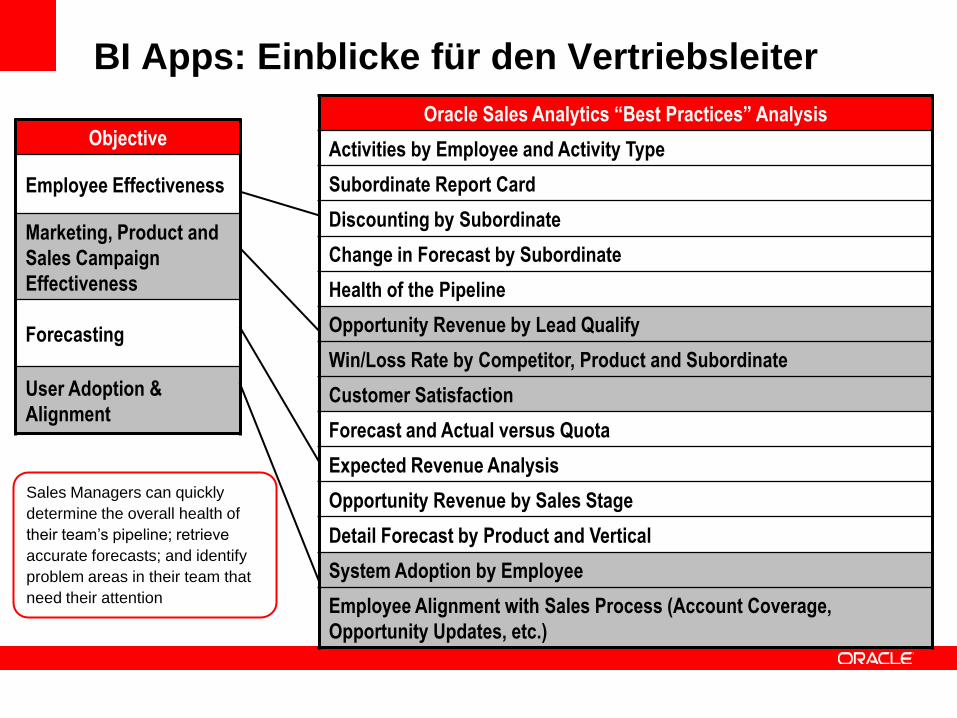
Objective
Employee Effectiveness
Marketing, Product and
Sales Campaign
Effectiveness
Forecasting
User Adoption &
Alignment
BI Apps: Einblicke für den Vertriebsleiter
Oracle Sales Analytics “Best Practices” Analysis
Activities by Employee and Activity Type
Subordinate Report Card
Discounting by Subordinate
Change in Forecast by Subordinate
Health of the Pipeline
Opportunity Revenue by Lead Qualify
Win/Loss Rate by Competitor, Product and Subordinate
Customer Satisfaction
Forecast and Actual versus Quota
Expected Revenue Analysis
Opportunity Revenue by Sales Stage
Detail Forecast by Product and Vertical
System Adoption by Employee
Employee Alignment with Sales Process (Account Coverage,
Opportunity Updates, etc.)
Sales Managers can quickly
determine the overall health of
their team’s pipeline; retrieve
accurate forecasts; and identify
problem areas in their team that
need their attention
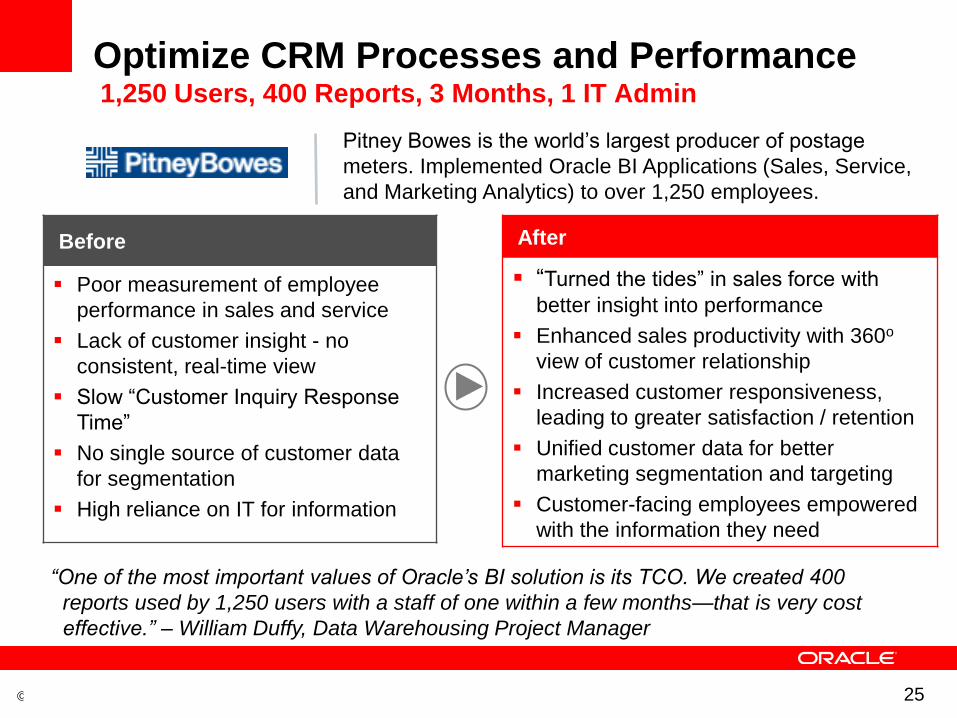
© 2008 Oracle Corporation – Proprietary and Confidential 25
Optimize CRM Processes and Performance1,250 Users, 400 Reports, 3 Months, 1 IT Admin
Before
Poor measurement of employee
performance in sales and service
Lack of customer insight - no
consistent, real-time view
Slow “Customer Inquiry Response
Time”
No single source of customer data
for segmentation
High reliance on IT for information
Pitney Bowes is the world’s largest producer of postage
meters. Implemented Oracle BI Applications (Sales, Service,
and Marketing Analytics) to over 1,250 employees.
After
“Turned the tides” in sales force with
better insight into performance
Enhanced sales productivity with 360o
view of customer relationship
Increased customer responsiveness,
leading to greater satisfaction / retention
Unified customer data for better
marketing segmentation and targeting
Customer-facing employees empowered
with the information they need
―One of the most important values of Oracle’s BI solution is its TCO. We created 400
reports used by 1,250 users with a staff of one within a few months—that is very cost
effective.‖ – William Duffy, Data Warehousing Project Manager
Copyright © 2009, Oracle and / or its affiliates. All rights reserved.
From Disk to Dashboard
Hardware
• Exadata (DataWarehouse)
Betriebswirtschaftliche Anwendungen
• Enterprise Performance Management
• Business Intelligence
Betriebswirtschaftliche Inhalte
• Oracle BI Apps
Präsentationsform
• wenn Reports nichts aussagen !
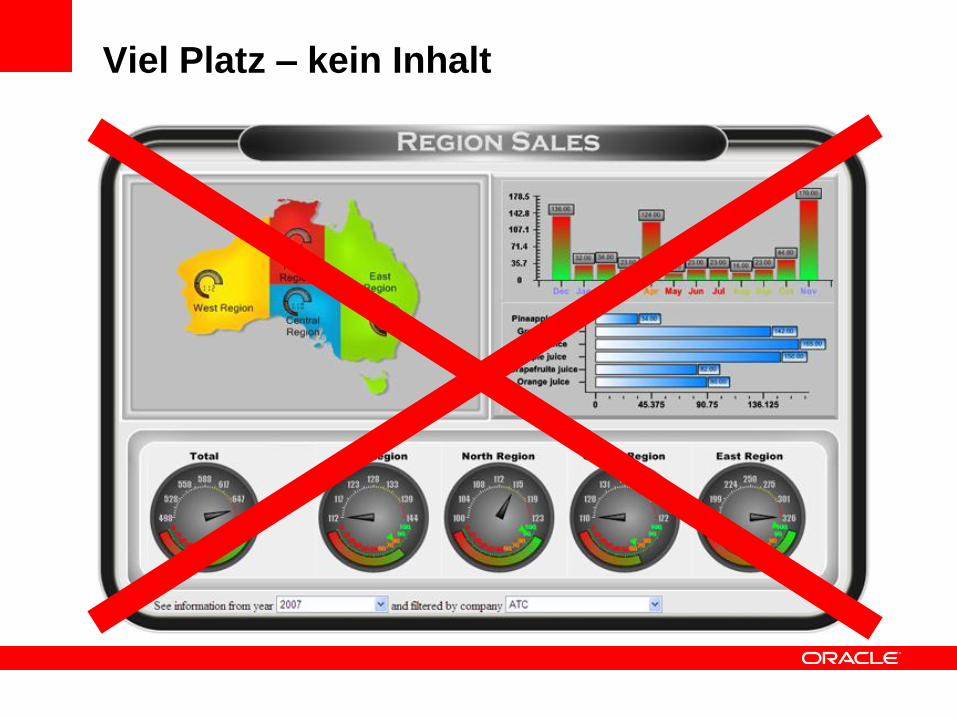
Viel Platz – kein Inhalt
Copyright © 2009, Oracle and / or its affiliates. All rights reserved.
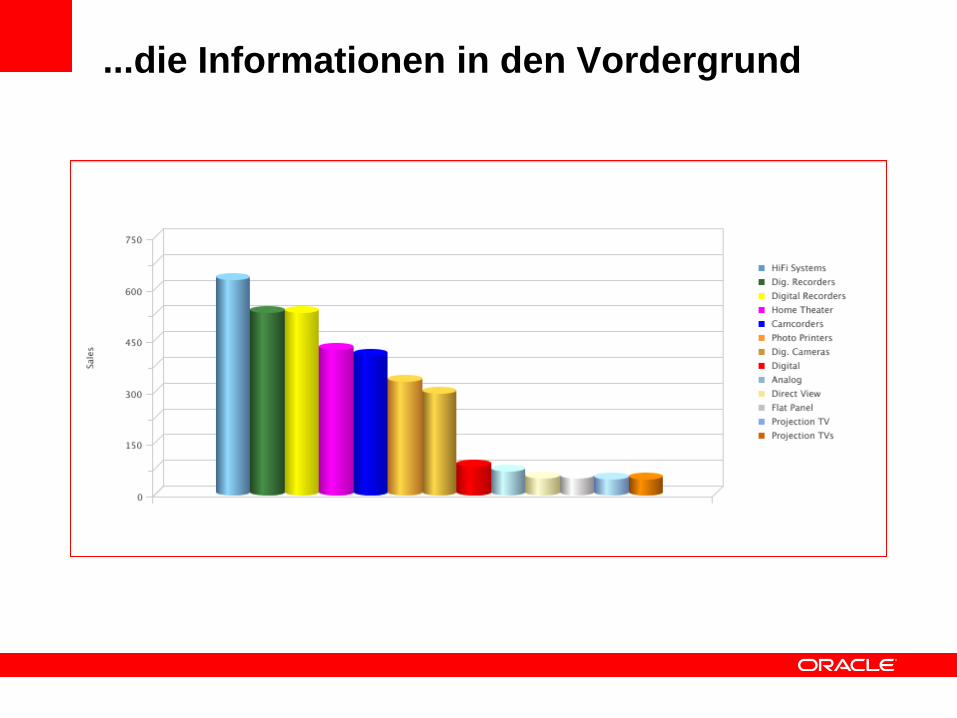
...die Informationen in den Vordergrund
Copyright © 2009, Oracle and / or its affiliates. All rights reserved.
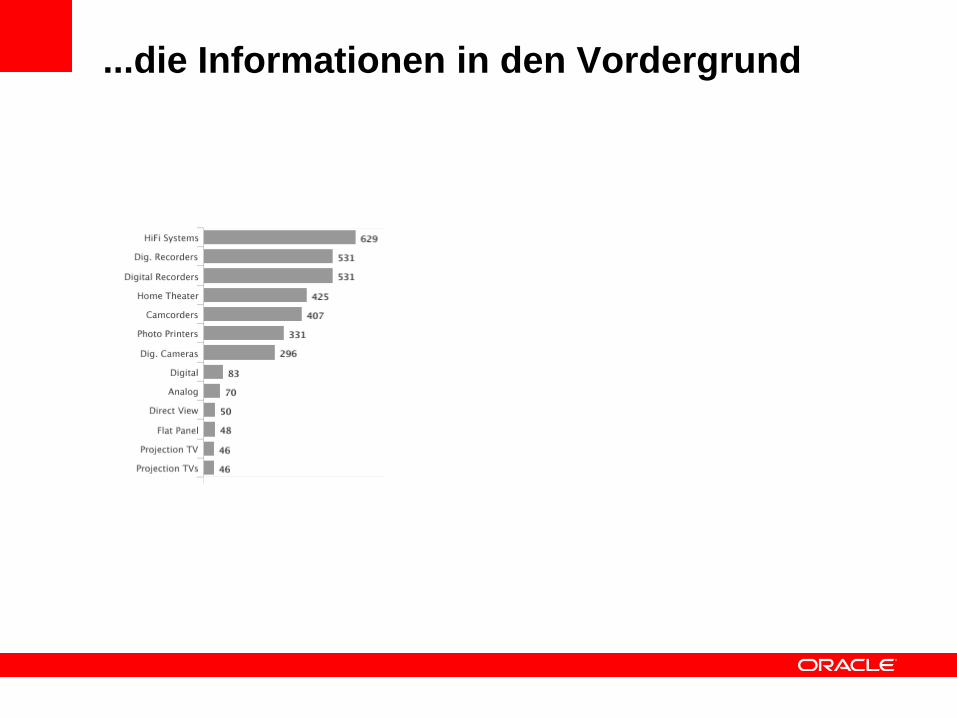
...die Informationen in den Vordergrund
Copyright © 2009, Oracle and / or its affiliates. All rights reserved.
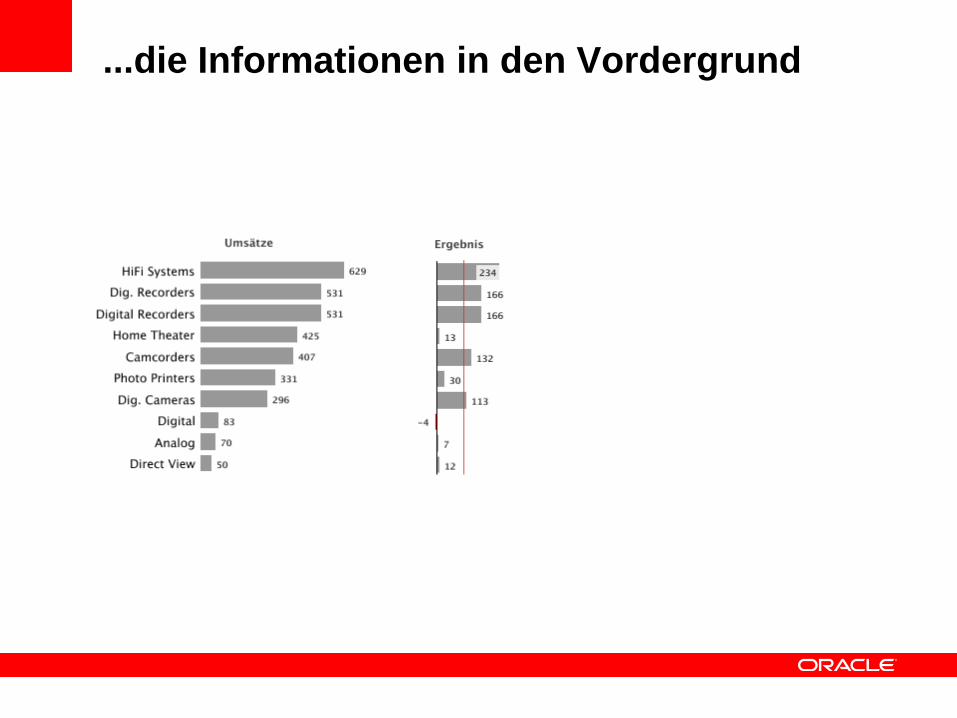
...die Informationen in den Vordergrund
Copyright © 2009, Oracle and / or its affiliates. All rights reserved.
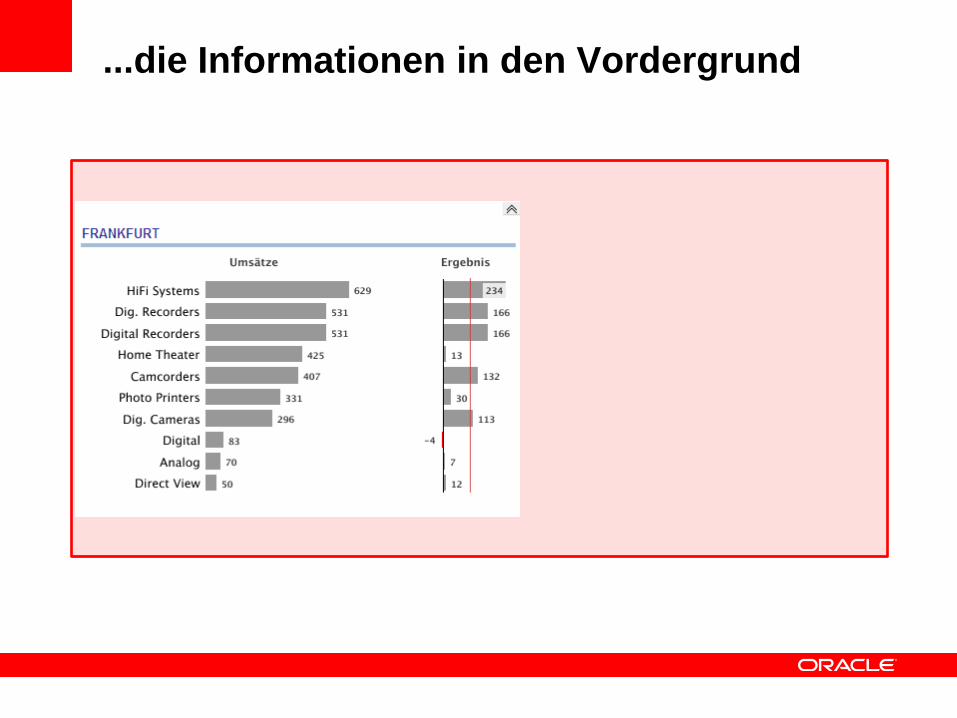
...die Informationen in den Vordergrund
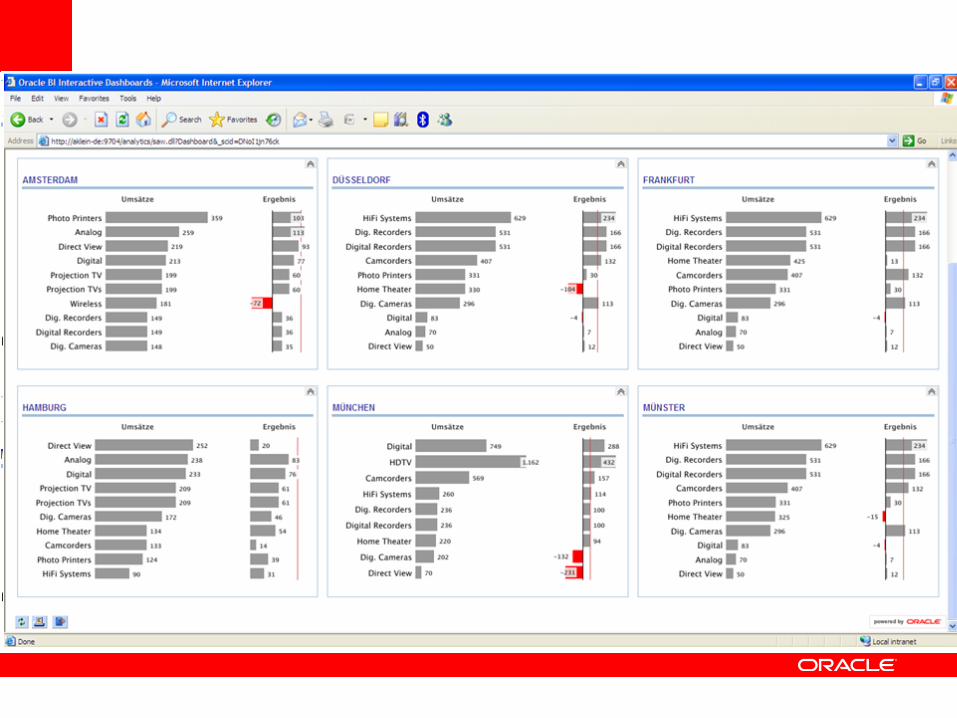
Copyright © 2009, Oracle and / or its affiliates. All rights reserved.

Copyright © 2009, Oracle and / or its affiliates. All rights reserved.

Copyright © 2009, Oracle and / or its affiliates. All rights reserved.
Copyright © 2009, Oracle and / or its affiliates. All rights reserved. 35